



Abstract
The purpose of this paper is to investigate the effect of the urban densification policies made after the Islamic Revolution on the urban spatial structure of Tehran as the most important metropolis in Iran. The Hot Spot approach based on the Getis Ord Local G statistical test and Arc GIS 10.2 software was employed in this study. The advantage of the Geo-statistic technique used in this study is that this model does not require the exact location of the city centre to map and determine its spatial structure. The results show that the spatial structure of Tehran was affected by the non-spatial densification policies for 30 years (until Tehran’s Master Plan in 2007). Furthermore, these policies were greatly dependent on the financial benefits from the sale of the FAR permission and fines related to the ignorance of the lawful regulations. There is a spatial imbalance between the population and activity distribution patterns in the structure of Tehran. However, the negative spatial consequences of the densification policies are declining capacity of the city centre and the inner wards in retaining the population, and growing population density in the northern outer wards of Tehran.
Introduction
As the living creatures have specific structural properties to support and operationalize their vital activities, the cities enjoy a special structure, which can deeply affect their long-term nature and the quality of life (Newman and Kenworthy, 2015). Urban spatial structure (USS) as a whole configuration shows how the population and activities distribute throughout the urban area and are connected together. Since the USS underpins the land use and transportation patterns, it can affect the environment quality (Adhvaryu, 2011; Jenks et al., 1996; Newman, 2006; Newman and Kenworthy, 1996), economic efficiency and life quality in the urban areas (Bertaud, 2003; Schmidt-Thom et al., 2013; Zellner et al., 2010).
The USS shows the pattern of the distance from and access to the functional districts of the city which is likely an effective factor in creating the need to travel (to fill the gap between origin and destination) (Cervero and Kochelman, 1997; Ewing and Cervero, 2010). The proximity of the workplace and the house affects the total distance travelled and the time spent on the daily trips. (Kim and Hewings 2013; Wang and Chai 2009; Zhao et al., 2010). It also increases the possibility of using mass transportation and on foot (Silva et al., 2014). The travelled distance and the time spent to go to work are usually less in multifunctional areas (Cervero and Duncan, 2006; Gainza, 2013). In contrast, the dispersed spatial structures cause more long-lasting travels between the residential places, the workplaces and the services, which would eventually affect the number, length and mode of travel (Horner, 2002; Yingling and Xinyu, 2012). Dispersed spatial structure reduces the efficiency of the public transportation and challenges its development to all parts of the city. In such structures, the use of the private cars is preferred in travels (Newman and Kenworthy, 1999; Newman and Kenworthy, 1989a). Accordingly, the fossil fuels consumption per capita increases sharply in the car-dependent cities (Newman and Kenworthy, 1989b), which can jeopardize the environmental sustainability of the cities (Newman and Kenworthy, 2000). On the other hand, such a sprawl structure requires a more extensive use of the limited land resources which will lead to the high-cost development of the urban infrastructures and services (Bertaud, 2003; Carruthers and Ulfarsson, 2003; Filion et al., 2006).
Densification policy is a complex and multidimensional issue that can have various consequences. From the structural perspective, the USS is influenced by the density pattern of population and activity in the urban space. Therefore, a policy influencing the urban densification process will directly affect its spatial structure. Urban densification policies must consider the integration and relation of the urban density with the other requirements such as the spatial configuration, landscape, services, transportation, developmental facilities, future development, social justice, environment quality, etc. Otherwise, these policies may cause great externalities (Kyttä et al., 2013; Schmidt-Thom et al., 2013; Zellner et al., 2010).
Little research has focused on the issue of urban densification policies in the Middle East. Research in these countries along with deep differences in the political context and socio-economic situation can shed light on another dimension of the results obtained from the research conducted in the developed countries. Urban densification policies in Tehran and its spatial changes from different dimensions have special features among which the spatial dimensions have been of less interest to the urban policy makers and researchers.
Densification policies in Tehran (which is evident in the other cities of Iran as well) are mainly affected by the financial benefits of FAR; procedures that have been continuing for nearly 40 years since the Islamic Revolution and even after the approval of Tehran Master Plan in 2007. More FAR permissions result in more revenue for the municipality. In addition, densification policies in Tehran at least until the first Master Plan (2007) after the Revolution were made without adopting a long-term plan and without taking into account the spatial dimensions. This is an issue that has been observed in the other developing countries as well (Richardson et al., 2000). Furthermore, the developers' widespread violations of the lawful FAR should be added to the problems that the municipality tries to manage through fining. The spatial changes after the Islamic Revolution, which are mostly influenced by the densification policies, especially the development of the periphery wards and the stagnation of the central wards (Bertaud, 2003; Fanni, 2006; Madanipour, 1998, 2006), have given a special spatial structure to Tehran. Simultaneous with the spatial changes, Tehran urban management has faced numerous environmental challenges, particularly the air pollution and traffic jams (Atash, 2007; Bertaud, 2003; Ghanghermeh et al., 2013; Madanipour, 2006), which are majorly related to its densification policies (Atash, 2007; Bertaud, 2003; Ghanghermeh et al., 2013).
The aim of the present study is to investigate the spatial changes of Tehran under the influence of the Post-Revolution urban densification policies (with the emphasis on the FAR).
This study consists of several interlocked sections. In the introduction section, a background was provided to show the importance of the spatial structure and its key component density in some aspects. To clarify the issue, in this section, a brief overview of the features of the densification policies in Tehran is provided. In the second section, Tehran urban densification policy after the Revolution is reviewed to shed light on its essence and history. Then, in the third section, the effects of the densification policy on the spatial structure of Tehran are analysed. The fourth section will provide practical lessons for the urban decision-makers. Finally, the results will be summarized and synthesized in the conclusion section.
In fact, this research aims to show how the dominance of a monetary and non-spatial approach in densification policies can lead to unsustainable patterns in the USSs.
Methodology
This study employs an analytical approach to answer the following main question: How have the Post-Revolution densification policies affected Tehran spatial structure?
To integrate the sources of data, the GIS layers (the SHP format) of the census blocks (Note: A census block is the smallest geographic unit that is used by the Iran’s Statistical Center for collecting data from all buildings. A census block includes adjacent parcels (building or land) that are surrounded by passages.) published by the statistical centre of Iran (1996, 2006 and 2011) have been used as the basis of the geo-statistical analysis. We used the number of population and activity in the census block scale as the main variables. Activity in this paper includes the number of job or employment in a given census block. In modelling the spatial structure of Tehran and its changes, the following maps and charts were produced to show how the population and activities are distributed throughout the city and are related together: The spatial pattern of population (Table 2 and Figures 5, 6 and 11), the spatial pattern of population density (Figures 7–12), the spatial pattern of activity (job) (Figure 17), the spatial pattern of activity (job) density (except for the manufacturing industries) (Figures 18 and 19) and the spatial pattern of urban travels (Figure 16).
Administrative municipality region (AMR) of Tehran. Main wards of Tehran (the map is drawn and used in this research). Physical expansion of the city region of Tehran from 1891 to 1996. Increasing trend of selling extra FAR in the municipality of Tehran (2002–2012) (Billion IRI.Rial). (Frotan, 2012). Changes in population number and density of Tehran (1996–2011). Source: Statistical Center of Iran (1996, 2011). Spatial structure of Tehran based on the population (1996–2011), using Getis-Ord Local G Statistic. Spatial structure of activity in Tehran (2006). Population of main wards of Tehran (1996).


The Hot Spot approach based on the Getis-Ord Local G statistical test (Getis and Ord, 1992) in the Arc GIS 10.2 software was employed (Formula (1)). In first step, the census block data were converted into the raster model with the cell size of 10 × 10 meters. The hot spots are a combination of cells with the highest population density or activities that form the core of the population and activities. Compared to the global Moran's I and local Moran statistics model, this model has the advantage of distinguishing the hot density clusters (high density) and the cold density clusters (low density), while Moran's I statistics model analyses the similar clusters in terms of their quantitative or qualitative values (Griffith and Wong, 2007).

It must be noted that Tehran consists of 22 administrative municipality regions (AMRs), but the boundaries of these AMRs are not compatible with geographical directions, so they do not provide a proper ground to answer spatial questions focusing on the main directions and the main urban areas such as the centre, inner and outer areas (Figure 1). In the above-mentioned system, there are AMRs extending from the city centre to the outer areas (such as AMRs 2, 5, 6, 13, 14, 15, 16 and 19).
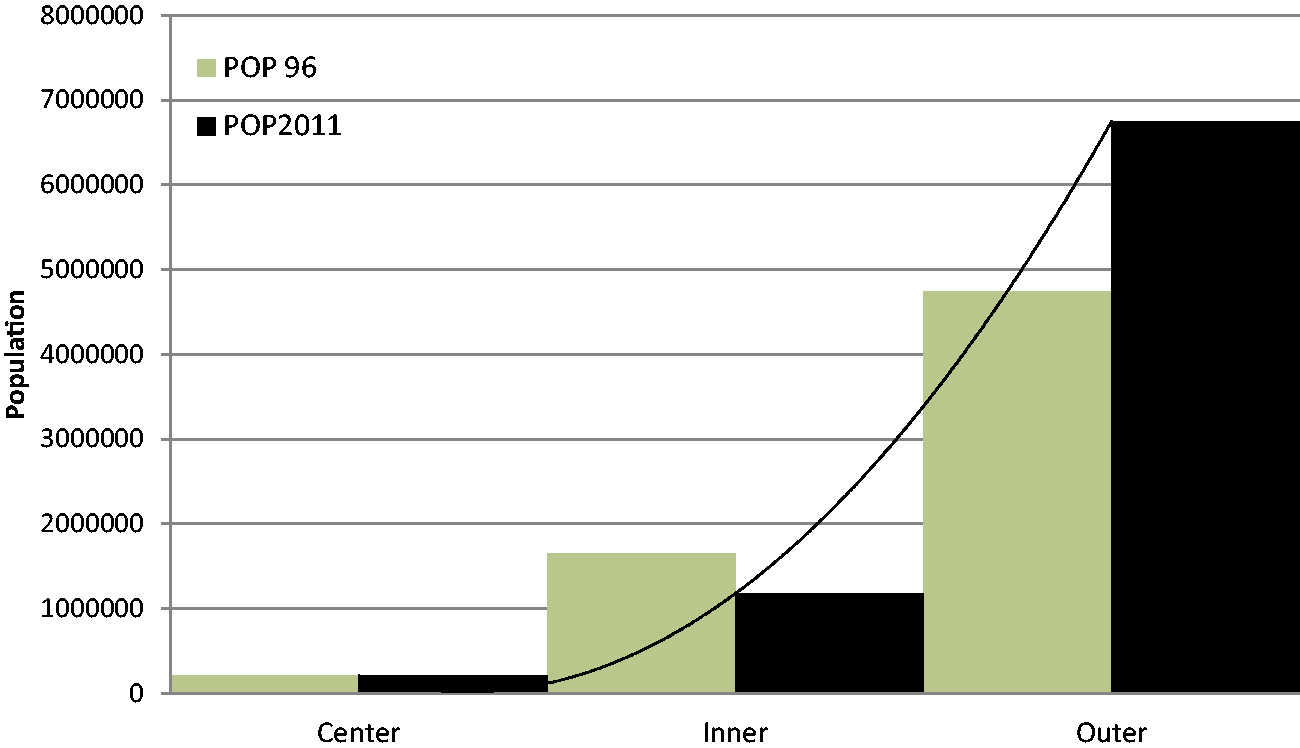
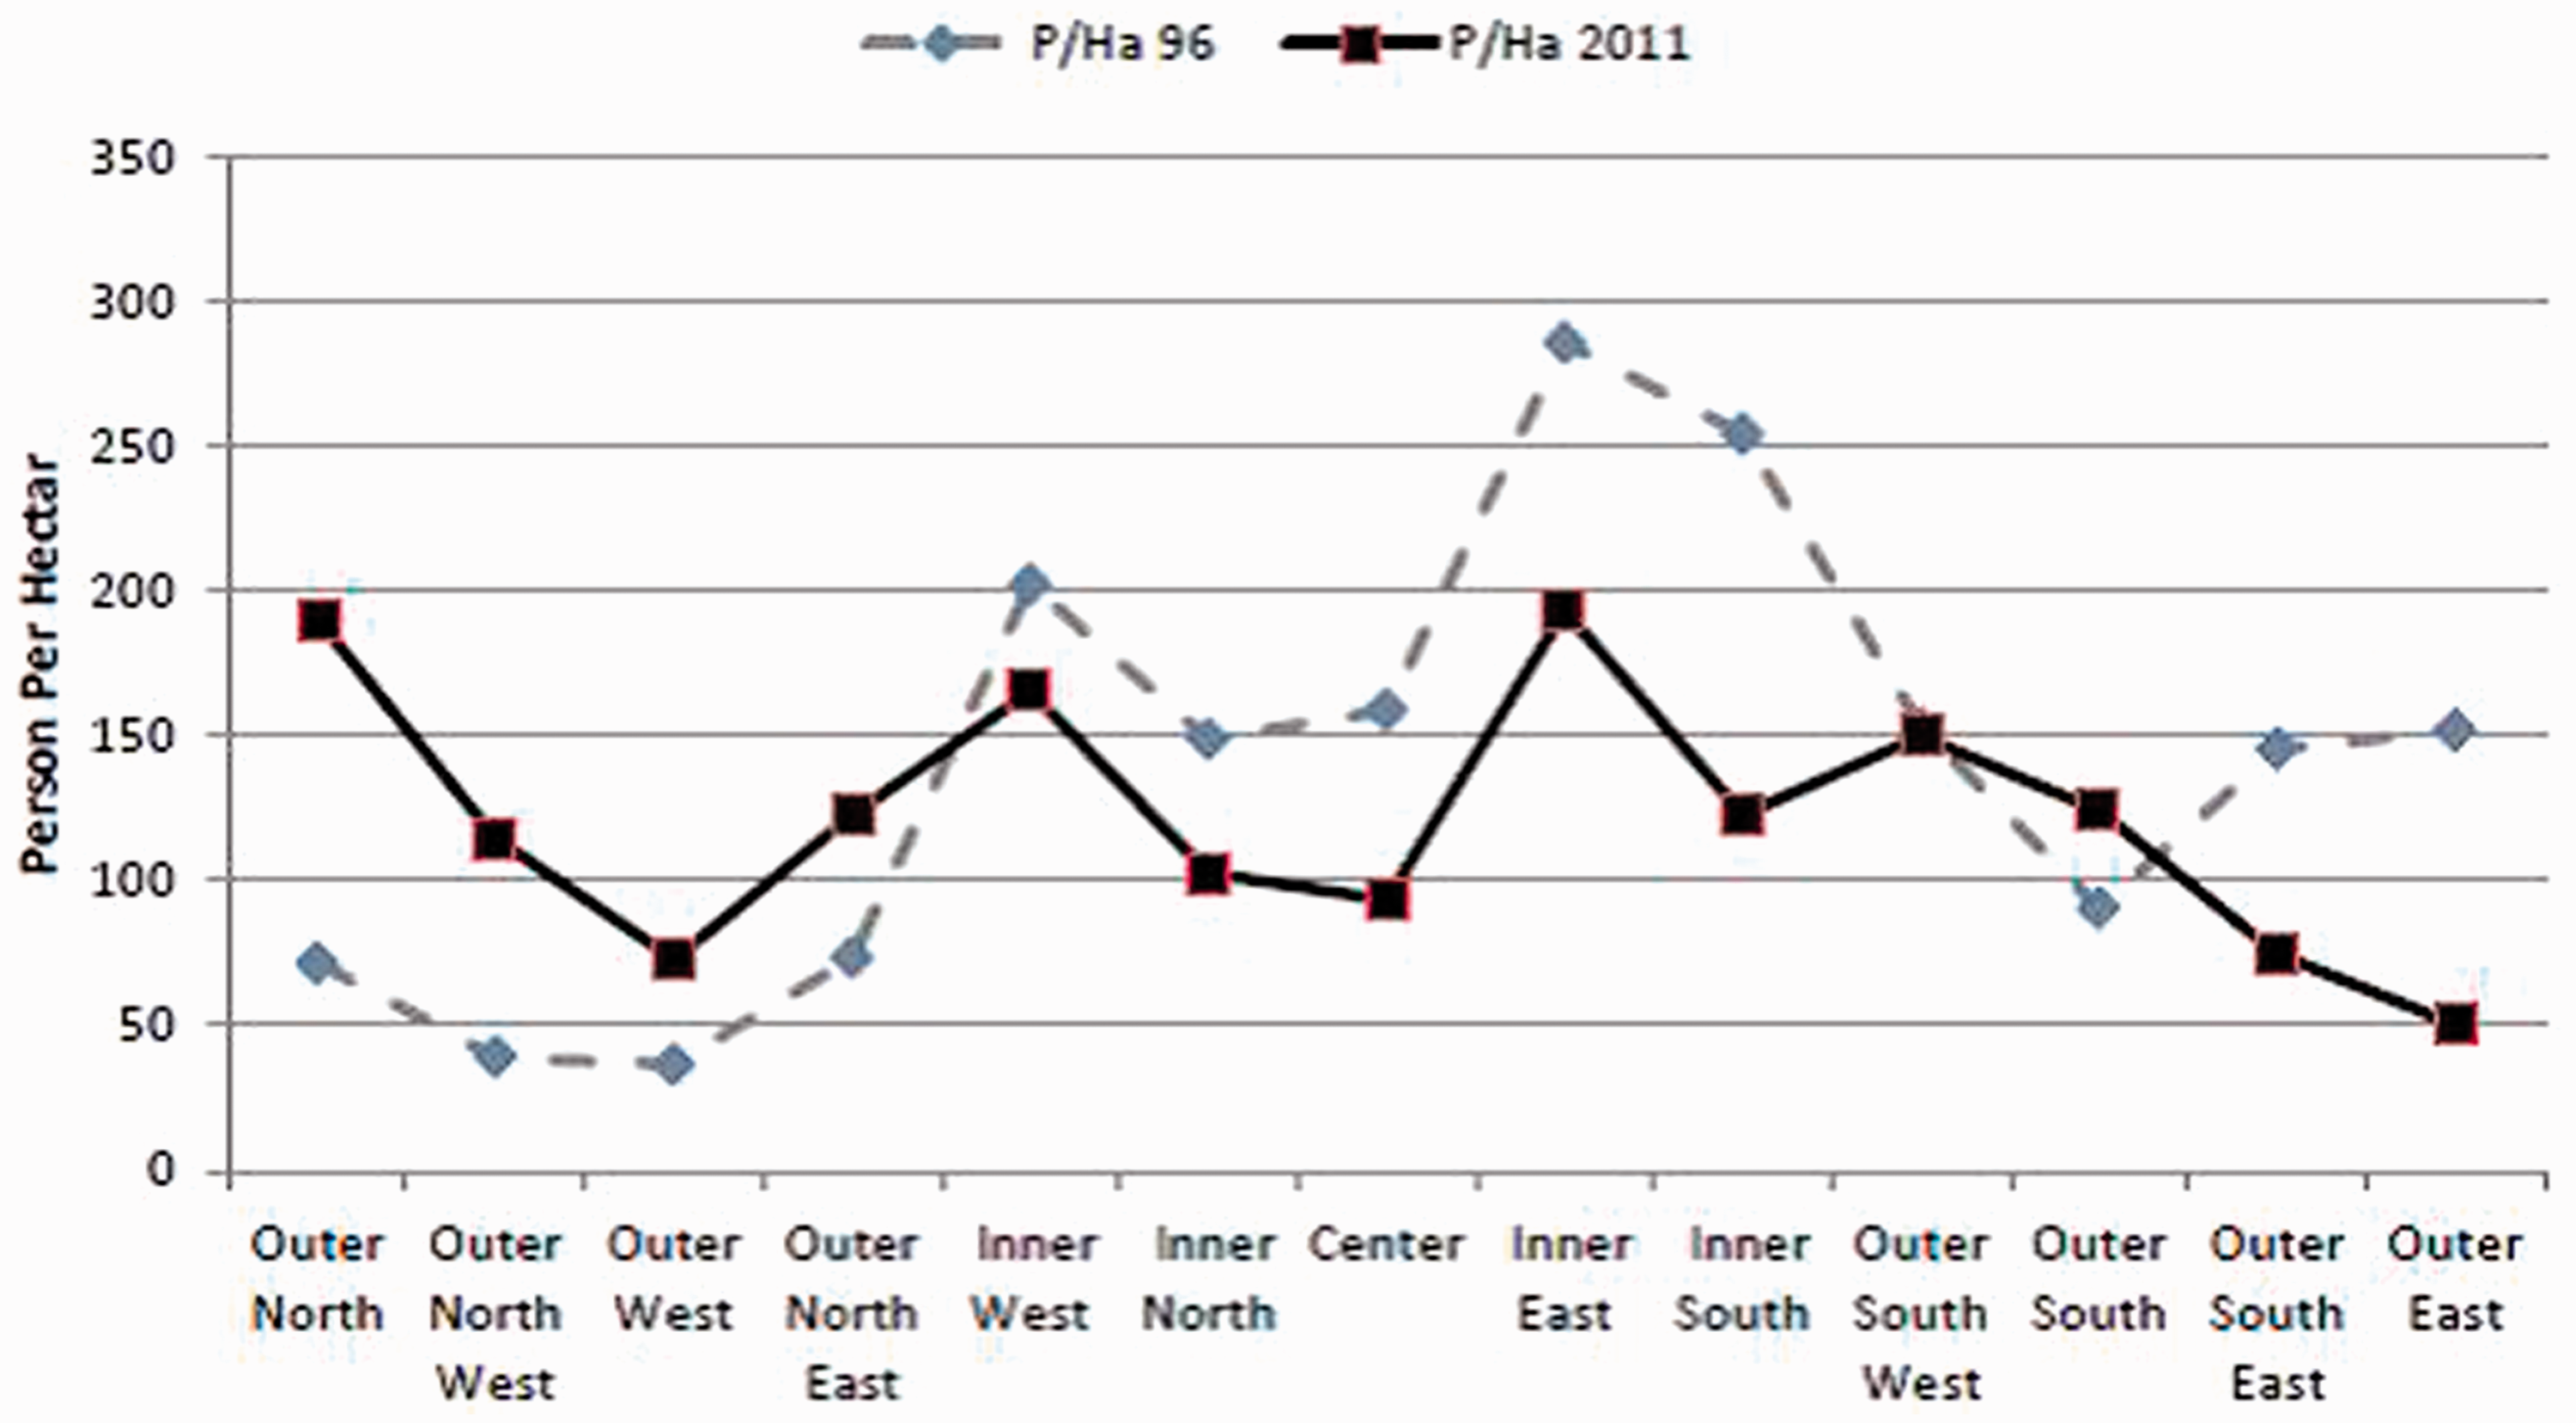
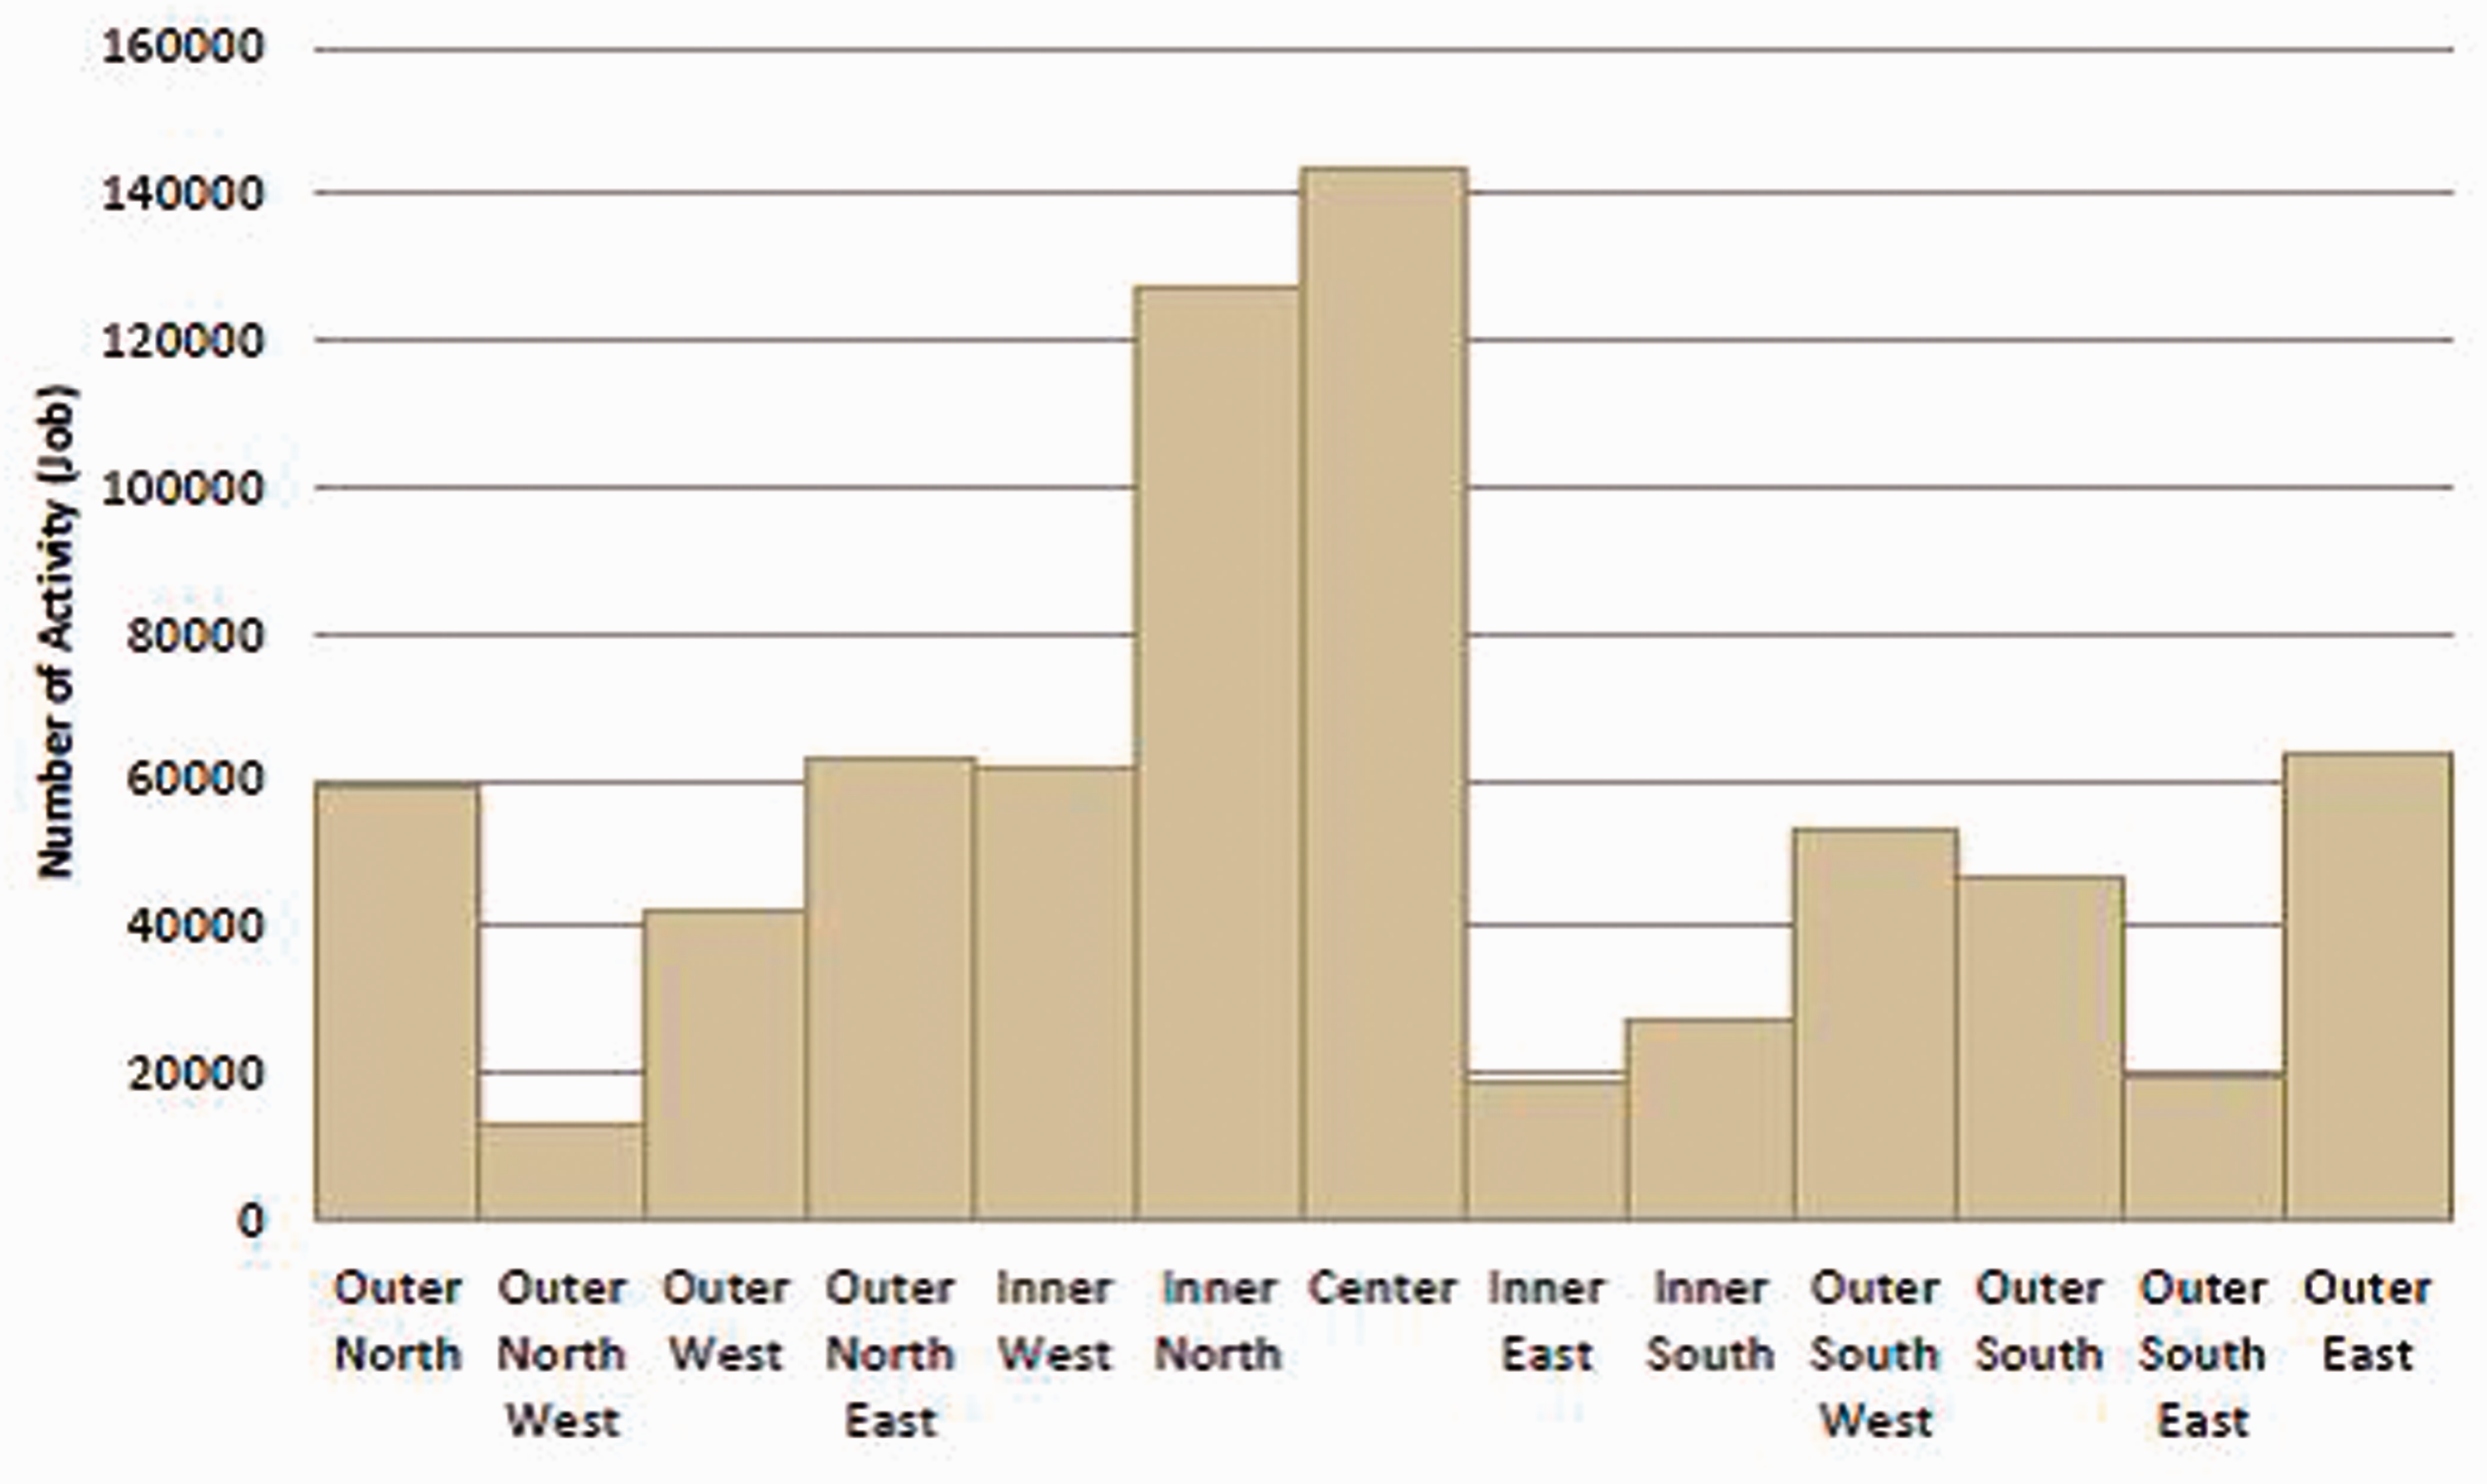
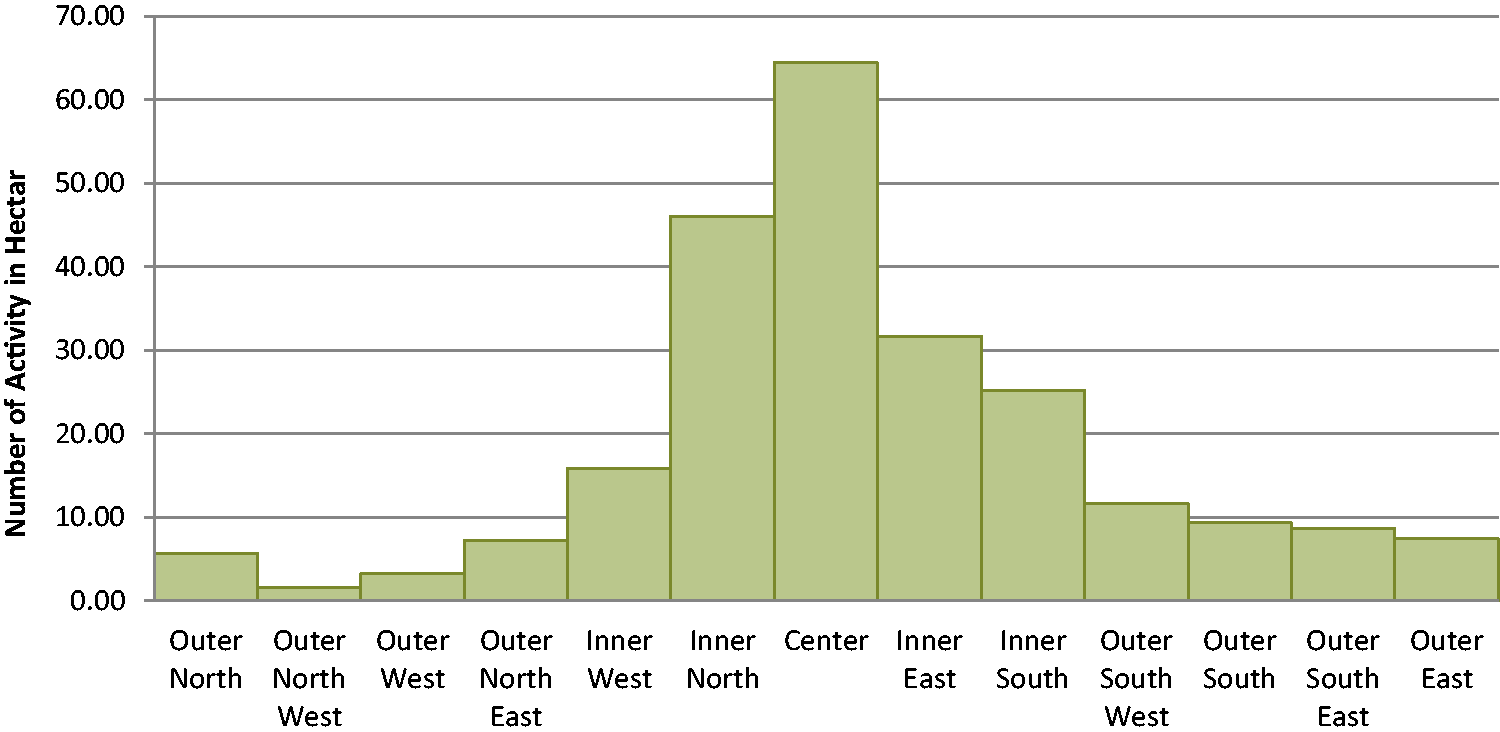
Population of main wards of Tehran (2011). Spatial pattern of population density in Tehran 1996. Spatial pattern of population density in Tehran, 2011. Spatial pattern of population density of more than 100 person per hectar in Tehran, 2011. Spatial pattern of population density of more than 150 P/Ha in Tehran, 2011. Population of the center, inner and outer regions of Tehran in 1996 and 2011. The Population change rate of main wards of Tehran (1996 to 2011) (%). Population density of main wards of Tehran in 1996 and 2011. Spatial distribution of revenue of FAR in AMRs of Tehran (2001-2012). (Organization of Information and Communication Technology of Municipality of Tehran (2012)). Spatial distribution of violating the FAR rules in AMRs of Tehran (2001-2012).(Organization of Information and Communication Technology of Municipality of Tehran (2012)). Spatial distribution of absorbed and produced trips between AMRs of Tehran (2012). Number of activity (job) in main wards of Tehran (2006). Density of activity (job) in main wards of Tehran (2006). Spatial pattern of activity (job) density in Tehran, 2006 (Activity in Ha).





In this study, the whole Tehran city is divided into 13 geographical wards. These wards match to the census blocks’ boundaries and summarize their related information. In other words, a ward is formed by all included census blocks’ boundaries and information (Figure 2). A few essential points must be mentioned regarding the boundaries of the above-mentioned geographical wards. Tehran spatial changes match to its topography and north–south slope. Since the upper classes of society moved from the city centre to the northern areas of Tehran that has a high altitude and good climate, the migrants and workers inhabited in the core area and the southern areas of Tehran (Madanipour, 2006). In fact, it can be asserted that the natural north–south slope of Tehran is largely in compliance to its economic and social status.
To divide Tehran into new wards, we considered that this system should reflect on both the main areas (the centre, inner and outer areas) and the main geographical directions. It should also be coincided to physical development process of the city and the main functional areas like CBD. By reviewing the last development plans of Tehran 1990 and 2007 (The Ministry of Housing and Urban Planning of Iran, 1991, 2007) and the other reports (Tehran’s Metropolitan Plan, 1996) which depicted the process of physical development of Tehran since 1920 (Figure 3), the historic and functional centre area and its surrounding inner neighbourhoods which were formed from 1940 to 1980 were recognised.
It is also considered some residential complex projects or neighbourhoods, which were built at that period to settle the growing population of Tehran in the outer areas as the urban decentralization strategy. These residential complex projects such as Ekbatan, Apadana, Dehkade y Olampic, Shahrake Gharb, Narmak, Niroye Havaei, are located beyond the inner area and the highways that are referred on this paper as the border of the outer areas. Furthermore, to validate the boundary of these 13 wards, 10 urban planners and municipality experts, who have research experience about development process of Tehran, were interviewed.
In this research, the centre ward is surrounded by the streets of Enghelab, Karegar, Shoosh and 17 Shahrivar. Main functions of the city are located in this area, such as, Bazaar, parliament, some ministries, main courts, university, embassies and main commercial corridors.
The inner area in distance of 3 to 5 kilometres from the centre area, consisting four wards limited by highways: Resalat and Hakim from the north, Saidi from the west, Qasvin and Besat from the south, Emam Ali and Sabalan from the east. The outer wards are located beyond these highways.
Densification policies with an emphasis on the FAR after the Islamic revolution of Iran
After the fever of Revolution subsided in 1979 and the eight-year war of Iraq against Iran in 1979 started, the urban management system in Iran faced new challenges, particularly the lack of funds. In this regard, following the approval of the budget law in 1983 (The Plan and Budget Organization of Iran, 1983), the municipalities were obligated to reach self-sufficiency within three years and consequently, the government stopped granting the municipalities. Therefore, since 1986 onward, the municipalities gradually faced financial shortages for fulfilling their projects (Farhoodi et al., 2009). During this period, FAR was allowed to be sold as an important source of municipal revenue; in this policy approved by the High Council for Urban Development and Architecture (HCUDA, 1990) of Iran, the municipality could benefit from sell a part of the FAR which exceeds 120 per cent.
This policy has a great contribution to supply the financial resources of the municipalities besides the article 100 of the Municipality Law, which fines the construction violations such as construction of extra buildings, construction without building permits, construction of buildings without any parking, and so on. Moreover, in 1990, the HCUDA, in its Rule entitled “The Regulations for Increasing Density and High Rise Building” (HCUDA, 1990) allowed the municipalities of the cities with over 200,000 people to issue the FAR permission for a FAR of 25 per cent over the amount forecast in the city Master Plan (Institute of Researches and Urban Development Plans of Tehran, 2004).
The coincidence of the above-mentioned Acts with the prohibition of the government grants to the municipalities and their financial independence increased the importance of selling FAR as a major source of municipal revenue (Figure 4).
Karbaschi, the mayor of Tehran (1989–1998), coincided with the onset of the construction and reconstruction period in Iran after the Iran–Iraq eight-year war. To organize the post-war turmoil Tehran, the HCUDA imparted a development plan to Tehran municipality. Since funding for the project was not anticipated (Boomsazegan, 2007), Tehran municipality dispensed it and prepared a plan for a period from 1996 to 2001 entitled: Tehran 80 (Madanipour, 2006).
Karbaschi’s activities mostly focused on the extensive urban renewal and redevelopment strategy in the northern and southern parts of the city, which were funded mainly through the sale of FAR. The administrative boundaries of Tehran municipality doubled in this period and extended towards the outer areas, especially the northern and western areas and included 22 AMRs with an area of 700 square kilometres (Madanipour, 2006). The urban renewal and redevelopment strategy based on the sale of FAR continued in 1990s despite the widespread opposition and complaints of the Department of Housing and Urban Development, the Ministry of Interior and the people’s complaints (Kashani, 1998). During this period, the FAR permissions were granted regardless of the principles and standards of constructing the high-rise buildings such as the parcel area, the adjacent parcels, the accessibility, overlooking and daylight.
Finally, in 1997, the Commission of Article 5 passed Rule 269 (HCUDA, 1997) in which any construction must have been built only based on the parcel area and its access to the street network. This rule was also problematic due to the ignorance of the other criteria in construction (Khyrodin, 2010; Shole, 2008). According to this Rule, a building could have the maximum number of seven stories and any parcel with a minimum area of over 300 square meters and adjacent crossing width of over 12 meters could receive a more four-story building permission and the other parcels could receive a one-story building permission. The spatial consequence of this decision was the growth of construction and density in the outer wards of the north, northwest and northeast of Tehran. On the contrary, the parcels in the city centre and the southern parts of Tehran as an old and exhausted fabric had an area less than 300 meters and did not have a chance of density increase (Khyrodin, 2010). Since 1993 to 1998, the five northern AMRs of Tehran allocated 55 per cent of the building permissions and the other 17 municipality regions allocated 45 per cent of the remained building permissions to themselves (Khyrodin, 2010).
The permanent controversies over the FAR Policy led to confusions in the urban policies even when the coalition of reformists won in City Council Election (1999–2003) and Karbaschi was dismissed. During these four years, three mayors were elected and the municipalities did not follow any certain FAR Policy. In this period, the FAR permission was re-sold with greater intensity especially on the north of Tehran so that within two years and eight months (1999–2001), it was sold more than the amount sold during Karbaschi’s eight-year period.
In response to the land and housing speculation, Rule 329 (HCUDA, 2001) was passed instead of Rule 269 by the Commission of Article 5 of the HCUDA, in which the sale of the FAR permission in areas with a crossing of less than 6 meters were banned and the number of the stories based on the permitted FAR reduced to 3.
During the years from 2003 to 2005, with Ahmadinejad's election as the mayor of Tehran and the victory of the conservatives in the City Council elections, the past trend continued despite the altered decisions. In 2003, first the City Council passed the permission of the construction of one story in excess of the allowed FAR to encourage the inhabitants of the old neighbourhoods to reconstruct their buildings. Then, the city council eliminated the common space from the building permits and a story in excess of the allowed FAR was granted to the applicants. Therefore, the terms of granting the excess FAR backed to the conditions before Rule 329. During this period, the outer AMRs of north, northeast and northwest of Tehran had a 50 per cent contribution to the FAR permissions sold in the city. A legislation benefiting the affluent northern inhabitants was then enacted to reconstruct the old central and southern structures of Tehran.
Mohammad Bagher Qalibaf has been the mayor of Tehran since 2005. In December 2007, after years of sporadic actions regarding the construction and land use of Tehran, with the cooperation of the Municipality and the Ministry of Housing and Urban Development, Tehran Master Plan was approved. The objectives of the plan were substituting sustainable income sources, controlling the FAR of the residential buildings, and authorizing relevant policies to allocate more FAR to the workplaces and mix-use zones (Boomsazegan, 2007). Contrary to what was expected from Tehran Master Plan, during Qalibaf’s period as well as the previous mayors’ periods, the process of selling the FAR permission has continued as an important source of revenue for Tehran Municipality. The contribution of the sale of the FAR permission to Tehran Municipal revenue reached more than 70 per cent in some years. In 2013 and 2014, more than 50 per cent of Tehran Municipal revenues have been mainly related to the construction sector, especially the charges of the FAR permission (Municipality of Tehran, 2013, 2014).
Spatial consequences of FAR policies and practices in Tehran
Since 2011, Tehran has become a dense city. The average population density of this city was 128 persons per hectare in 2011 (Table 1). The inner area – formed around the central area before the Revolution – with 1.176 million inhabitants and 141 persons per hectare is the densest area in Tehran. Drawing concentric circles around the CBD shows the population hot spots (300 people per hectare or more) are located within the circle 8 kilometres from the CBD coinciding to the inner area of the city (Figures 7 and 8).
The pattern of Tehran population density shows that multiple extensive dense areas were formed in Tehran from 1996 to 2011; the dramatic creep of population is obvious towards the northern, north-western and north-eastern outer wards especially in 2011.
In fact, over the last 15 years, with an increase in the population, blocks with a population density of more than 100 persons per hectare spread over the whole city of Tehran. These blocks include 50 per cent of the city area (Figure 9). This is true even in areas with density more than 150 persons per hectare (Figure 10). This pattern shows the distribution of a dense population throughout the extensive areas in addition to the weakness of the public transportation, it has an effect similar to the sprawl and dispread structures. Filion et al. (2006) in a study in Toronto confirmed that such scatter of the high-dense pockets (also called wasted density) had several negative consequences caused by incompatibility with the public transportation services.
The creep of the extensive dense areas to the northern wards is the result of issuing the FAR permission in each parcel and AMR only based on the applicants’ willingness and considering two simple criteria: the minimum parcel area and the minimum adjacent crossing width. In fact, the regulations of the FAR, especially before the Master Plan, were locally defined in a parcel scale but not based on a density zone scale. It was implemented not based on a long-term plan but based on a simple single criterion in which relying on trial and error, a sectional legislation was passed and carried out in different temporal and political situations as well as in the upsurge of constructional crisis.
This kind of incomprehensive and provisional approach was applied to the Post-Revolution issue of density for about 30 years until the approval of the Master Plan in 2007. In this period, the decisions made for the FAR lacked an integrated approach to the various consequences that irregular construction and population densities could have on the environment, social services capacity and infrastructures, particularly the public transportations.
The horizontal profile of the population of Tehran in 2011 shows two areas of dense population in the inner and northern outer wards, while there is a dent in the city centre, which highlights the lack of interests to live down the central wards of the city (Figure 6). In 2011, only 3 per cent of Tehran population (0.209 million people) inhabited in its central wards, while 83 per cent of Tehran population (6.7 million people) lived in the outer areas (Figure 11). Of the total population living in the outer areas, the northern areas had a contribution of over 58 per cent (3.97 million) and the southern wards had 20 per cent (1.39 million), respectively.
One of the key indicators that can be a good guide to assess Tehran spatial policies is the pattern of changes in the number and density of population in the main wards of Tehran. The findings show that the spatial policies have intensified the growth of outer wards of Tehran, particularly on the northern and western areas. The northern and western outer wards are the fast-growing areas experiencing a rapid construction growth due to the tendency of the private investors, government, semi-governmental organisations and military organizations to invest there. These wards supply the highest revenue for Tehran Municipality through receiving charges on the constructions and the FAR permissions sale (Figure 14).
The relationship between the ascendant spatial changes of the northern outer wards of Tehran with the amount of FAR sales or Tehran Municipal revenue shows that the benefits of the municipality and the residential builders in the affluent expensive areas of Tehran are tied to each other. In fact, the municipality tries to have revenue through construction and FAR charges while the private sector thinks of its profits. Zhao et al. (2010) showed that such financial benefits of land development and construction resulted in the expansion of the outer wards, the decrease of the balance between the workplaces and residential places, the low density and even illegal developments in several cities in China.
The wide range of the old and exhausted areas in the central, inner and southern wards of Tehran (Bertaud, 2003; JICA 1997, 2003; Madanipour, 2006) shows the inability of the urban management in making positive spatial-physical changes aimed at increasing the capacity of the mentioned areas for attracting population and activity. The population contribution of the city centre has had a 40 per cent decrease during the past 15 years (1996–2011) which is also correct about the inner wards −.28% (Figures 12 and 13). These areas with static conditions and a decline of the population growth in some parts have a rising deterioration and a falling capacity for attracting the population and activities.
Another point that makes the densification policies in Tehran more complex is the abundant violations of the permitted FAR by the governmental, semi-governmental and military organisations as well as private companies. Construction violations include the creation of basements, lack of residential parking, development of the stories, construction of a new story or a combination of these cases that are examined by a committee called Article 100. All of these violations are treated by either destructing the unlawful space or fining the builders. Fining unlawful constructions are considerable part of the municipal revenue in Iran (Farhoodi et al., 2009).
Geographical distribution of the violated FAR in Tehran's wards from 2002 to 2011 shows that the northern, north-western and north-eastern outer areas (AMR1, 2, 3, 4 and 5) have had the most construction violations (Figure 15). This is also observable in the AMR15, 18, 19 and 22, which are parts of the outer areas (Frotan, 2012).
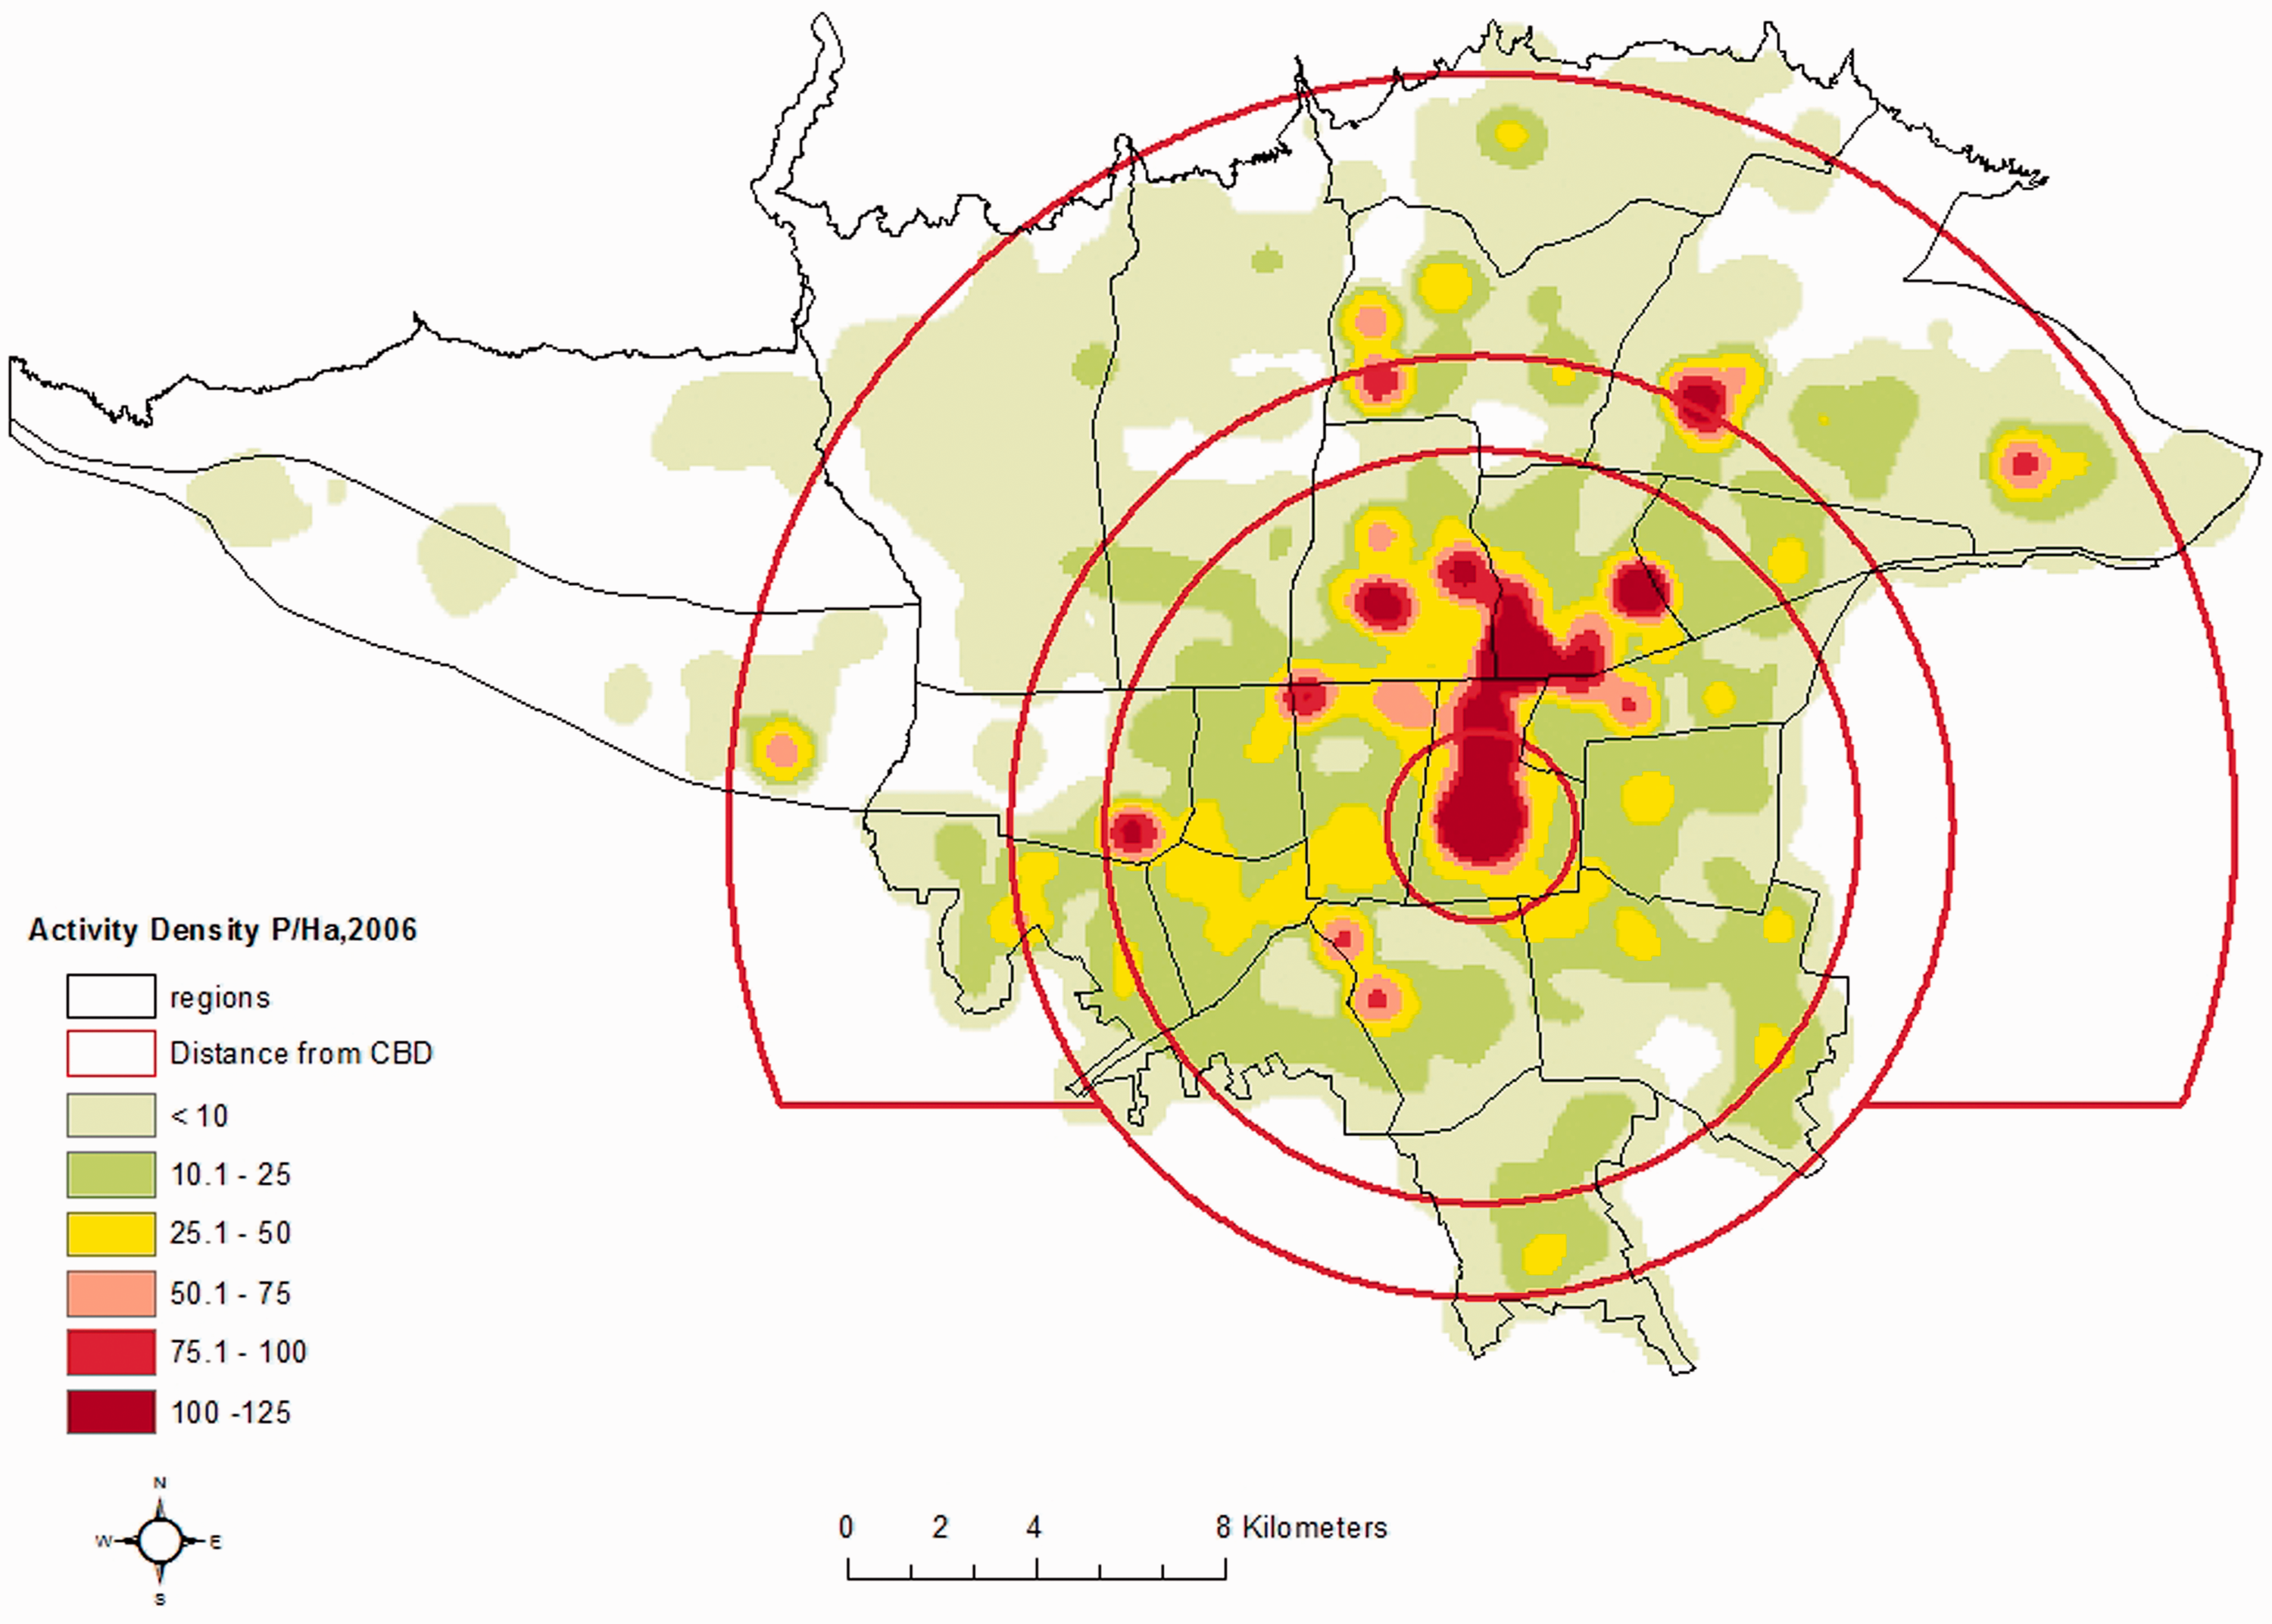
Tehran spatial structure using the employment variable in 2006 and GI model shows a polycentric structure in which activities are centralized in the core and the inner areas (Table 3 and Figure 19). The ratio of the activity to the population is 55 per cent in the core area of Tehran. The high ratio of the number of jobs in the core area against the low ratio of the number of population in this area suggests an imbalance in the population and activities distribution pattern (Figures 17 and 18).
The focal core of the activities in Tehran has a low capacity to attract and retain population in contrast to the outer areas that have attracted large crowds. This shows the distance between the population centres and the activity centres that motivates the need for travel from house to destination (Figure 16). The pattern of Tehran urban travels in 2011 shows a mono-centric structure in which the major travels end to the CBD (AMR 12) and its adjacent areas (some parts of AMRs 6 and 11).
Gainza et al. (2013) in their study showed a direct relationship between the environmental effects and distancing from the central area of the city, so that the development of the mono-centric city to its surrounding areas makes the commutes longer and consequently increases the energy consumption.
Tehran spatial expansion toward the outer areas as well as the inefficiency of the public transportation system (Bertaud, 2003; Madanipour, 2006) has escalated the use of the private cars. These days, private cars and collective taxis make 68.5 per cent of the urban travels in Tehran, while the public transportation (except for taxis) has 31.5 per cent contribution (TTOMT, 2012). It should be noted that the private cars have up to 80 per cent contribution to the air pollution in Tehran and are considered as one of the main challenges in the urban management (Aleshykh et al., 2012; Gharagozlo et al., 2012).
Applications for policy-makers
Some practical lessons learned from Tehran densification policies are as follows:
The densification policies play a major role in shaping the spatial structure of the city. Therefore, its spatial dimensions must be considered as well as the parcel-scale measures. The worst strategy seems to be the urban densification with a monetary approach regardless of its other dimensions. While the municipality seeks more revenue from the sale of the FAR permission, it immerses the city into a new swamp with huge externalities such as the air pollution, traffic, and the need for more infrastructures. Therefore, the municipality will lose more than what earns. The spatial densification policies try to encourage dense constructions in the core and the inner wards of the city (through financial incentives such as less construction tariffs compared to the outer wards), provide job-housing balance through population growth in the activity cores, increase density around the hubs and nodes of the mass transportation, increase density in areas with a high access to the public transportation services, increase density in the centre of the urban wards in order to shape polycentric structures particularly in the cities suffering a high sprawl and dysfunctional public transportation.
Discussion and conclusion
The purpose of this paper is first to investigate the consequences of non-spatial approach in the urban densification policies on the USS of Tehran as a metropolis in the developing countries, and then to show how the causal actions, imperfect and lax regulations in the absence of a long-term spatial plan can imbalance the spatial structure of a major metropolis. The consequences of these policies would affect the economic, social and environmental urban indicators negatively for several decades.
The findings show that after the Revolution, Tehran did not have a high experience in compliance and implementation of an executable urban development plan. The urban development policies (including FAR) in this main metropolis of Iran was carried out as single acts based on the simple and disintegrated regulations for thirty years in absence of Tehran Master Plan.
Despite the role of FAR measure in determining the population growth of urban wards, settling the activities and consequently, shaping the USS, the urban management considered this issue just as a lever for supplying the municipal financial deficits. Tehran Municipal financial dependence on the sale of the FAR permission has been nearly 50 per cent in the recent years. In the absence of a comprehensive spatial policy for 30 years, according to the residential builders’ demands and the large amounts of the obtained money, the FAR permission has been granted anywhere in Tehran.
While the density regulations are believed to direct the housing market towards striking a balance between residential and job mobility, this is the market that has directed the amount and direction of the constructions density in Tehran, not the construction density regulations.
One of the spatial consequences of FAR policies in Tehran is expanding high dense areas across the capital city, Tehran, regardless of the development capacity of urban wards. Alignment and integration of the densification policies and the public services policies have been emphasized in order to benefit from the positive effects of densification in urban developments.
A kind of spatial mismatch in the pattern of population and activity distribution can be seen in Tehran. While the dense spots of population have been distributed in large parts of the city, the spatial structure of the activity shows a high concentration in the CBD and the inner wards. The consequences of the job-housing imbalance on the increase of the time and length of commutes have been mentioned in this paper. The increasing loss of the capacity of the city centre and the inner wards to attract and retain the population, and the rapid growth of the number and density of the population in the outer areas especially northern parts are the other negative consequences of the spatial densification policies in Tehran. As the results show the complex and context-dependent nature of the densification policies, the same densities may have a variety of arrangements and thereby create different spatial structures.
The importance of the current study is due to the lack of the relevant literature on the experiences of the developing countries. This study shows one of the major weaknesses of Tehran urban densification policies, which is the ignorance of the spatial dimensions of the densification policies. Restrictions in the access to the timely information about Tehran municipal revenues, the permissions and the revenue obtained from the sale of the FAR permission from 2002 to 2011 caused an increase in the length of the research time for several months. Further research could be done to study the economic, social and environmental effects of the spatial changes of Tehran with regard to the effects of the densification policies.
Finally, it should be noted that the spatial structure of Tehran is the product of the densification policies lacking long-term spatial plans (up to the Master Plan) that have been related increasingly to the monetary benefits obtained from the sale of the FAR permissions.
Footnotes
Declaration of conflicting interests
The author(s) declared no potential conflicts of interest with respect to the research, authorship, and/or publication of this article.
Funding
The author(s) disclosed receipt of the following financial support for the research, authorship, and/or publication of this article: This research was financially supported by the Research Department of University of Mazandaran and the Curtin University Sustainability Policy (CUSP) Institute, Australia.