
Abstract
The modern discipline of urban morphology gives us a ground for the comparative analysis of cities, which increasingly includes specific quantitative elements. In this paper, we make a further step forward towards the definition of a general method for the classification of urban form. We draw from morphometrics and taxonomy in life sciences to propose such method, which we name ‘urban morphometrics’. We then test it on a unit of the urban landscape named ‘Sanctuary Area’ (SA), explored in 45 cities whose origins span four historic time periods:
Introduction
Cities are crucial to human beings, society and the environment in the current urbanization age, the ‘metropolitan century’. The environmental, economic and social performance of cities will, in the next three to four decades, shape the future of the planet. And yet, a rigorous and reliable understanding of how cities change, i.e. a ‘science of cities and city planning’, is today just in its infancy (Batty, 2008, 2013). In this paper we look at one specific aspect of cities, their physical form. Cities are a product of human culture. As such, they change in time responding to changing human needs and habits, and yet they evidently share common properties at various scales both in space and time. Such properties are the spatial relationships between physical features such as neighbourhoods, blocks, streets, squares, buildings, parks or rivers. This dimension of the urban space affects crucial non-spatial dynamics such as identity, walkability, safety, prosperity, quality of life, wellness and ultimately the resilience of the urban system at large (Feliciotti et al., 2016; U.N. HABITAT, 2013). A quantitative, comprehensive and systematic method to define, measure and classify urban form at this scale is necessary to explore, for example, why certain communities become safer, or develop higher levels of satisfaction or lower levels of car use and obesity, or thriving retail clusters. However, despite its importance and practical urgency, a reliable science of urban form measurement and classification, or ‘urban morphometrics’, does not exist, nor consequently a true science of urban form evolution.
How can this still be the case, more than 150 years since the publication of On the Origin of Species (Darwin, 1859)? The analogy of cities as living organisms has informed how we look at cities since Plato some 24 centuries ago (Williams, 2001) up to our days (Marshall, 2008; Steadman, 2008), spanning from more conceptual (Sert, 1942) to explicitly bio/anthropomorphic approaches as in the case of Le Corbusier (Hegewald, 2013). However, it so appears that urbanists have consistently continued to pursue the ‘good city form’ (Lynch, 1984) in a way that echoes that of the healthy adulthood in the growth of living individuals; and by so doing, they have produced a developmental rather than truly evolutionary form of the analogy (Batty and Marshall, 2009; Romice et al., 2017). In the modern era, this has been historically functional to the establishment of town planning as a discipline in the first half of the past century: if a perfect adulthood existed for our cities, planners would be the ones who knew how it would look like and how to get there; in that sense they literally acted in the role of God (or Nature), a surprisingly simplistic approach to a phenomenon of almost unconceivable complexity.
By the early 1970s, following repetitive and painful failures on the ground, fundamental concerns regarding ‘the assumptions on which the planning doctrine is based’ (Martin, 1972) were raised in the name of an authentically ‘organic’ approach to city planning, one springing from a scientific rather than purely metaphysical analogy with nature and complexity. Key figures such as Jane Jacobs (Jacobs, 1992, c. 1961) and – crucially – Christopher Alexander, set the stage for the understanding of cities as non-linear systems (Alexander, 1965), drawing from the new sciences of complexity (Weaver, 1948). They called for a radical shift towards a notion of urban change as a mostly self-organized and open-ended trajectory, inherently irreconcilable with central control, including that of rational-comprehensive planning. However, as influential as they have been, these voices have gone fundamentally unheard in mainstream urban planning and design up to our days, alongside those that in the same years, from different camps, called for ‘an ecological view of planning systems’ (Holling and Goldberg, 1971). In the end, ‘the application of evolutionary concepts within urban planning theory has largely remained a curious mix of generalizations, metaphors and the vestigial remnants of Geddesian evolution—at least, until recently’ (Marshall and Batty, 2009: 462). The first signs of such new science of cities have emerged only in the last two decades, largely from outside the boundaries of established urban scholarship.
The most notable contributions come from complexity theories (including complex networks) and/or biology. A classical example is the fractal description of urban form where the intrinsic non-Euclidean geometry of human settlements is highlighted (Batty and Longley, 1994). Inspired by scaling theories in biology, recent studies demonstrate that some urban form metrics, such as the amount of transportation infrastructure, scale uniformly among world cities (Bettencourt et al., 2007, 2013); moreover, indices of economic performance such as Gross Domestic Product are found to scale in linear or super-linear manners with urban population. Such scaling offers both an explanation of the advantages of large cities’ ‘agglomeration economy’, as investigated by recent advancements in economic geography (Coe et al., 2007), and of the self-organized nature of urban economy at regional scale (Strano and Sood, 2016). A noteworthy flurry of literature also comes from the physics of complex networks (Barthelemy, 2011; Boccaletti et al., 2006): for example the urban road network has been found to fundamentally characterize patterns of urbanization (Cardillo et al., 2006) and types of cities (Strano et al., 2013), where road centrality seems to drive the evolution of large-scale urban territories (Strano et al., 2012). Networks have also been utilized to explore the relationships between road structure and the microeconomy of cities, demonstrating that space centrality is key in the evolution of urban places (Hillier, 1996; Porta et al., 2010).
The role of established urban disciplines in such pioneering endeavour is nevertheless minimal; contributions from urban scholars are often part of fully interdisciplinary efforts the core of which sits well away from urban disciplines. This might explain why such interdisciplinary studies on cities struggle to generate a recognizable impact on urban planning and design: for example, they privilege a large-scale approach where the analysis unit is the whole city, leaving the micro/meso scale of neighbourhoods and districts substantially unexplored. To find an authentic focus on evolution at the neighbourhood scale, we shall turn to a niche that emerged in the early 1960s from the parallel and indeed unrelated efforts of Italian architects and British geographers: urban morphology. Since the foundation of this discipline (Conzen, 1960; Muratori, 1960), urban morphologists looked at component elements of the ‘urban tissue’ (Larkham and Jones, 1991) at the neighbourhood scale, with a specific focus on time. In any case, as much as to biological evolution and system ecology, planners remained largely impermeable to urban morphology too: its explicit focus on self-organization and evolution made it difficult for them to accept, unless distorted into a purely architectural abstraction (Marzot, 2002). However, several key notions of urban morphology itself appear to some degree still elusive (Whitehand et al., 2014), resulting in a weak analytical ground: various components of urban form have been discussed in various ways, but there is little evidence that such components are generally meaningful, nor that their definitions are univocal or universally applicable or valid (Dibble et al., 2016). While this does not prevent comparative studies from successfully exploring specific cases even of significant extension, the construction of a general taxonomy of urban form needs to be pursued within a systematic, comprehensive and quantitative new framework.
In this paper we introduce and test such framework by classifying the form of 45 urban areas. As biological evolution stemmed from the rigorous measurement of the form of living organisms and, on that basis, of their similarity, i.e. by biological morphometrics, we propose a study in urban morphometrics. To do so we: (a) identify the unit of analysis, at the appropriate scale; (b) define the constituent elements of urban form which are universally correspondent across all cases; (c) measure the visible (‘phenotypic’) manifestation of these elements in a way which is rigorous and replicable; (d) identify the smallest set of variables still capable to adequately cluster cases by similarity, where similarity is expressed only numerically and adequacy is measured against a clear validation theory; (e) derive a picture of such clustering that highlights what can arguably be defined as the first ‘bifurcation’ in urban history.
Methods: Urban morphometrics
Classification is the basic method which man employs to come to grips with and organise the external world. Plants and animals are in fact classified in basically the same way as non-living objects, on the basis of possession of various characters or relations which they have in common. (Heywood, 1976: 1)
The necessity to classify and organise the external world is the foundation of systematics, i.e. the ‘scientific study of the kinds and diversity of organisms and of any and all relationships among them’ (Simpson, 1961: 7). The results are systems of classification based on the similarity between organisms; such systems can be used for the storage, retrieval and communication of information, facilitating predictions and generalisations of unknown organisms, or inferring relationships between the units that are classified, also known as ‘taxa’ (Jeffrey and Heywood, 1977). According to Roth and Mercer morphometrics in biology is ‘the quantitative characterization, analysis, and comparison of biological form, […] a means of extracting information about biological material and biological processes’ (Roth and Mercer, 2000). The contribution of morphometrics is ‘precision in the ability (a) to recognize forms that are intermediate, (b) to judge degrees of proximity or similarity to other forms, and (c) to extrapolate or predict hypothetical, experimental, or non-existent extremes’ (Roth and Mercer, 2000). The modus operandi of morphometrics is therefore ‘to quantify the size and shape of organisms with the methods of multivariate statistics’ (Klingenberg, 2002: 4). This sheds light on the evolution of forms and in particular on transformations that happen between forms (D’Arcy Thompson, 1942, c. 1917). Importantly, the rigorous description and classification of organisms according to their similarity is fundamentally distinct from inferring the ancestral relationships between them, which is specific of phylogeny (Borgmeier, 1957: 54). Nevertheless, morphometric variables collected at the population level are still today relevant at various stages of character-based phylogenetic reconstruction (Roth and Mercer, 2000). According to MacLeod (2002: 100), gaps in similarity ‘may arise as a result of a number of evolutionary processes, but their discovery, description, and interpretation represents the first and most basic task of all systematics research’.
A major shift in biological morphometrics, or indeed a ‘revolution’ (Rohlf and Marcus, 1993), occurred in the 1980s: ‘traditional’ methods, based on the algebraic measurement of distances characterizing organs or entire organisms are now complemented by geometric methods based on graphic processes of shape recognition and manipulation through the identification of special ‘landmarks’ (Adams et al., 2013; Reyment, 2010). This approach can be considered as a synthesis of two primary traditions of morphometrics: multivariate biometrics, focusing on statistical analysis of form, and geometric visualization, focusing on visible geometric shapes of organisms (Bookstein, 1993). In this respect, our approach to urban morphometrics starts off in a traditional way: we characterize urban form utilizing a vector of measures that quantify individual aspects of its constituent elements and their relationships in space.
In numerical taxonomy, Sneath and Sokal (1973) proceed by first identifying the Operational Taxonomic Unit (OTU). OTU identification may entail taking into account multiple factors, such as classification purpose, structural organization of what is to be classified, its most appropriate rank and stage of development, or other not necessarily morphological factors. Crucially, in biological morphometrics the OTU is normally associated with the individual living organism, which is in most cases unambiguous. In our case, the OTU is instrumental in determining the features that we observe to assess similarities between different types of urban form. Such taxonomic characters are ‘a characteristic (or feature) of one kind of organism that will distinguish it from another kind’ (Sneath and Sokal, 1973); it is the character's phenotypic expression, or state, that we assess in our attempt to establish similarities and differences between OTUs. When comparing two different OTUs, we actually compare the various states of their characters. Therefore, we must do so ‘over a set of characteristics applicable to both of them’ (Sneath and Sokal, 1973), or homologous characters. For example, we may want to establish which are the species represented in a collection of plants; for that purpose we would classify individual plants rather than, for example, populations of plants. A choice regarding the scale of our observation leads to the identification of the OTU, the individual plant. Observation may reveal that some plants have serrated leaf edges while others have regular ones: ‘serrated’ or ‘regular’ are states of the leaf edge, which is regarded to be a homologous character of the leaf element of the observed organisms (the individual plants).
In the transition from life sciences to cities, the identification of the most appropriate OTU becomes far less intuitive: what is the ‘individual organism’ in cities? Is it the city itself, the district, the neighbourhood, the street? For our morphometrics to support both a general classification of urban forms and a reliable validation process, a suitable OTU must be (1) unambiguous; (2) universally present in all cities; (3) large enough to represent a complete spectrum of all the constituent elements of urban form such that all their homologous characters can be rigorously defined and measured; (4) small enough to be morphologically specific (this excludes, for example, whole cities which exhibit enormous internal diversity); (5) functionally recognizable as units in the organizational structure of the city. In previous research, the ‘Sanctuary Area’ (SA) was identified as a recognizable part of the urban tissue (Mehaffy et al., 2010) and simply defined as the portion of the urban tissue enclosed by main streets (Figure 1). SAs’ size makes them both specific and comprehensive; at the same time, their boundaries (constituted by main streets) can be determined objectively (Porta et al., 2014). Moreover, as cities emerge and evolve by the emergence and evolution of their street network, SAs can be considered by definition universal components of all cities across time and space. Therefore, we adopt the SA as our OTU: in this research, 45 SAs are studied, 40 of which are in the United Kingdom. All the case studies are named after the city to which they belong, but they only represent one SA within that city.
A notional Sanctuary Area.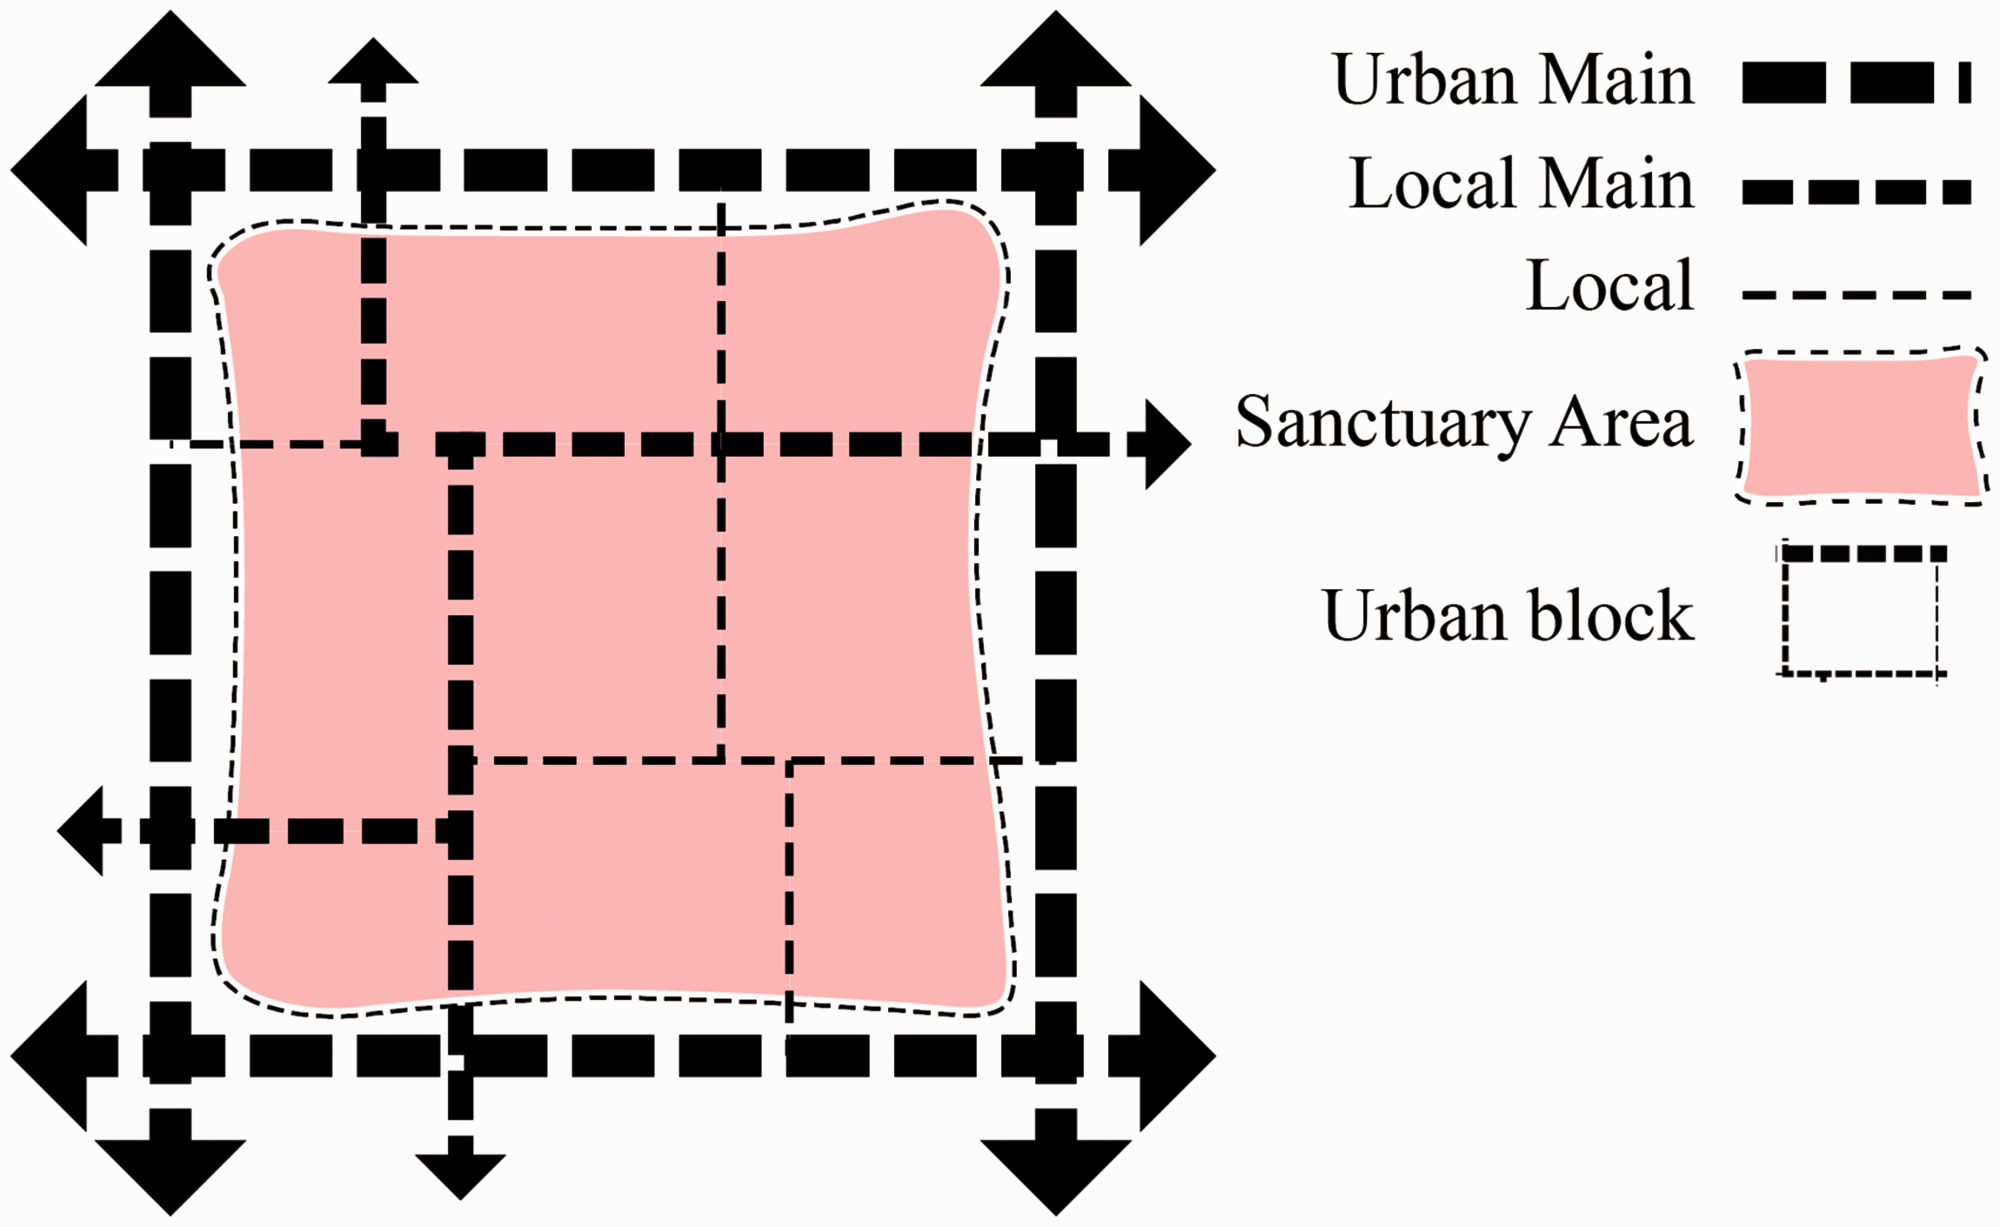
Taxonomic structure: definitions.
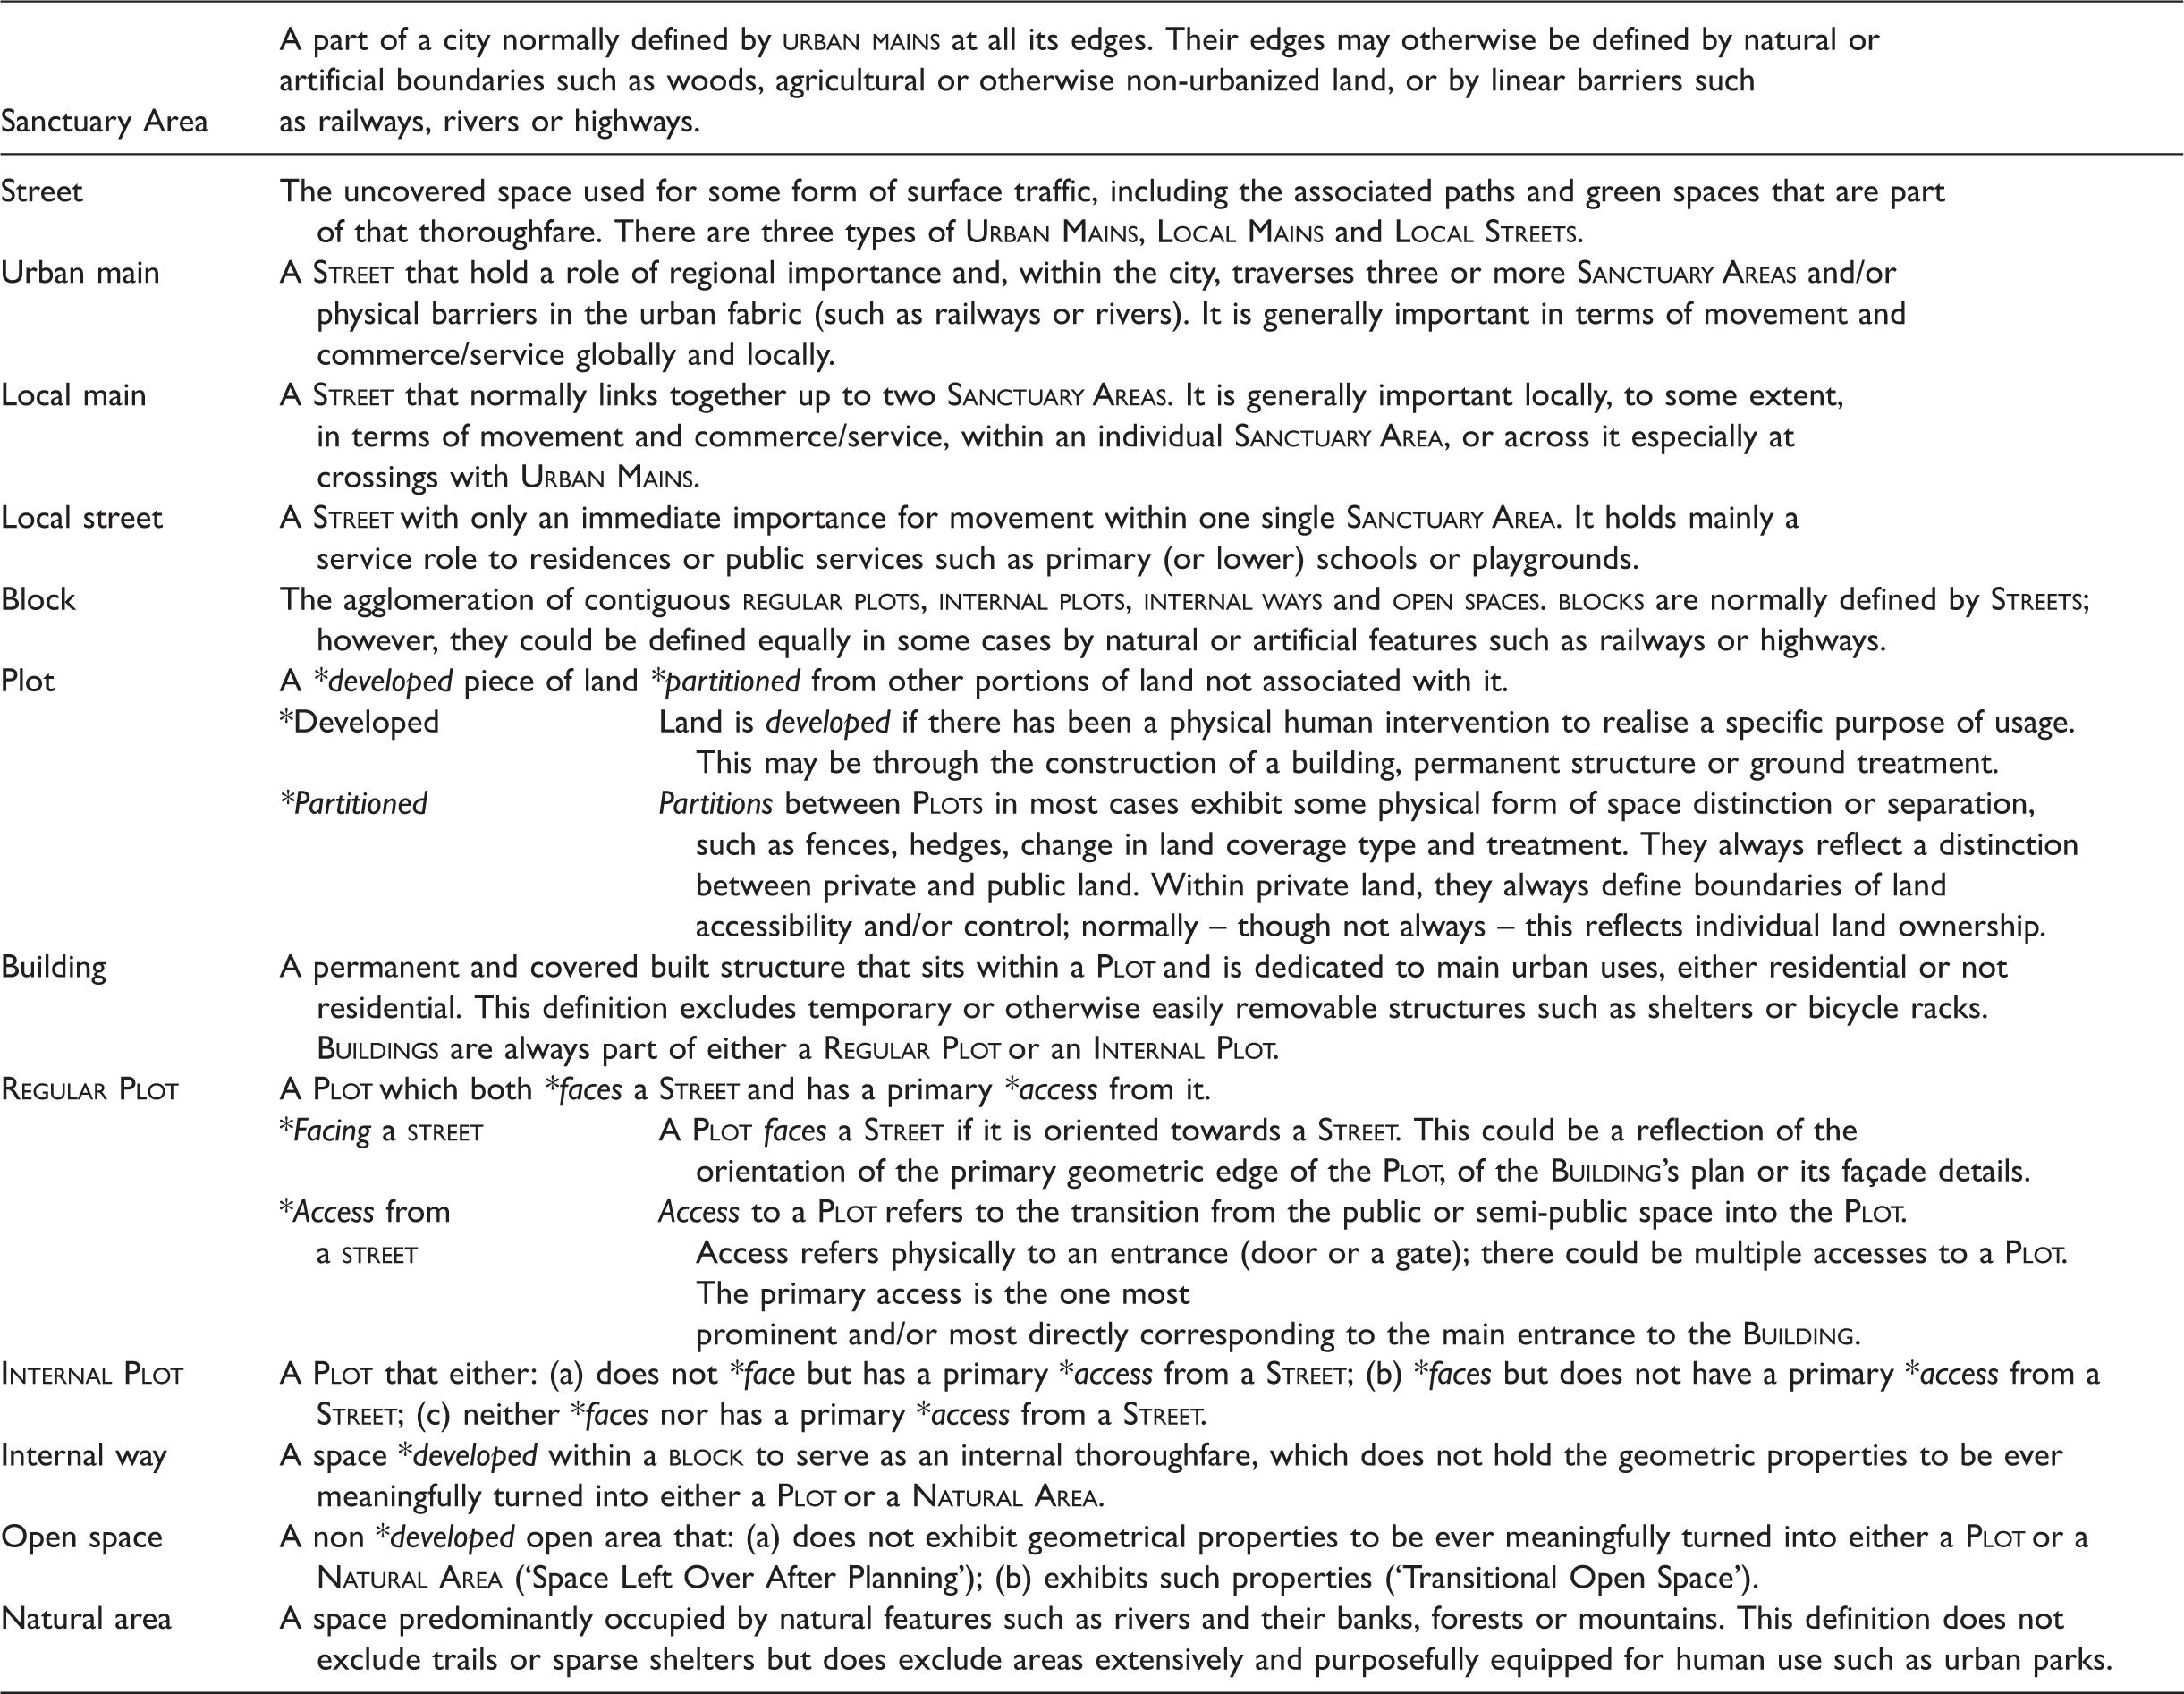
Taxonomic structure for the morphometric analysis of Sanctuary Areas.
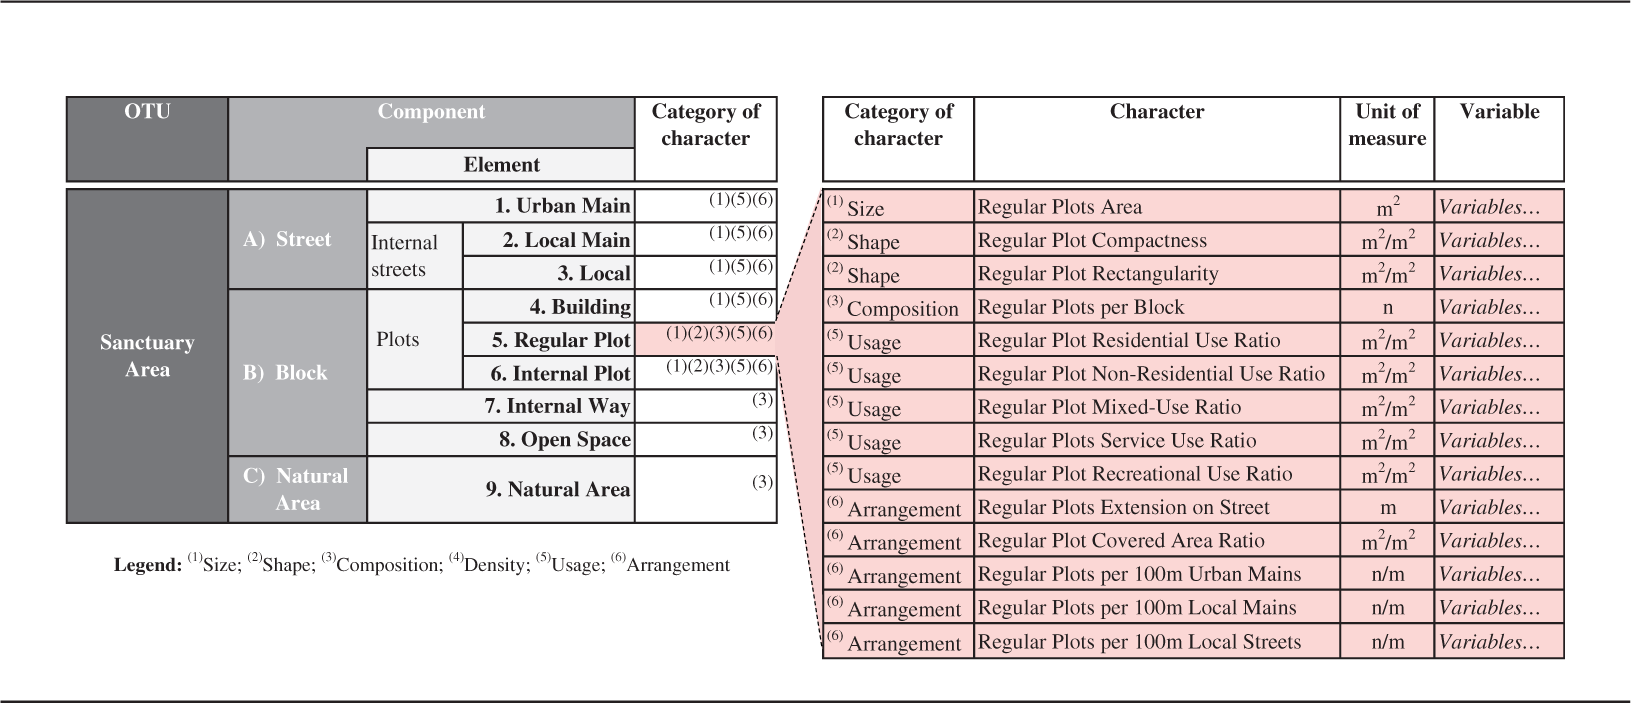
Seventy-five homologous characters were then identified for the description of the nine elements and the interactions between them. In several cases, one character is ultimately described by more than one variable in an attempt to fully capture its expression; in such cases, we typically calculate a set of five descriptors (variables) of the character's statistical distribution: interquartile average, interquartile range, overall minimum, overall maximum, interquartile standard deviation. The complete set of the 207 variables finally utilized is offered in Supplemental material S1; variables span from, for example, the Built Front Ratio of blocks to the Covered Area Ratio of plots, or the Ingress/Egress Ratio of SAs.
How can we assess to what extent our choices regarding the scale of the OTU, the taxonomic structure and the set of variables, elements and characters, are effectively meaningful? It is important that a validation theory is clearly set out, which makes sense of the distinction between elements of urban form as it would do of the distinction between a wing and a beak in biological morphometrics. In our study, we propose that the validation of our system refers back to the historic origins of the case studies. It is established knowledge in urban morphology that the distinctive character, or the identity, of an urban fabric, results from the historic period of their formation. Scholars in urban morphology have extensively referred to this phenomenon with the notion of ‘morphological period’ (Conzen, 1960; Whitehand, 1987); in short, the historic origin of an urban area has a direct and enduring impact on its evolution over time. What distinguishes urban fabrics of different historic origins in all evidence goes beyond factors of architectural language or style, and appears to be inherent to their long-lasting morphological structure. For example, there is evidence that the street layout is among the most resilient components of urban form, as well as the block and plot structure, which is directly linked with it (Moudon, 1986). The street layout then influences other crucial elements such as street centrality, building types, density and land uses (Caniggia and Maffei, 2001, c. 1979). Because it is such morphological structure that we ultimately want to reveal, we need a model by which the resulting numerical expression of their form is conducive to correctly classifying typical cases in terms of their morphological period (i.e. historic origin).
To commence simply, we identify four highly distinguishable historic origin groups as described in literature: (a) H Examples of four SAs examined in this paper: (a) Caernarfon, H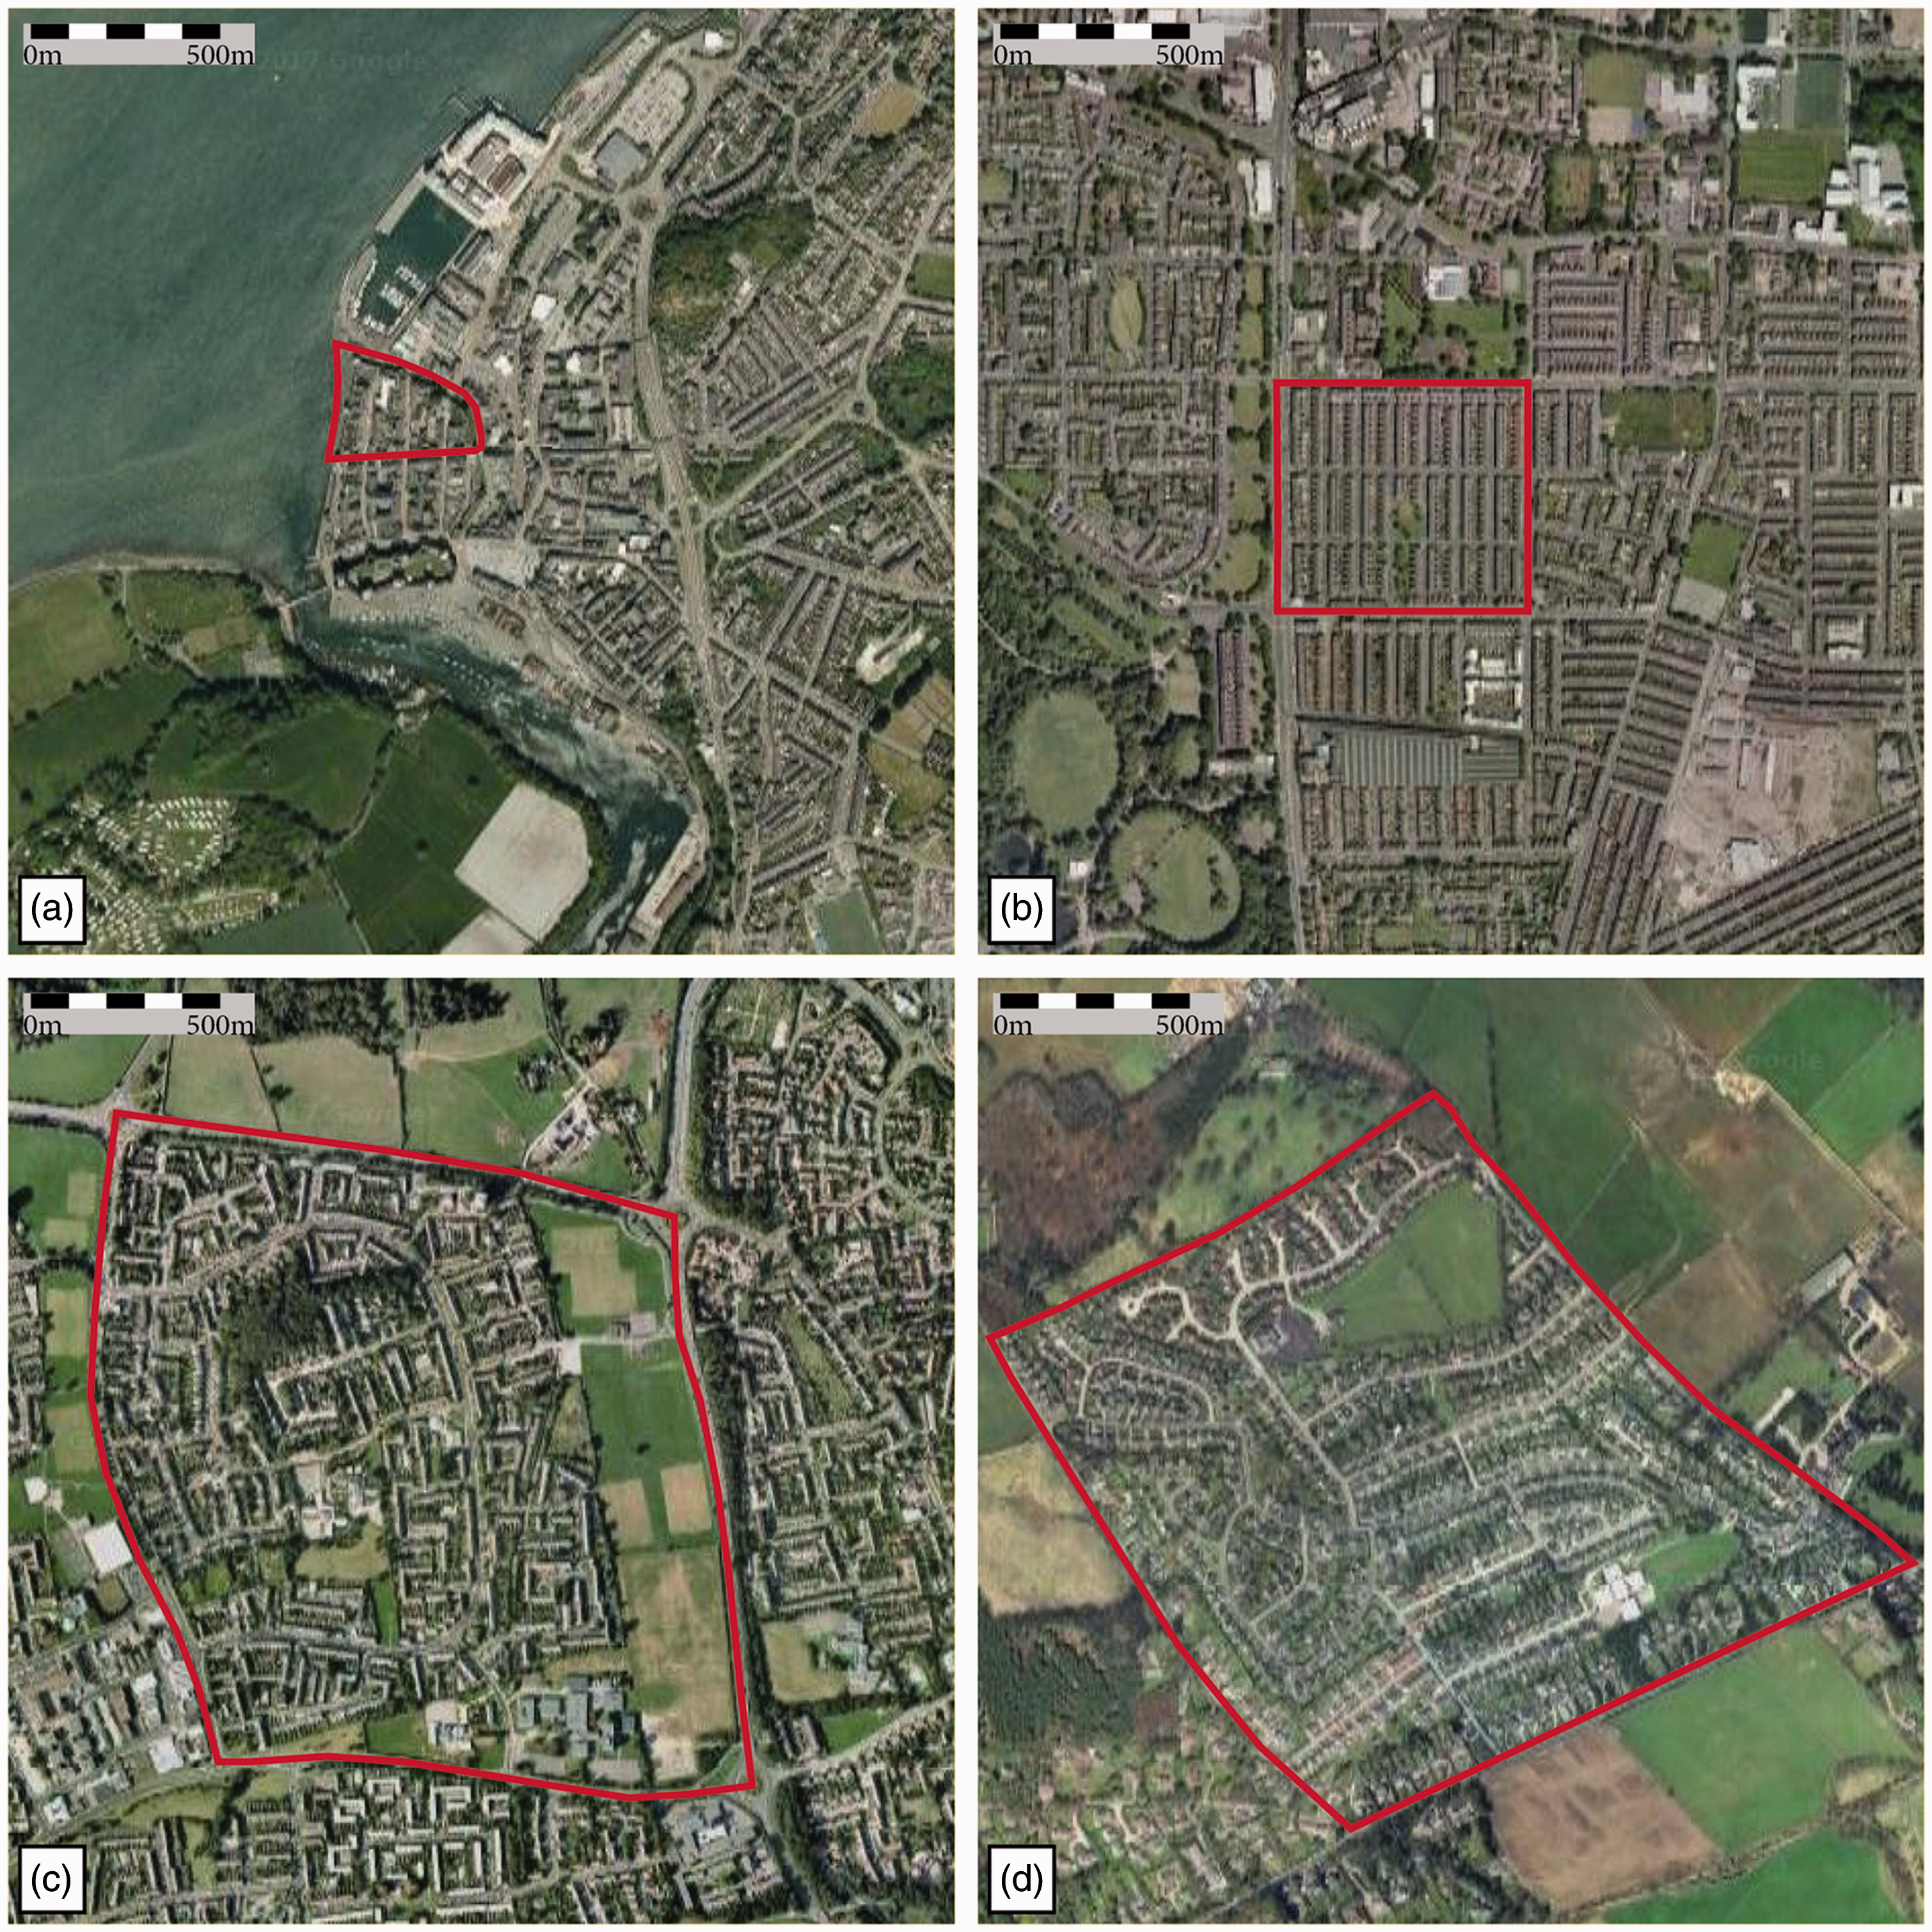
Cases studies according to their historic origins: cases are Sanctuary Areas nominated after the city they belong to.
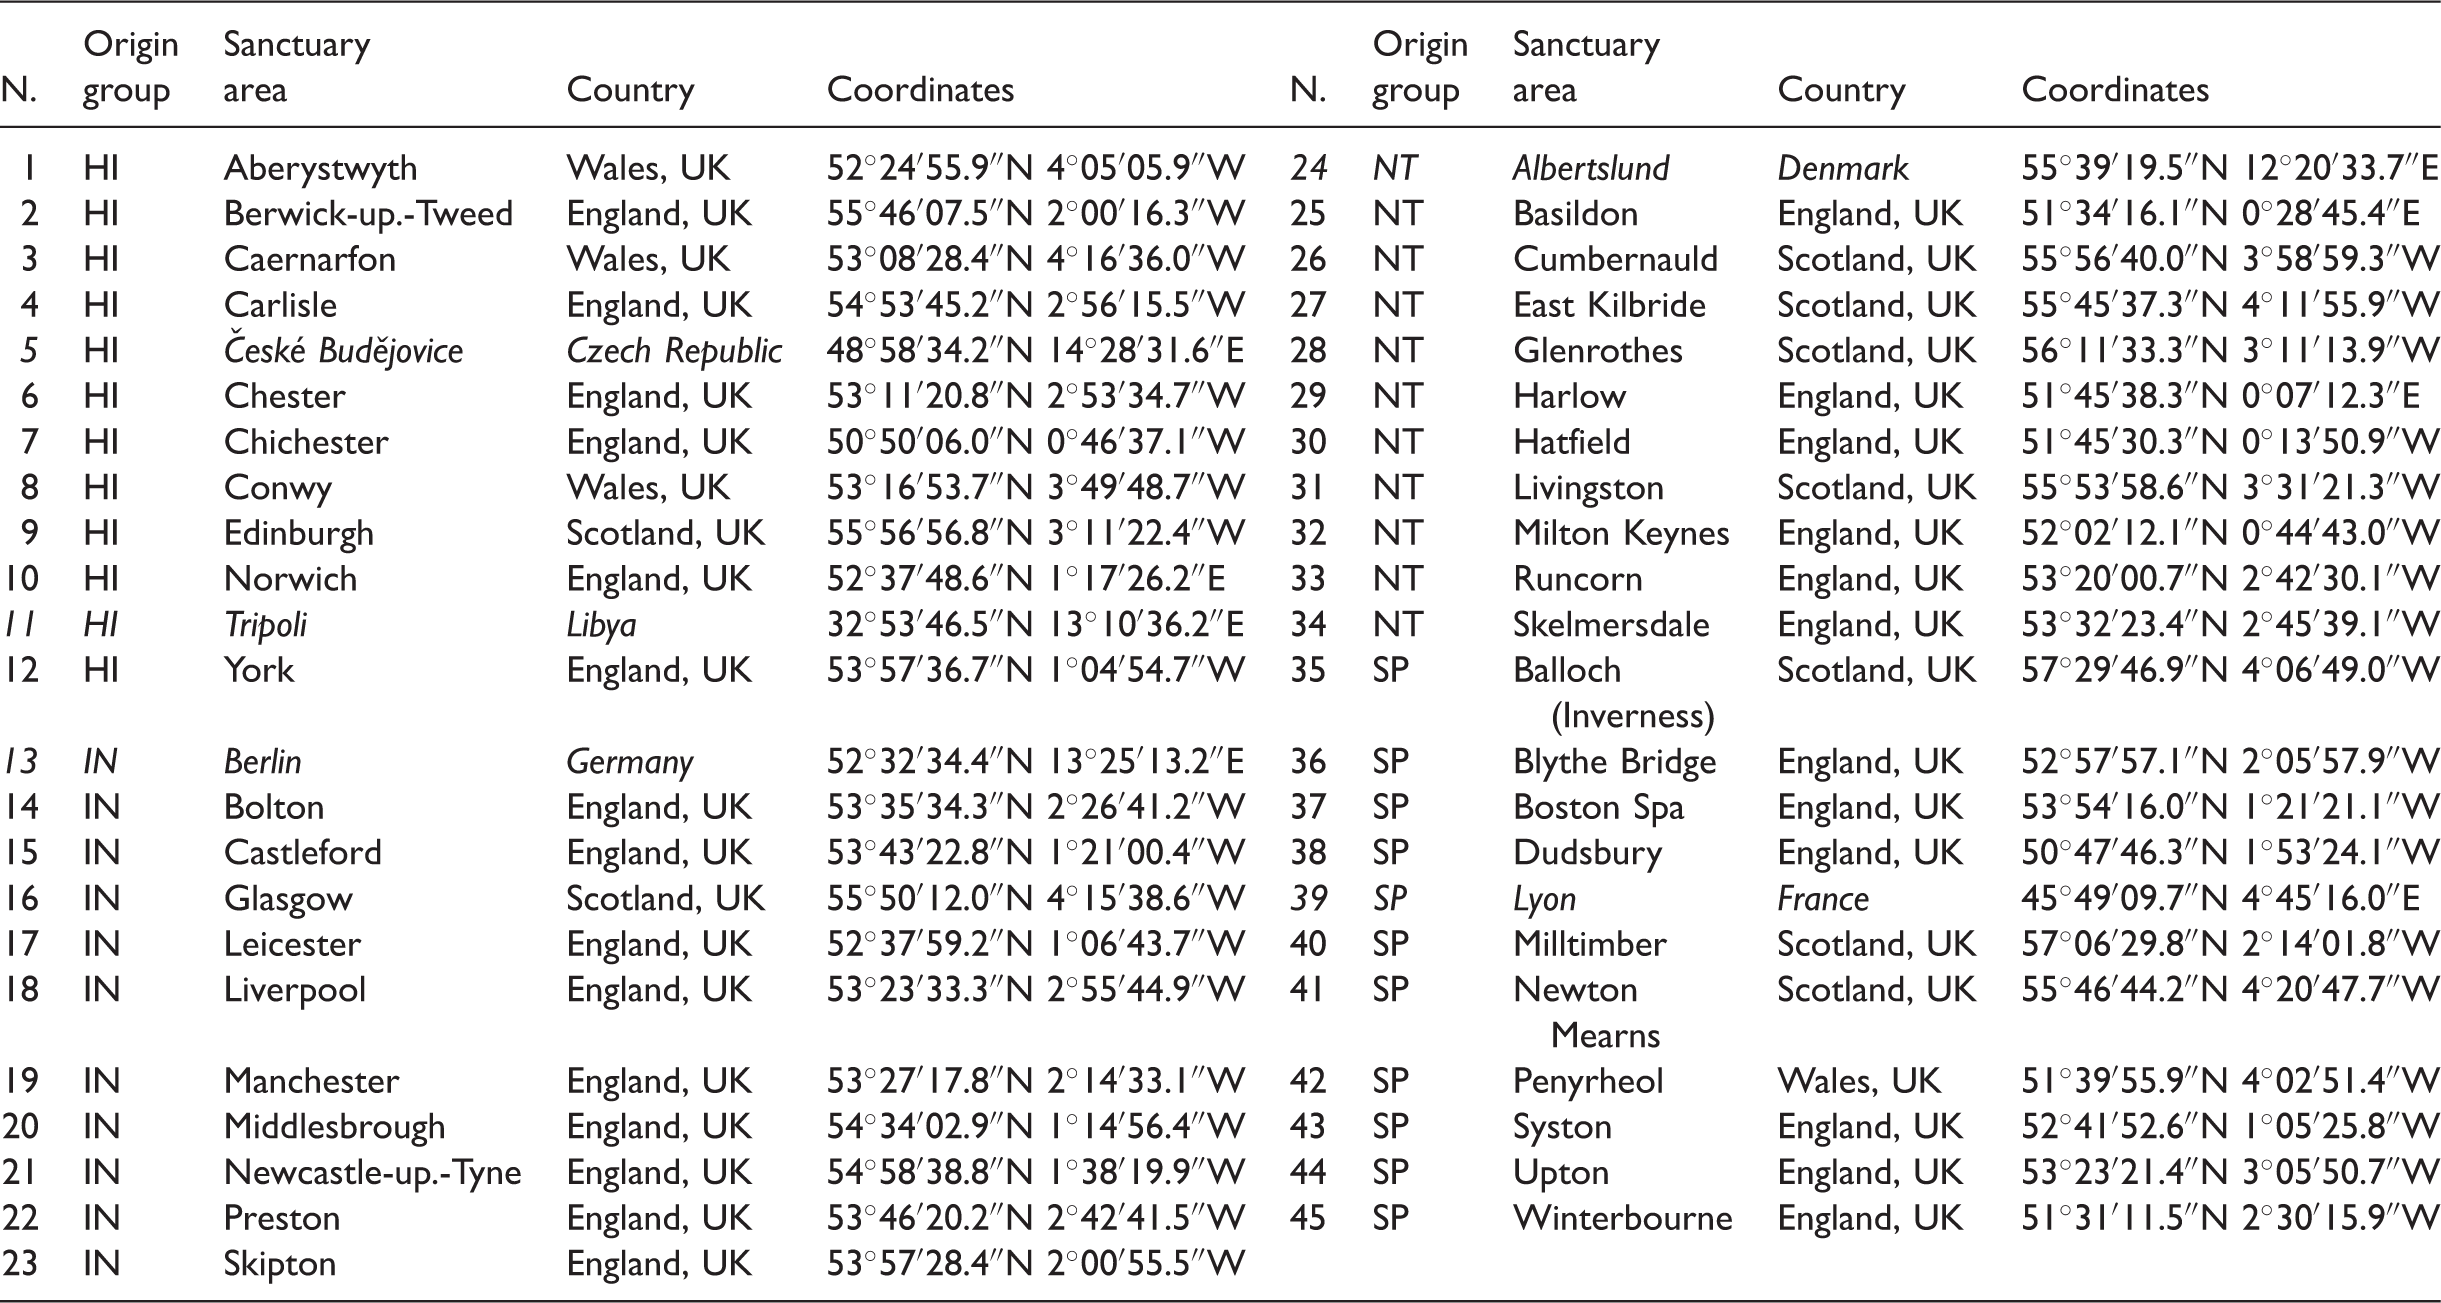
HI: historic; IN: industrial; NT: New Towns; SP: Sprawl.
Note: Non-UK cases in italics.
Several multivariate statistical analyses, detailed in Supplemental material (SR), were undertaken to address all phases of data processing, including method validation (Principal Component Analysis (PCA)), variable ranking (Cost–Benefit Analysis (CBA)) and taxonomic assessment (Hierarchical Clustering Analysis).
It is important to reiterate that this study is aimed at establishing and validating a method. Therefore, it starts off by observing a purposefully simplified, and consequently partial, section of reality, reduced to only four highly distinguishable samples (historic origins groups) of the many more that may characterise the form of SAs globally. It is also important to highlight that we do not compare cities, we compare SAs. Therefore, though we name every SA after the city it belongs to, by no means the name implies any degree of representativeness of that SA towards ‘its’ city: in fact, a SA in Birmingham may well be more similar to one in Manchester than to its neighbouring SA in Birmingham, as much as a cyclamen in Birmingham is more similar to another cyclamen in Manchester than to its neighbouring camellias in Birmingham. In the context of the long-lasting organic analogy of cities, this position ultimately introduces a radical reconsideration of physical cities as the analogous of ecosystems rather than unitary living organisms, a position the profound implications of which are extensively discussed in Chapter 4.
Validation and results
Testing the method and identifying core variables
To assess our method's reliability in classifying cases according to the numerical expression of their form, we first undertake a PCA (Brereton, 2009; Hair et al., 2006). PCA allows a phenomenon originally described by multiple variables to be described by a reduced set of axis, maintaining an acceptable level of representativeness; for details see Supplemental material (SR). We observe (Figure 3(a)) that pre- and post-WWII cases are linearly partitioned into two unequivocal groups by PC1; on PC2, cases can again be partitioned linearly with higher precision differentiating between the pre-WWII (Historic and Industrial) origin groups. Further (Figure 3(b)), information is also held in PC3, specifically regarding post-WWII origin groups (New Towns and Sprawl): this is confirmed in 2D scores plot of PC1 and PC3 reported in Supplemental material S2. The first three PCs reveal that there is an inherent separation in cases consistent with their known historic origins: PC1 distinguishes pre- from post-WWII cases; PC1 and PC2 distinguish pre- from post-WWII cases as well as the two pre-WWII origin groups. With the first three PCs there is nearly perfect linear distinction between the four origin groups.
Principal Component Analysis (PCA) of the 45 SAs (207 variables): (a) Along PC1 and PC2 and (b) along PC1, PC2 and PC3. SA: Sanctuary Area.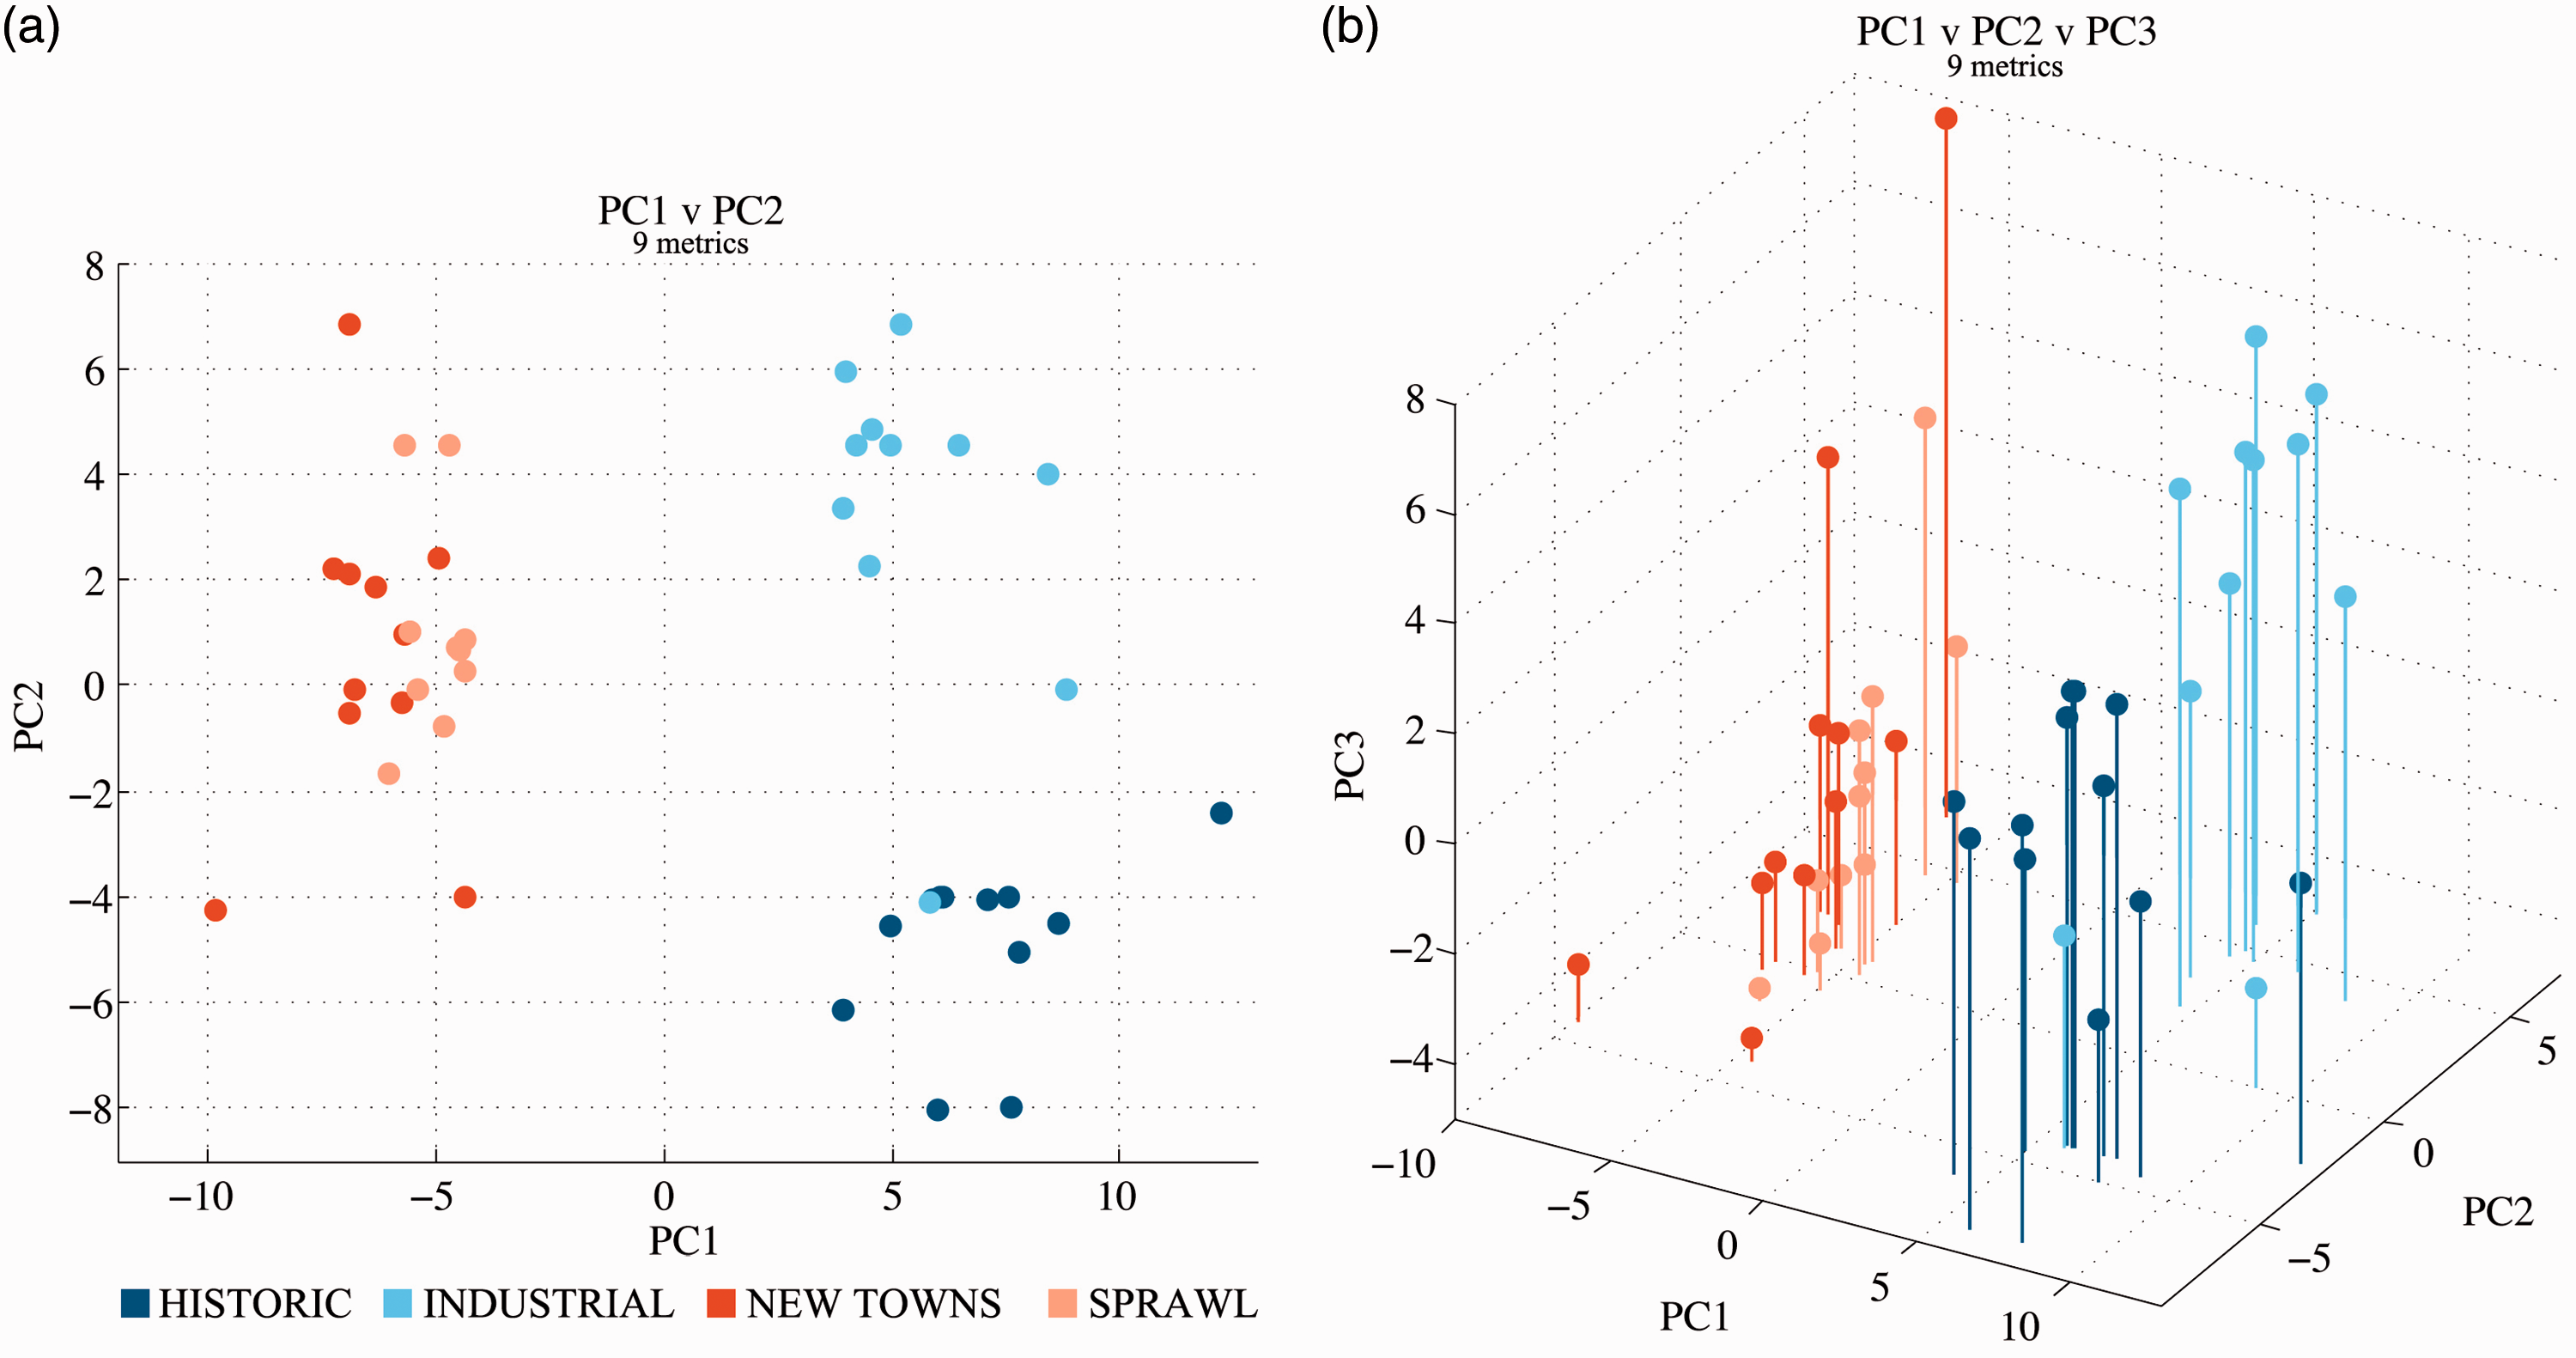
We present the cumulative variance of the PCs in Supplemental material S3. The loadings of variables onto each of the PCs reveal which are the metrics that are most correlated with the differentiation between cities based on their historic origins. The 207 metrics are classified based on their relevance to the Sanctuary Area, Street Network, Blocks, Regular Plots, Internal Plots and Street Frontages and are sub-classified in numerous categories. In Supplemental material S4 we demonstrate the relevance of the first 25 highest loading metrics for each of the first three PCs. The distinction between pre- and post-WWII cases can be predominantly attributed to the structure and composition of the Blocks; the distinction between Historic and Industrial cases attributed to the structure, arrangement and composition of the Regular Plots; the distinction between New Towns and Sprawl cases attributed to the expression, connectivity and geometry of the Street Network.
In summary, cases attributed by literature to the same historic origin group are most consistently clustered together, which validates the analytical method proposed.
Further, we explore the least subset of the 207 variables that still accurately clusters cases in the four historic origin groups, i.e. the most discriminatory variables. We design a CBA to test the relative value of incrementally considering higher ranked variables in the model (Brereton, 2009). The analysis proceeds iteratively: in each iteration: (1) we divide the 45 cases into a test set and a training set: 28 cases (seven for each of the four historic origin groups) are randomly selected into the training test, the remaining 17 falling into the test set; (2) we apply the Fisher Weight discriminatory test, described in Supplemental materials (SR), to rank the variables in the training set from 1 to 207 according to their discriminatory contribution; (3) we take the first ranked variable and implement the Linear Discriminant Analysis on the test set to determine the per cent of cases that are correctly classified in their historic origin group; (4) we do the same for the first and the second variable and so fourth up the first 100 variables, every time recording the per cent of correct classification. We repeat steps 1–4 for 100 iterations. The result is a final ranking of the variables based on their average ranks over the 100 iterations. We then plot the percentage of cases that are correctly classified according to the historical origin groups they were attributed to by literature in the first place, as we add the variables along their ranking from the most to the least discriminatory (Figure 4).
Cost–Benefit Analysis (CBA) of the 100 higher ranked variables. Inset: Principal Component Analysis (PCA) of the 45 SAs along PC1 and PC2 (nine top-ranked CBA variables). CBA: Cost–Benefit Analysis; SA: Sanctuary Area.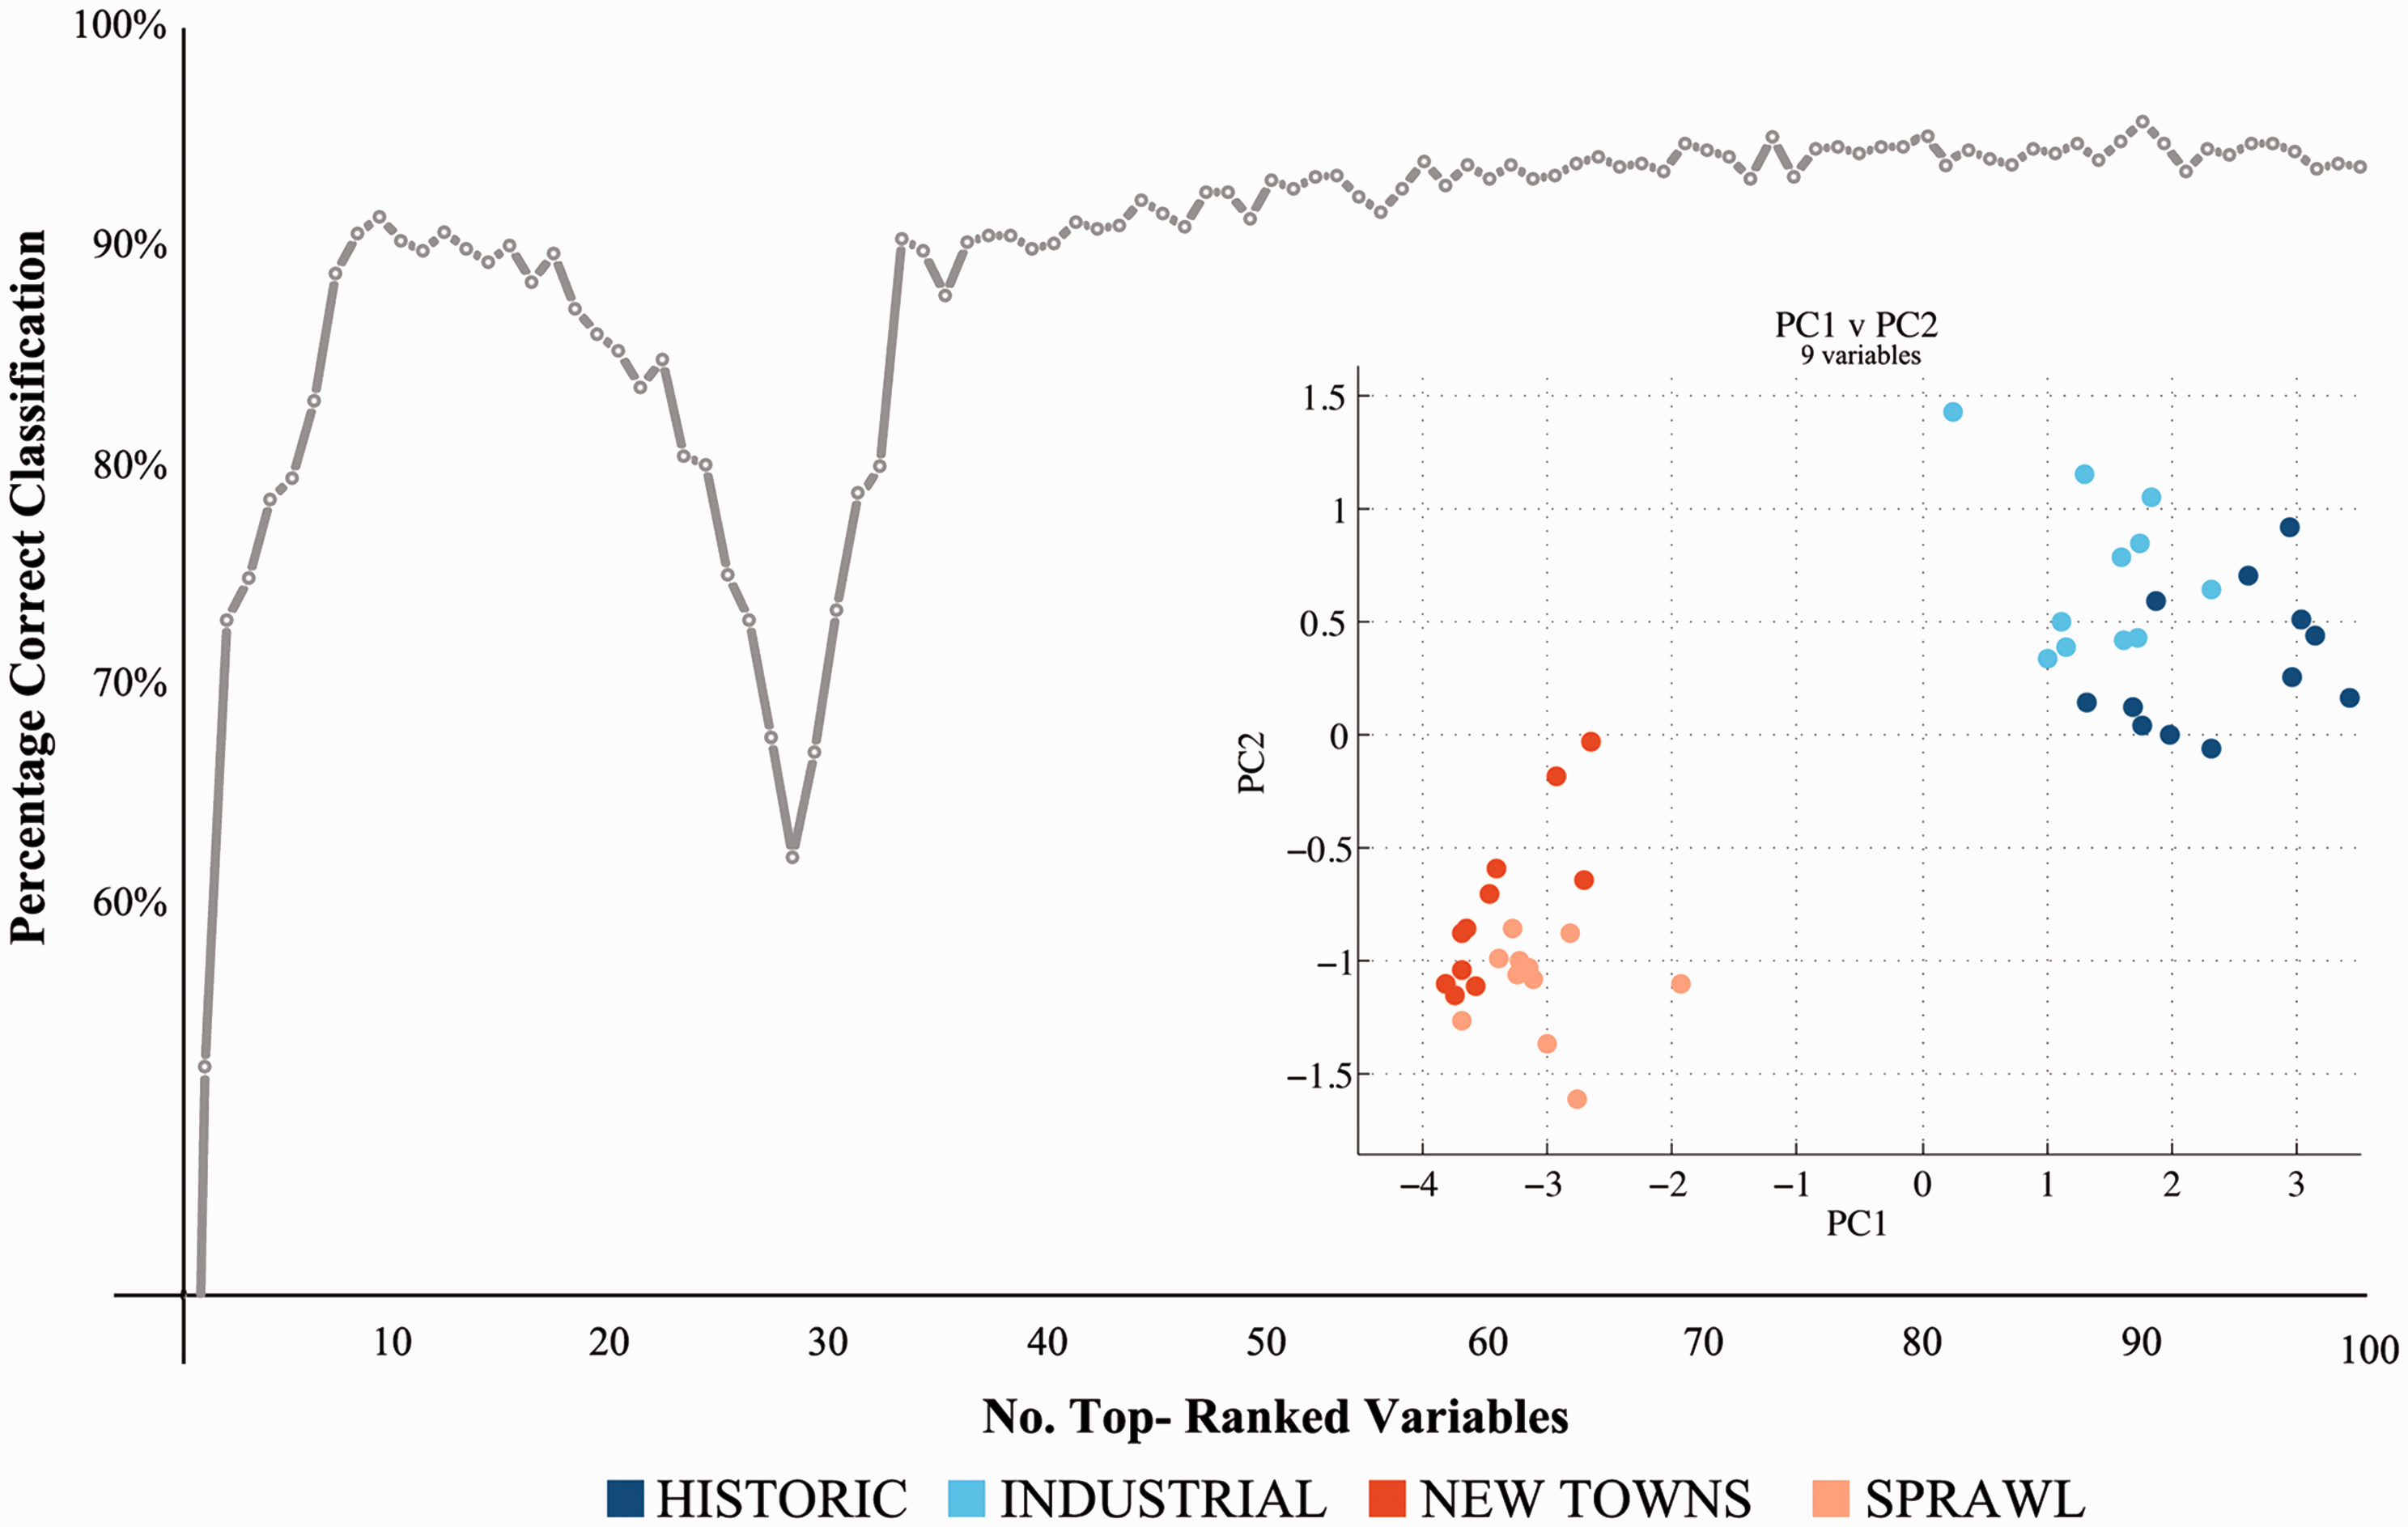
CBA: the nine top-ranked variables.

CBA: Cost–Benefit Analysis.

Diagrammatic illustration of the nine most discriminatory variables identified by the CBA. CBA: Cost–Benefit Analysis.
Fourth, the nine top-ranked variables actually describe only six characters of just two components of urban form: Buildings and Regular plots. What these results suggest is that, within the limits of this research, it is possible to capture the morphological identity of 45 SAs by looking at as few as three key spatial patterns: (a) block perimeterness: the extent to which buildings define the street edge along the block's perimeter; (b) building coverage: the extent to which a certain built volume is achieved by extending the footprint coverage on the land rather than the height of the buildings; (c) regular plot coverage: the extent to which blocks are made of plots directly facing the streets rather than carved into the inner space of the block. This finding, which is indeed scientifically elegant – or better ‘parsimonious’, in that it seems to ‘sum up a complex body of data in a relatively simple generalization (a pattern) [and therefore] to explain much with little’ (Simon, 2001: 33) – suggests that under the seemingly endless diversity of the visible appearance of urban areas there may exist a set of very few descriptors that, alone, express almost completely their historical ‘identity’, i.e. their belonging to a group of cases that are similar and historically characterised. We may call this set of fundamental descriptors the structure of urban form, a notion that echoes profoundly in an evolutionary interpretation of change. We would leave this generalization as hypothesis for further research, to be conducted over a much wider set of world SAs.
Similarity structure and post-WWII ‘bifurcation’
We implement a hierarchical clustering analysis (HCA) over the whole set of 45 SAs. HCAs are methods of expressing the relationship between OTUs and are common in systematics studies (Gordon, 1996; Legendre and Legendre, 2012), as detailed in Supplemental materials (SR). A typical output of HCAs is the ‘dendrogram’ visualization, i.e. a tree-like diagram that represents the similarity of entities among a group; entities are connected by lines of similarity: the height of the point where two lines join up is proportional to the grade of similarity that they exhibit with each other, where the greater the height the less similar they are. Our dendrogram (Figure 6), where the height is expressed along the x axis, reveals the similarity of SAs considering only the nine top-ranked variables in the CBA. Utilizing Ward's method (Ward, 1963) and considering the Euclidean distance between cases as a measure of [dis]similarity, the goodness of the fit of the clustering to the data can be measured with a Silhouette Coefficient (Kaufman and Rousseeuw, 2005): in our case a Silhouette Coefficient of 0.49 demonstrates the reliability of the dendrogram, as detailed in Supplemental materials S5.
Dendrogram representing the similarity structure of the 45 SAs, according only to the nine most discriminatory variables. SA: Sanctuary Area.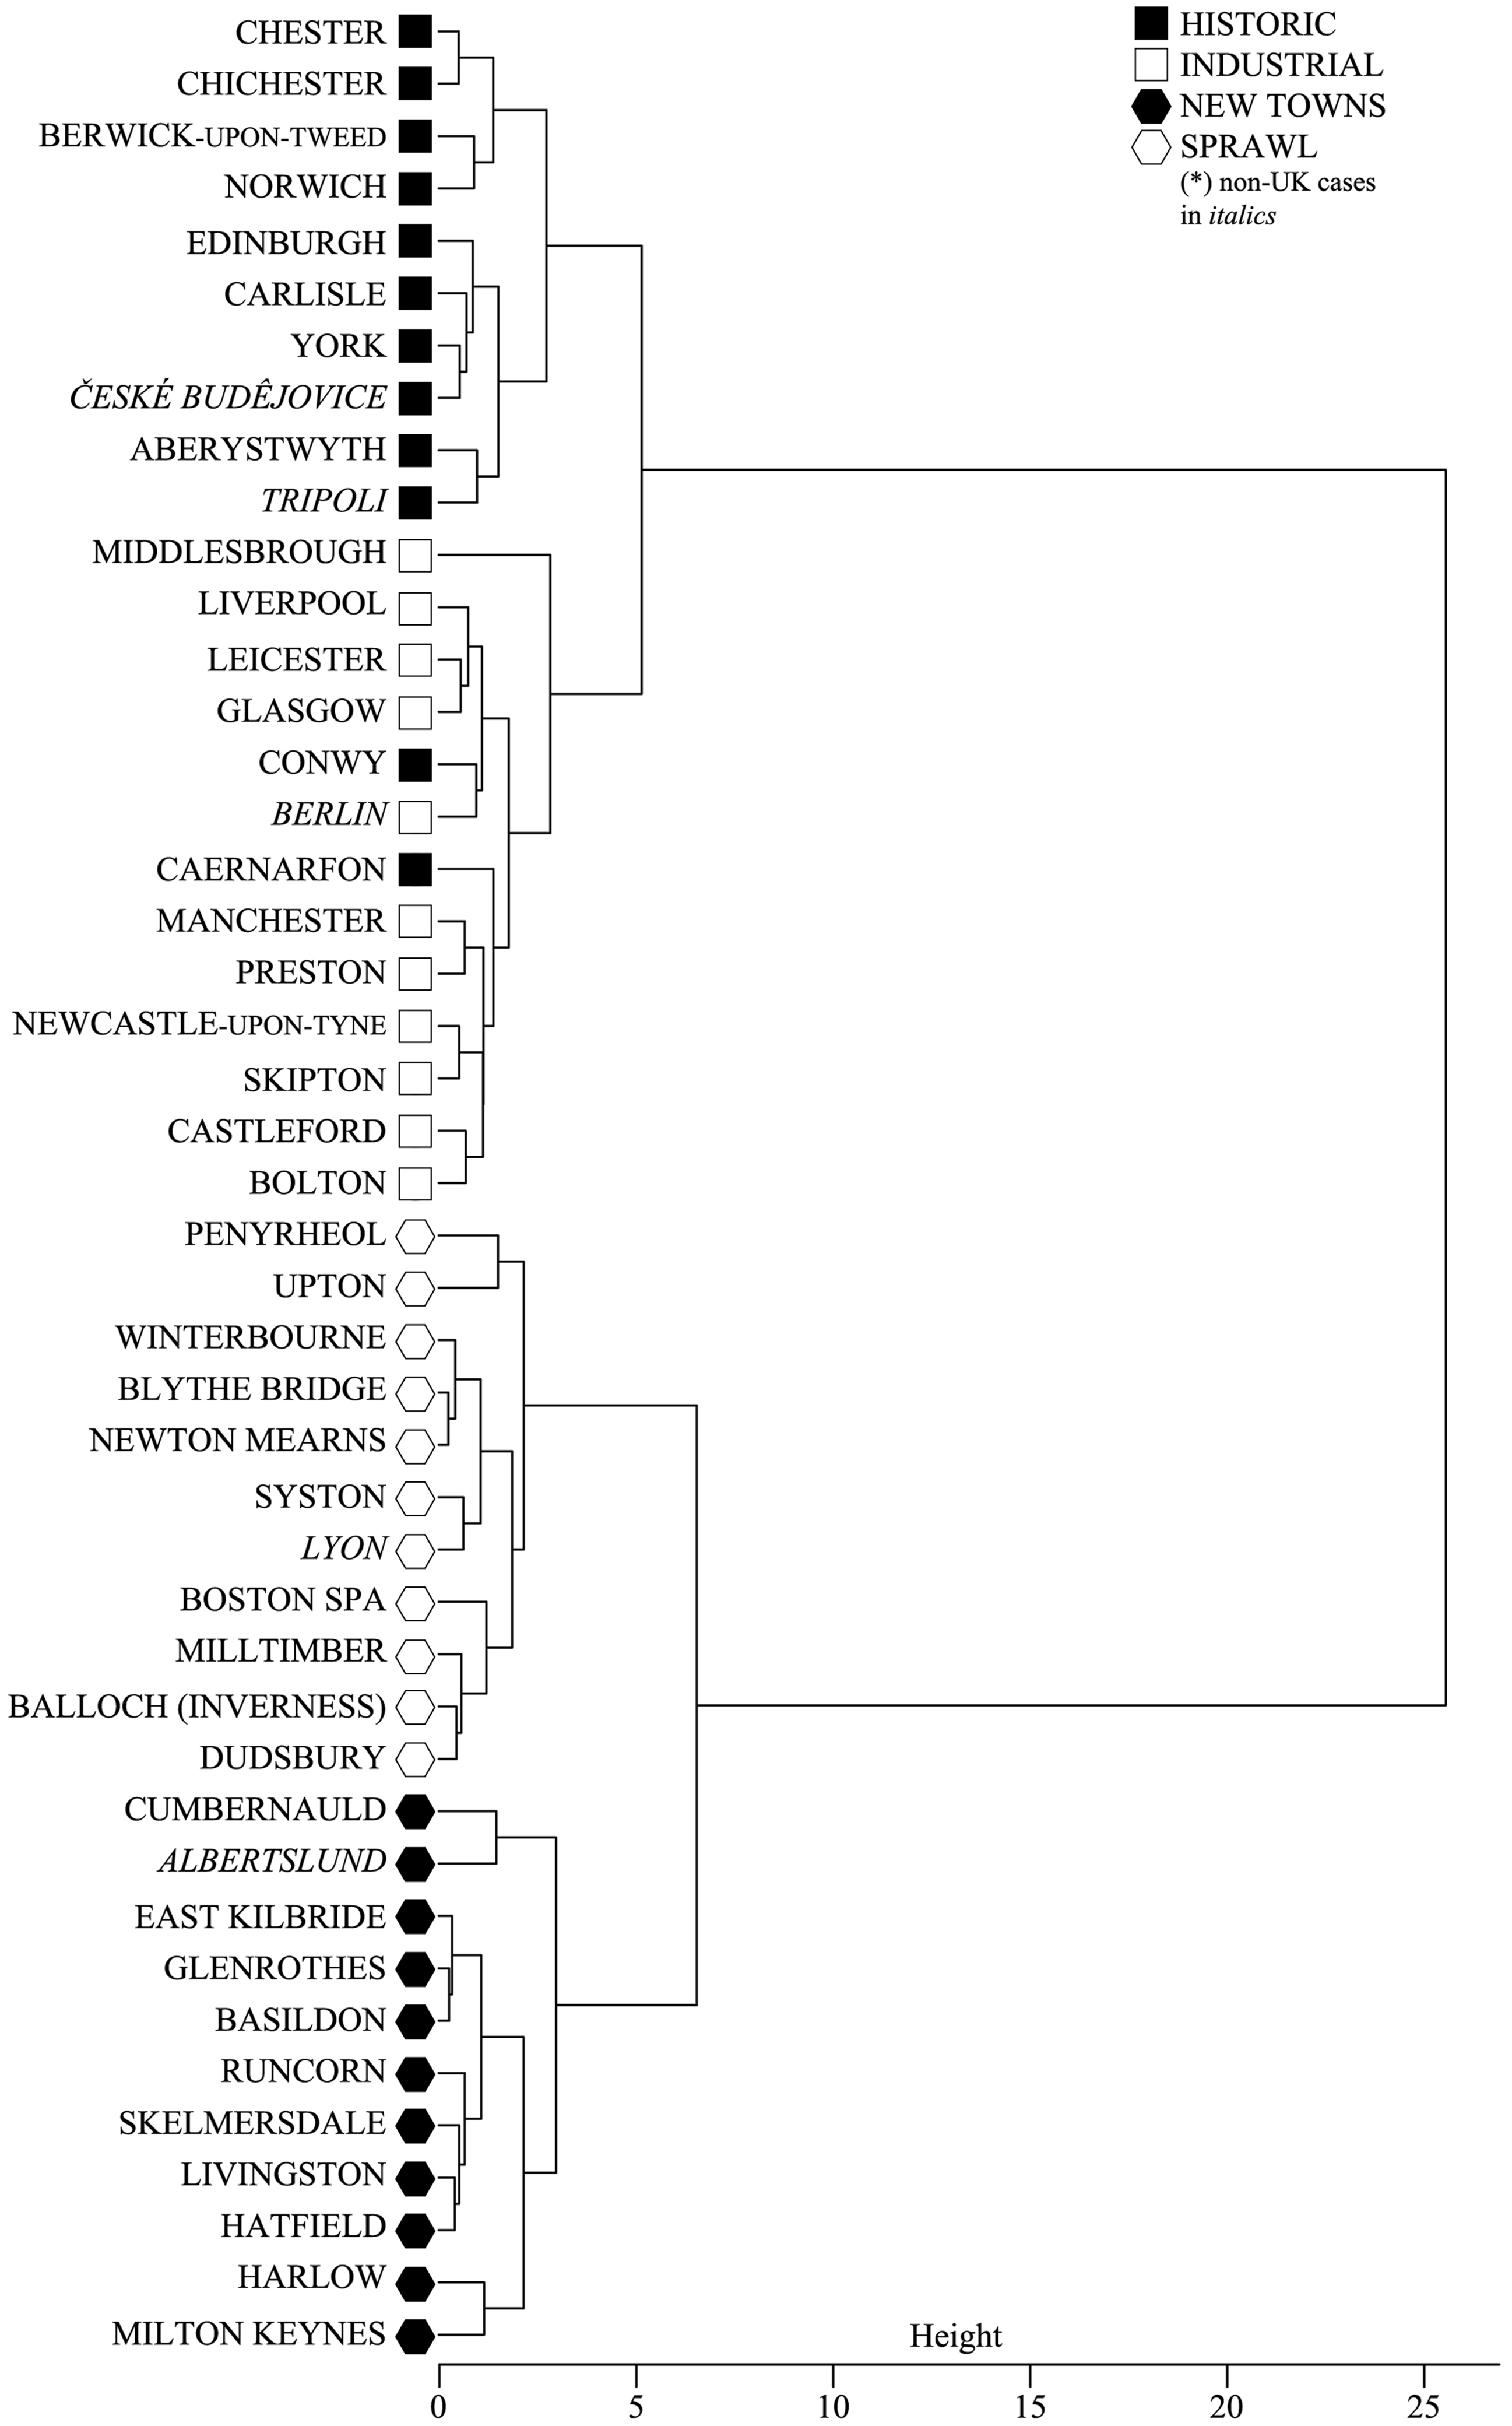
Looking at our dendrogram, we first observe that the clustering of cases among the four historic origin groups is nearly perfect, satisfying once more the conditions posed by the validation theory. Moreover, the dendrogram highlights a remarkable split between pre- and post-WWII cases. Again, while phenotypic similarity is not always congruent with phylogenetic relationships, it is nevertheless often an indication of them. Methods of estimating phylogenetic relationships amongst cases, which is the subject of cladistics, implement similar procedures as phenotypic studies but incorporate the additional variable of time in the calculation of similarity. Therefore, while it would be interesting to investigate more thoroughly the phylogenetic relationships between cases over time, it is acceptable to use the degree of phenotypic similarity as an estimation of phylogenetic similarity. In our case, the magnitude of the gap coupled with its neatness gives us a first indication that something occurred to cities after WWII that changed their profound structure and holds evolutionary relevance: with the emergence of a ‘new species’ of cities we may in fact be witnessing the first ‘bifurcation’ in urban evolution.
Conclusions: The organic analogy revisited
In the ‘Introduction’ section we stated that city dreamers, reformers, planners and designers have repetitively utilized the organic analogy to propose how cities ought to be; however, we argued that they have consistently followed a developmental rather than evolutionary form of the analogy. We justified this assertion from a disciplinary standpoint, but we highlighted that such approach deeply informed the crisis of both cities and city planning after WWII. We then presented an alternative form of the analogy, truly evolutionary, by introducing and testing urban morphometrics. We showed that cities have always evolved in variations of the same structure up to WWII when a new ‘species’ emerged – the modern city – generating the first bifurcation of urban history. Finally, the planning ideology – we stated – was crucially important in such historical occurrence. At first sight, such findings seem contradictory: if planners continued consistently in their developmental analogy, and they were influential in shaping urban form on the ground, how can we observe the bifurcation?
The science of biologic evolution increasingly seems to offer a fertile ground for the interpretation of phenomena that go beyond the boundaries of life (Pagel, 2009b), including for example cultural phenomena (Pagel, 2009a). We view cities as evolved cultural products whose shapes and forms represent the outcomes of tens of thousands of years of cultural selection for structures that serve basic human needs. To the extent that these needs are universal to our species, we expect to see similarities in form and function across space and time. On the other hand, a hallmark of human evolution is cumulative cultural adaptation (Pagel, 2012a), characterized by the successive accumulation of technologies and social complexity. Assuming that human needs have themselves changed with these cumulative social and technological changes, we shall then see new forms and functions emerging over time and then facing the challenge of selective pressure. Our findings suggest that in a proper evolutionary analogy the SA is a plausible OTU for urban form classification; consequently the SA is the urban form analogous of the living organism, which means that physical cities are the analogous of populations of SAs. Moreover, if a new species of SAs emerged after WWII, contemporary cities are the analogous of eco-systems of populations belonging to (at least) two different species: pre- and post-WWII. As a consequence we shall conceive change in urban form as that of an ecosystem along an evolutionary trajectory. As the process of change in biology is entirely different at the individual level (ontogeny) as opposed to the population level (phylogeny), equally we should not confuse the two when studying cities (Porta et al., 2016).
In a phylogenetic perspective, urban forms change when adaptive variations of their codes get established over time under the selective pressure of the external environment, where with ‘environment’ we mean the social, economic, cultural and properly environmental framework of urban change. The generative mechanism of such variations revolves essentially around errors – or innovations – in the replication of cultural codes, within and across scales; this essential mechanism appears to be one of ‘visual theft’ (Pagel, 2012b), or ‘imitation’ of pieces of cultural information, i.e. ‘memes’ (Dawkins, 2006, c. 1976). Because in the case of urban form such memes have a spatial nature, we shall call them spemes: spemes are stored in codes of urban form such as those captured by our 207 variables. When innovations occur, mutated spemes get established only if suitable conditions characterize the environment around them or are otherwise quickly abandoned. For example, the idea of the complete separation of different traffic vessels according to different transportation modes emerged well before 20th century's modernists/post-modernists’ urban theory (Buchanan, 1964; Sadler, 2005; Shelton, 2011) – it dates back to Filarete's Sforzinda and Leonardo da Vinci's Milan in the 15th century. However, the idea could not get established on the ground before the automobile became a matter of mass use for the expanding middle class of the post-WWII period: it was then those technological (the automobile) and socio/cultural (the rise of the middle class) ‘environmental’ innovations that radically modified the selective pressure on a sequence of new spemes, actually itself the evolution of other sequences such as the ‘neighbourhood unit’ (Perry, 1929). These environmental changes, among many others, for example the leap in scale of housing developing agencies and later the emergence of information and communication technology, made the street separation model acceptable and even convenient to a sufficient extent to be tested, extensively reproduced (by imitation) and ultimately established. In fact, Earth scientists are proposing that the cumulative effect of all innovations occurred in the past seven decades across various aspects of society, culture, production and economy is of enough magnitude to have ushered humanity into a new geologic epoch, the ‘Anthropocene’ (Ellis et al., 2013; Steffen et al., 2007), where human activities for the first time in history exert a tangible impact on Earth's fundamental natural forces, global warming being one such manifestations. While the origin of the Anthropocene has to be drawn back to the beginning of the industrial age, its impact started skyrocketing only after WWII configuring what is called the ‘Great Acceleration’ (Steffen et al., 2015). The Great Acceleration theory seems just the right explanation, at just the right scale, of a profound change in the environment around urban evolution, one that justifies the occurrence of the bifurcation revealed in this paper.
In this light, the reason why cities changed so abruptly their spatial structure after WWII is not because urban planners and designers changed their attitude, but exactly because they did not, while everything around them was changing at exceptional speed and unprecedented scale. The steady attitude of urban planners and designers continued to produce spemes which, previously practicable only in few exceptional cases, found in the roaring times of post-war global urbanization an ideal environment to prosper and spread at amazing speed. The large scale, highly professionalized industrial planning and construction system that Christopher Alexander named ‘System B’ (Alexander et al., 2012), which modern planning ideologies are at one time a product and a cause of, is the evolutionary outcome of a selective advantage determined by unprecedented environmental change, the cultural correspondent of a sudden glaciation, or a gigantic flood. Ultimately, the increasingly complex and specialized organization of the disciplines, professions and higher education in the post-WWII period, in itself an outcome of the evolution of the social systems (Luhmann, 1989) and another manifestation of the Great Acceleration, put ‘Palladio's children’ at work at scales and in areas of the building process never even approached in the past (Habraken, 2005). This fact effectively supported the establishment of a mainstream ‘authoritarian’ attitude (Hall, 2002, c. 1988) to urban planning that had been previously relegated to largely minoritarian niches of ideal city dreamers and early social reformists (Choay, 1997).
In conclusion, the Anthropocene sets environmental conditions to urban evolution that make the production of cities an extremely dangerous game for life on planet Earth, the rules of which cannot be approached ideologically, symbolically or mystically any longer. Historically, it is only now that urban planners and designers appear to acknowledge that Darwin actually existed and a new science of cities gives signs of emergence. A new approach to spatial urban change that makes value of adaptation and informal participation as fundamental components of how cities work is dramatically needed if the challenges of the ‘urbanization century’ are to be met. We have never been more in need of planning and design than now, and never more than now we have been in need of innovation in the way we conceive urban planning and design. This paper is a contribution to such historical mission.
Research data availability
In compliance with the Open Access policy of the University of Strathclyde, the accepted version of this paper is available in Strathprint (http://strathprints.strath.ac.uk).
Footnotes
Declaration of conflicting interests
The author(s) declared no potential conflicts of interest with respect to the research, authorship, and/or publication of this article.
Funding
The author(s) disclosed receipt of the following financial support for the research, authorship, and/or publication of this article: The research base for this paper has been developed as part of Jacob Dibble’s PhD studies, supervised by Prof. Sergio Porta at University of Strathclyde. Jacob’s PhD studies were jointly supported by The Prince’s Foundation for Building Communities, Architecture and Design Scotland, and the University of Strathclyde Scholarship programme. No other authors apart from Jacob Dibble received financial support for the research, authorship, and/or publication of this article.
Supplemental material
Supplemental material is available online for this article.
References
Supplementary Material
Please find the following supplemental material available below.
For Open Access articles published under a Creative Commons License, all supplemental material carries the same license as the article it is associated with.
For non-Open Access articles published, all supplemental material carries a non-exclusive license, and permission requests for re-use of supplemental material or any part of supplemental material shall be sent directly to the copyright owner as specified in the copyright notice associated with the article.