
Abstract
Over the next 35 years, the population of Switzerland is expected to grow by 25%. One possible way to accommodate this larger population is to transform smaller cities in Switzerland through the direct intervention of urban planners. In this work, we integrate agent-based simulation models of people flow, mobility and urban infrastructure with models of the electricity and gas systems to examine the increase of the density of existing residential zones and the creation of new workplaces and commercial activities in these urban areas. This novel simulation framework is used to assess, for the year 2050, two different scenarios of urbanization in a region with small urban areas. It is shown that a densification scenario, with a preference for multi-dwelling buildings, consumes 93% less land than a sprawl scenario, with a preference for single-family houses. The former scenario also accommodates 27% more people than the latter scenario, as there is a higher penetration of battery electric vehicles – and therefore reduced air pollution from the transportation sector – and also a larger shift of commuters to the use of public transport. However, in the former scenario, the commuting time is 20% longer. The outcome of this work demonstrates how this novel simulation framework can be used to support the formulation of policies that can direct the transformation of urban areas.
Introduction
Globally, Switzerland is rated to be one of the countries with the highest quality of life (Economist Intelligence Unit, 2013; Organisation for Economic Co-operation and Development, 2015). This is attributed to a combination of factors, including its small population (8.08 million in 2013), strong economic power (GDP per capita of EUR 80'734), efficient infrastructure (4492 km of rail line, 71,052 km of roadways and two large international airports in a land area of 41,285 km2) and political system of direct democracy since 1848. Switzerland's population is expected to increase from 8 million to 10 million inhabitants by 2050 (Swiss Federal Office for Statistics, 2015a). This 25% population increase that shall mostly take place in urban centers could have significant impacts on the status quo. On one side, depending on the population demographics, the aging trend of the population could reduce or increase, therefore making it more difficult to support through the social security and pension systems (Swiss Federal Council, 2011). On the other side, there could be negative impacts, for example, on traffic, availability of jobs, accessibility to services and infrastructure capacity.
Switzerland has to plan the evolution of its cities to provide for the accommodation and services of the future population. One possible evolution pathway is to expect a significant population growth in the largest cities of Zurich, Lausanne, Geneva, Bern, and Basel (Figure 1), primarily from a young population that immigrates from other countries, while the peripheral and rural localities expand due to the increase of low-density areas composed of single family houses, as has been observed over the last 30–40 years. Another possible evolution is the development of smaller cities in Switzerland. These smaller cities could be transformed through the direct intervention of urban planners, by increasing the density of the existing residential zones, and simultaneously creating new workplaces and commercial activities inside these localities. An outcome would be reduced land consumption and the exploitation of existing land reserves outside these cities. Therefore, the objectives of this work are: (i) to quantitatively compare the cost and benefits of different feasible transformations of small urban areas in Switzerland and (ii) to identify the policy measures that will enhance the attractiveness of these small urban areas.
Map of the Olten–Aarau focus area. The inset shows the location of the focus area in relation to Switzerland's five largest cities.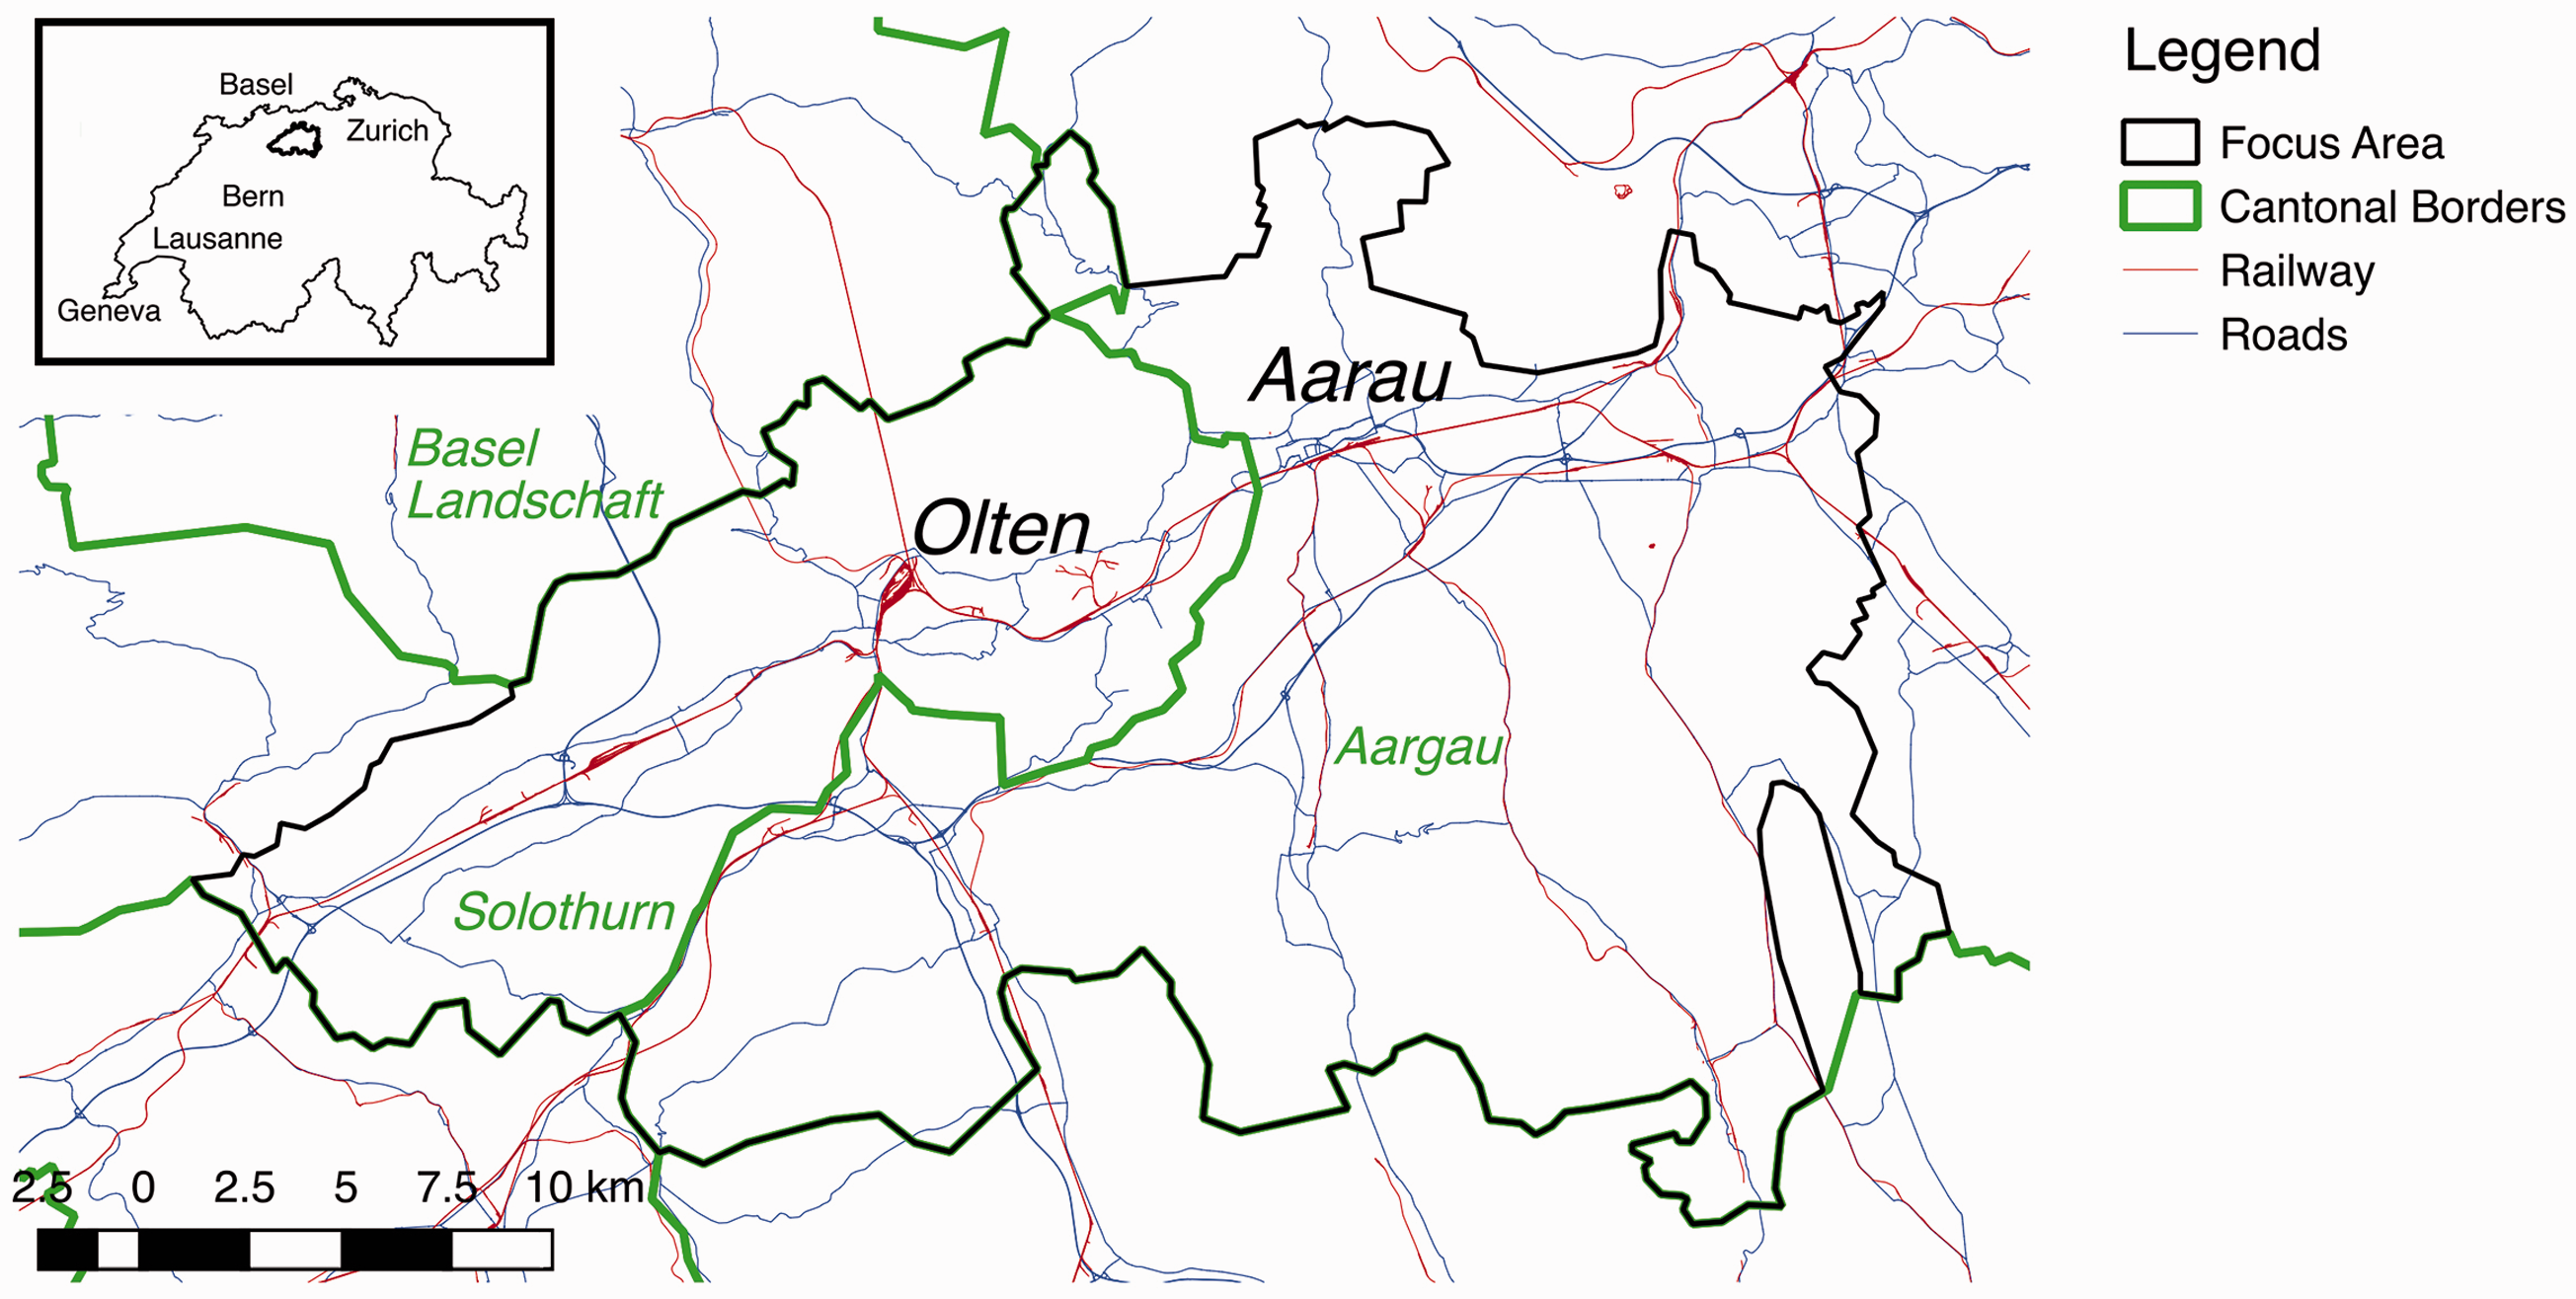
The area between Olten and Aarau, Figure 1, which is at the intersection of the three cantons of Solothurn, Aargau, and Basel-Landschaft, is a region that may evolve under the second possible pathway. The Olten–Aarau area is at the crossroads of the highways and railways that connect three of the Switzerland's largest cities: Bern, Zurich and Basel, and for this reason it has a high proportion of commuters (Swiss Federal Office for Statistics, 2015b). The percentage of exiting commuters is 39% for canton Solothurn and 34% for canton Aarau. By comparison, canton Zurich has 10% of exiting commuters.
In order to quantify in detail the impact of the urban structure and services on the activities of a population, the inhomogeneity of the population and the differences between individuals must be accounted for. Agent-based models are one approach to account for differences between individuals. Bonabeau (2002) and Helbing (2012) provide recent reviews of agent-based models and their applications in diverse fields including policy-making, economics, urban development, and transportation. Batty (2007) and Helbing (2010) distinguish agent-based models as simplified models, which are primarily used to understand social mechanics, and detailed models, which can reproduce complex human interactions. The basis of simplified agent-based models is described in Chattoe (2001). Some applications of simplified agent-based models include Favreault and Smith (2004), Sundenberg (2007), and Evandrou et al. (2007) who assessed the impact of retirement and aging. While these studies have provided some useful insights regarding potential changes to the characteristics of the population and to the structures of families, these studies do not consider urban and geographic factors. Barredo et al. (2003) used a simplified agent-based model to simulate urban growth; however, changes in demographic behavior were not accounted for. Helbing and Nagel (2004) used a simplified agent-based model to account for changes in the population to regional development. Nevertheless, as simplified models do not account for complex human interactions, it is considered that the insights gained are of limited usefulness in quantifying local impacts (Helbing and Balietti, 2010). The work of Waddell (2002) is among the most widely known of detailed agent-based models. Waddell (2002) integrated demographic models with an urban development model in order to be able to assess changes in the real estate market due to the simultaneous evolutions of the population and the urban environment. Using such a simulation system, urban quality has, for example, been assessed in San Francisco and Seattle (Waddell, 2009) and in Brussels, Paris and Zurich (Bierlaire et al., 2015). Common to these assessments is that the spatial extent is limited to a single city and the spatial resolution is at the parcel level. Another application of detailed agent-based models is the assessment of human behavior related to transportation. The Federal Highway Administration – US Department of Transportation (2013) describes a series of studies in which population placement models are used with multi-agent traffic simulations to quantify the impact of demographics on traffic. Among these studies, Nagel et al. (1999) focused on transportation planning within the context of the deployment of intelligent transportation systems, Pendyala et al. (2005) assessed transportation demand forecasting and planning, and Salvini and Miller (2005) focused on transportation and land-use. However, the multi-agent traffic simulation models used in these prior studies were computationally very demanding, and thus the simulation models are unsuited for assessments that have both large networks and large populations.
It is evident from above that notwithstanding the developments in different applications of multi-agent models, in order to address questions concerning the transformation of populations in small urban areas, there is a need for a holistic framework in which the different elements of urban and transportation infrastructures can be simulated, and the complex interactions between land usage, availability of dwellings, commuting time and quality of life can be assessed. In order to address the above-mentioned shortcomings of previous works, in the present work, a novel holistic simulation framework is developed and is used to assess the impacts of different demographic transformations in small urban areas. The specific contributions of the present work can be summarized as follows:
Multi-resolution spatial analysis, whereby the spatial extent of a whole country is simulated at the spatial resolution of single dwellings, is conducted within the holistic simulation framework. Thus, it is possible to quantify, in detail, the local impacts of the different transformations. The development of real estate is modeled in a market-realistic manner. In this regard, within the holistic simulation framework, the evolution of the small urban areas is based on the actual local urban development plans, and on an analysis of the existing built environment, infrastructure, and needs of the population. In order to accurately account for the impacts of human behavior on transportation infrastructure, we integrate into the framework a computationally efficient traffic simulation model that is suited for large networks. Within the holistic simulation framework, quantitative analysis, in terms of land usage, availability of dwellings, commuting times, and quality of life, is combined together with a qualitative characterization of urban areas. Thus, the outcomes are of interest both to policy makers, as well as urban planners and urban developers.
Thus, the paper is organized as follows. In the next section, the methodology is described in detail. Then, the simulated scenarios are presented. The outcomes of the scenarios are next analyzed in relation to the impacts on land consumption and commuting times. In the conclusions section, the policy measures that may enhance the attractiveness of the urban centers are discussed.
Methodology
In the present work, we extend our in-house developed simulation framework, EnerPol, with agent-based models that simulate the movement of the population and traffic (Figure 2). EnerPol is a bottom-up simulation framework that has been in development since 2009, and is used with scenario-based assessments to support decision-making and development of energy policies for the transition to the use of low-carbon energy technologies. Prior to the present work, in the EnerPol framework, system-wide (i.e. on the scale of a country or continent) assessments of electricity and gas infrastructures were made using databases and models with high spatial (on order of tens of meters) and temporal (sub-hourly) resolutions. In this regard, the generation, transmission, and demand in electricity and gas systems are simulated (Eser et al., 2016; Singh et al., 2013), for different scenarios, in order to determine the generation mix and transmission infrastructure that yield the lowest cost of electricity, and to assess the adequacy of the gas infrastructure. EnerPol’s electricity model of Europe is comprised of 11,575 power plants, which are distinguished by technology – conventional (biomass, natural gas, coal, lignite and nuclear) and renewable (pumped storage and run-of-river hydro, solar and wind), 277,500 km of high-voltage transmission lines, and 2951 TWh of demand that is temporally and spatially differentiated by commercial, domestic, industrial and transportation end-use. EnerPol’s European gas model consists of 58 gas storages and LNG stations, 44,000 km of pipelines and 91 compressors, and the demand of the aforementioned end-use sectors. The population and other end-use sectors are aggregated with a spatial resolution of 30 meter by 30 meter in order to model the energy demand (Singh et al., 2015). EnerPol’s scenario-based assessments utilize simulations of the electricity and gas systems with hourly resolution and over a minimum time period of one year, that is 8760 hourly simulations per year. As the prior EnerPol framework was limited to energy infrastructure and covered neither urban nor transportation infrastructures, the well-established databases and models were used as the basis for extending the framework, as is discussed in the next sections.
Overview of EnerPol simulation framework. In the present work, the framework is extended with urban and transportation modules.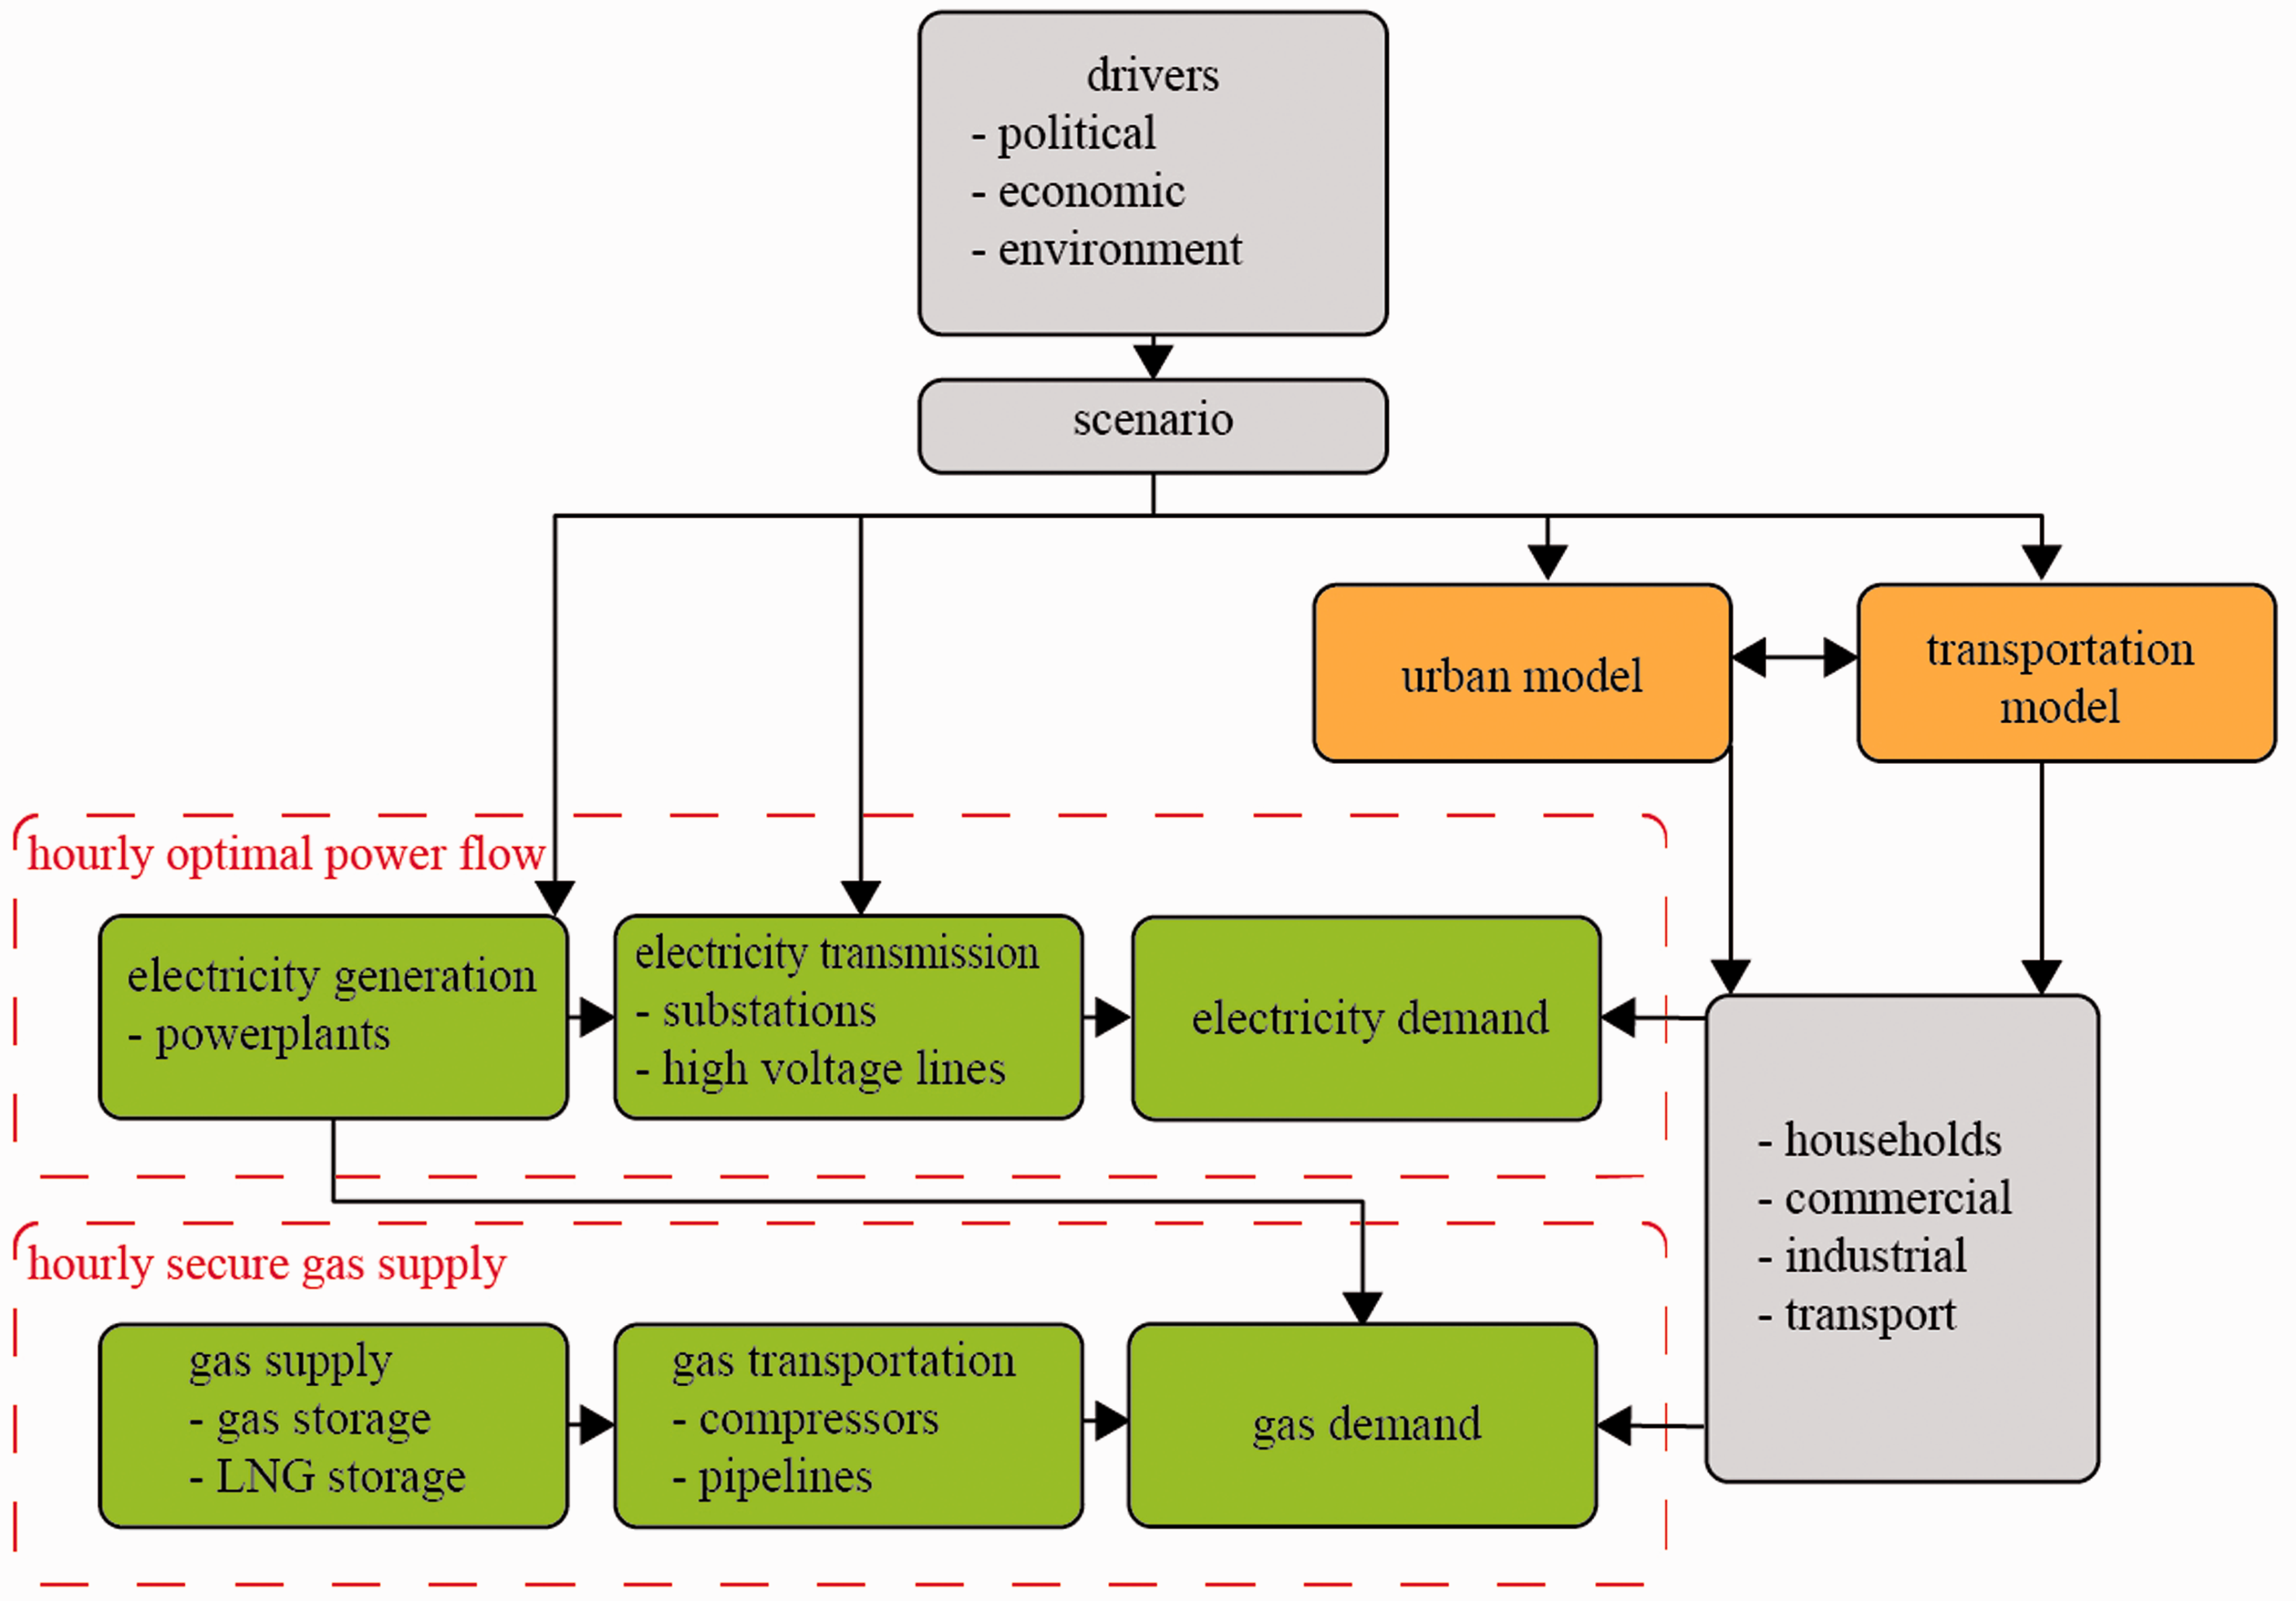
Database structure
The extension to the EnerPol framework involved the addition of agent-based models to simulate (i) the evolution of built environment; (ii) the placement of the individuals of a population in households and the location of personal activities (such as, shopping, eating, etc.); and (iii) the transportation of the individuals. In order to be able to represent each agent and to simulate each agent’s decision-making or transformation, it was necessary to extend the existing EnerPol database with data for demographics, the built environment, and the transportation infrastructure. Thus an extensive geo-located database of Switzerland was developed. The building database used is the SwissTLM3D database (Swiss Federal Office of Topography, 2016), which has a spatial accuracy of 0.2–1.5 m. For the assessment of activities in the built environment and of commercial activities, the database includes the Federal Registry of Commercial Activities (Swiss Federal Office for Statistics, 2013) and the Federal Registry of Residential Buildings and Dwellings (Swiss Federal Office for Statistics, 2015c) for all Switzerland, and the Cadastral Data and Area Planning (in German, Nutzungsplan) for the municipalities in the cantons of Argau, Solothurn and Basel-Landschaft. The road network is obtained from the open source database of OpenStreetMap (OpenStreetMap 2015), while the public transport network is derived from the official timetable of the Swiss Federal Railways. The daily patterns are based on the Mobility and Transport Microcensus (Swiss Federal Office for Statistics, 2012). Finally, municipal and hectare statistics of population and economic activities (Swiss Federal Office for Statistics, 2014) are included in the database in order to define households and to differentiate between demographic groups.
Simulation framework
The agent-based models that are integrated into the EnerPol framework (Figure 2) are next discussed.
Built environment
An agent-based model, which accounts for demographics and geographic location, is developed and used to simulate the transformation of the built environment under different scenarios. While the spatial extent of the model is the area of interest, the transformation of the built environment is specified at the scale of municipalities, as it is at this scale that urban planners assess scenarios for potential development. Notwithstanding, in the model the individual buildings within the municipalities are modeled. The inputs to the model are based on the population growth rate for each municipality and the potential areas for development in the municipality. The population growth rate is used to determine the demographic distribution in each municipality, with the perspective that smaller urban areas will be more attractive to younger individuals than to older individuals. Specifically, in the area of interest the population younger than 40 years of age is assumed to have a growth rate that is 20 times larger than the growth rate of the population older than 40 years of age. The number of available jobs is scaled in proportion to the active population, with the assumption that Switzerland’s historical total unemployment rate of 3.5% (Swiss Federal Office for Statistics, 2014) is unchanged. The potential areas on which buildings and dwellings can be developed to accommodate the increased population are derived from hectare statistics and the Nutzungsplan of the municipalities. Furthermore, existing buildings are considered, and are assessed in terms of the density of buildings and of the industrial areas that have a low density of employees, which therefore may be suitable for conversion into residential areas. Thus in the transformation of the built environment, four area typologies are considered: (i) the expansion onto unbuilt land; (ii) the densification of low-density areas; (iii) the reuse of unused industrial areas; and (iv) the exploitation of public areas. Each typology is associated with a different ratio of total building floor surface to land surface that is termed Ausnützungziffer. Local regulations and development plans define the Ausnützungziffer. Therefore, the Ausnützungziffer is considered in the scenarios that we assess below. Furthermore, the probability of choosing a given typology also depends on the intended outcome for the potential areas for development in the scenario under consideration. Nevertheless, as enhancing the attractiveness of small urban areas is an overall goal, the choice of typology is prioritized to provide a higher quality of living to residents of the dwellings. Planners can define the parameters used to quantify ‘quality of living’. In the present work, the ‘quality of living’ has been specified in terms of the proximity to stops for public transport, the proximity to natural areas, such as forest or lakes, and the density of services and schools.
Population placement
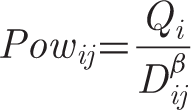
An agent-based model, which accounts for economic, geographic and urban factors, is developed and used to simulate the structures of families. From the demographic information, the population agents are created. Households, that is, groupings of population agents, are placed in existing or new buildings based on the population distribution in the hectare statistics of family composition and the age distribution of each municipality. In a first step, the potential dwellings for the different households are identified as a function of the characteristics of the dwelling and the requirements of households. Then, in a subsequent step, the population agents are assigned to a household, starting first with the working population who must economically support the household, and then completing the household with population agents from the non-working population (pensioners, children and unemployed persons). The placement of the working population is based on the number of employees in the commercial and industrial sectors. And, the workers are linked to the available households using a gravity model (deBlij et al., 2012; Rodrigue et al., 2009), which accounts for the work-to-house distance and the availability of dwellings. The attraction power

Traffic simulation
MATSim, an agent-based traffic simulation model, is integrated into the EnerPol framework in order to simulate population movement and traffic. In contrast to the aforementioned agent-based traffic simulation models, Nagel et al. (1999), Pendyala et al. (2005), and Salvini and Miller (2005), MATSim is computationally more efficient and better suited for large networks and populations. While more complete details of MATSim can be found in Horni et al. (2016), MATSim’s salient features are summarized here in a description of our implementation of MATSim’s simulation process.
First, the daily plans of the agents, the transportation network, and the locations with activities are modeled. The daily plans are a function of the age and main activity type of the agents and are based on data from Switzerland’s Mobility and Transport Microcensus (Swiss Federal Office for Statistics, 2012). Within a distance of 500 m from the dwelling place of an agent, the agent’s probability of choosing a public or private mode of transportation is assumed to be proportional to the agent’s distance from a public transport stop and to the frequency of the public transport. Then, the daily plans are simulated in MATSim. Both private and public transportation are simulated with a temporal resolution of 1 second for a simulation period of one day. At each second, the location and the activity of each agent are simulated. In a third step, all daily plans are scored with a utility function that for example assigns a higher utility to an agent with a shorter travel time. A co-evolutionary algorithm is used to replan the daily plans of a subset of the agents. The objective of the algorithm is to modify characteristics such as the routes, time spent at work, the transportation mode, the locations with activities, etc. of the agents such that the utility of the agents is increased. The steps (ii)–(iv) are then iteratively repeated, and the plans with low utility discarded in each iteration. At equilibrium, the iterative process is then completed. The results of the simulations are then evaluated to assess for example, commuting times, statistics of road usage, including number of vehicles, road congestions and bottlenecks. The locations of agents are also assessed on an hourly basis, as this is the temporal resolution of EnerPol’s electricity simulations; therefore constraints in the electricity network can also be evaluated within EnerPol’s holistic framework. Furthermore, using the Emission Inventory Guidebook (European Environment Agency, 2016), air pollution due to car emissions is evaluated, and noise from vehicles is also modeled following ISO 9613 (International Standard Organization, 1996).
Scenarios
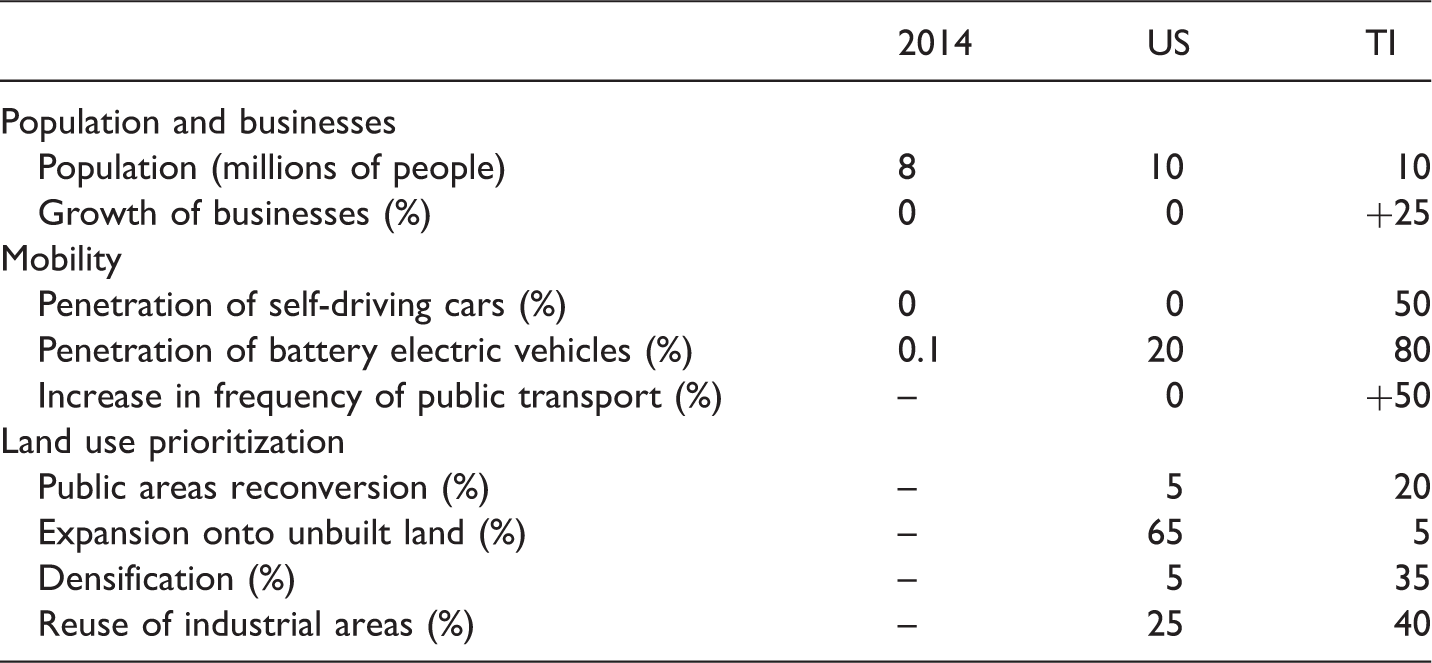
Summary of salient characteristics of the Urban Sprawl (US) and Technology Insertion (TI) scenarios, compared to the year 2014.
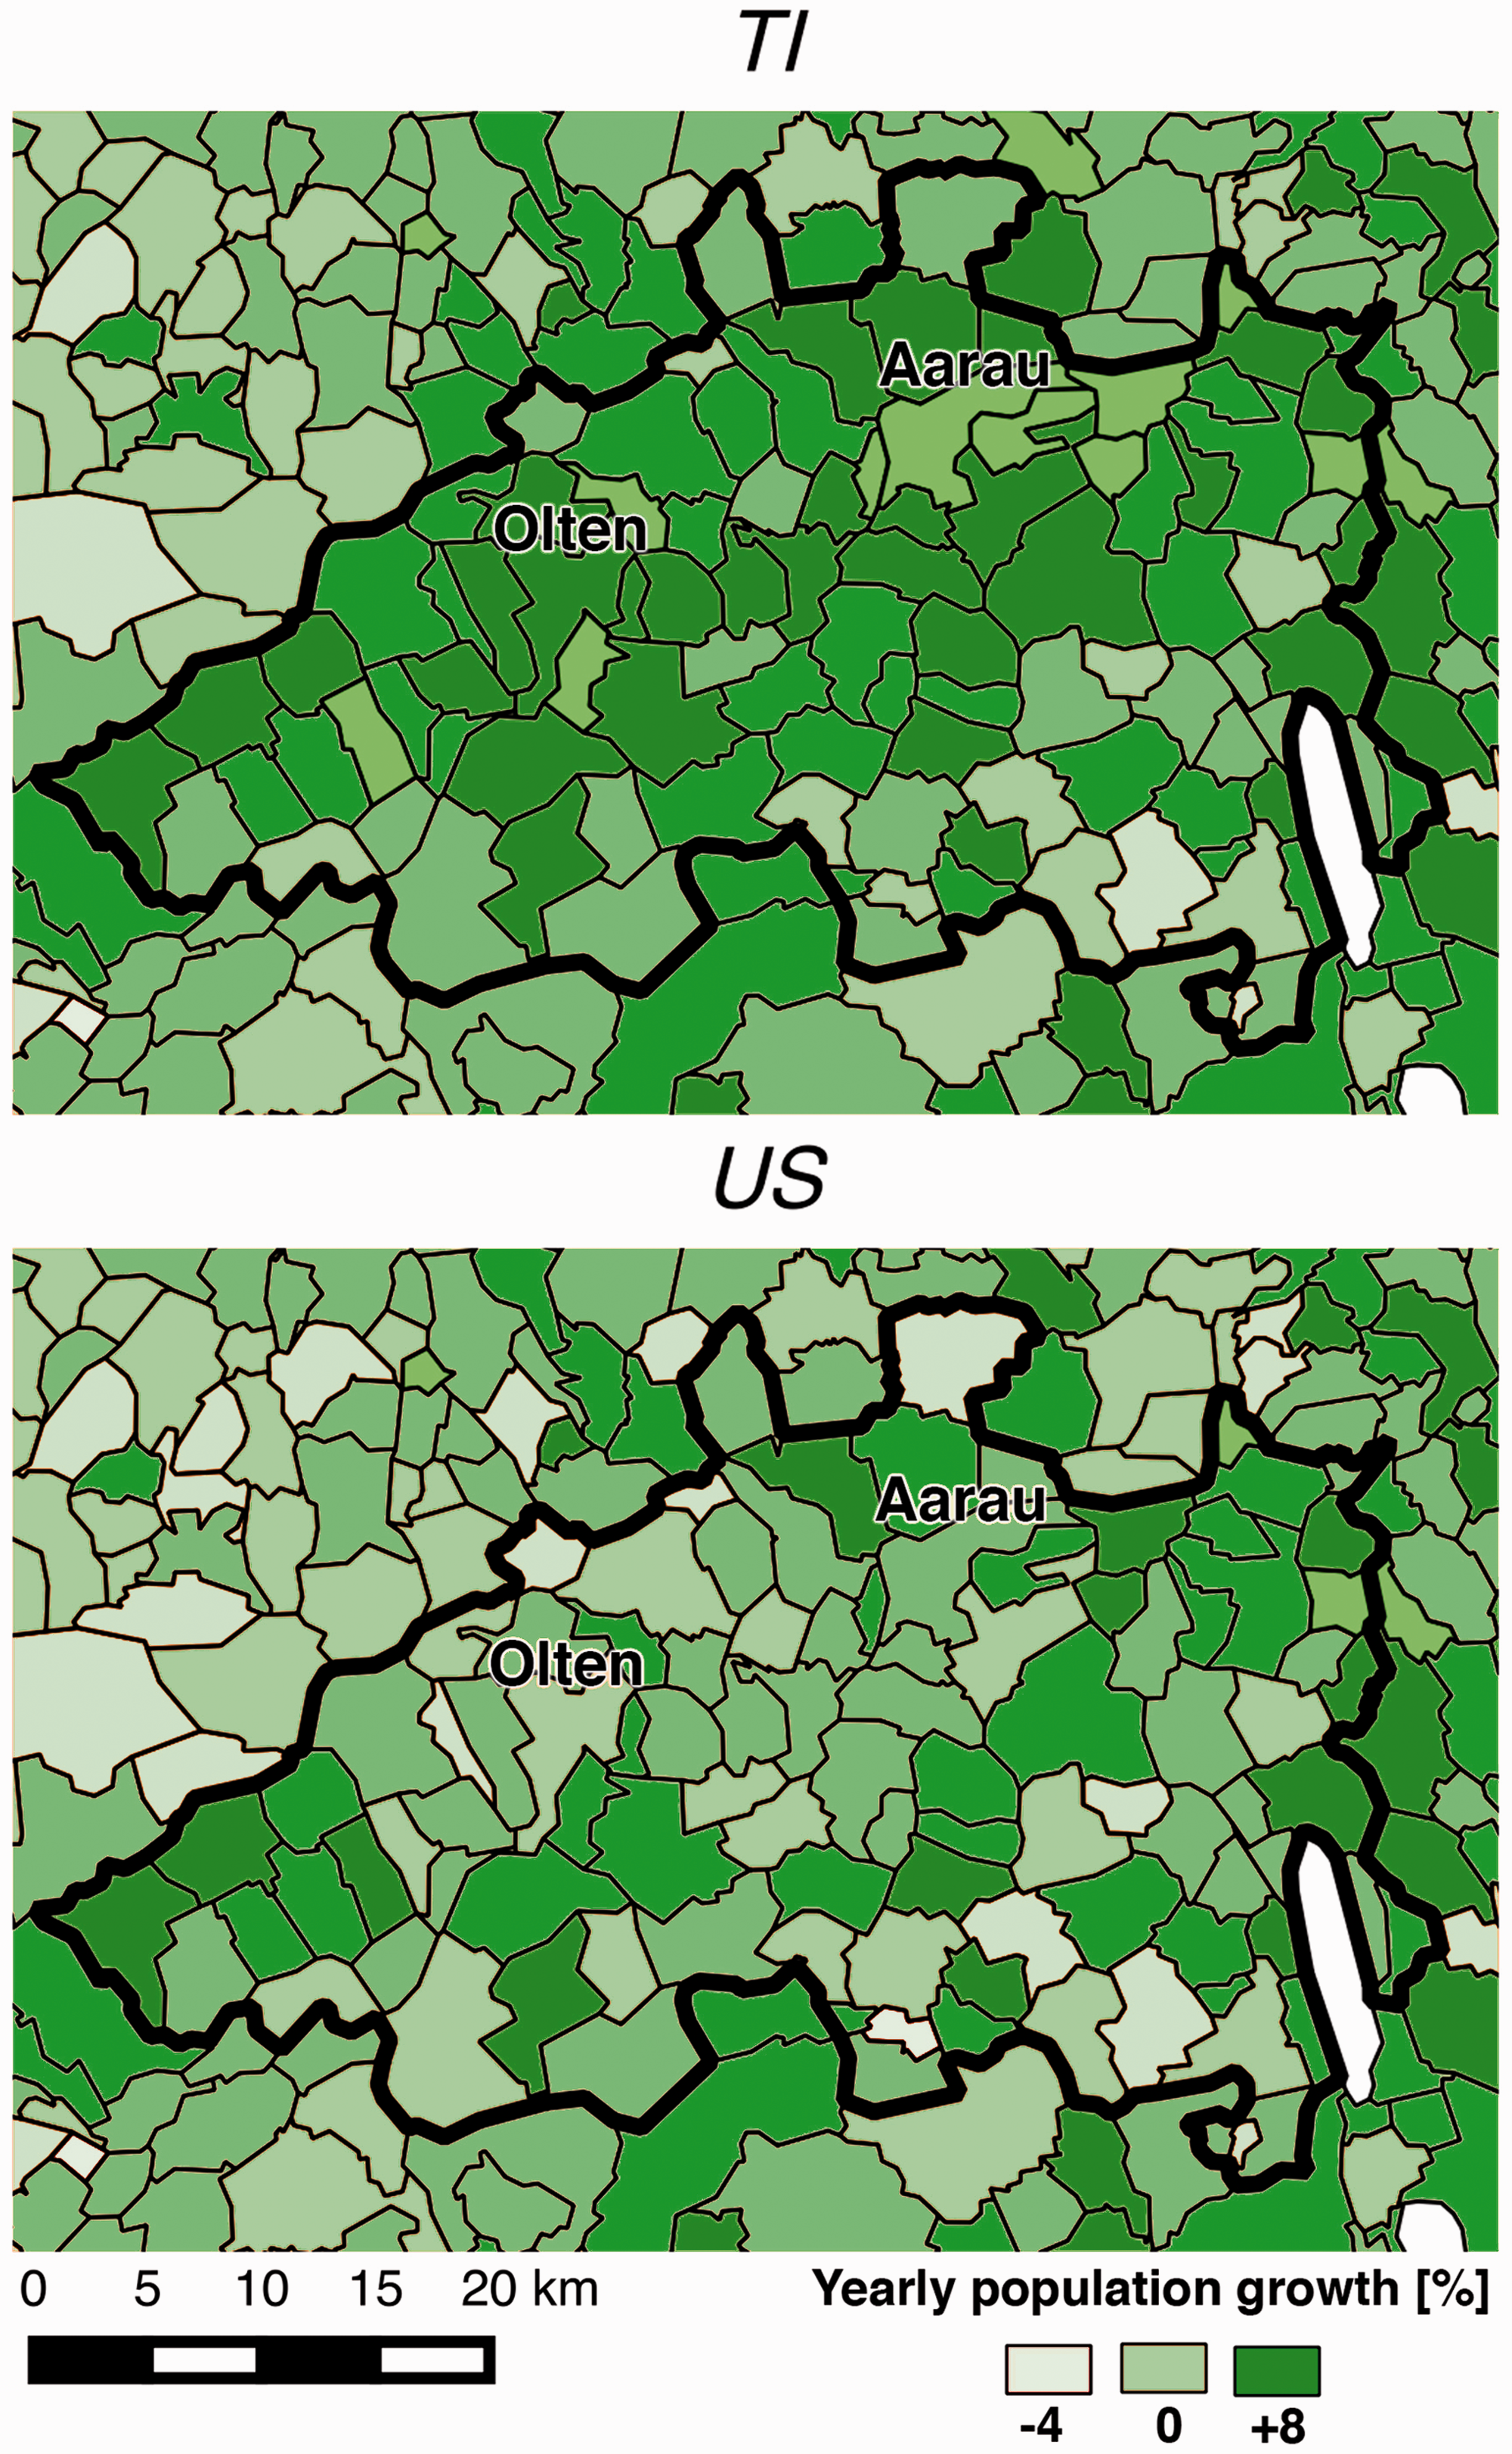
Projected yearly population growth for municipalities within the study area in the Technology Insertion (TI) and Urban Sprawl (US) scenarios.
Results and discussion
Impact on land consumption
Population (number of people) and total land consumption in 2014 and in the Urban Sprawl (US) and Technology Insertion (TI) scenarios.
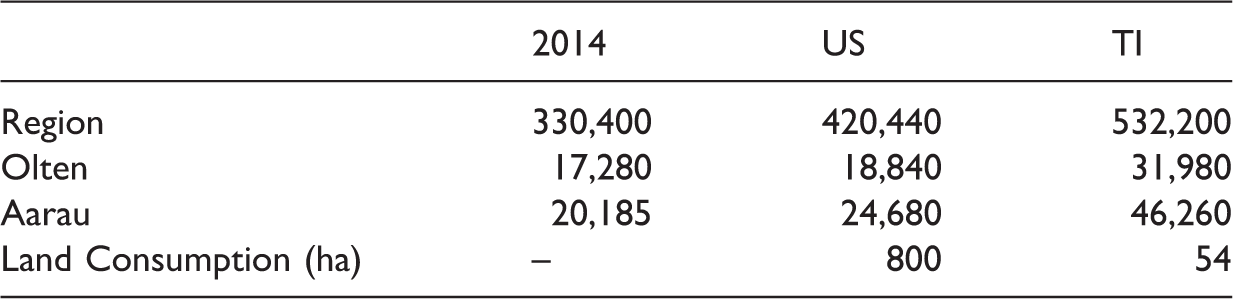

Comparison of the local land consumption in the Technology Insertion (TI) scenario and Urban Sprawl (US) scenarios.
Impact on commuter behavior
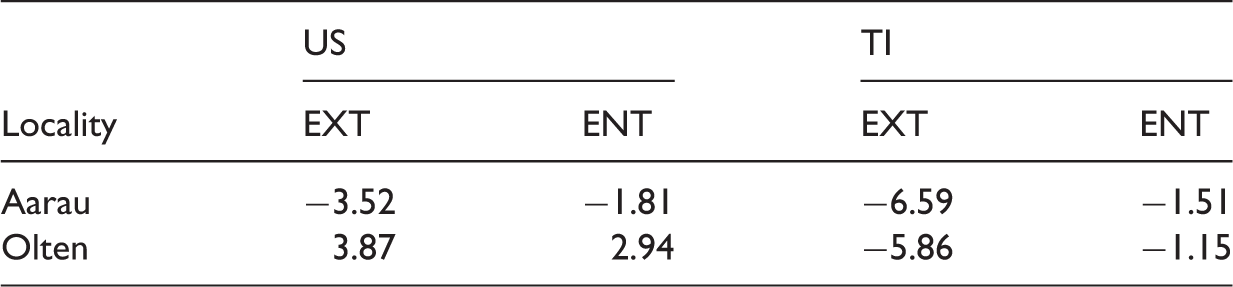
Change in commuting direction relative to 2014 (%) for exiting (EXT) and entering (ENT) commuters in the Urban Sprawl (US) and Technology Insertion (TI) scenarios.
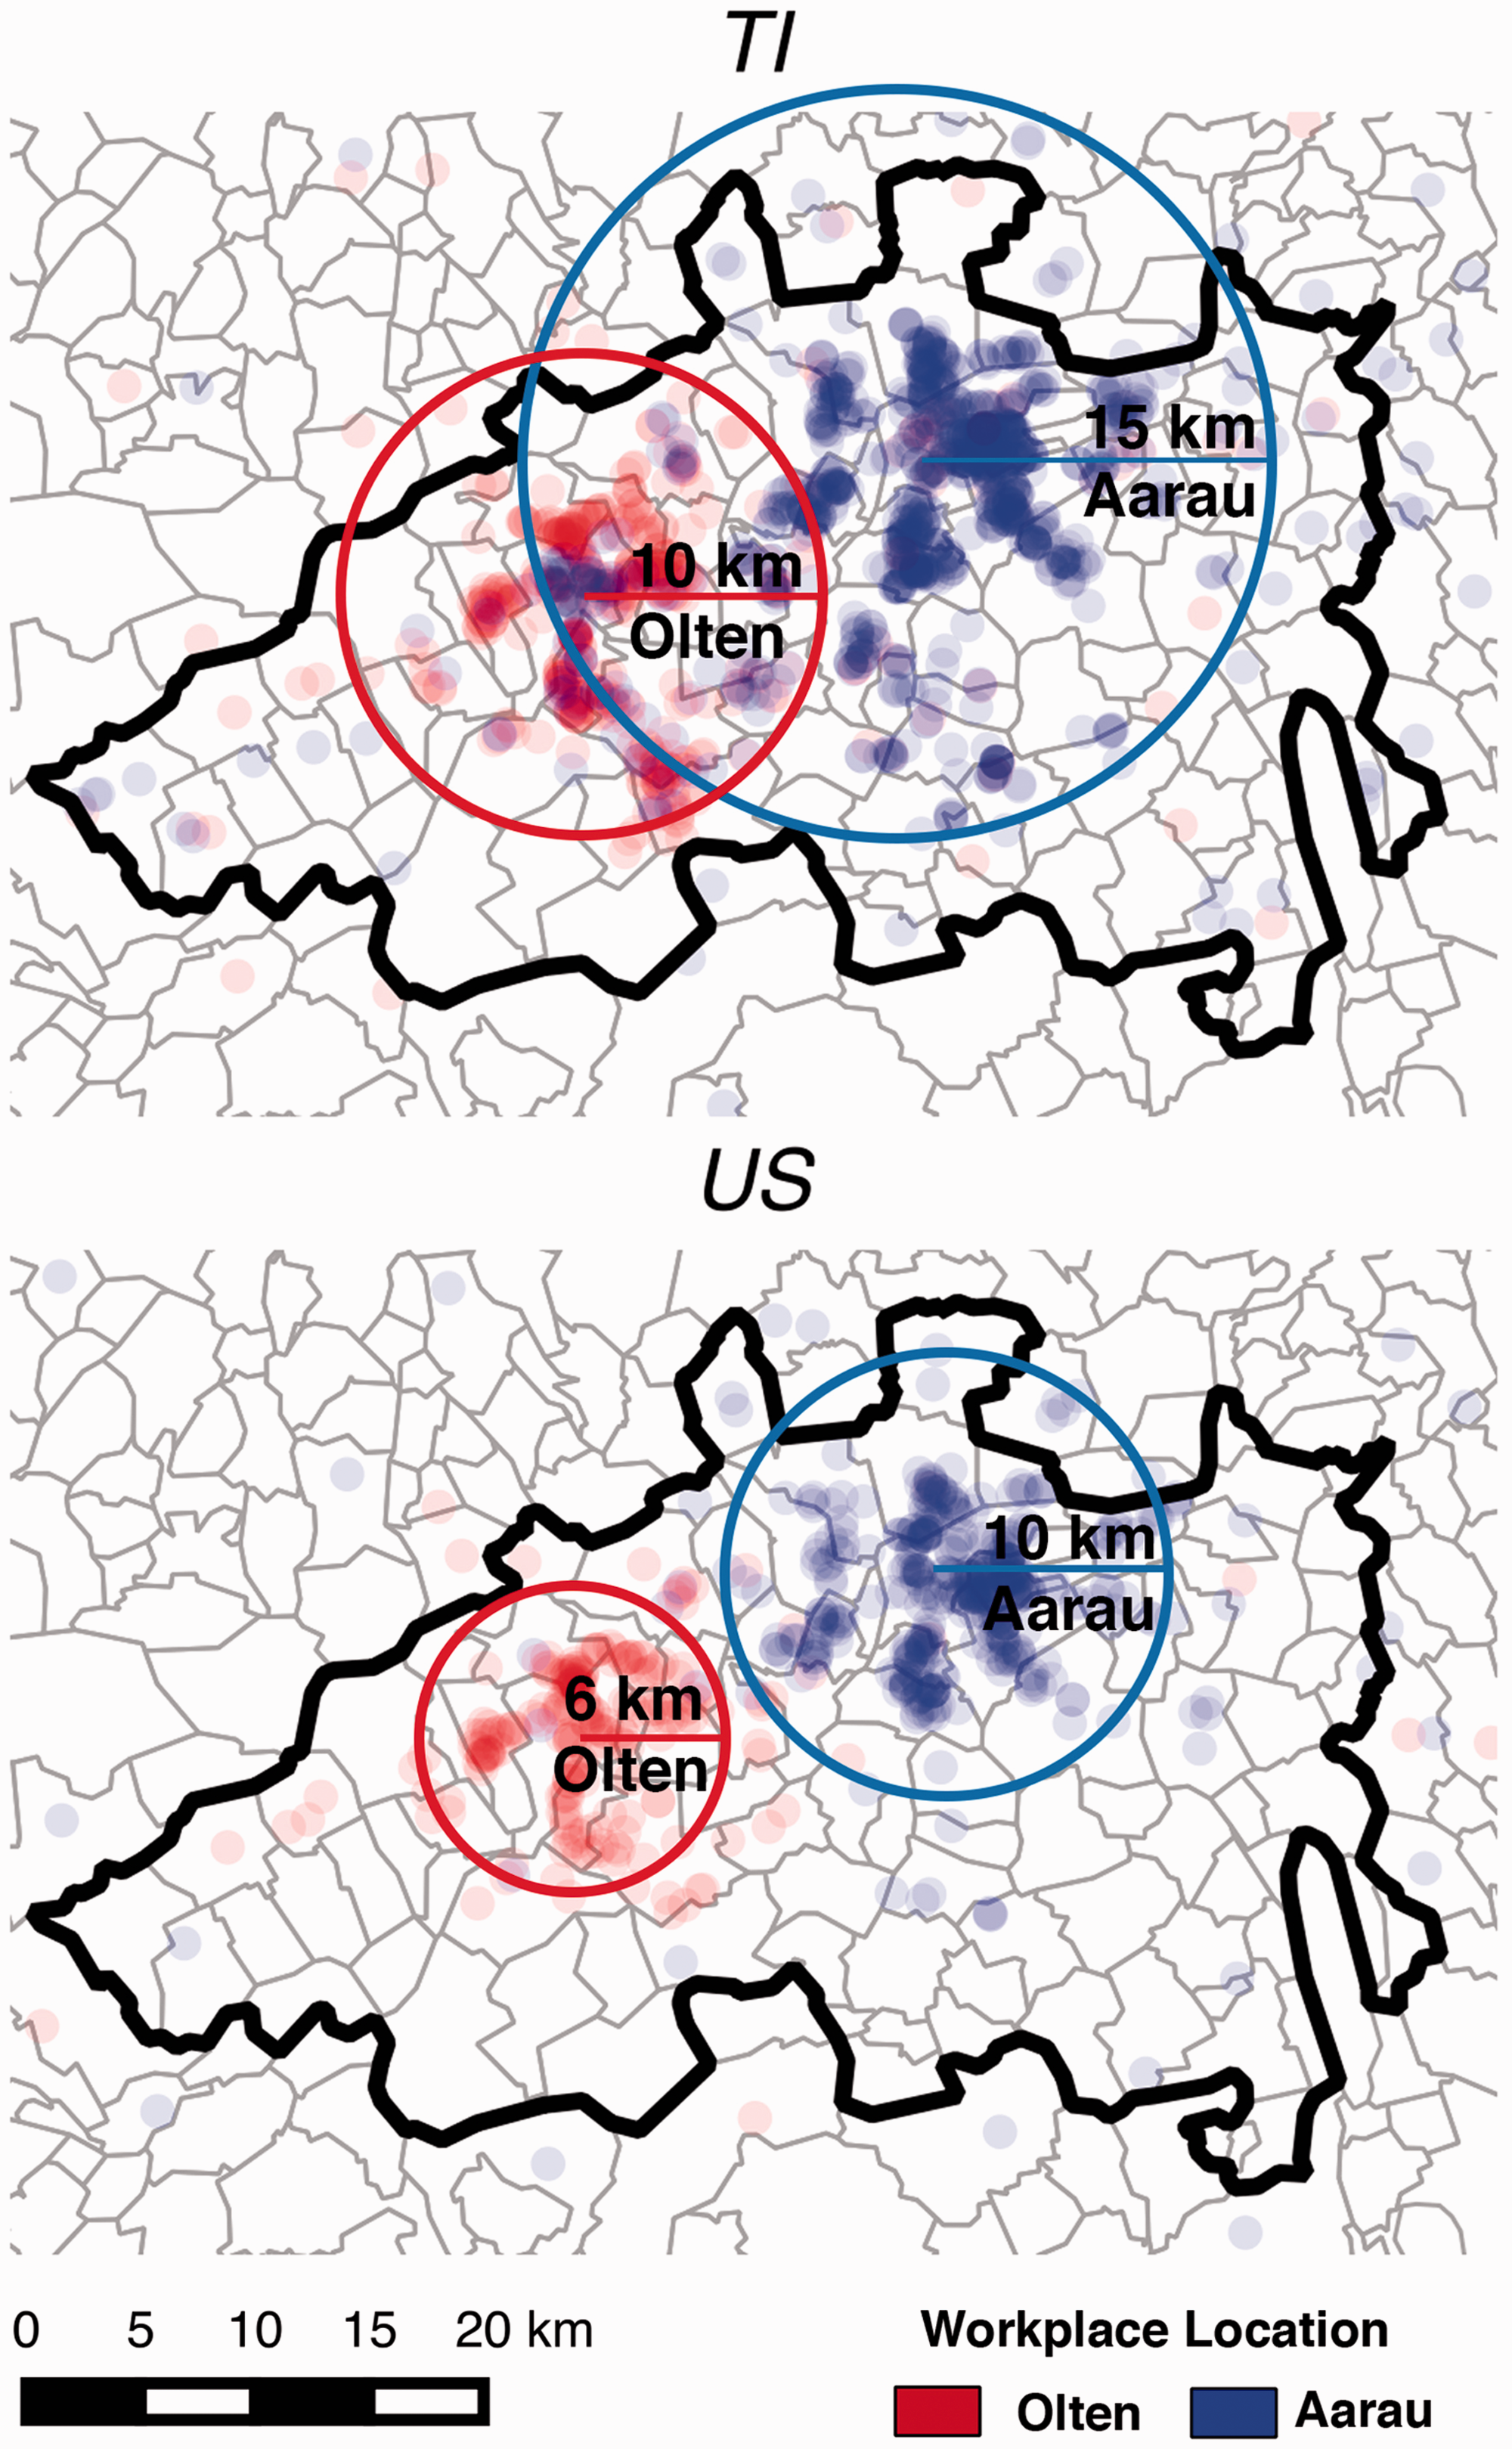
Comparison of radii of commuting attraction in the Technology Insertion (TI) and Urban Sprawl (US) scenarios.
Impact on commuting time
Commuting time and modal choice in 2014 and in the Urban Sprawl (US) and Technology Insertion (TI) scenarios.

Effects on air pollution
The effects on air pollution in the US and TI scenarios relative to 2014 are shown in Figure 6. The pollutants that are considered in this assessment are carbon monoxide, nitrous oxides, volatile organic compounds, and particulate matter. It can be seen in Figure 6 that in comparison to 2014, both the US and TI scenarios have lower pollutant emissions from cars. These lower emissions occur even though the scenarios have respective population increases of 27.3% and 61.1% compared to the 2014 population. In the US, the 20.5% reduction of emissions is due to the combined effects of the 20% penetration of battery electric vehicles and the shorter commuting times. On the other hand, in the TI scenario, the more substantial reduction of 72.9% in pollutant emissions is primarily due to the 80% penetration of battery electric vehicles and the shift towards an increased usage of public transportation.
Estimated daily average emission of pollutant by passenger cars per hectare within the study area in 2014, in the Technology Insertion (TI) and Urban Sprawl (US) scenarios.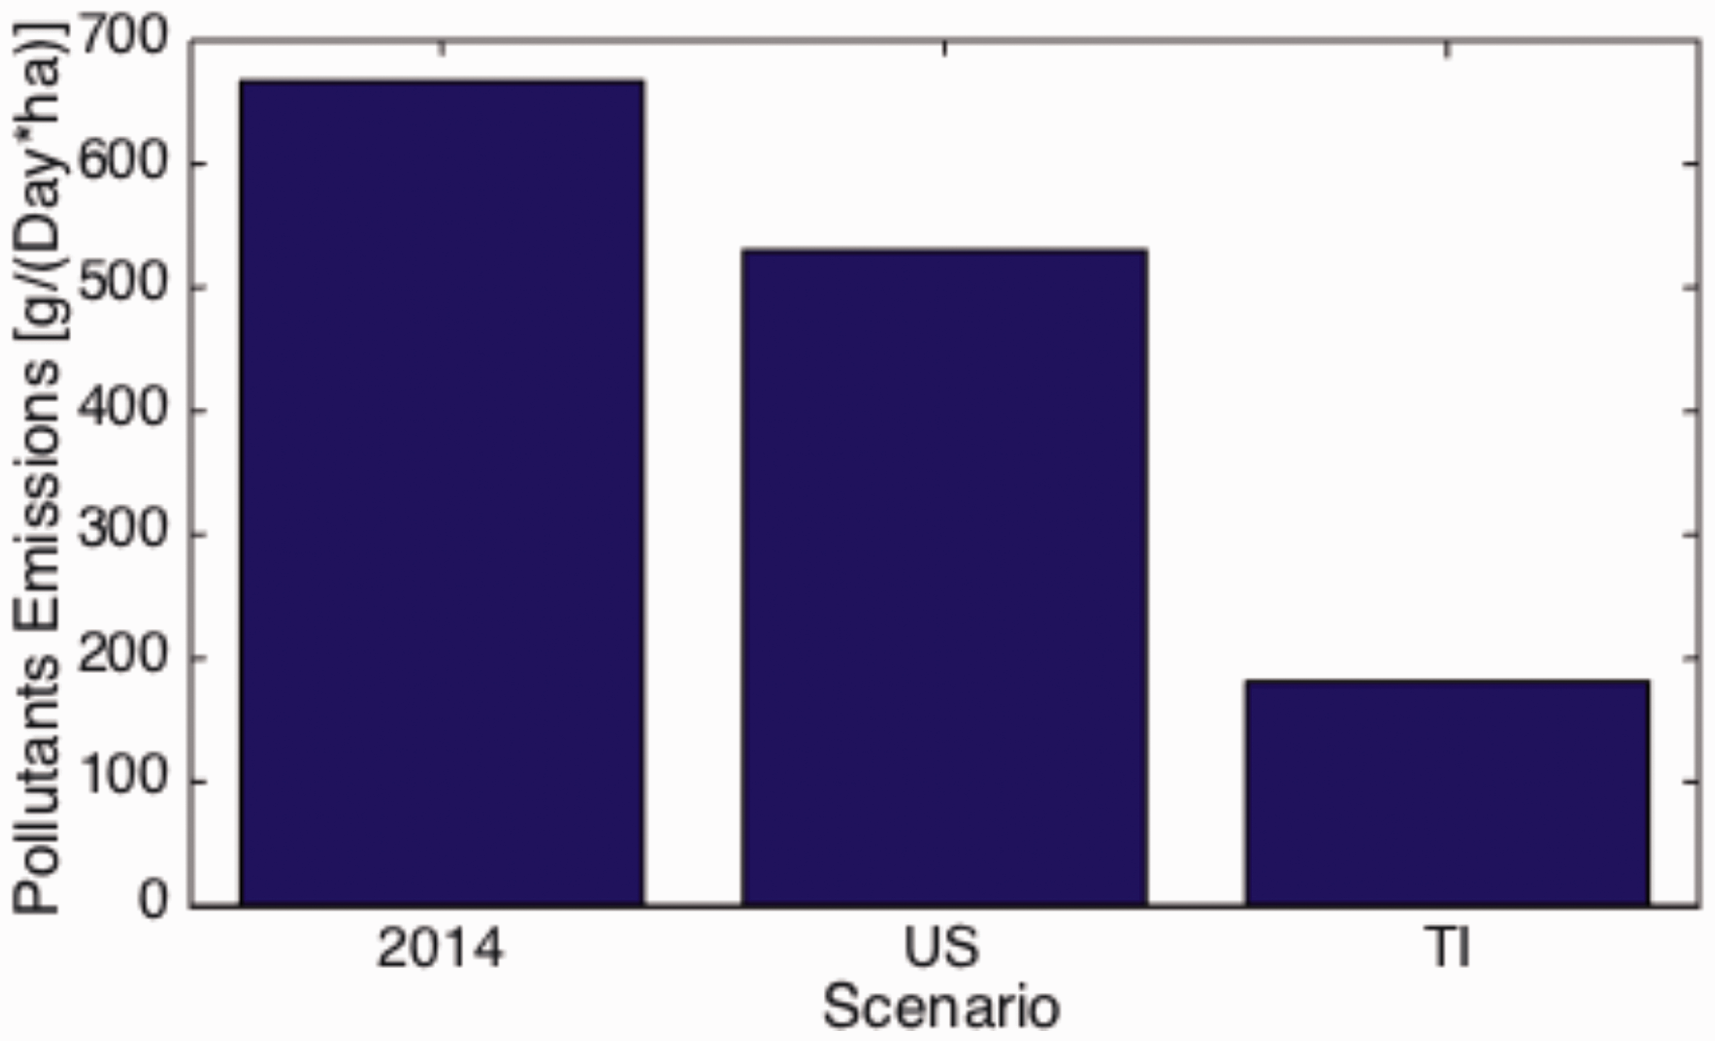
Conclusions and policy implications
Switzerland is expected to increase its population by 25% in the next 35 years. One of the main challenges will be to maintain the status quo in terms of accommodation, availability of services, as well as urban quality. To address these challenges, it is essential for local administrations and city planners to carefully analyze the future scenarios and evaluate the outcomes of different policies, in order to provide adequate support to the future population increase. Possible actions could include re-definition of building stock, maintenance and upgrade of infrastructure and planning of public services. In this paper, two possible scenarios have been evaluated to assess possible policy options for urban planning, primarily focusing on land consumption and mobility.
It has been demonstrated, that land consumption requires particular attention. For example, in the area of Olten–Aarau, the accommodation of the increased population in the US scenario would require up to 800 ha of currently unbuilt land; such land is important for agricultural and industrial activities. Specific policy measures will be required, on one side to prevent uncontrolled expansion onto unbuilt land, and on the other side, to ensure sufficient availability of residential space in currently built areas. While limits to the expansion onto unbuilt land is already being implemented in different cantons (Swiss Federal Office for Spatial Development, 2012), it is more complex to evaluate the required measures to compensate for the necessary residential space by improvement and re-definition of already built land. Planning policies face many unknowns: definition of optimal Ausnützungziffer, cost of dwellings, balancing of mixing building functionality, and adaptation of renovation to life-cycle of buildings and private property in low density areas are only few of the factors that influence policies. The simulation framework that is described in this work allows for an evaluation of the impact of such factors and thus for possible solutions to be proposed. The results showed, that densification and re-use of industrial areas with an average Ausnützungziffer of 1.4 allowed a 93% reduction of unbuilt land usage, still requiring an additional 54 hectares of unbuilt terrain in the locations of Olten and Aarau. To reduce this required unbuilt terrain usage, it is possible to increase the Ausnützungziffer in these localities, promoting and incentivizing vertical development of buildings. Increase of cost per m2 of dwelling would also allow a reduction in the average residential surface per person. In this case, it will be important to consider, that a reduction average residential surface per person would affect negatively the status quo in urban areas. Finally, economic and regulatory measures directed at private owners to incentivize the re-construction of low-density houses into higher density complexes should be considered.
Mobility in high population density areas is another key issue to be addressed by planners through application of policies and new analysis tools. The present work highlights the 25% increase in the average commuting time relative to the commuting time in 2014 results from two factors: the larger distances posed by the creation of new centers, and the increase of availability and frequency of public transport. The latter results in an increased usage of public transport, which is notably slower than private transport. This increased commuting time potentially discourage use of public transport. The use of public transport is essential to maintain good air quality, low noise and reduce road congestion inside urban areas. To encourage the choice of public transport as a main transportation mode, planners and policy makers have different options. The first possibility, which may be relatively simple to implement, would aim to balance the perceived increased cost of longer commuting times by reducing public transport fees or by increasing private transportation cost. Another option would be the improvement of public transport infrastructure, frequency and proximity. Another option will involve the implementation of new technologies, lowering the difference between private and public transport travel times. In the first option, lower cost would attract more people to choosing public transport, but it could be economically unfavorable for service providers, potentially causing a reduction of the overall quality of service and efficiency of infrastructure. Increasing private transportation costs could potentially be found to be ineffective, since private transportation costs are perceived as low in Switzerland compared to other household expenses. High increase of transportation taxes or fuel cost would also be very difficult to implement, due to the Swiss' political system, of direct democracy. The third option would be the most expensive option. Increased capillarity and frequency of public transport in low density areas would attract people to public transportation, but at the same time it would be economically unsustainable outside of rush hours because of the large number of empty vehicles in service. A possible solution will be posed by the adoption of on-demand public transport, which would be likely possible in the near future, due to the development of self-driving vehicles and mobile software applications. These technologies will allow the development of a new public transport infrastructure that is composed of high speed large transportation systems connecting major centers and supported by smaller autonomous vehicles for the commute closer to home. This option will not only decrease the travel time, but reduce the problems related to the ownership of private vehicles, such as the vehicle maintenance costs and requirement of parking spaces, incentivizing in this way usage of public transport system and increasing the overall perceived quality.
Footnotes
Declaration of conflicting interests
The author(s) declared no potential conflicts of interest with respect to the research, authorship, and/or publication of this article.
Funding
The author(s) received no financial support for the research, authorship, and/or publication of this article.