
Abstract
Urban forest ecosystems are increasingly recognized as necessary components of a city's overall sustainability. The number of municipal governments planning and implementing urban forest management programs is rising, as the benefits of urban forest ecosystems are becoming common knowledge. However, the urban forest is an exceedingly complex and vulnerable social–ecological system that presents a wide array of management challenges. One area of concern that is understudied and worthy of investigation is the effects of housing renovation activities and neighborhood revitalization on the urban forest. The purpose of this study is to investigate the possibility of renovation activity as a significant source of disturbance in urban forest ecosystems. We conducted ordinary least squares regression and geographically weighted regression analyses using canopy cover, building permit data, and socioeconomic variables in Toronto, Canada. We then conducted a parcel-level assessment of tree mortality using ortho-imagery from 2003 and 2014 and government open data describing 16 years of renovation activity. Findings suggest that renovation activity, as indicated by building permit abundance, is a possible cause of tree mortality and subsequently a source of urban forest disturbance. Our findings also suggest that the relationship between renovation activity and canopy cover is highly complex, and is likely influenced by residential tree planting rates, land use mix, and different trajectories of urban change.
Introduction
Urban forest ecosystems are increasingly recognized as necessary components of a city's overall sustainability. The number of municipal governments planning and implementing urban forest management programs is rising (Ordóñez and Duinker, 2013), as the benefits of urban forest ecosystems are becoming common knowledge (Roy et al., 2012). However, the urban forest is an exceedingly complex and heterogeneous social–ecological system that presents a wide array of management challenges. Trees and forest stands compete for space with built infrastructure in the densely settled urban landscape and an abundance of social and biophysical stressors continuously threaten tree survival and ecological function (Steenberg et al., 2017; Vogt et al., 2015). Moreover, the urban landscape is dynamic and often rapidly changing. New development, land intensification, and housing stock renewal occur at rates that differ substantially from the ecological processes of urban forests and the longevity of trees (Boone et al., 2010; Whitehand, 1987). The potential for unforeseen management challenges to arise is high.
There are both spatial and temporal considerations with regards to urban forest disturbance and associated management challenges. With regard to spatial patterns in cities, arguably the most established relationship is between urban forest canopy cover and socioeconomic status (Grove et al., 2014, 2006; Heynen and Lindsey, 2003; Pham et al., 2013; Troy et al., 2007). The extent of canopy cover has a strong positive relationship with socioeconomic status in nearly all North American cities where research has taken place (e.g. Kim et al., 2018; Schwarz et al., 2015). Some of the environmental conditions that explain this spatial variability are obvious, such as larger parcel sizes and associated residential green space in more affluent areas compared to greater impervious surface cover in higher-density, less-affluent areas. However, other causative factors are more nuanced and uncertain, such as resident landscaping preferences (e.g. tree planting) and the concentration of local stressors and disturbances (e.g. construction activity) in certain parts of the city (Conway, 2016; Morgenroth et al., 2017). Since the distribution of canopy cover is closely associated with the distribution of many documented ecosystem services, continuing research on the social and ecological processes that shape this distribution is important for informing sustainable planning and design. Moreover, this unequal distribution of canopy is important to address for environmental justice reasons, as visible minorities and other marginalized populations have reduced access to green spaces and urban forest ecosystem services (Heynen et al., 2006; Landry and Chakraborty, 2009).
Perhaps a greater source of uncertainty – and thus a considerable management challenge – is the temporal dynamics of urban forest ecosystems. In many North American cities, the majority of urban trees are situated on private residential property (Kenney and Idziak, 2000). Consequently, despite the leading role of municipal government in urban forest planning and management, a substantive portion of the urban forest is under the direct and indirect management of private residents and thus subject to their individual landscape management preferences. Local environmental non-government organizations and community groups (e.g. resident associations) also influence residents through education and stewardship programs (Duinker et al., 2014). While municipal policies can influence behavior through a variety of institutional tools (e.g. tree protection regulations, tree planting incentives; Conway and Urbani, 2007; Mincey et al., 2013), urban forest structure and function are very much shaped by both current (Conway, 2016) and past (Boone et al., 2010) decisions of residents. There are a few studies that explore how likely residents are to plant trees on their property and motivations for these actions (Conway, 2016; Greene et al., 2011; Kirkpatrick et al., 2012). However, little is known about resident motivation to remove trees, and less still about possible causes of unanticipated tree mortality that might result from resident activity. Understanding these motivations and activities is important for municipal staff since negative consequences associated with them (e.g. unwanted tree mortality, canopy cover decline) may not be documented or realized for years afterwards.
One area of concern that is understudied and worthy of investigation is the effects of housing renovation activities and neighborhood revitalization on the urban forest. More specifically, the potential for housing renovation to be a significant cause of urban tree mortality is conceivable but relatively unknown. Housing in general has been well researched as a factor of socioeconomic status for its relationships with canopy cover, though occasionally with varying results (Pham et al., 2013; Steenberg et al., 2015). In general, housing attributes like real estate value, type (i.e. single-family detached housing), and size are commonly found to be positively associated with canopy cover (Grove et al., 2006; Kim et al., 2018; Troy et al., 2007). Interestingly, these housing attributes are also positively associated with the level of renovation activity, both with renovation activity in general and with sudden upwellings of activity associated with urban renewal and neighborhood revitalization (Bailey and Robertson, 1997; Helms, 2003).
The logical conclusion to draw from the previous two relationships is that renovation activity will be higher in more affluent – and therefore greener – neighborhoods. However, the rise in renovation activity may also be a cause of tree mortality and urban forest decline. Construction and demolition activities, like those associated with building renovation, are commonly a source of tree decline and mortality due to mechanical injuries to trees, aggressive pruning, root severing, and soil compaction (Koeser et al. 2013; Morgenroth et al., 2017; Trowbridge and Bassuk, 2004). Moreover, Steenberg et al. (2018) conducted a pilot study in an affluent neighborhood in Toronto, Canada, and found that the presence and abundance of building permits (i.e. renovation activity) successfully predicted tree mortality at multiple spatial scales. The apparent co-existence of these conflicting relationships between housing renovation, socioeconomic status, and urban forest ecosystems remains largely unstudied. Moreover, it reinforces the importance of acknowledging and mitigating social, economic, and ecological conflicts in urban renewal and sustainability planning (Zhen et al., 2016).
The purpose of this study is to investigate the possibility of housing renovation as a significant source of disturbance in urban forest ecosystems. To approach this, we ask the following research questions: (1) What are the socioeconomic predictors and spatial patterns of renovation activity in Toronto, Canada? (2) What are the socioeconomic predictors and spatial patterns of canopy cover, and how do they compare with renovation activity? (3) Can the presence of building permits at the parcel scale, as an indicator of renovation activity, predict urban tree mortality over time across the entire city? To address the first two questions, we conducted ordinary least squares (OLS) regression and geographically weighted regression (GWR) analyses, referred to hereafter as the regression analysis. To address the third research question, we conducted a parcel-level assessment of tree mortality using ortho-imagery from 2003 to 2014 and government open data describing 16 years of renovation activity, referred to hereafter as the tree mortality analysis. Urban forest ecosystems and their associated supply of ecosystem services are vulnerable, and identifying significant sources of stress and disturbance is an important on-going endeavor – especially ones where planning intervention and mitigation are possible.
Methods
Study area
This study was conducted in Toronto, Canada (Figure 1). Toronto is North America's fourth largest city, with a population of 2,615,060, area of 630 km2, and population density of 4150 people per km2 (Statistics Canada, 2016). The current City of Toronto, amalgamated from six former municipalities, has been experiencing steady population growth and new development for the past several decades (City of Toronto, 2015). Toronto is a multicultural city, with 46.9% of the population identifying as a visible minority. It has been experiencing rapid growth in housing prices since the mid-1990s, with an average aggregate housing price of $730,000 in 2016 (Royal Bank of Canada, 2016). There has also been a corresponding rise in investment in housing stock and associated renovation activities.
The City of Toronto, Canada, and the distribution of (a) building permits per 10,000 dwellings and (b) percent urban forest canopy cover measured at the census tract level.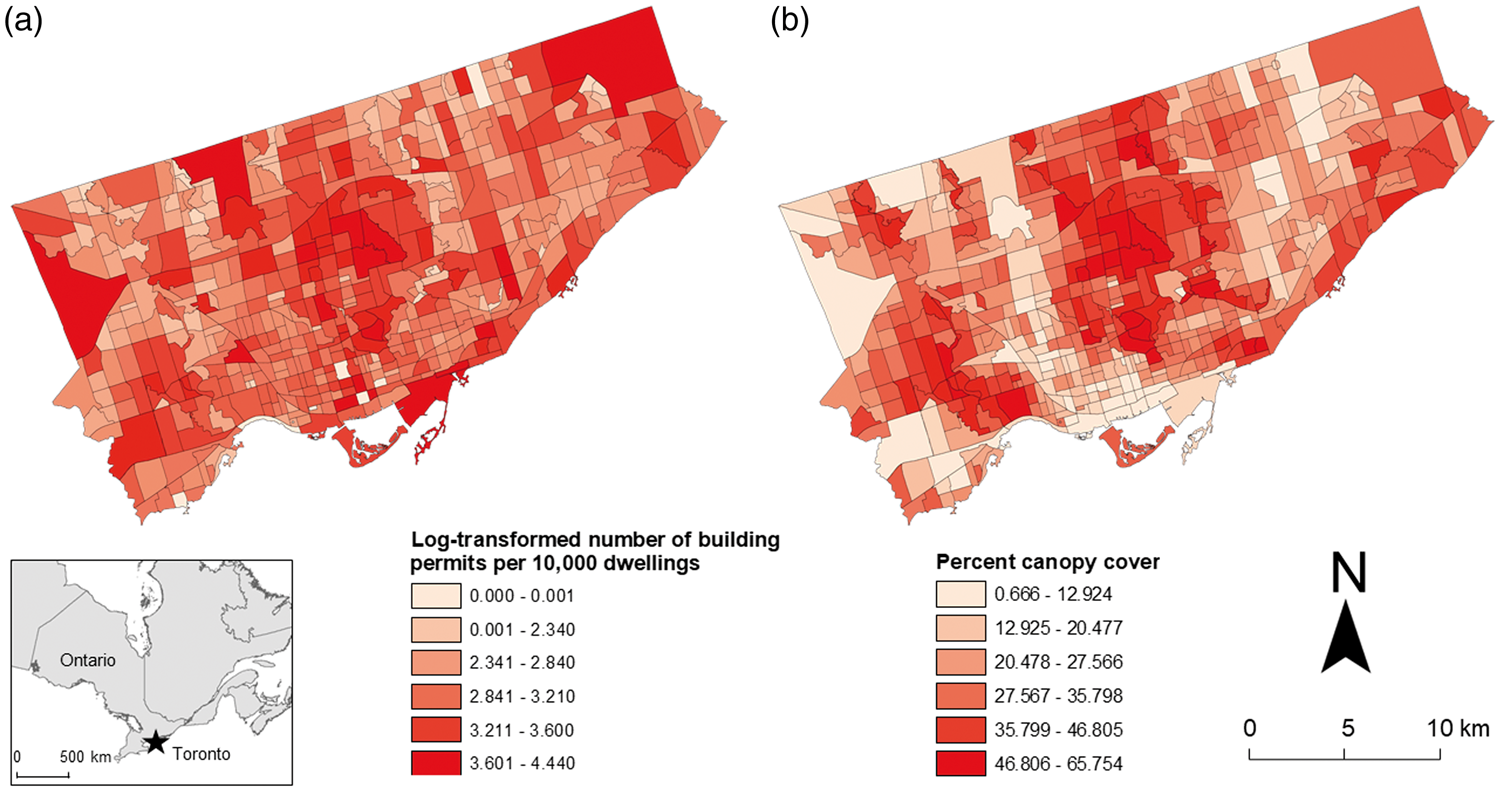
Toronto is situated in the Deciduous Forest Region, where undeveloped and/or pre-settlement forests are characterized by sugar maple (Acer saccharum), red oak (Quercus rubrum), white pine (Pinus strobus), and eastern hemlock (Tsuga canadensis). Characteristic urban tree species include Norway maple (A. platanoides), sugar maple, eastern white cedar (Thuja occidentalis), Manitoba maple (A. negundo), and green ash (Fraxinus pennsylvanica; City of Toronto, 2010). There are several rivers within the municipal boundaries that drain into Lake Ontario, and the city has an extensive forested ravine system. Toronto has a continental climate with hot, humid summers and cold winters. It has a mean annual precipitation is 834 mm, mean annual temperature of 9.2℃, mean January temperature of −4.2℃, and mean July temperature of 22.2℃ (Environment Canada, 2015).
Data sources and preparation
Variable descriptions, including mean, standard deviation, and data source. Log transformed means and standard deviations are included in brackets where applicable.

Land cover data derived from 2007 QuickBird satellite imagery (0.6-m resolution).
City of Toronto Open Data.
Statistics Canada 2006 census data.
Permits are linked to civic address, and include dates of application, issuing, and completion. We organized and selected records by date of issue, since this is the likely initiation of renovation activities. The permit records included type and description of work attributes, though we had to include all permits in the analysis since the coding of work descriptions was too vague or inconsistent for effective aggregation. This is a limitation of this research that will be discussed in detail in the discussion section. We used permit data from 2000 to 2015, which included a total of 401,436 permits at 100,897 unique civic addresses with an annual mean of 25,077 (±7683) permits per year. There were 3870 permit data records with a street address of 0 that were omitted from the data. Only permit data from 2000 to 2007 were used for the regression analysis given the 2007 vintage of the canopy cover data. Permit data for the full 2000–2015 period were used for the tree mortality analysis. Lastly, the building permit data were not spatially referenced. To do so, we used separate and spatially referenced City of Toronto civic address data and created look-up tables to join the two datasets to get parcel-level permit counts and subsequently aggregate the permit data to the census tract (CT) level.
Canopy cover data were measured as percent of CT area using land cover data, which were created by the University of Vermont's Spatial Analysis Laboratory using 2007 QuickBird satellite multispectral bands with 2.4 m per side pixel resolution that were pansharpened to 0.6 m using the Quickbird panchromatic band (City of Toronto, 2010). Socioeconomic variables were derived from Statistics Canada 2006 census data, which were used in place of the 2011 census given the 2007 vintage of the satellite imagery. All data were obtained for the Toronto census subdivision and processed and analyzed at the CT level. Count-based variables (i.e. Ownership, Before1946, Minority, and University) were calculated as percentages to account for uneven CT populations. Lastly, we used two time periods of ortho-imagery in the tree mortality analysis. These included black and white 7.5-cm resolution ortho-imagery from 2003 and color 8-cm resolution ortho-imagery from 2014. The previously described building permit data were used in conjunction with the ortho-imagery for the tree mortality analysis.
Regression analysis
To get a sense of bivariate relationships between the socioeconomic independent variables with both canopy cover and building permits, we first calculated Pearson's product moment correlations. Regression analysis was then used to evaluate the predictive capacity and explanatory power of the independent variables on both canopy cover and building permits. Two OLS multiple regression models were developed for both canopy cover and building permits as dependent variables. Variance inflation factors (VIF) were calculated for all variables in both models to check for multicollinearity. All VIF values ranged from 1.38 to 6.50, indicating that multicollinearity was not an issue in the analysis (O'Brien, 2007). Building permit data from 2000 to 2007 were calculated as the number of permits per 10,000 dwellings in the 2006 census, and log transformed using a log10(x+1) formula to meet normality assumptions. The housing age variable (i.e. Before1946) was also transformed using the same method.
Spatial data frequently exhibit spatial autocorrelation, where observations have increasingly correlated values with increasing proximity, thereby violating the OLS regression assumption of independent observations and error terms. Correspondingly, we developed GWR models for both canopy cover and building permits using the same independent variables to account for spatially varying data and to limit the likely effects of spatial non-stationarity in the relationship between dependent and independent variables (Fotheringham et al., 2003). A fifth and final exploratory GWR model was run to test the capacity of building permits only to predict variation in canopy cover. The GWR method employs a roving window to fit local-level regression models at the location of each observation to identify any possible spatial variability in the relationship between variables (Fotheringham et al., 2003). Given the variability of CT size in Toronto, we used an adaptive spatial kernel so that kernel size adapts to the density of observations, decreasing at high density and vice versa (Troy et al., 2012). A number of studies have used GWR to examine spatial non-stationarity in the relationship between canopy cover other urban variables, such as crime (Troy et al., 2012) and surface temperatures (Greene and Millward, 2016).
Tree mortality analysis
Drawing substantive conclusions on the possible negative effects of renovation activities (e.g. tree mortality) also required some kind of temporal analysis. Moreover, we suspect that the effects of renovation activities on trees are scale dependent at the parcel level and highly heterogeneous in aggregate (Steenberg et al., 2018). Consequently, we developed a novel, simplified approach to test for possible tree mortality associated with the presence of building permits at the parcel level based on the principles of the point-based classification methods (Walton et al., 2008). See the online Supplemental material for a detailed discussion and imagery describing possible limitations of this method.
We randomly selected 500 georeferenced parcels (i.e. civic addresses) and compared the 2003 to the 2014 ortho-images to visually assess the presence of tree mortality and/or removal in 2014 within each parcel boundary (Figure 2). We use the term mortality throughout the manuscript, though it was tree removals that were identified in the imagery, so it cannot be determined if tree mortality occurred before or during removal. Building permit data from 2000 to 2015 were aggregated for each parcel in Toronto by civic address so that a list of all addresses with the associated number of building permits was created to use for random selection. Where uncertainty existed around parcel identification, we employed Google Maps™ and Google Street View™ for confirmation. We then used Pearson's chi-squared (χ2) test to identify any statistically significant effects of building permits on tree mortality at the parcel level. The χ2 test tests the null hypothesis that there is no relationship between variables using the observed and expected frequencies of a dependent variable (i.e. tree mortality) across the classes of a categorical independent variable (i.e. building permit presence). The only assumption of the χ2 test is that expected frequencies of the dependent variable are not less than five (Jutras et al., 2010), which this analysis did not violate. Lastly, most residential areas in Toronto lack a separated grass median between curb and sidewalk (i.e. tree lawn) and trees that are located directly in front of residential dwellings (i.e. front lawns) are in fact located in the public right of way and not entirely within the parcel boundary. While these are considered street trees and are legally the responsibility of the municipal government, we included them in the analysis on the basis that they are just as susceptible to injury and mortality associated with adjacent renovation and construction activities.
An example of parcel-level tree mortality detection.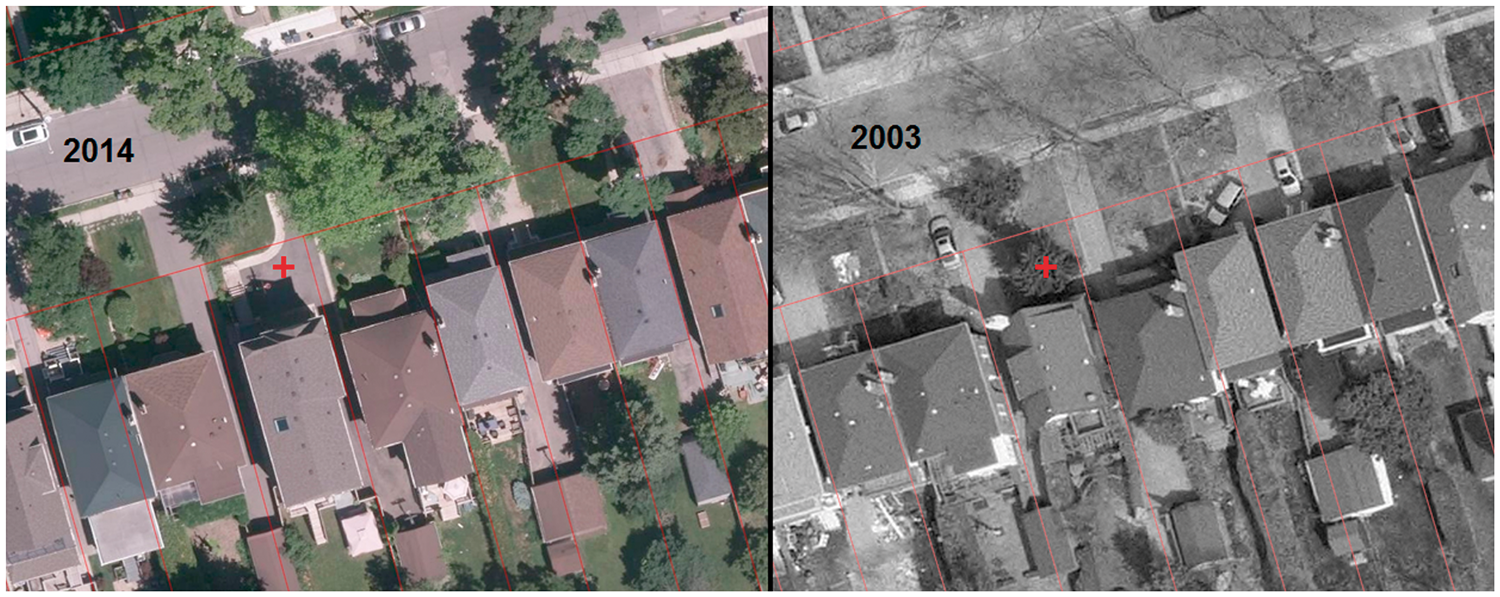
Results
Regression analysis
Pearson correlations and standardized beta coefficient values with significance levels for the ordinary least squares (OLS) regression models for canopy cover and building permits.
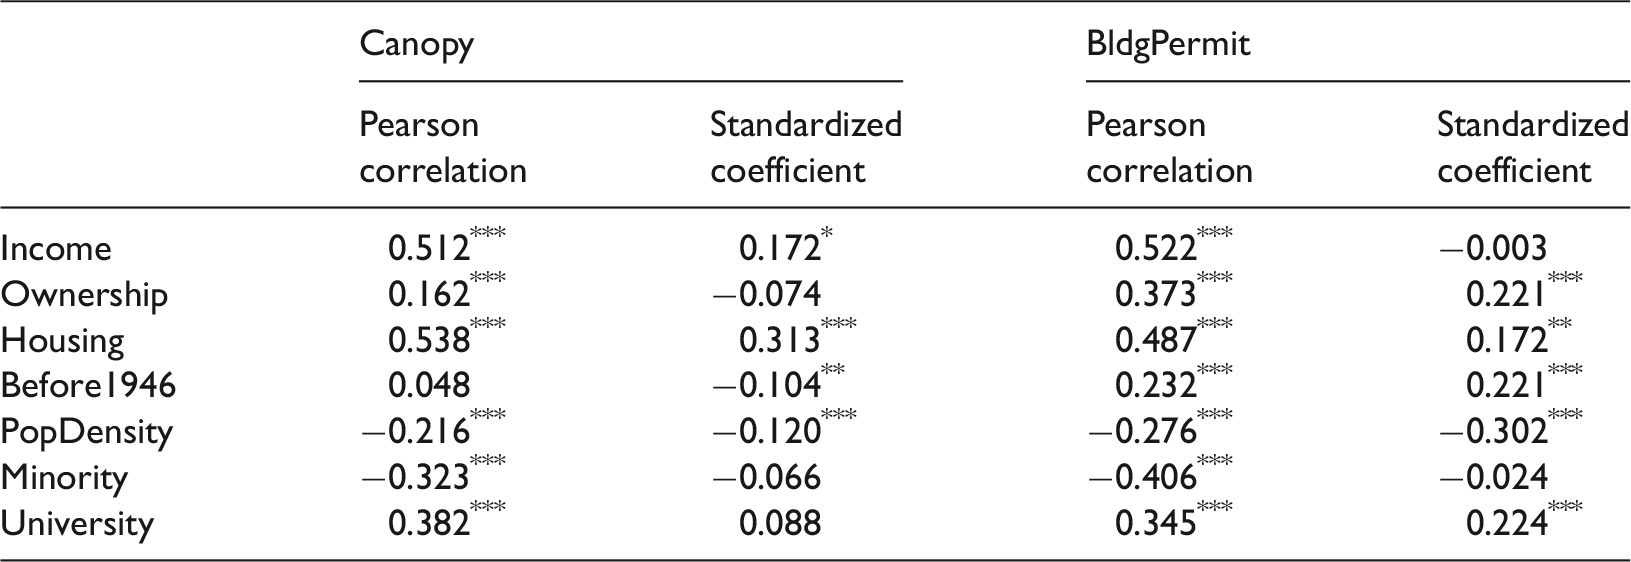
Significant at the α = 0.1 level.
Significant at the α = 0.05 level.
Significant at the α = 0.01 level.
Unstandardized beta coefficient values, R2 values, and Akaike information criterion (AIC) scores for the ordinary least squares (OLS) regression and geographically weighted regression (GWR) models for canopy cover and building permits.
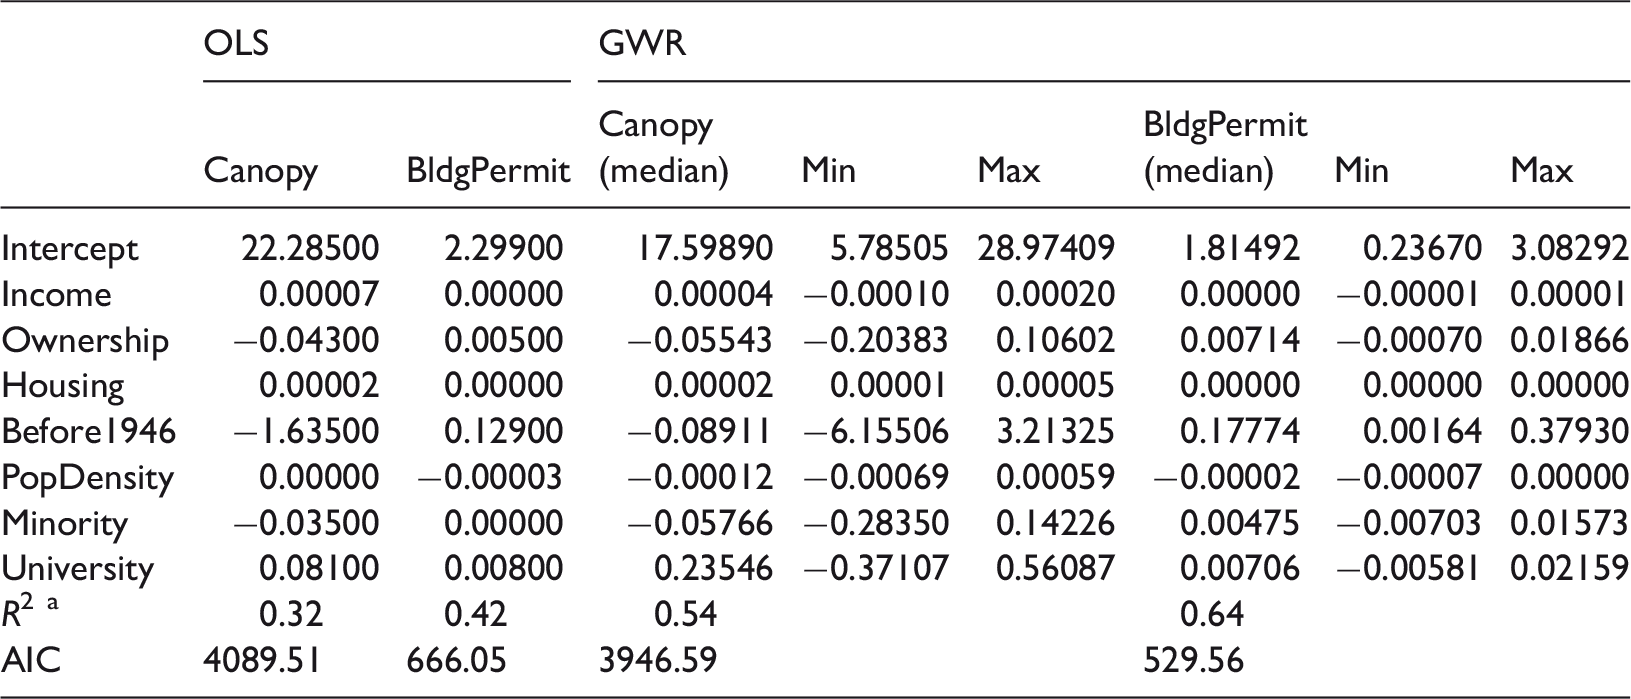
Pseudo R2 for GWR models.
There was a notable improvement in canopy cover and building permit models from OLS to GWR. The GWR models (Table 3 and Figure 3) explained a higher rate of variation in both canopy cover (pseudo R2 = 0.54) and building permits (pseudo R2 = 0.64). While GWR model fit may be inflated due to the local weighting of coefficients (Greene and Millward, 2016), the Akaike information criterion (AIC) scores indicate better performance (i.e. lower AIC scores) of the GWR models over the OLS models. There was no apparent pattern in the differences in coefficient magnitudes between OLS and GWR. There was a change in sign of the population density coefficient in the canopy models, but the range of local coefficient values indicate that this was not a substantive divergence in relationships between the models.
Local R2 values from the geographically weighted regression (GWR) models predicting (a) building permits per 10,000 dwellings and (b) percent urban forest canopy cover measured at the census tract level.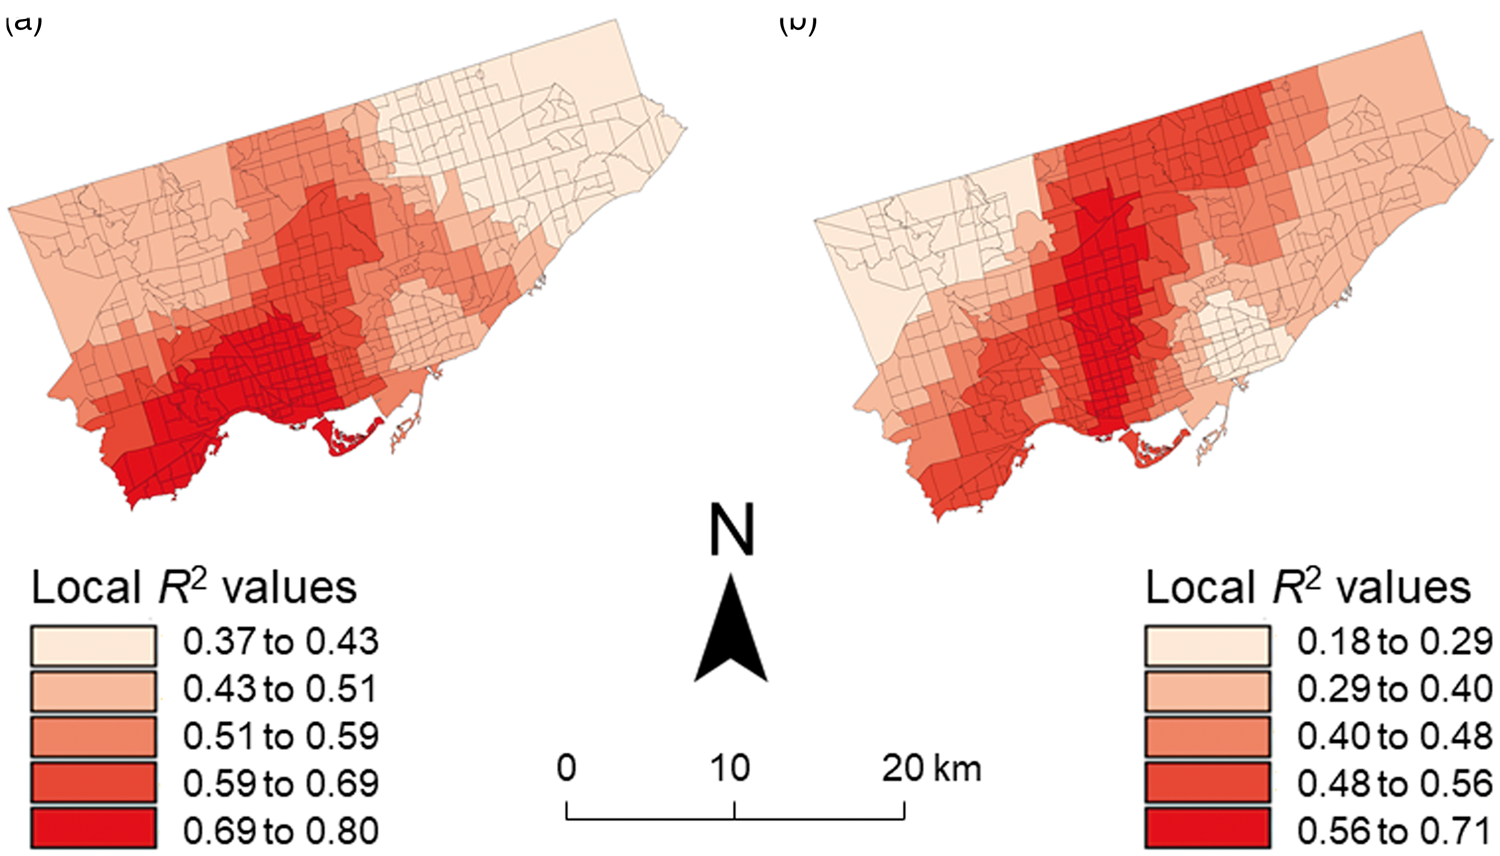
Mapping the local R2 values at the CT level revealed spatial variability in GWR model performance. Both the canopy cover and building permit models show some similar patterns with higher predictive capacity in the center of the city, though disparities are obvious in the southwest and northeast of the city. Mapping the OLS and GWR, standardized residual values (supplementary material) gave further insight into spatial variability in model performance. The most notable pattern in both OLS and GWR was the more frequent model under-prediction of building permits and over-prediction of canopy cover. There were no immediately evident patterns in residual values between OLS and GWR models for a given dependent variable. Lastly, the GWR model predicting canopy cover using only building permits (Figure 4) had a pseudo-R2 of 0.49 and an AIC of 3962.12. The median coefficient value for the building permit independent variable was 1.14 with a minimum of −16.36 and maximum of 26.47. Clear signs of spatial non-stationarity are present, with local coefficient values ranging substantially from negative to positive values. The model performed best where the relationship between building permits and canopy cover was either strongly negative or strongly positive.
Local R2 values and local coefficient values from the geographically weighted regression (GWR) models predicting canopy cover using only building permits.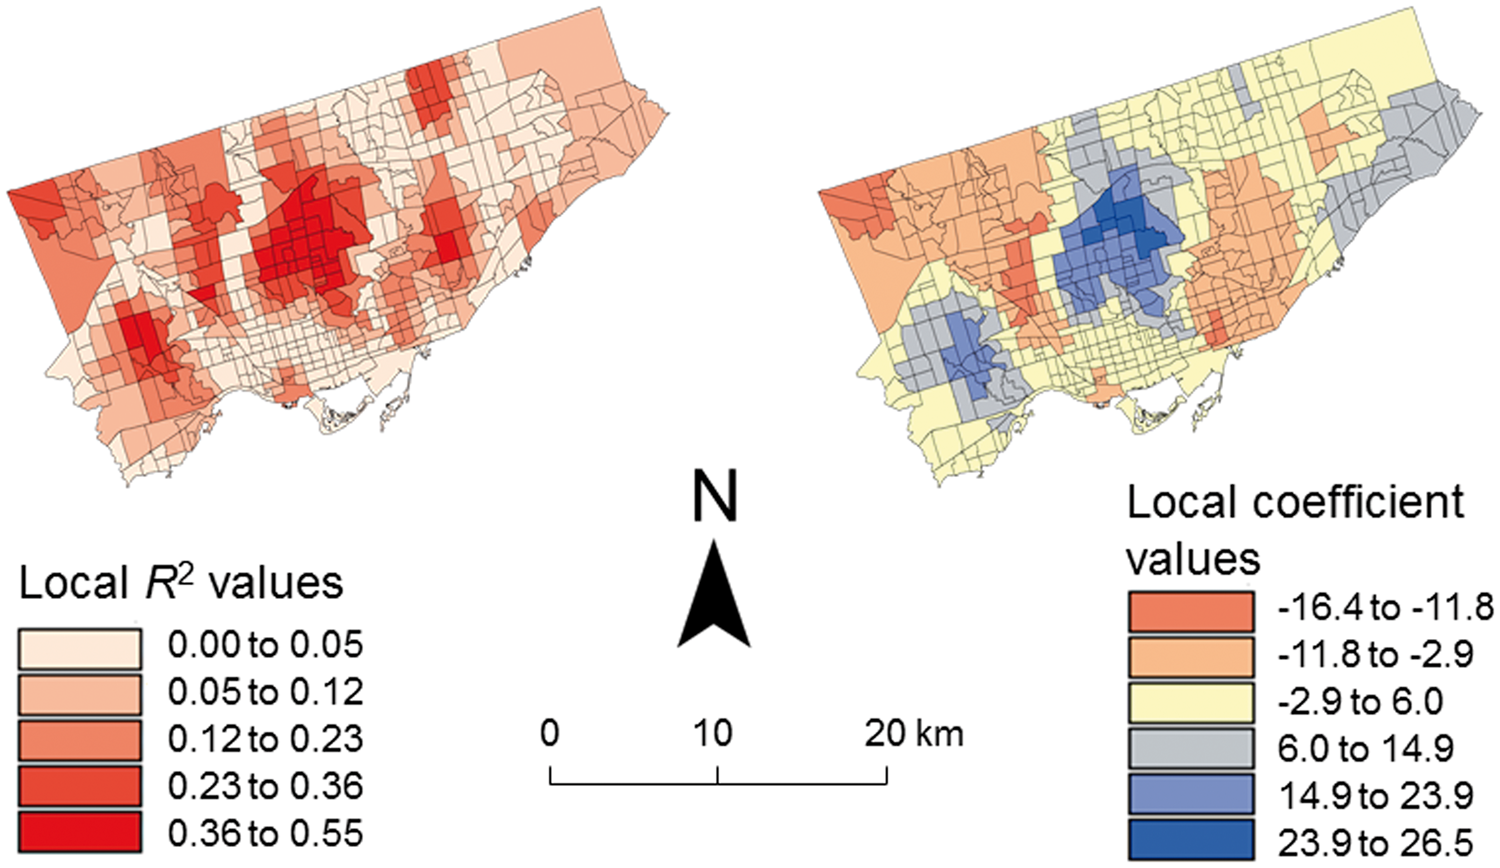
Tree mortality analysis
Pearson's chi-squared (χ2) test results on the significance of the relationship between building permits and tree mortality at the parcel level.

Discussion and conclusions
This study suggests that building renovation activity, as indicated by building permits, is a possible cause of tree mortality and a source of urban forest disturbance. This addresses our third research question as to whether building permits can predict urban tree mortality. From a planning and management perspective, an additional source of stress or disturbance on urban forest ecosystems is an undesirable outcome. However, mitigation is plausible in this particular case, as renovation activities are municipally regulated through the permitting process. This process therefore offers a logical intervention point to improve property-owner and/or contractor awareness of urban trees, their benefits, and their sensitivity. It is also a logical point for the implementation of tree protection measures to mitigate or even avoid tree decline and mortality. Urban trees and forests face a myriad of stressors and disturbances as a result of their location in cities (Steenberg et al., 2017), so municipally mandated tree protection is important, especially on privately owned residential properties where they do not have direct management access.
Interestingly, the City of Toronto does have one such measure in place in the form of a tree protection zone (TPZ) policy and specifications (City of Toronto, 2016). The TPZ specifications are tied to the municipal private tree protection by-law adopted in 2004 and call for the establishment of temporary fencing around existing trees based on their diameter and drip-line area in order to block adjacent construction activities that might injure or kill trees (City of Toronto, 2016). Such protection policies are increasingly common in many municipalities (Conway and Urbani, 2007; Harris et al., 2004). Our findings might suggest the need for more effective implementation and/or enforcement of the TPZ, though it is possible that mortality rates would have been even higher if the TPZ were not implemented in 2004. Since municipalities are increasingly adopting such protection measures, on-going research and monitoring on their design and effectiveness is important. Perhaps more importantly, they also emphasize the need for better coordination between municipal urban forestry and urban planning departments around housing renewal and tree protection. Renewal and investment in urban housing are a valuable component of municipal sustainability initiatives (Priemus, 2005), but should not come at the cost of reduced urban forest ecosystem service supply. Understanding social, economic, and ecological conflicts in urban renewal is important for overall sustainability planning (Zhen et al., 2016).
The finding that housing renovation may be a significant source of urban tree mortality on its own is important for practitioners. However, in addressing our first and second research questions on the relationship of socioeconomic status with renovation activity and canopy cover, respectively, our findings also suggest that the relationship between renovation activity and canopy cover is a complex one. Regression analysis revealed that socioeconomic status is a predictor of both canopy cover and renovation activity. The finding that the presence of permits significantly predicted tree mortality at the parcel scale – and that permits and canopy were uncorrelated – conflicts with this point. If the level of renovation activity is much higher in more affluent areas and is also associated with higher tree mortality rates, there must be several other factors at play behind both our findings and the widely established positive association between canopy cover and socioeconomic status (Grove et al., 2014; Kim et al., 2018; Schwarz et al., 2015).
We propose two hypotheses that explain this situation. The first is the existence of different patterns and trajectories of development and renovation activity, and thus different relationships with canopy cover and ecological change in urban forests. We base this on the presence of a high degree of spatial non-stationarity in the relationship between canopy cover and building permits. This relationship ranged from highly positive to negative across Toronto. The strongest positive relationship – also where the model explained the most variation in canopy cover – was in more affluent city neighborhoods with extensive tree cover. Conversely, the relationship with canopy cover was negative in less affluent areas with a greater mix of commercial and industrial land uses and lower canopy cover. We observed spikes in renovation activity in these areas as well. An array of spatio-temporal patterns of change in the built environment are possible, ranging from smaller-scale housing deterioration and renewal to broad-scale land intensification and subdivision development to new commercial development (Cheng and Masser, 2004; Herold et al., 2003). Our findings suggest that these different patterns have considerably different implications for urban forests that should be both addressed by municipal staff and internalized in the building permitting process. For instance, building permits might be differentiated according to their risk to trees to be better aligned with protection measures and to improve efficiency in the permitting process. From a research standpoint, this also stresses the importance of somehow differentiating between permit types in future research, which was not feasible for this study.
Our second hypothesis explaining the counter-intuitive relationship between canopy cover and renovation activity has to do with residential tree planting. As previously mentioned, a substantial proportion of urban trees are situated on privately owned residential properties (Kenney and Idziak, 2000). Consequently, there has been a growing interest in the study of resident behavior and motivations to plant trees and engage in urban forest stewardship activity, both activities that are also positively associated with socioeconomic status. For instance, income, education, and the age of housing have all been found to explain resident participation in tree planting initiatives (Greene et al., 2011). Another study found that tree planting rates were twice as high on single-unit housing parcels compared to multi-unit housing (Steenberg et al., 2018). Consequently, it may be that in these more affluent neighborhoods the rate of tree mortality associated with renovation activity is higher but is in fact offset by the higher rates of tree planting and stewardship. Moreover, the pattern of development (e.g. more green space) and housing conditions (e.g. larger, older, single-unit housing) translate to more space for urban trees and greater numbers of existing mature trees, where higher mortality rates may be less noticeable over time.
Under certain conditions of urban change, however, there may be a possibility of substantial decline in canopy cover and associated ecosystem services. During neighborhood revitalization or where a neighborhood with older housing stock experiences a comparatively rapid transition from lower to higher affluence, there will be a corresponding spike in renovation activities (Helms, 2003). Steenberg et al. (2018) conducted an empirical study of tree mortality and tree planting in a residential neighborhood in Toronto that had a steady increase in income and homeownership and a tripling of building permit applications since 2000. They found that parcels and street sections with increased renovation activity were associated with lower amounts of leaf biomass and higher rates of tree mortality, both of which translate to declines in several noted ecosystem services (Nowak et al. 2008). The rapid influx of wealth and corresponding investment in housing stock could be quite detrimental to the existing tree population where mortality rates exceed tree planting rates, leading to an overall decline in canopy cover. This theory needs to be substantiated with further empirical and longitudinal data, but would be worthwhile research given the municipal regulation of building renovation and the corresponding opportunity for management intervention around tree protection and homeowner education. Another critical piece of future research would be to differentiate between deliberate tree removals and accidental tree mortality during the renovation process.
There are a number of important limitations to this study that should be discussed. First and most importantly is the issue that building permits could not be differentiated by type. This is a source of uncertainty and limitation of the study because the degree of renovation activity for which the building permit was issued might range from small interior alterations to major building additions and demolition. Tree mortality might not be expected in association with the former while it could be with the latter. This limitation points to the need for consistent record keeping and coordination between urban planning and urban forestry departments, but also to the need for further empirical research on this topic that is validated with field work. As mentioned in the methods section, there is also a potential for the misclassification of mortality in the tree mortality analysis, given variable building and parcel sizes and the leaf-off 2003 imagery. Finally, in the tree mortality analysis, we did not separate between public (i.e. street) and private trees. Because so many public trees in Toronto are situated on residential front and side lawns within the public right of way, we argue that they are also at risk of damage and mortality from renovation activities. However, such trees might also be subject to management activities (e.g. road construction, utility line clearing) that could put them at greater risk of mortality, so this lack of distinction between public and private is a source of uncertainty in the study.
Lastly, we want to address the utility of government open data for both urban forest researchers and practitioners. Open data and open government are an increasingly common phenomenon among municipalities worldwide, where data collected and used in the governing process are being made available for public use (Janssen et al., 2012). Some of the guiding philosophies of open data include increasing government transparency and accountability and improving service delivery and citizen interactions with local government (Janssen et al. 2012). The value of government open data for understanding and managing urban ecosystems is a less-prominent theme in the expanding open data discourse. Yet, the types of data collected by government and their considerable spatial and temporal resolution (e.g. 16 years of daily, parcel-level building permit data) offer insight into both the social and ecological processes shaping urban ecosystems that would not otherwise be feasible with traditional research. There is also value for municipal managers and communities. For instance, tree inventory data are now being made available through open data programs that can be used by residents and community groups in stewardship initiatives (Roman et al., 2013). Indeed, some cities are leveraging this stewardship and citizen science momentum so that communities can contribute to municipal tree inventories through open data programs and participatory mapping (Foster and Dunham, 2015). The urban forest is a vital ecosystem service provider, and researchers and practitioners alike should leverage novel sources of data and technology to inform management and mitigate the impacts of disturbance where possible.
Footnotes
Acknowledgements
We would like to thank the Ryerson University Geospatial Map & Data Centre.
Declaration of conflicting interests
The author(s) declared no potential conflicts of interest with respect to the research, authorship, and/or publication of this article.
Funding
The author(s) disclosed receipt of the following financial support for the research, authorship, and/or publication of this article: Funding for this research was provided by the Killam Trusts at Dalhousie University and the Canadian Geospatial and Open Data Research Partnership (geothink.ca), which is a five-year partnership grant funded by the Social Sciences and Humanities Research Council (SSHRC).
Supplemental material
Supplemental material is available for this article online.
References
Supplementary Material
Please find the following supplemental material available below.
For Open Access articles published under a Creative Commons License, all supplemental material carries the same license as the article it is associated with.
For non-Open Access articles published, all supplemental material carries a non-exclusive license, and permission requests for re-use of supplemental material or any part of supplemental material shall be sent directly to the copyright owner as specified in the copyright notice associated with the article.