




Abstract
In the context of rapid population aging, Beijing is facing great challenges in providing healthcare services for the elderly. The objective of this study is to measure the spatial accessibility of the elderly to healthcare services in Beijing. A major challenge is that healthcare services are not exclusive for the elderly, so the elderly must compete with the non-elderly for access to healthcare services. In this study, we have developed a multi-mode and variable-demand two-step floating catchment area model for measuring spatial accessibility of the elderly to healthcare services, taking into account the competition between the elderly and non-elderly. This is modeled by differences in demand intensity and mobility. The elderly have a higher demand intensity and are disadvantaged in mobility due to their higher dependence on public transportation than the non-elderly. To improve the elderly’s healthcare accessibility, more healthcare resources should be allocated and the public transportation to hospitals should be improved, especially in peripheral areas. The proposed model can also be applied in other scenarios considering multiple population groups with different demand intensity for public services and mobility.
Keywords
Introduction
Beijing, the capital of China, is facing the challenge of population aging in terms of the enormous size and high proportion of elderly people and the rapid increase in the aging population (Tao et al., 2014). It has become a critically important issue to provide care services such as residential and healthcare services for the elderly. The geographical disparity of these services has been identified as a major cause for inequality in health outcomes (Wang, 2012; Wang et al., 2008). Spatial accessibility has been widely used as an efficient method for measuring the opportunities to access services as well as their geographic disparities (Guagliardo, 2004; Wang, 2012).
Various methods have been developed for measuring spatial accessibility to public services, especially healthcare services (Guagliardo, 2004; Yang et al., 2006). The two-step floating catchment area (2SFCA) method is the most widely applied measure of spatial accessibility due to its operability (Wang, 2015). Many improvements to 2SFCA have been made in recent studies (McGrail, 2012; Tao and Cheng, 2016a; Vo et al., 2015), which can be classified into four types (Tao and Cheng, 2016a): improvements in distance decay functions (Dai, 2010; Dai and Wang, 2011; Luo and Qi, 2009), improvements in catchment area delineation (Jamtsho et al., 2015; Luo and Whippo, 2012; McGrail and Humphreys, 2014), improvements in the competition among demanders or facilities (Delamater, 2013; Luo, 2014; Wan et al., 2012), and improvements in travel behaviors of demanders (Fransen et al., 2015; Mao and Nekorchuk, 2013). These improvements have enhanced the theoretical foundation and applicability of 2SFCA for diverse case studies.
Recent studies have paid attention to the spatial accessibility to residential care services in Beijing (Cheng et al., 2012; Tao et al., 2014) or in other Chinese cities (Ding et al., 2016; Ni et al., 2015). However, little attention has been paid to the spatial accessibility to healthcare services of the elderly in Beijing. Therefore, the objective of this study is to analyze the elderly’s spatial accessibility to healthcare services and its geographical disparity in Beijing. This study aims to provide knowledge-based information for the planning and allocation of healthcare resources for the elderly, which is an important approach to address the challenges of population aging in Beijing. The empirical results reveal the pattern of the elderly’s healthcare accessibility in Beijing and suggestions are made regarding how to optimize the allocation of healthcare services, which is useful for policy making.
Several issues, however, need to be addressed for conducting the analysis of the elderly’s spatial accessibility to healthcare services. First, what types of healthcare services are available for the elderly? The available data on healthcare facilities do not usually include the information on service utilization by various population groups. In practice, most healthcare services are available to different age groups. Thus, healthcare services for the elderly cannot be differentiated among the overall healthcare services from statistical data as the elderly are competing for healthcare services with the non-elderly.
Second, what factors influence the elderly’s utilization of healthcare services competing with other age groups? Among the various potential factors, two major factors are taken into account in this study: the demand intensity and mobility of the elderly. The national health survey in China showed that the elderly have a higher demand intensity to healthcare services than the non-elderly (Center for Health Statistics and Information, 2015). As for mobility, the hypothesis is that the elderly are disadvantaged in mobility. They are highly dependent on public transportation as they have relatively limited use of private cars.
Third, how can the above factors be modelled to measure spatial accessibility? The 2SFCA method must be modified to measure the differences in demand intensity and mobility between the elderly and the non-elderly. A multi-mode 2SFCA incorporating a mixed-mode transportation (private cars and public transport) is developed to account for the differences in mobility. An additional coefficient of demand intensity is incorporated into the model. Moreover, the Baidu Map APIs (Application Programming Interfaces) are utilized to obtain more accurate estimations of travel time by means of private car and public transportation (Baidu Map, 2017).
Modelling spatial accessibility of the elderly to healthcare services
The generalized 2SFCA framework
The 2SFCA method measures the spatial accessibility in two steps. In the first step, it searches all the demand nodes within the catchment areas of each facility, and then calculates the supply-to-demand ratio for each facility, i.e. the average supply per potential service user. In the second step, it adds up the supply-to-demand ratios of all facilities located in the catchment area of each demand node. The sum of the supply-to-demand ratios for each demand node is its spatial accessibility score.
The original form of 2SFCA adopts a dichotomous distance decay function. It assumes that the demanders within the catchment areas share equal accessibility, while the demanders outside of the catchment areas have no accessibility. Several extensions of 2SFCA have been developed with respect to the distance decay function (Dai, 2010; Dai and Wang, 2011; Luo and Qi, 2009), which can be integrated into the generalized 2SFCA framework proposed by Wang (2012):

The distance decay function f can take a dichotomous form as the traditional 2SFCA (Luo and Wang, 2003), or continuous forms such as the Gaussian form (Dai, 2010) or the kernel density form (Dai and Wang, 2011). In this study, the Gaussian function is adopted to measure the distance-decay function. The advantage of the Gaussian function over other alternatives is that the value of the function is bounded (from 0 to 1) and decreases gently when travel/time distances increase. In contrast, the widely used power function tends to approach infinity when travel/time distance is approaching zero, which may overestimate the weights of demanders close to the facilities. Moreover, only one input parameter is needed when applying the Gaussian function, while other alternatives (e.g. power function) need two or more parameters. Less parameters can reduce the subjectivity or uncertainty of the method when applied. The Gaussian form of the distance decay function f can be written as:

The multi-mode 2SFCA
Taking into account the differences in mobility among multiple population groups, the generalized 2SFCA framework needs to be integrated with multiple transportation modes. The travel time between two sites (e.g. from a demand node to a facility) by public transportation is usually longer than by cars.
The difference in shares of transportation modes between the elderly and non-elderly can be taken into account in two approaches. The first approach is to combine the travel times by multiple transportation modes into a mixed-mode travel time. In another words, the travel time variable



Similar to formula 3, the spatial accessibility of the non-elderly at demand nodei can be calculated by:

Mao and Nekorchuk (2013) have developed a modified model of 2SFCA, also named multi-mode 2SFCA, which is similar to ours as follows: they consider multiple transportation modes and they divide the population into multiple subgroups to reflect differences in transportation modes among the subgroups. However, in the model of Mao and Nekorchuk (2013), each subpopulation only chooses a single transportation mode while in this study, multiple transportation modes can be considered by introducing a weight denoting the share of each transportation mode, which can be different for each subpopulation.
Second, their model adopts a dichotomous distance decay function as the traditional 2SFCA, which has been widely argued as a major shortcoming of the method (Luo and Qi, 2009; Wang, 2012). In contrast, our model adopts the Gaussian function on the foundation of the generalized 2SFCA framework, which can be easily replaced by other forms.
The multi-mode 2SFCA with variable demand
To reflect the difference in demand intensity between the elderly and the non-elderly, a demand intensity coefficient is incorporated into the multi-mode 2SFCA. It can be written as:


Case study in Beijing
Study area and data sources
There are 16 districts in Beijing, which is divided into four functional areas according to the Beijing Urban Master Plan (2004–2020). As shown in Figure 1, the Capital Core Functional Area includes Dongcheng and Xicheng District, and the Urban Functional Extension Area includes Chaoyang, Haidian, Fengtai and Shijingshan District. The six districts in the two functional areas compose the central area of Beijing. The suburban districts are mainly included in the Urban New Developing Area (five districts), and the peripheral districts are mainly included in the Ecological Protection Area (five districts). The five districts in the Ecological Protection Area are exurban areas. In contrast, the five districts in the Urban New Developing Area are more developed and have better opportunities to share the socio-economic resources (e.g. healthcare services) in the central area. In addition, the (elderly) population density and the numbers of hospital in the Ecological Protection Area are quite small (see Figure S1 and S2 in the Supplementary Information). Therefore, the five districts in the Ecological Protection Area are not included in our study area.
The functional area of districts in Beijing (the blue polygon outlines the study area).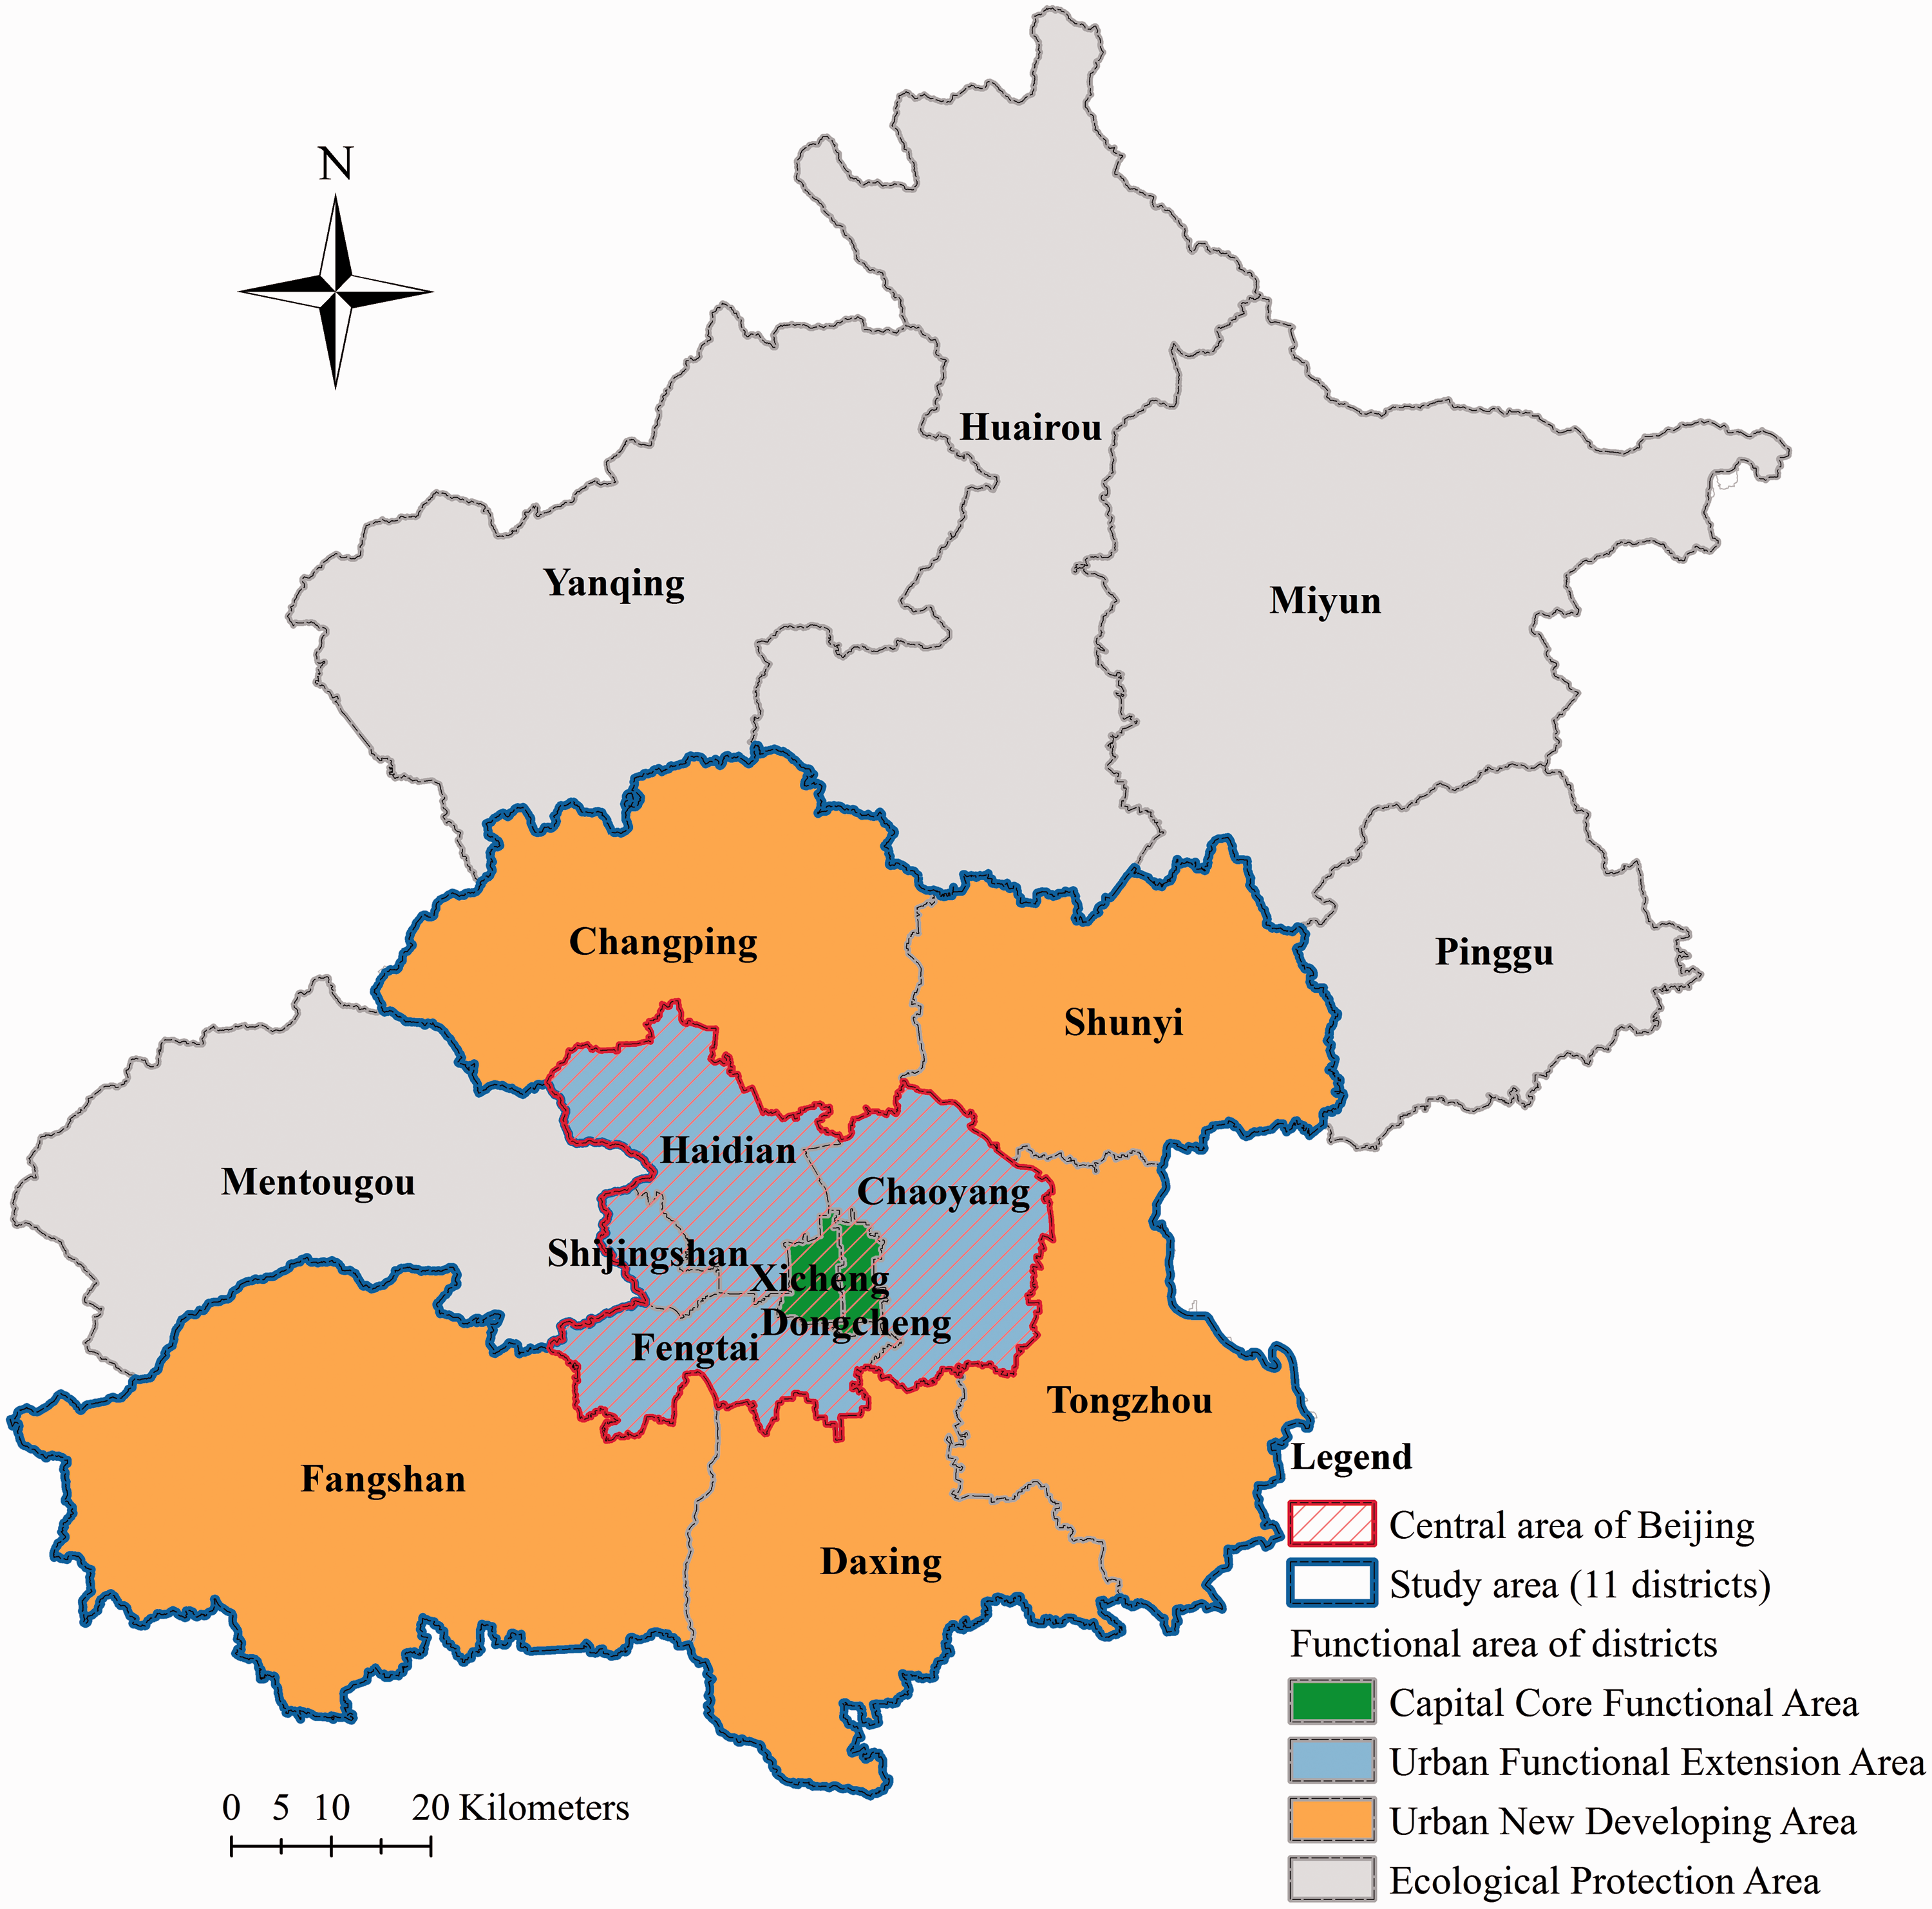
The population data at the sub-district level are from the 6th population census of China. In the census, there are 324 sub-district administrative units in Beijing, where 240 sub-districts are located in the study area. The elderly population is defined as the population aged 65 and over, while the non-elderly are aged less than 65. The distribution of the elderly population density shows an uneven pattern, with a decreasing elderly population density outwards as the distance increases from the city center (Figure S1). Most of the areas with relatively high elderly population density are located in the study area.
The data of hospitals in 2013 are from the query system for designated medical institutions from the Beijing Municipal Human Resources and Social Security Bureau (2016) and the Beijing Municipal Commission of Health and Family Planning (2014) websites. Information from the two sources was combined into one database, including the names, addresses, levels and numbers of beds of the hospitals in three levels. The first-level hospitals, or the community healthcare centers, are numerous and their sizes are small, so the first-level hospitals are not included for analysis in this study. As for the other two levels of hospitals, some specialized hospitals are excluded from the database as they provide little services for the elderly (e.g. maternity hospitals, children’s hospitals, tuberculosis hospitals and dermatosis hospitals). There are 101 Secondary Hospitals and 88 Tertiary Hospitals in Beijing (Figure S2). The density of the networks of roads, subways and buses are higher in the central city (Figure S3 in the Supplementary Information).
Estimating travel time via Baidu Map APIs
Various measures of travel distance have been adopted in existing spatial accessibility studies. Travel time is a better measure for the spatial impediment between demanders and facilities than the Euclidean distance. Time distance does not only reflect the absolute spatial distance between two sites (Haynes et al., 2005), but also depends on mobility and available transportation modes. Most studies calculate travel time by setting a driving speed to each road level and then using road network analysis tools to find the minimum travel time between any two sites, e.g. the OD matrix tool in the Network Analysis toolbox of ArcGIS. The driving speed is often set according to the technical limitation of the roads (Jia et al., 2014; Ni et al., 2015) or the actual driving speed in the study area (Tao et al., 2014). A limitation of this method is that the accuracy of the results depends on the driving speed, which is somewhat arbitrary in practice. Moreover, transportation network data available to individual researchers are often outdated (Wang and Xu, 2011).
Recently, some studies have introduced APIs of map developers such as Google Maps or Baidu Map to calculate travel time (Cheng et al., 2016; Gu et al., 2010; Wang and Xu, 2011). In this way, researchers can make use of the dynamically updated transportation network data and the routing rules maintained by map developers to obtain reliable estimation of travel time (Wang and Xu, 2011). This study uses Baidu Map APIs (lbsyun.baidu.com/index.php) to automatically obtain travel time from sub-districts to hospitals. Two independent APIs, the Transit Searching API and the Driving Searching API, have been developed by Baidu Map to estimate travel time by public transportation or by car, respectively.
The centroid of the administrative boundary of each sub-district represents the location of demanders at the sub-district level. Travel time by public transportation or by car from each sub-district to each hospital was calculated. Thus, there are 82,560 origin-destination pairs to be calculated. The travel time estimated by APIs is real-time, so the estimation of travel times are time-dependent. Considering that most visits to hospitals happen during the daytime, and the peak-hour travel time is more relevant to commuting behavior rather than visiting hospitals, the estimation of travel time via APIs is constrained between 10 a.m. and 5 p.m.
Setting parameters
The demand intensity is measured by the hospitalization rate, which is defined as the number of hospitalizations per hundred people. The hospitalization rate of the elderly population for Beijing is taken as the rate for urban areas in eastern China from the Analysis Report of the 5th National Health Services Survey in China (Center for Health Statistics and Information, 2015), which is 17.6%. This is significantly higher than other age groups, implying that the demand intensity for healthcare services will also be significantly higher for the elderly than the non-elderly. The hospitalization rate of the non-elderly was calculated as the population-weighted average of each age group less than 65, which is 5.3%. Since the relative demand intensity of the elderly is approximately three times that of the non-elderly, we set the demand intensity coefficient of the non-elderly Cn to 1, and the coefficient of the elderly Ce to 3.
The shares of transportation modes of the elderly are set according to a survey on elderly travel behavior in Beijing (Xia and Guan, 2013). In the survey, seven transportation modes are included: walking, cycling, by wheelchair, bus, subway, taxi and private cars. Since the distance to the Tertiary and Secondary Hospitals is relatively far, the latter four transportation modes dominate, while the former three modes may play a major role when the elderly visit community healthcare centers. Among the four modes, the former two (bus and subway) are combined into “public transportation” while the latter two (taxi and private car) are combined into “by car”. The total shares of these two combined modes are 34.1% and 12.2%, respectively. After standardization, the shares become 73.7% by public transportation and 26.3% by car; thus we is 0.737.
The shares of transportation modes of the non-elderly are taken from the Annual Report of Transport Development in Beijing (Beijing Transport Institute, 2012). Since the survey on the elderly was conducted in 2012, the annual report in 2012 is used to ensure the consistency between the elderly and non-elderly. The shares of public transportation (including bus and subway), private car and taxi were 42%, 33% and 6.9%, respectively. Similarly, the two modes of by private car and taxi were combined into one (by car, the total share is 39.9%). Then, the two shares (42% versus 39.9%) were standardized as 51.3% and 48.7%. The share of public transportation for the non-elderly wn was set to 0.513.
The threshold travel time d0 (size of catchment area) was set to ensure that the vulnerable group (the elderly) in most sub-districts could access at least one hospital within the catchment area. For this purpose, we rank the elderly’s mixed-mode travel time at each sub-district to the nearest hospital in Figure 2. There is an obvious cut-off (124 minutes) in the diagram: the points below the cut-off are continuous and account for 233 out of 240, while the points above the cut-off are rare and dispersed. Therefore, the size of catchment area d0 is set to 124 minutes. By doing so, the vast majority of the elderly can access at least one healthcare facility within the threshold travel time, while the remaining minority (the seven sub-districts above the threshold line in Figure 2) are located far from the nearest facility and are considered inaccessible to healthcare facilities. The travel time of the non-elderly in the seven sub-districts is also larger than the threshold; therefore we exclude the seven sub-districts from the catchment areas of all the healthcare facilities. Although the threshold travel time is the same for the elderly and non-elderly, the mobility of the elderly is poorer than the non-elderly due to their higher dependence on public transportation. Therefore, the size of the catchment area for the elderly is smaller than the non-elderly since they travel a shorter distance than the non-elderly during the same time period. Hence the opportunities for the elderly to access healthcare facilities are less than the non-elderly.
Distribution of the elderly’s travel time at each sub-district to the nearest hospital.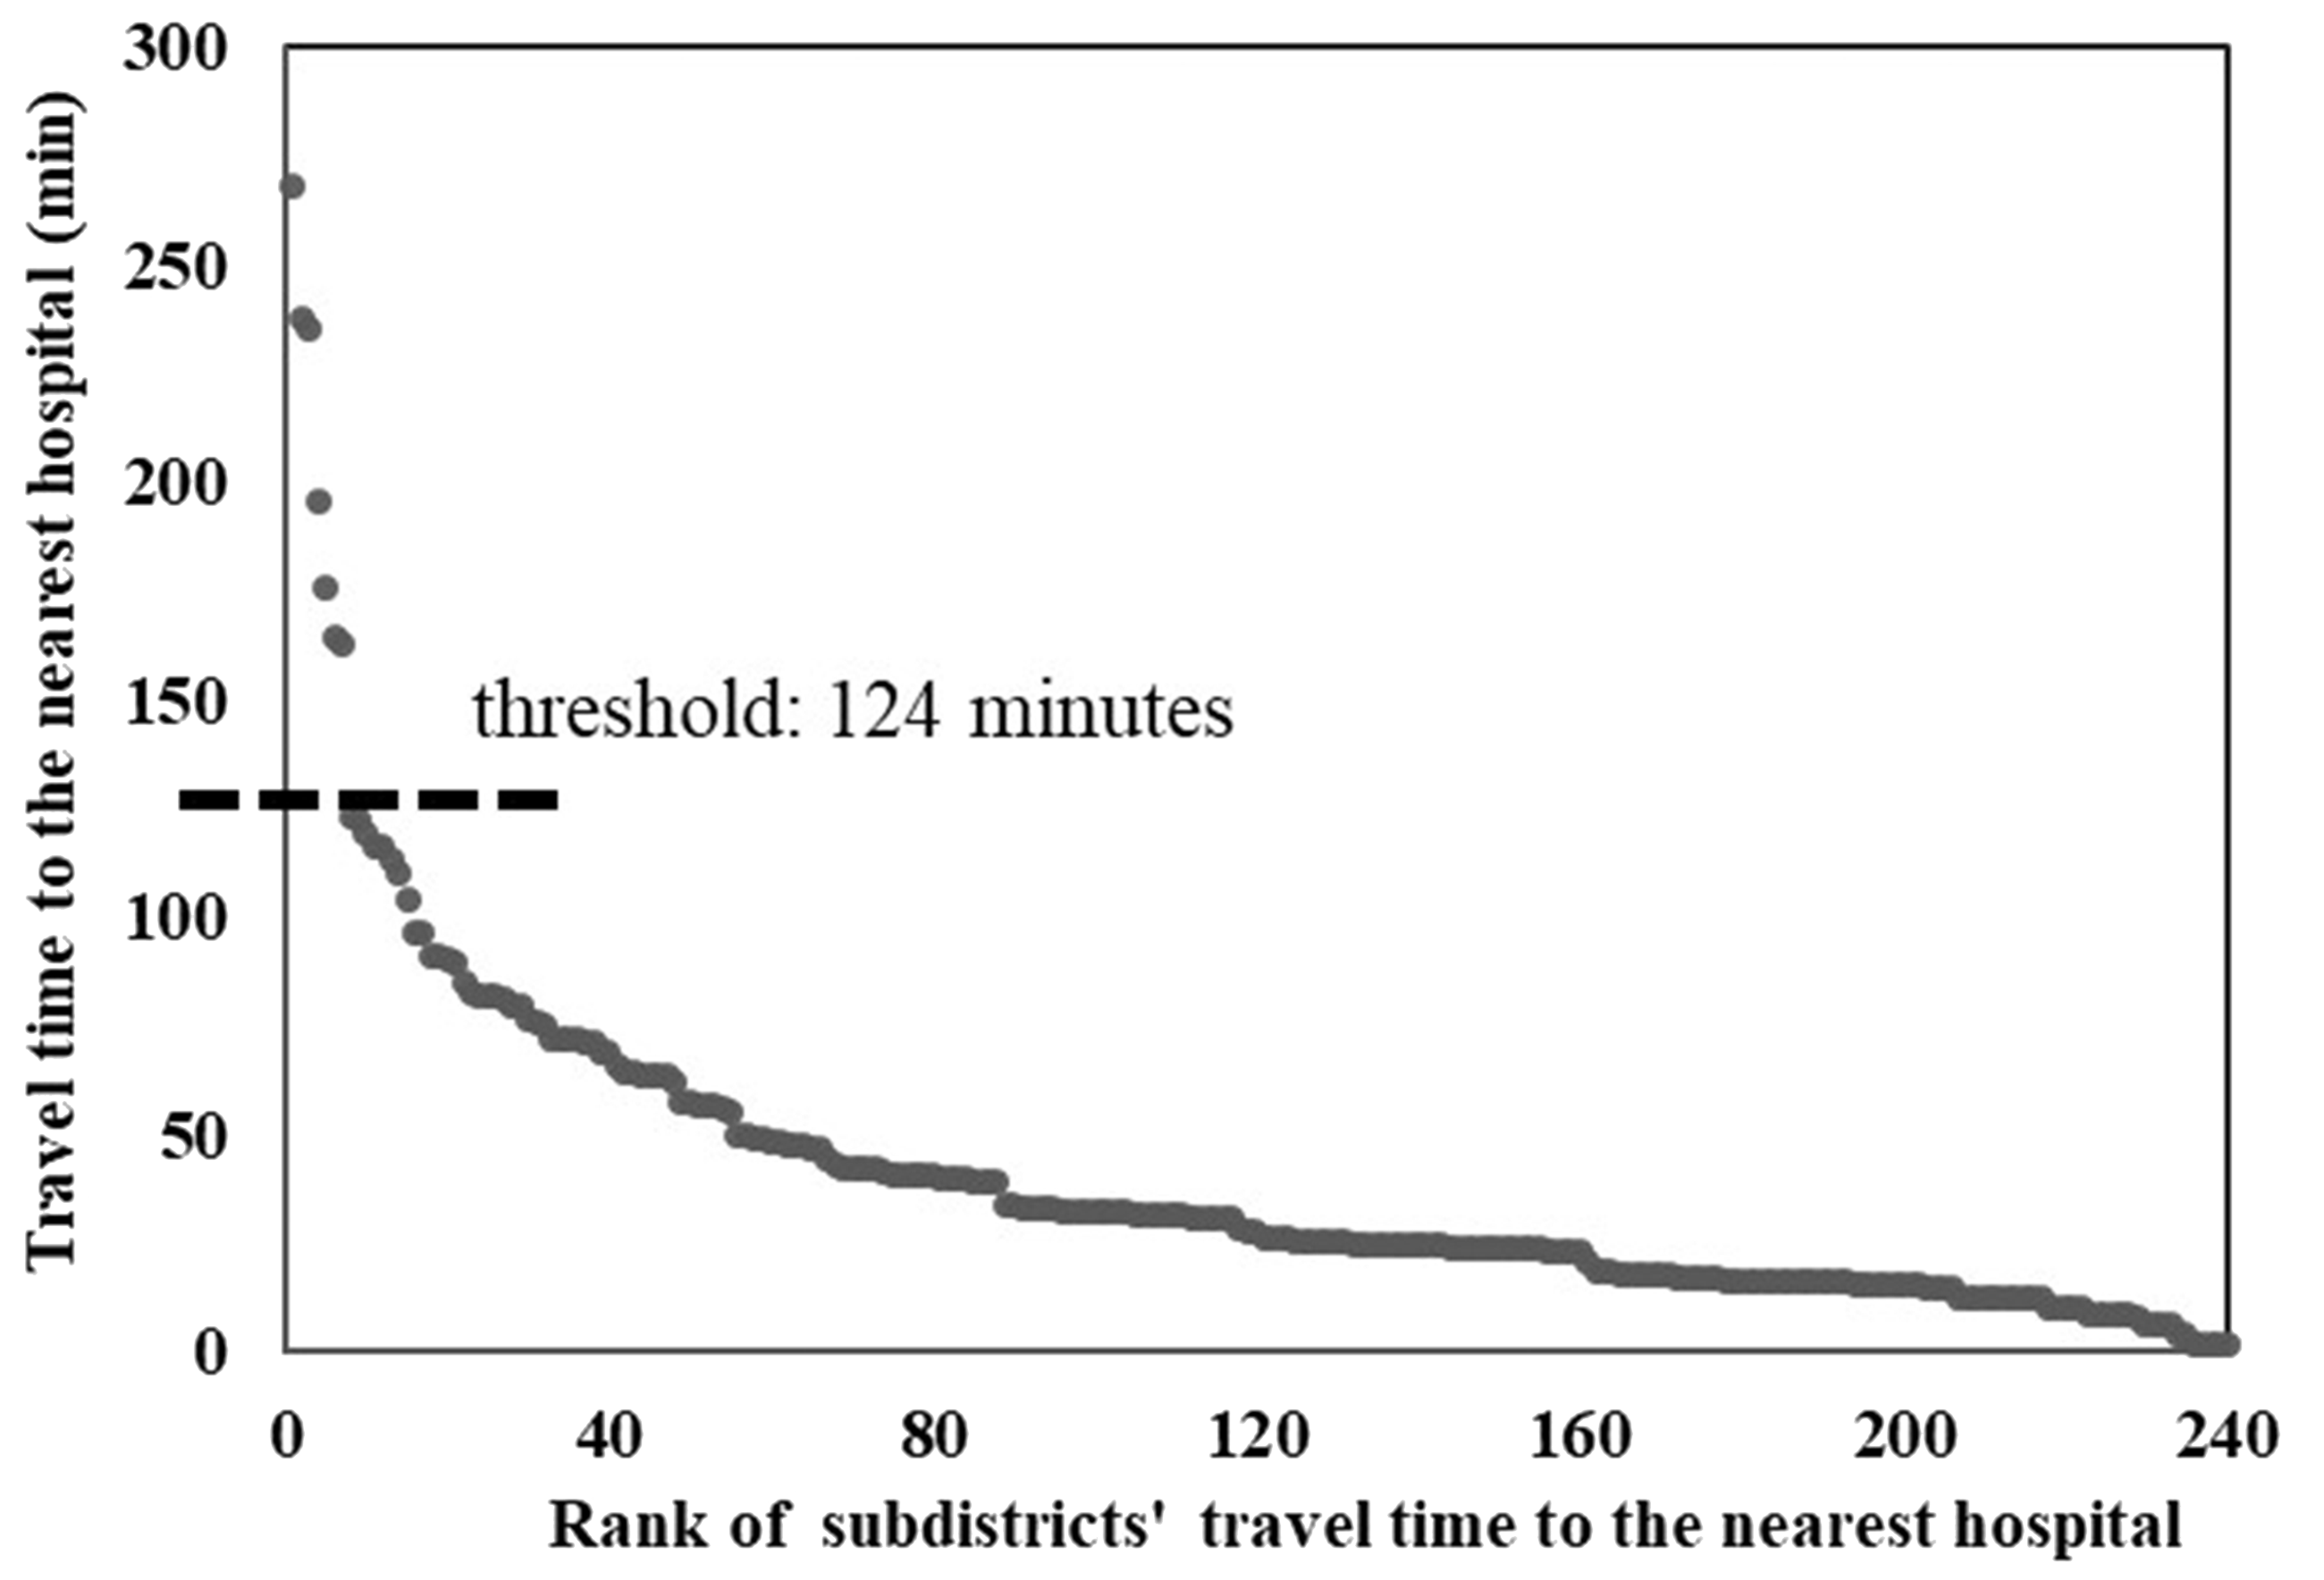
In addition, a sensitivity analysis of the threshold travel time is conducted by calculating spatial accessibility for two different threshold travel times (100 minutes and 140 minutes) around the baseline of 124 minutes. The results of these scenarios are compared to investigate the impact of threshold travel time on the spatial patterns of accessibility.
Results
Geographic disparities in spatial accessibility of the elderly
The sensitivity analysis of catchment area size d0 can be found in the Supplementary Information, which reveals that the value of catchment area size has a relatively small impact on the healthcare accessibility of the elderly. Therefore, the following the analysis is conducted using the scenario d0 = 124 minutes. The elderly’s spatial accessibility ranges from 0 to 0.0183. The average spatial accessibility of the elderly in Beijing is 0.0091 (the seven inaccessible sub-districts mentioned previously are excluded in the calculation for average accessibility), which means that 9.1 hospital beds are available per thousand elderly people. The average accessibility is not the ratio of total supply to total demand as in the traditional 2SFCA method as the elderly and the non-elderly compete for the shared healthcare resources.
As shown in Figure 3, the spatial distribution of the elderly’s spatial accessibility to healthcare services is quite uneven and shows a concentrated pattern in Beijing. The coefficient of variation (calculated as the ratio of standard deviation to average) is 0.6264, which reaches a relatively high level. The spatial accessibility decreases significantly from the city center outwards, as a result of the concentrated distribution of hospitals in the central area. In addition, the better transportation both in terms of road network and public transportation services in the central area may further strengthen the concentration of spatial accessibility.
Spatial accessibility of the elderly to healthcare services in Beijing when d0 = 124 minutes.
The accessibility along the subways are relatively higher. However, we cannot draw the conclusion that the spatial proximity to a subway network can significantly improve the elderly’s healthcare accessibility since the distribution of healthcare facilities also tends to concentrate along subways (see Figure S2). The impact of spatial proximity to the subway network is discussed later in the paper.
Difference between the elderly and the non-elderly
The non-elderly’s spatial accessibility ranges from 0 to 0.0068 where average accessibility is 0.0040. This is less than half of the elderly’s accessibility score (0.0091). However, it does not mean the actual average accessibility of the elderly is better than the non-elderly. The demand intensity of the elderly is three times that of the non-elderly, but the average accessibility of the elderly is only 2.28 times that of the non-elderly. Therefore, the relative average accessibility of the elderly is 0.76 times that of the non-elderly, which implies that the elderly are disadvantaged in their competition with the non-elderly for healthcare services.
To analyze the difference between the elderly and the non-elderly, the ratios of the accessibility of the two groups are calculated. As shown in Figure 4, the ratio of accessibility decreases from the city center outwards, indicating that the spatial distribution of the accessibility of the elderly is more concentrated than the non-elderly. The concentrated distribution of Secondary and Tertiary Hospitals makes it difficult for both the elderly and non-elderly in peripheral areas to access hospital services. The mobility disadvantage of the elderly is more obvious than the non-elderly in the peripheral areas. Thus the difference between peripheral and central areas is larger for the elderly.
The accessibility ratio of the elderly to non-elderly in Beijing.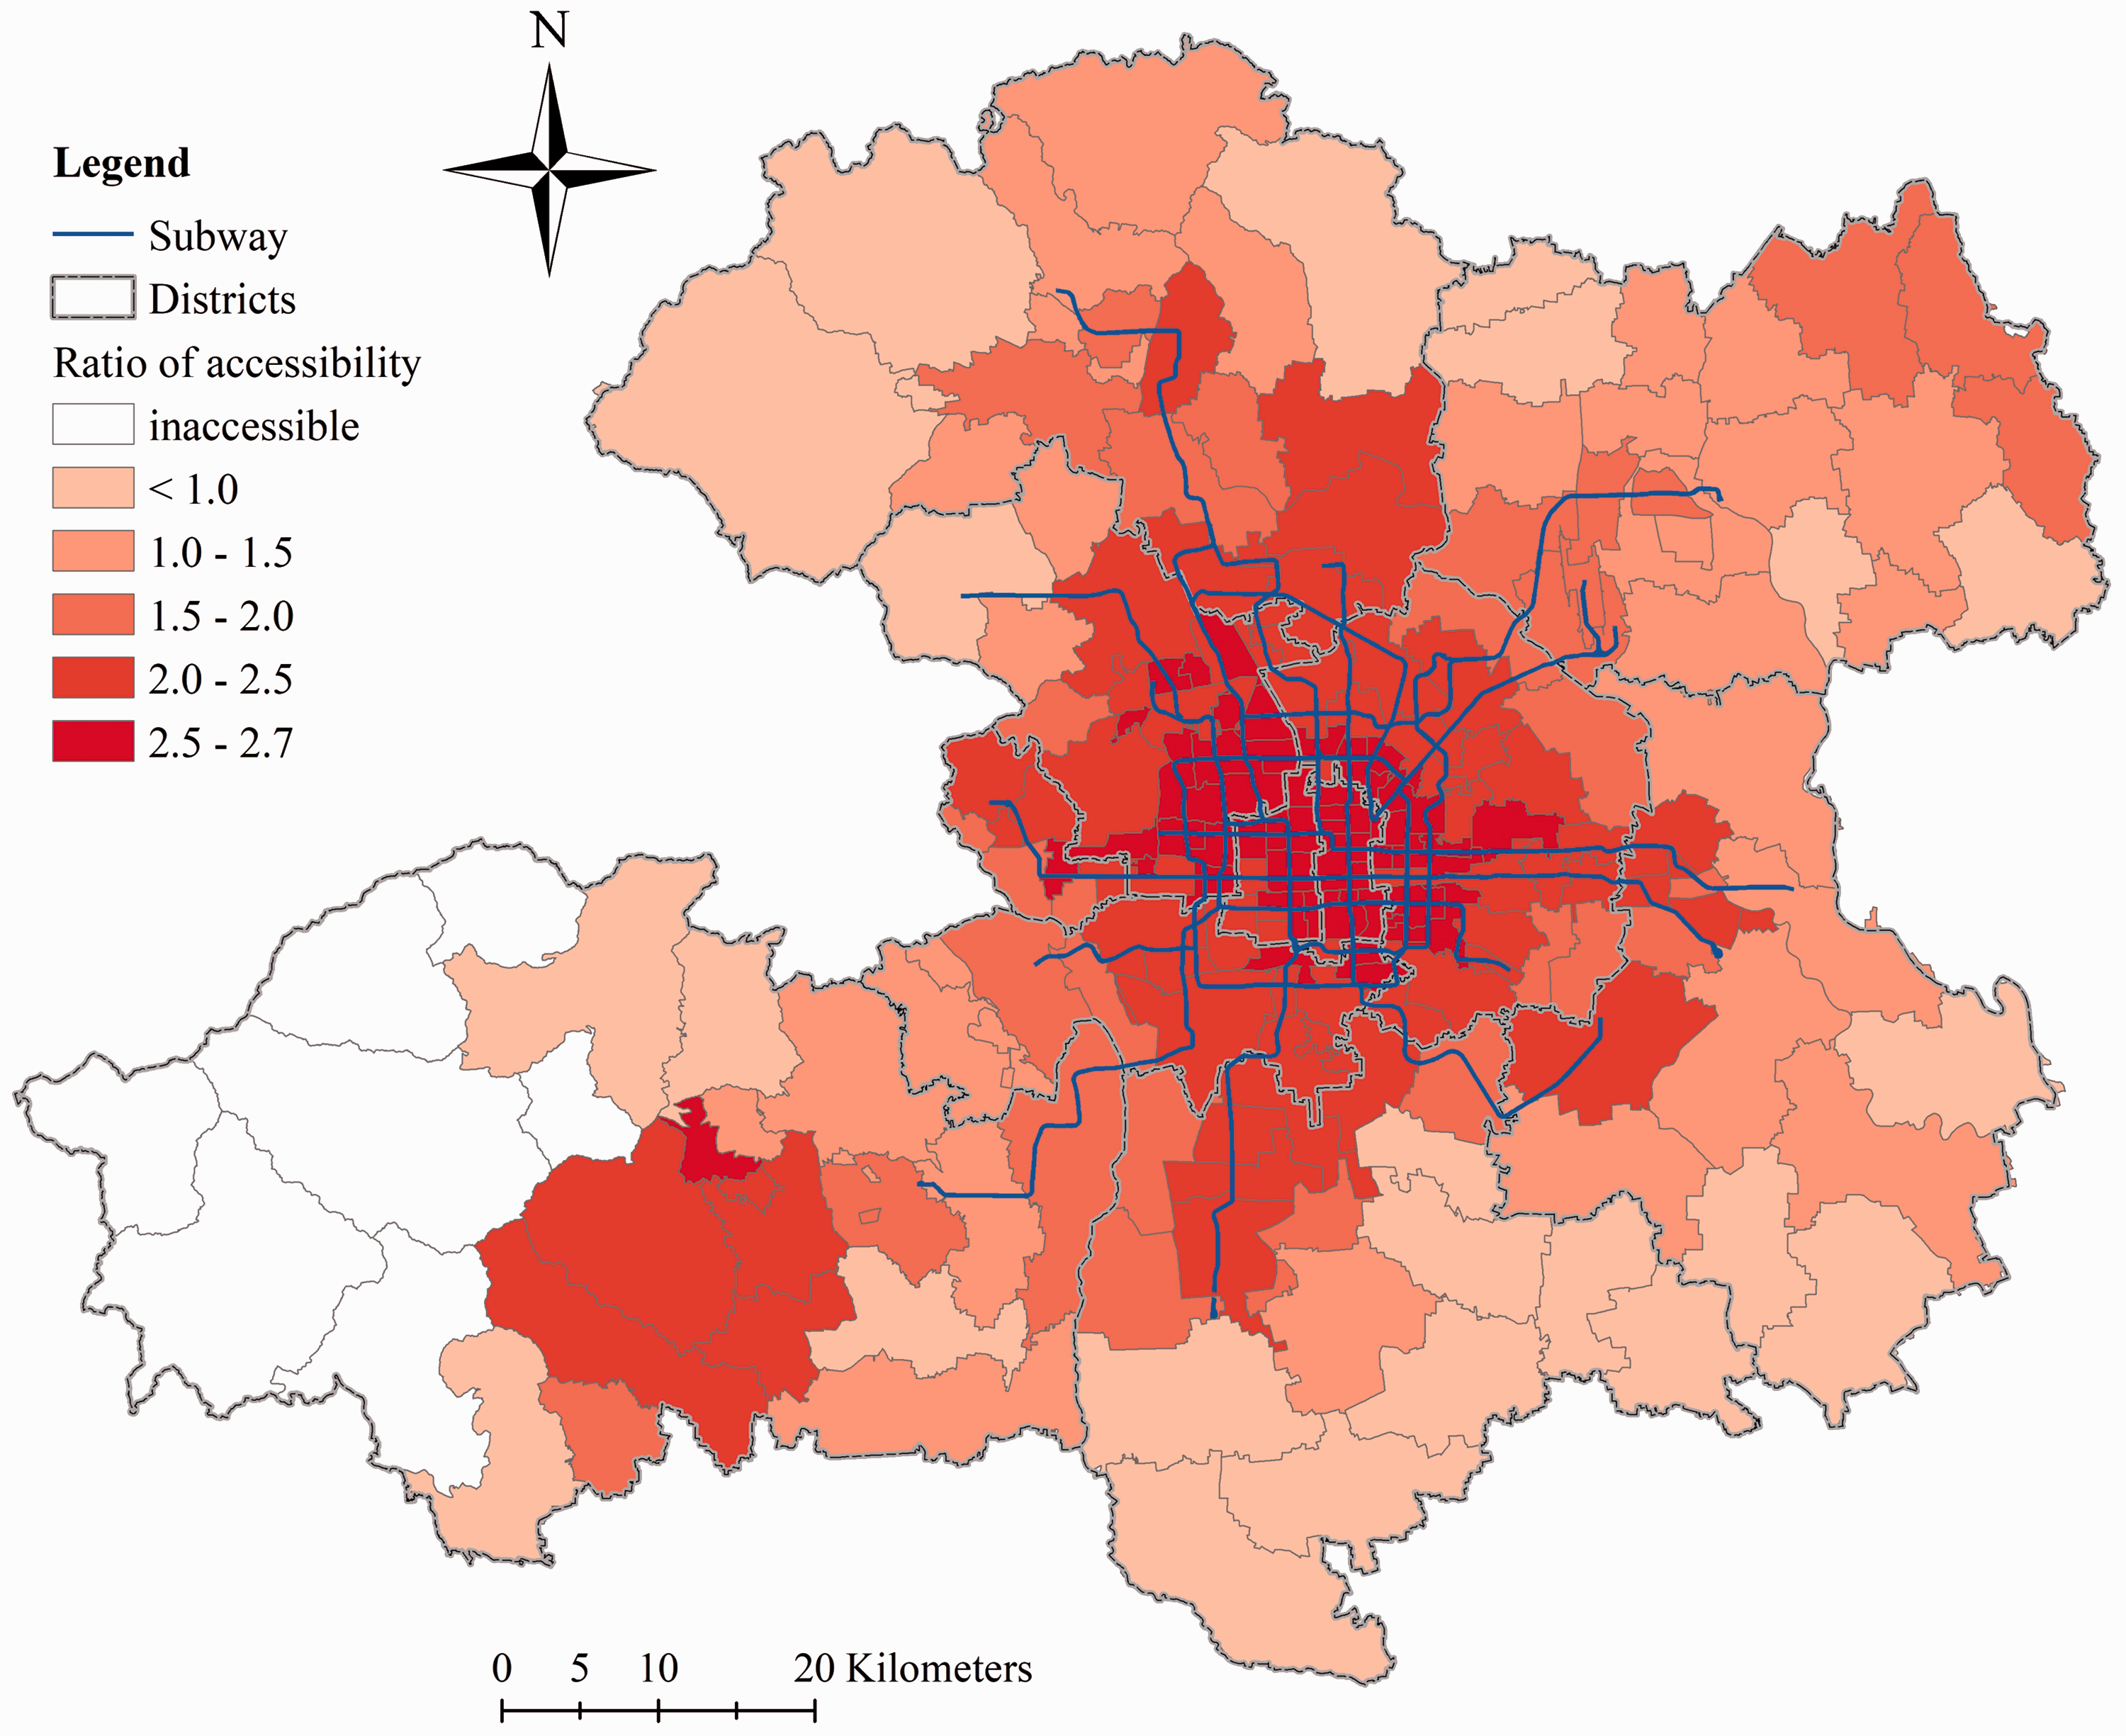
In Figure 4, the impact of the spatial distribution of healthcare facilities is eliminated when calculating the ratio of accessibility. The ratio of accessibility tends to be larger along the subway network, which indicates that the spatial proximity to the subway network can reduce the elderly’s disadvantage in mobility and thus improve their competitiveness for healthcare services.
Impacts of the share of public transportation
In this part, the demand intensity of the elderly is set to the same as the non-elderly. Thus, the difference between the spatial accessibility of the elderly and the non-elderly is caused by the difference in mobility, which is measured by the accessibility ratio of the elderly to non-elderly.
As shown in Figure 5, the spatial accessibility of the elderly is overall smaller than the non-elderly with a maximum ratio of 0.91 and an average ratio of 0.64. A smaller ratio indicates a stronger disadvantage of the elderly in accessing healthcare services. The ratio decreases from the center outwards, indicating that the elderly are more disadvantaged in mobility in the peripheral areas than in the central area. The reason is that the public transportation is poorer in the peripheral areas, and the elderly are more dependent on it. Therefore, it is more difficult for the elderly in the peripheral areas to access healthcare services than those in the central areas.
The accessibility ratio of the elderly to non-elderly with unique demand intensity and variable mobility.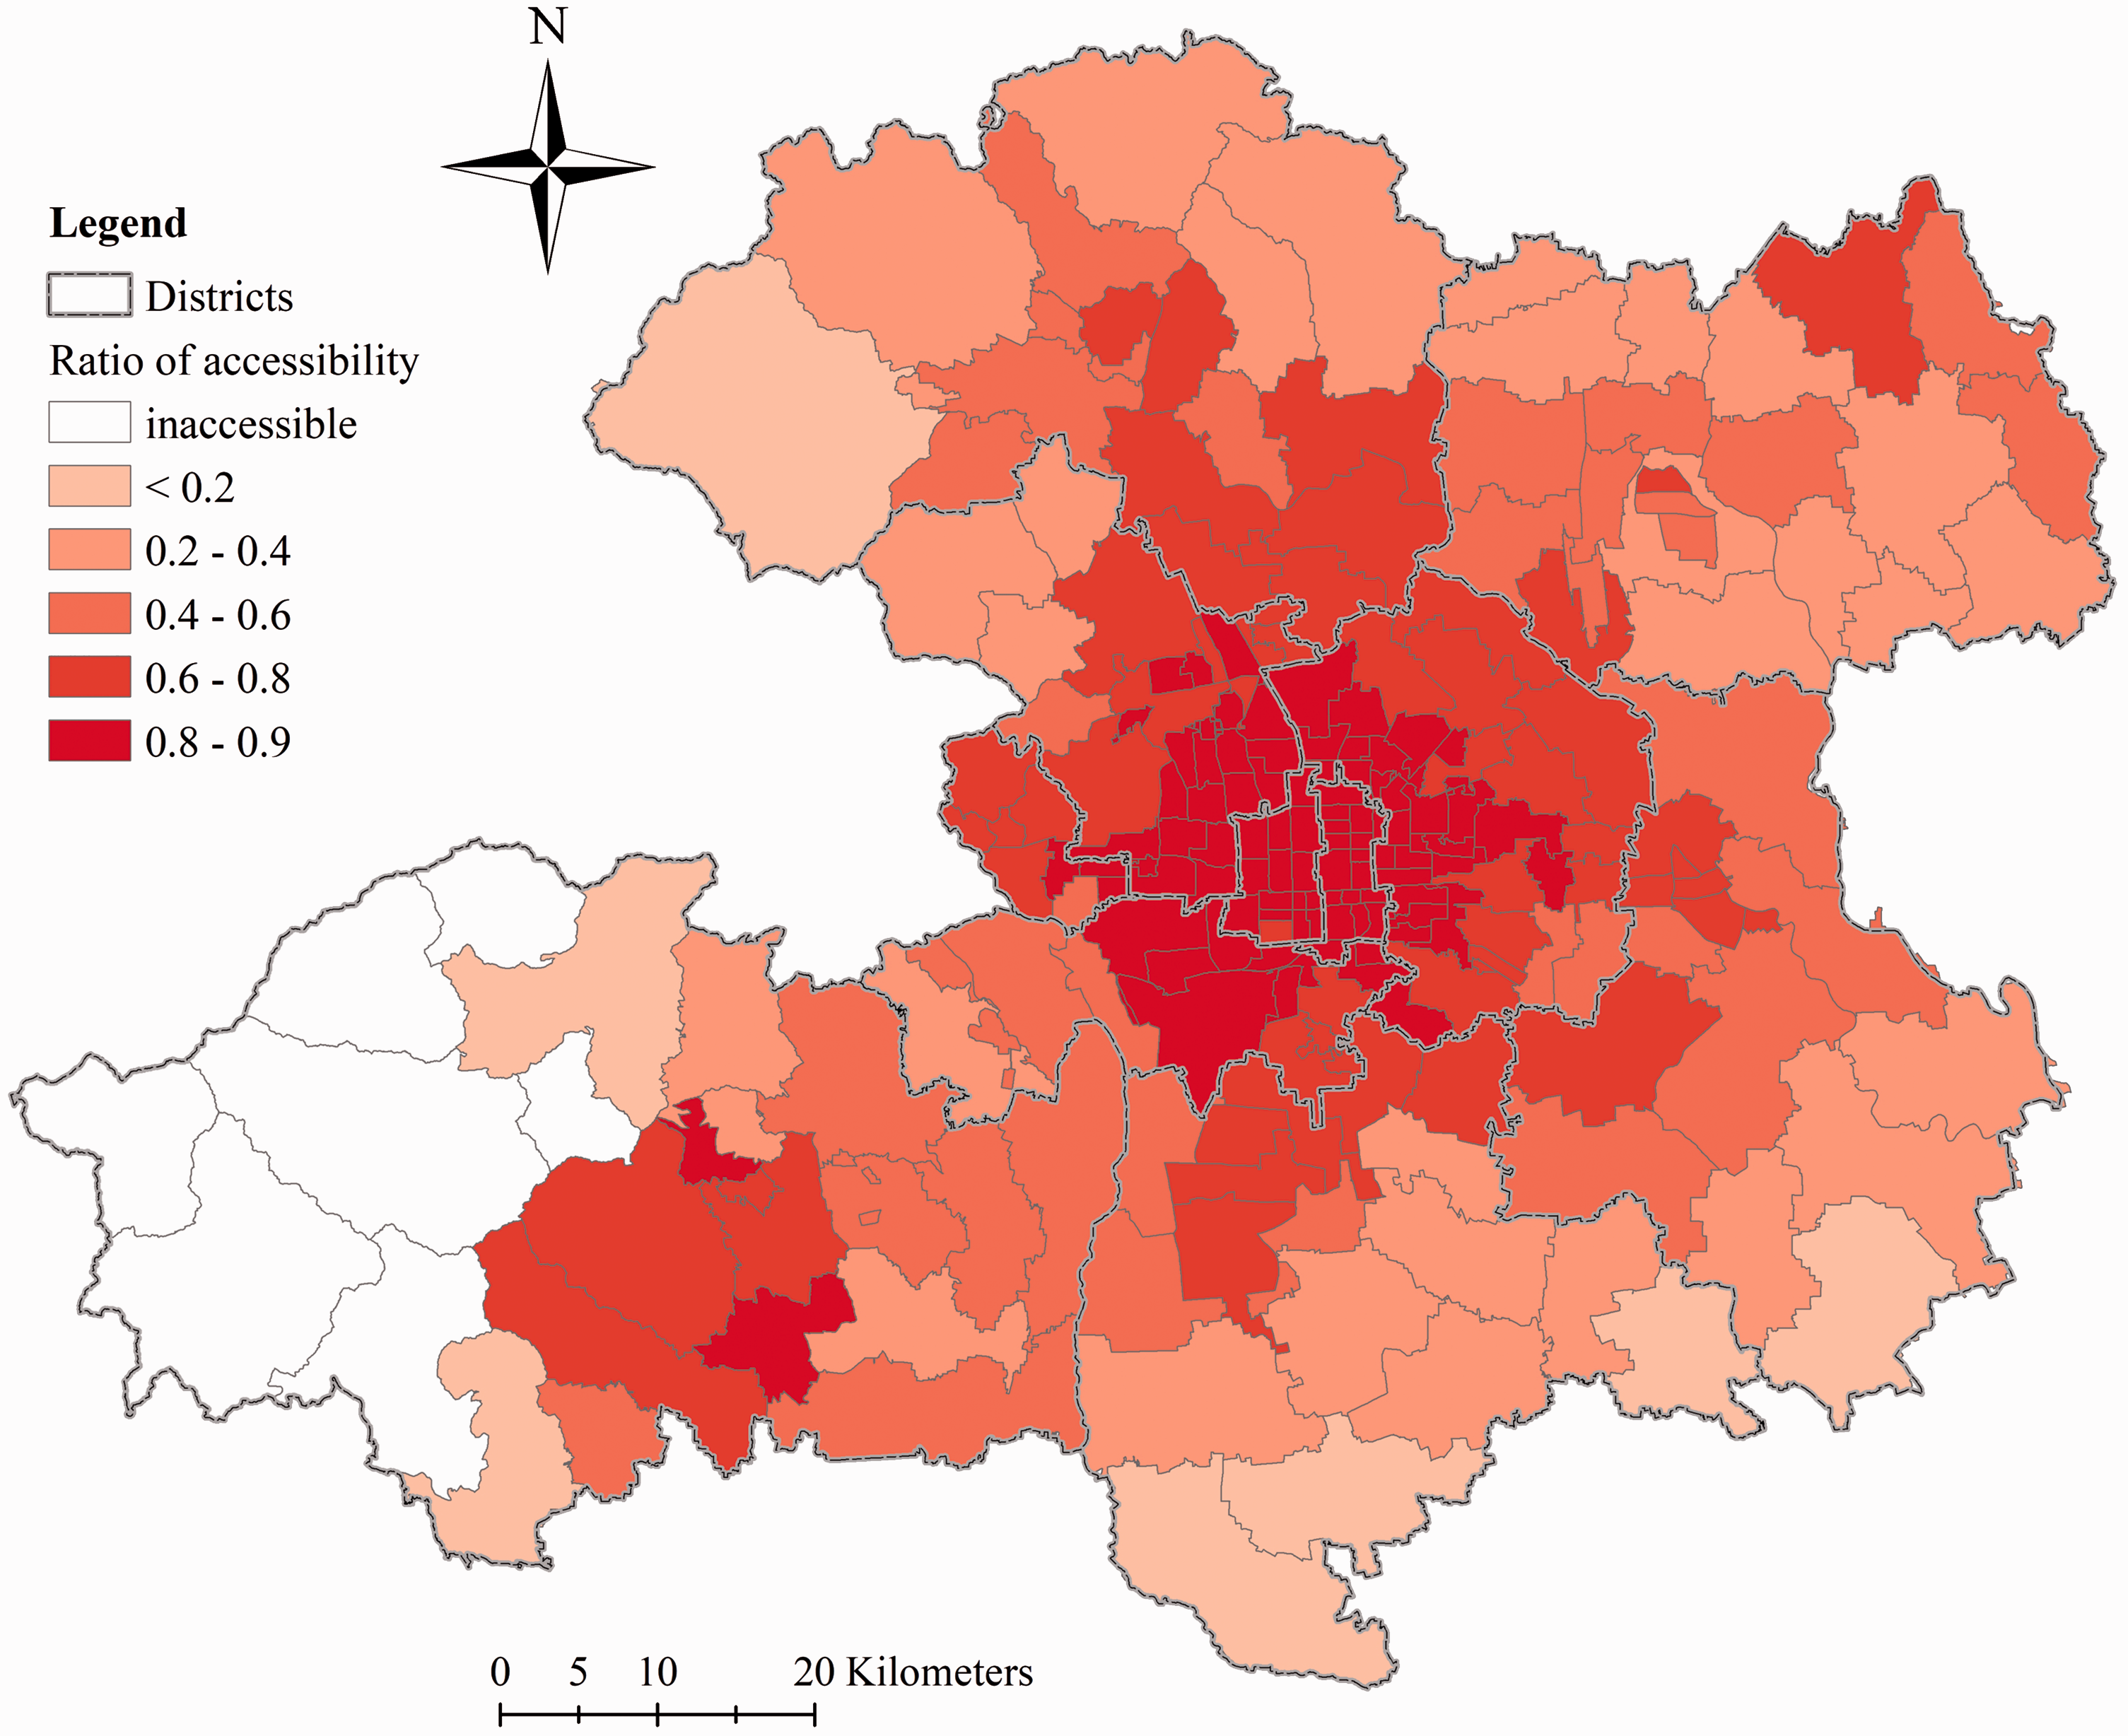
The ratio between the elderly’s accessibility with or without variable mobility shows similar pattern with Figure 5 (see Figure S5 in the Supplementary Information). This ratio reveals the impact of variable mobility (i.e. shares of transportation modes) on the elderly’s accessibility. As shown in Figure S5, the variable mobility overall reduces the accessibility of the elderly in all sub-districts. Moreover, the reduction is more significant in the peripheral areas than the central areas, indicating that the variable mobility has a more negative impact on the elderly’s healthcare accessibility in the peripheral areas, again confirming that the mobility of the elderly is relatively more disadvantaged in the peripheral areas compared to the non-elderly.
Impacts of the demand intensity coefficient
A larger demand intensity coefficient leads to a larger spatial accessibility of the elderly. The accessibility ratio of the elderly to non-elderly with a unique mobility and variable demand intensity is three for all sub-districts as the demand intensity of the elderly is three times that of the non-elderly.
As shown in Figure 6, the spatial accessibility of the elderly with variable demand intensity (three times that of the non-elderly) and the accessibility of the elderly with unique demand intensity are compared. The demand intensity coefficient only has a weak impact on the spatial pattern of the elderly’s spatial accessibility. The accessibility ratios range from 2.535 to 2.597. The gap between the maximum and the minimum as well as the coefficient of variation are both quite small (0.062 and 0.0025, respectively). However, the spatial distribution of the accessibility ratio shows an interesting pattern. The accessibility ratio generally increases from the center outwards and it is larger in the northern part than the southern part. It indicates that the elderly in the central areas and the southern part are facing stronger competition with the non-elderly than in the peripheral areas, where only the difference in demand intensity is considered.
The ratio between accessibility of the elderly with or without variable demand intensity.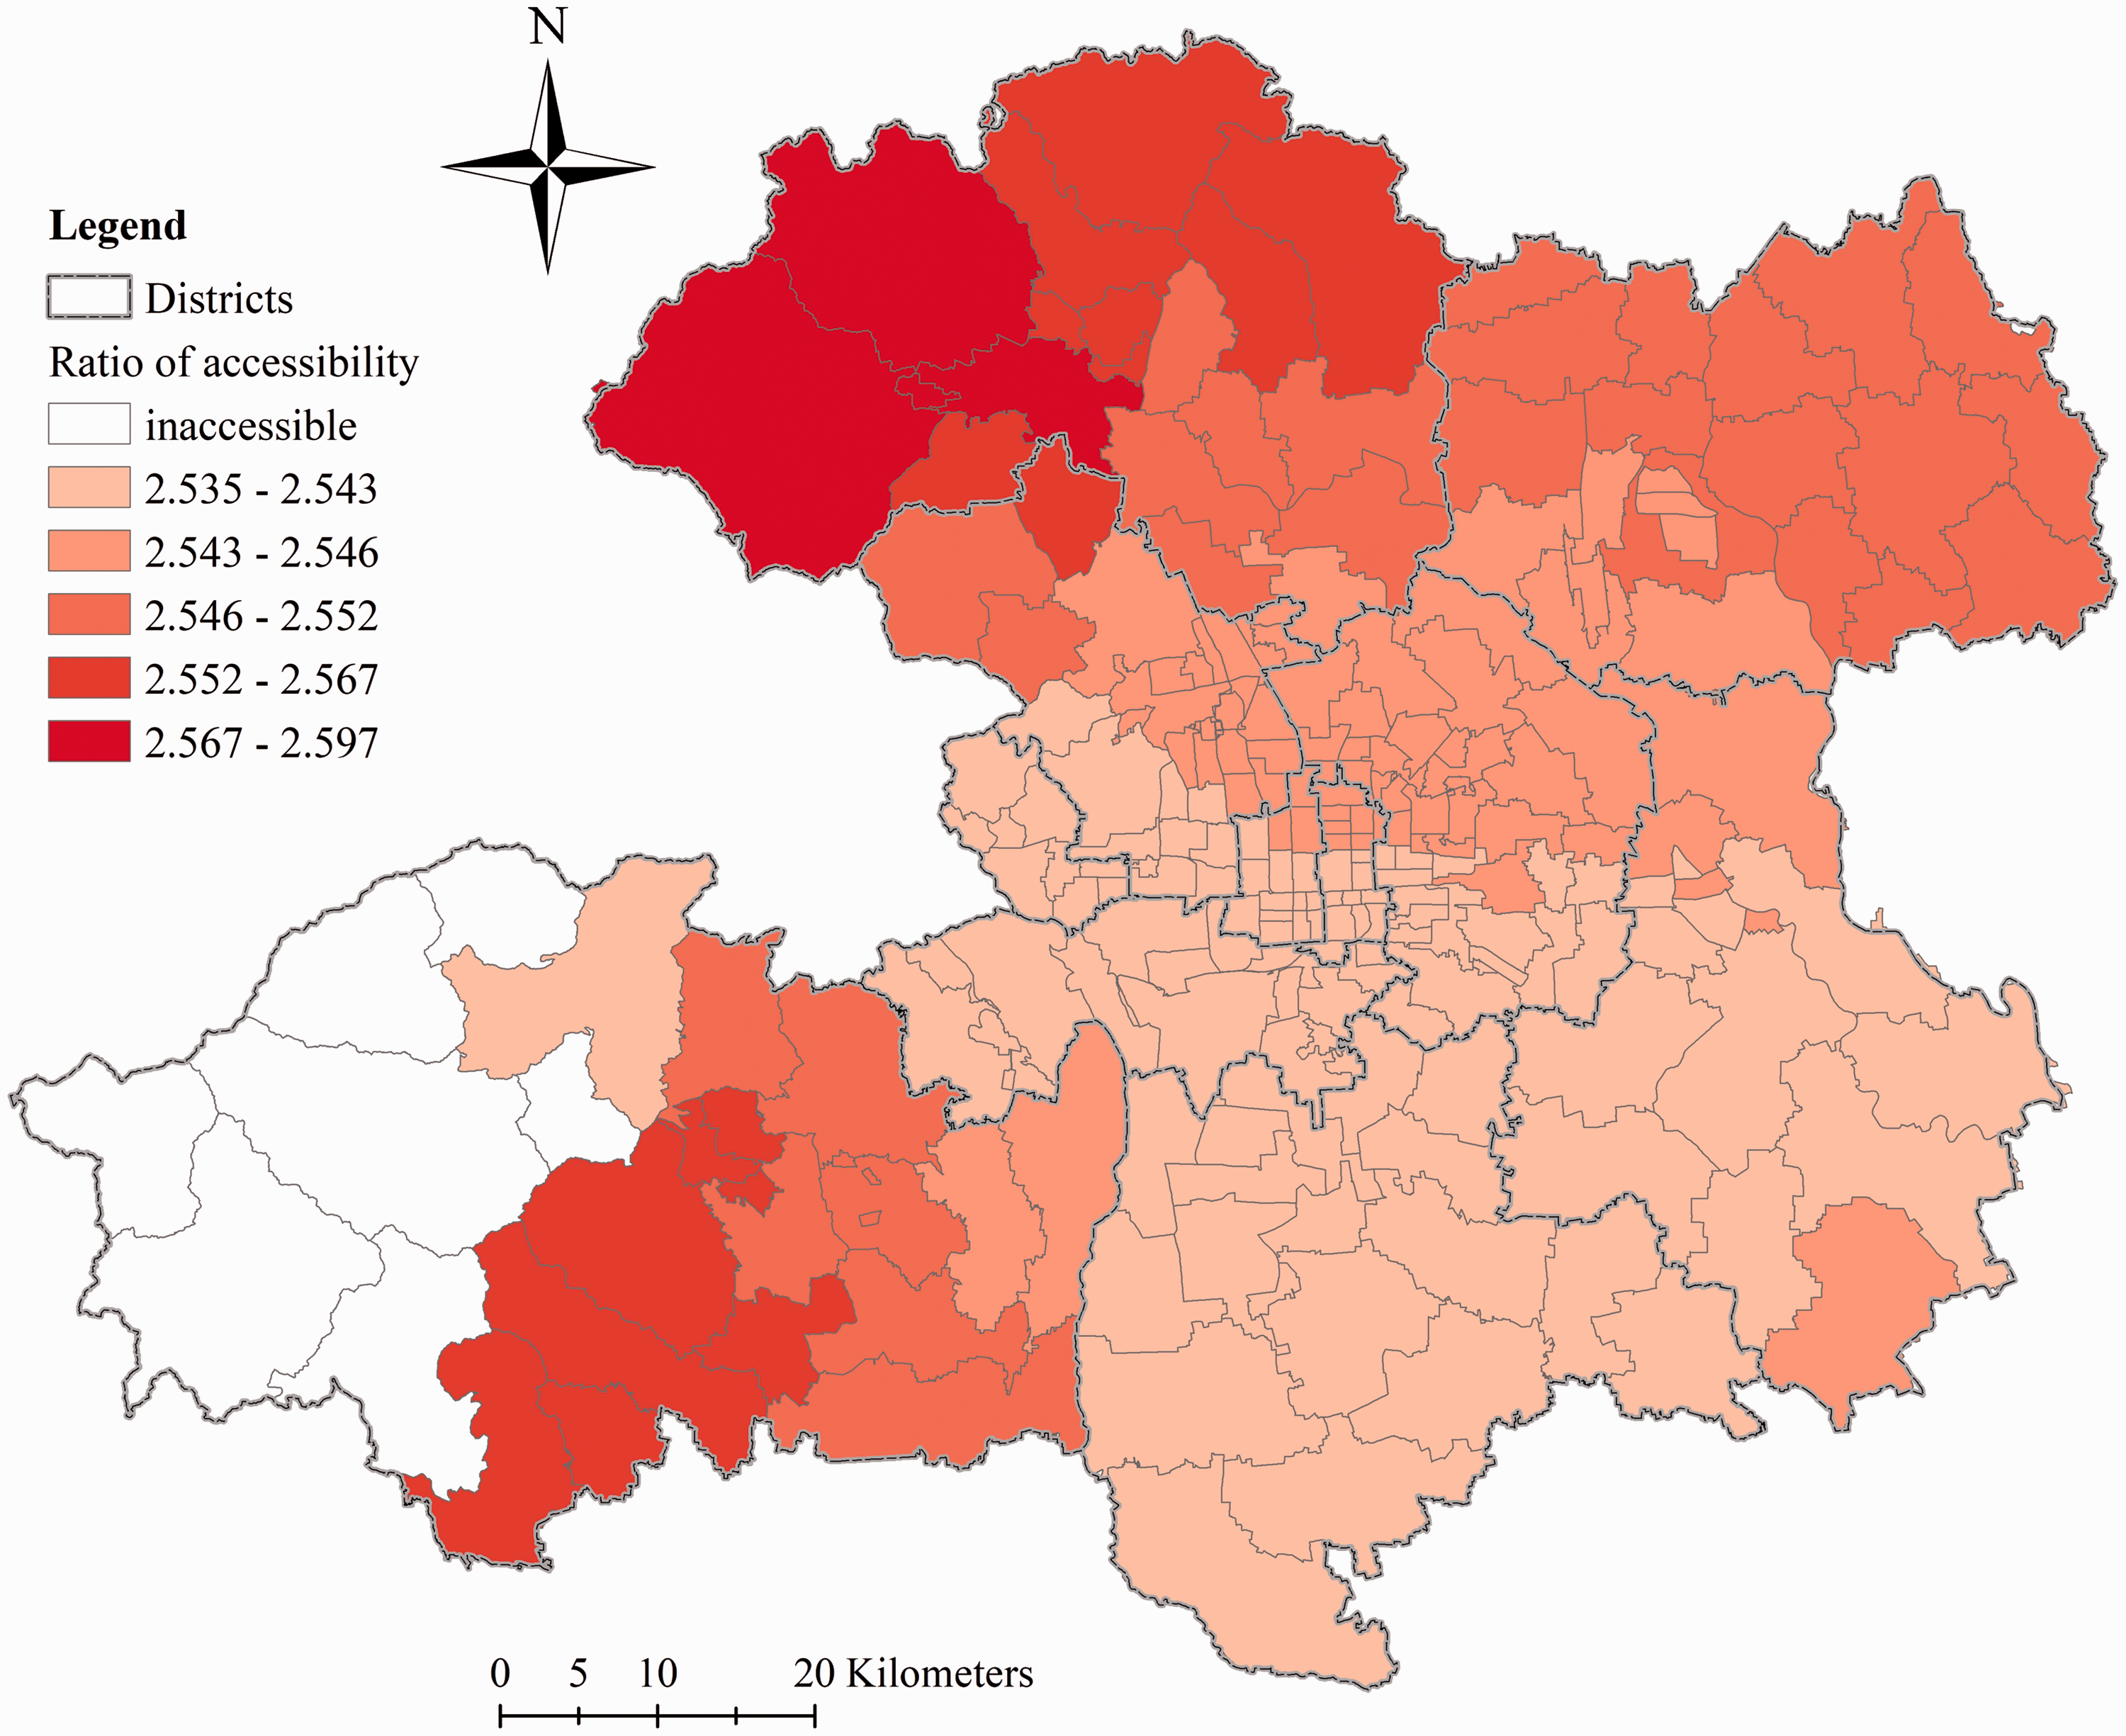
The patterns of the ratios between accessibility of the elderly when only the mobility or both the demand intensity and mobility are variable are quite similar (see Figures S5 and S6 in the Supplementary Information). Therefore, the adjustment of variable mobility in accessibility modeling proposed in this study plays a major role in affecting the spatial pattern of the elderly’s accessibility, while the adjustment of variable demand intensity overall increases the elderly’s accessibility by 1.55 times on average.
The above results have shown that the available capacity of the Secondary and Tertiary Hospitals is 9.1 hospital beds for per thousand elderly people, and 3.9 beds for per thousand non-elderly people. The Health Services Development Planning During “13th Five-Year” Period in Beijing (Beijing Municipal Commission of Health and Family Planning, 2016) has proposed a goal of providing 6.1 hospital beds for per thousand people. The accessibility of the elderly and the non-elderly is weighted by population for comparing the actual capacity of hospitals with the above planning goal. The result shows that the overall accessibility is 4.3 hospital beds for per thousand people. This means that the actual capacity of hospitals in Beijing is still below the goal and hospital beds need to be increased in the future. However, this policy goal does not take into account the difference in the demand intensity of the elderly and the non-elderly. In this study, it has been argued that the demand intensity of the elderly is larger than the non-elderly. Attention to this difference should be paid in the planning and allocation of healthcare services in practice.
Discussion
How can the allocation of healthcare services be optimized for an aging society?
The distribution of the elderly’s spatial accessibility is quite uneven. The accessibility of the elderly in peripheral areas is much poorer than those in central areas. The spatial distribution of the non-elderly’s spatial accessibility is similar, but the difference in accessibility between central areas and peripheral areas is larger for the elderly. The implication of these findings is that more healthcare resources (especially the healthcare services specific to the elderly) should be allocated in peripheral areas, by means of expanding the capacity of existing hospitals or building new hospitals.
Two characteristics of the elderly have been considered in this study: the higher demand intensity and the higher share of public transportation. The results have shown that the elderly are disadvantaged in competing with the non-elderly for healthcare services due to poorer mobility or longer travel times to hospital. Moreover, the public transportation is less developed in peripheral areas. Therefore, it is of great importance to improve the public transportation (especially in the peripheral areas) to hospitals to improve the elderly’s spatial accessibility to healthcare services.
According to a projection (Tao and Cheng, 2016b), the elderly population (aged 60 and over in their study, 2.46 million in 2010) may grow rapidly to be over 4 million by the year of 2020 in Beijing, among which 28 percent (1.23 million) will be in the Developing New Area (the peripheral areas in our study area). Therefore, the elderly’s demand for healthcare services will grow rapidly in the future and demand may increase in the Urban New Developing Area. It further supports our conclusion that more attention should be paid to the peripheral areas for improving the elderly’s spatial accessibility to healthcare services in Beijing.
Similar to our findings, the Health Services Development Planning During “13th Five-Year” Period in Beijing proposes to allocate healthcare resources from the central areas to the peripheral areas, e.g. by means of relocating existing hospitals or building new branches or hospitals in these areas. Moreover, our analysis also highlights the elderly’s disadvantage in mobility and the importance of public transportation improvements in improving the elderly’s healthcare accessibility in Beijing.
Conclusions
In this study, a multi-mode 2SFCA model with variable demand intensity has been proposed to measure the spatial accessibility of the elderly to healthcare services when the data on the available healthcare services to the elderly are limited. Two factors, the demand intensity and mobility, are incorporated into the generalized 2SFCA framework, to model the competition for healthcare services between the elderly and non-elderly. The proposed model was applied to analyze the spatial accessibility of the elderly to healthcare services in Beijing. The proposed model can be applied to other scenarios for measuring the spatial accessibility to services by multiple population groups (e.g. population groups with different income-levels, or local residents and migrants) with different demand intensity or mobility. This model can also serve as the foundation for measuring other factors influencing the competition for public services among various population groups.
There are limitations of this study, which we hope to address in future work. First, only two factors are considered in our model to reflect the characteristics of the elderly’s healthcare utilization behavior but there may be other characteristics. For example, the distance decay coefficient or even the functional form may be different for the elderly. This needs to be further examined based on survey data. Second, the Secondary and Tertiary Hospitals are treated the same in this study. In future work, we will investigate if a hierarchical structure exists among these hospitals, and how to measure the spatial accessibility in a hierarchical system. Third, the demand intensity of the elderly is considered uniform for the whole study area. More information on the difference between the demand intensity of the elderly and non-elderly at a smaller scale (e.g. the district or sub-district scale) can further improve the model.
Footnotes
Declaration of conflicting interests
The author(s) declared no potential conflicts of interest with respect to the research, authorship, and/or publication of this article.
Funding
The author(s) disclosed receipt of the following financial support for the research, authorship, and/or publication of this article: This research was supported by the National Natural Science Foundation of China (No. 41301164 and No. 41671497).
Supplemental material
Supplemental material is available for this article online.
References
Supplementary Material
Please find the following supplemental material available below.
For Open Access articles published under a Creative Commons License, all supplemental material carries the same license as the article it is associated with.
For non-Open Access articles published, all supplemental material carries a non-exclusive license, and permission requests for re-use of supplemental material or any part of supplemental material shall be sent directly to the copyright owner as specified in the copyright notice associated with the article.
