
Abstract
Both theoretical and empirical studies have shown the ability of scaling laws to reveal processes of emergence in urban systems. Nevertheless, a controversy about the robustness of results obtained with these models on empirical cases remains, regarding for instance the definition of the ‘city’ considered or the way the estimations are performed. Another source of bias is highlighted in this contribution, with respect to the non-ubiquitous character of some urban attributes (i.e. their partial absence from several cities of the system). The problem with the zero count for cities where these attributes are absent is that the technical necessities of usual estimation procedures make the analysis ignore them altogether even when they represent some valid information. This could seriously impact the results. A precise exploration of the effects of this arbitrary filtering is conducted here, and several solutions are proposed to overcome this limitation. In a case study about foreign investment towards French cities, we show that some erroneous conclusions about a hierarchical diffusion could be drawn when adopting the classical ordinary least squares approach. The framework we suggest specifies how it is possible to avoid misinterpretations deriving from the exclusion of zero values by using methods of analysis which deal with zero values specifically. The conclusion of a diffusion of foreign investment in the French urban system is then rejected.
Introduction
Scaling laws are a relative new way to reveal emergences at various levels of systems of cities (Batty, 2013; Bettencourt et al., 2007a; Pumain et al., 2006). In urban geography, these statistical power–law relationships between an urban attribute and city size reveal how this attribute exhibits a systematic variation when cities of larger size are considered, either in a linear, sublinear or superlinear way. This means that the quantity under study can vary respectively at the same pace, slower or faster than the size of cities considered. Various urban attributes have been studied in the scaling framework, such as the length of roads, the built area or the total area of greenspaces to name a few (Arcaute et al., 2015; Bettencourt, 2013; Cottineau et al., 2017; Levinson, 2012; Louf and Barthelemy, 2014; Rybski et al., 2016). Socio-economic variables however have focused the attention of urban research, mainly since some of them have revealed surprising patterns of surperlinearity, a behaviour unknown to biology from where the scaling theory originates (West, 2017). This pattern is observed empirically for the magnitude of research and scientific activities, for example in terms of jobs and patents filed (Arcaute et al., 2015; Bettencourt et al., 2007b; Pumain et al., 2006). In other words, the amount of patents registered in a city increases faster than proportionately with size when the urban hierarchy is scanned from the smallest to the largest cities, underlining the higher concentration of patents in biggest cities. However, not all socioeconomic attributes scale superlinearly: wages in France, total income in the UK or income of the poorest in Australia increase linearly with city size (Arcaute et al., 2015; Cottineau et al., 2018; Paulus and Pumain, 2011; Sarkar et al., 2018; Um et al., 2009).
Urban scaling regimes (sub-, super- or linearity) can be related to various interpretations. Bettencourt et al. (2007a) explain superlinear regimes of scaling by increasing returns to network interactions and sublinear ones by economies of scale in network formation. Consequently, they expect sublinear regimes to represent infrastructure variables, linear regimes to model individual basic needs and superlinear regimes to fit socioeconomic variables such as gross domestic product (GDP). From a different perspective, Pumain et al. (2006) link scaling regimes to innovation cycles and the evolutionary theory of urban systems. In their proposal, superlinear regimes characterize innovative business sectors emerging at the top of the urban hierarchy. In parallel with the emergence of new innovation cycles, the process of hierarchical diffusion leads to the propagation of innovations towards smaller towns in the system, leading the scaling regime for a mature activity to become first linear, then sublinear when other innovation waves occur.
Many empirical studies over the past 10 years have shown the ability of urban scaling to detect nonlinear scaling regimes for various urban attributes. However, a controversy about the robustness of the results obtained from these statistical models pertains. It has been shown that the direction and intensity of scaling regimes depend firstly on the definition of the ‘city’ considered (administrative boundaries, built-up area or metropolitan areas; Arcaute et al., 2015; Cottineau et al., 2017), also the way the city size itself is considered (resident population, workplace population, number of households; Cottineau et al., 2018). The way the estimations are performed (Leitão et al., 2016) can also impact the direction and robustness of results. In this contribution, we highlight another source of bias in the estimation and interpretation of scaling laws related to the non-ubiquitous character of some attributes.
Some attributes are indeed ubiquitous in the sense that they are (sometimes by definition) present in every city of the system – as buildings or roads – whereas others are non-ubiquitous and appear only above a size threshold (university, subway) or in specific regions (tourism). The distribution of very specialized industries in a system of cities also presents non-ubiquity (Youn et al., 2016; Paulus and Pumain, 2007; Vacchiani-Marcuzzo, 2016): the more disaggregated the industrial classification, the more often cities record low numbers of jobs or no activity at all in a given business sector (aeronautic manufacturing e.g. is very unevenly distributed). The nil values can become a problem because they reflect the dual nature of zero itself, which corresponds both to a numeric value in the suite of integers, and a categorical instance in the opposition presence/absence. More specifically, excluding the cities with zero values from the analysis is not satisfying, because it results from the choice of the method of estimation (the linear regression of logged variables, with log(0) being undefined) rather than from a scientific reflexion on the meaning of these zeros.
The aim of this contribution is to highlight limitations with urban scaling when the attributes are sparse in the system. If this sparsity is not taken into account, urban scaling could lead to counter-intuitive or nonsensical conclusions. We show this using detailed data regarding the transnationalisation of French cities. France is a major host and provider of Foreign Transnational Investment (FDI), but the knowledge about the finer territorial concentration of FDI is not well known yet, as FDI are registered at a national level. To observe the varying degree of French cities’ openness towards foreign transnational firms, three different quantities – the total amount of jobs, Localized Foreign Direct Investment stocks at a given date and Localized Foreign Direct Investment flows between two dates (2003–2015, a period of booming globalisation) – are observed and compared, the third one being non-ubiquitous. The hypothesis that the FDI has not yet reached a matured stage of diffusion into the system will be tested by comparing the various scaling regimes of each of the three quantities, with alternative estimation methods treating zeros differently. This preoccupation exceeds the specific case of transnational investments and could apply to all urban attributes characterized by a geographical sparsity.
The section on transnational investment in French cities situates the case study in the literature about transnational investment observed at the city level. It also details how the indicators are built and gives a view of their distribution in the French urban system. The urban scaling methods section details the usual approach in urban scaling studies and presents approaches potentially more efficient when dealing with quantities sparsely distributed in the system. The results and conclusions are presented in respective eponym sections.
Transnational investment in French cities
In our case study, we use urban scaling to investigate the processes of globalisation and metropolisation and the level of internationalisation of French cities towards foreign transnational firms. In this section, the literature on the subject is summarised before the three main urban attributes under consideration are presented.
Literature review
The concentration of transnational firms’ investments in some cities (Global cities, World cities, metropolises…) can be considered as a sign of metropolisation, i.e. one of the local repercussions of the broader process of globalisation (Krugman and Obstfeld, 2000; Levitt, 1983; Massey, 2007; Sassen, 1991). Transnational firms’ location strategies tend to both integrate and avoid some territories at various scales; consequently, they could produce, reinforce or mitigate economic disparities in terms of distribution of wealth or jobs through these strategies (Amin and Thrift, 1994; Andreff, 1996; Held et al., 1999; Lipietz, 1984; Markusen, 1994; Massey, 1984; Sassen, 2000; Scott and Storper, 2014; Taylor, 2003). Analysis of metropolisation is often focused on the sole potential metropolises: the Globalization and World Cities Research Network (GaWC) research group for example considers the distribution of firms of specific sectors in only a few dozens of the largest cities in the world, ignoring the vast majority of (small and medium) cities. This approach fails to bring evidence of the specificity of metropolises compared to other cities of their national territory.
The unequal integration is well known at the country level thanks to FDI data (available yearly through the World Bank and the United Nations Conference on Trade and Development (UNCTAD)). Besides the fact that globalisation is mostly a North–North process, researchers noted a correlation between economic growth and transnational investment (Barrell and Pain, 1997; Makki and Somwaru, 2004; Olofsdotter, 1998; Ram and Zhang, 2002), while others empirically invalidate the effects generally imputed to transnational investments (Chowdhury and Mavrotas, 2006; Lipsey and Sjöholm, 2005). A major difficulty is their registration at the national level, which makes it almost impossible to conduct the analysis at more local levels (regions or cities), despite the ‘capital is global, work is local’ assumption (Beck, 1999). Globalisation indeed seems to link local territories, and especially cities (Alderson and Beckfield, 2004; Beaverstock et al., 1999; Derudder, 2006; Rozenblat and Pumain, 1993; Sassen, 1991; Taylor, 2004), as transnational firms have preferential local fixing points and cities are the major receptors of economic activity (Bairoch, 1985; Berger, 2005; Castells, 1998).
In order to observe FDI in local places, FDI stocks and flows data are here disaggregated to be transposed in the urban system. Localized FDI stocks (LFDI stocks) give each foreign transnational firm precise locations at a given date (whenever the investment was made and whatever its mode), and Localized FDI flows (LFDI flows) register transnational investment decisions during a given period, without taking into account the already existing foreign investments. These two urban quantities complement each other: the first one gives an idea about the magnitude of the transnationalisation process on a rather long-range, the second about its dynamics on a short term.
Data
To study the unequal integration of cities in the networks of transnational firms and to test the globalisation–metropolisation hypothesis in the French urban system, we use three different quantities:
1
Total employment: the total amount of jobs in each city of the system, as registered in 2009 by the French census;
2
LFDI stocks: jobs in foreign-controlled establishments located in each city in 2008, built by combining information about financial participations between companies and precise locations of their establishments;
3
LFDI flows: jobs created by the sole opening of new sites by foreign transnational firms between 2003 and 2015, as registered by The Financial Times.
4
Each of these urban economic attributes is recorded as an amount of jobs, firstly at the municipality level (the French communes), then after aggregation at the city level. Cities are considered in a functional definition, i.e. the 355 aires urbaines defined by the French census bureau (INSEE). 5
Urban LFDI stocks consist in almost 2 million jobs located in more than 85,000 establishments: one out of 11 jobs in French cities is embedded in foreign transnational firms’ networks. In comparison, urban LFDI flows represent almost 140,000 new jobs located in 2500 different sites. A look at their geographical (Figure 1) and statistical (online Supplementary Material 1) distribution confirms that foreign transnational firms’ location decisions broadly follow the urban hierarchy.
Total employment, LFDI stocks and LFDI flows versus population: geographical distribution and OLS scaling parameters (coloured version online).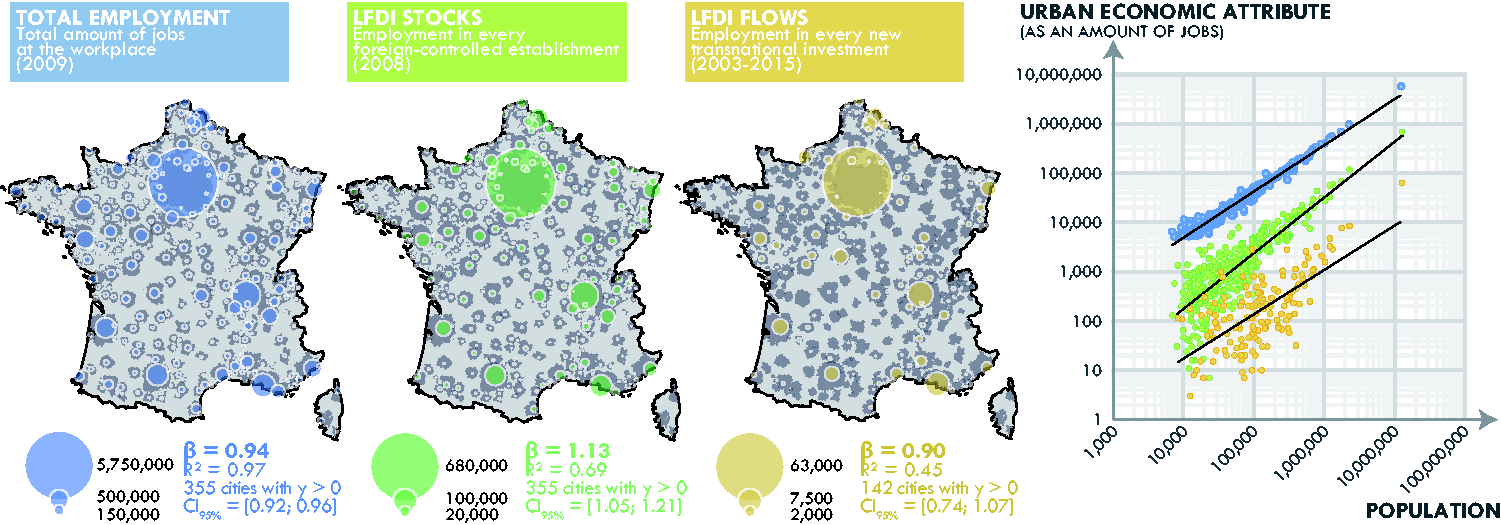
Therefore, does LFDI scale with city size?
Do LFDI stocks and flows scale differently with city size? Moreover, is classical approach really efficient to observe FDI once localized at the city level? Because economic attractiveness can be considered as more intense in larger cities, because globalisation seems to have specific aftermaths in metropolises, and because the effects of globalisation are still unfolding, we would expect a higher concentration of LFDI stocks in larger cities than for general employment – which should scale approximately linearly with city size, given previous empirical studies. Moreover, an even higher concentration of LFDI flows in the upper part of the urban hierarchy is expected, revealing the still ongoing predominance of metropolises in their urban system. This will be tested in the following sections.
Urban scaling methods
As mentioned above, we investigate the scaling of ubiquitous and non-ubiquitous urban attributes to examine potential solutions to deal with zero values and their dual meaning. We present the classical approach of OLS linear regression of logged variables, its flaws and the alternatives models and estimation techniques.
OLS approach
Scaling laws, as power–law relationships connecting urban attributes and city size, are usually formalized as
‘the parameters […] are chosen based on least-squared fitting in log-transformed data’, ‘the quality of the fitting is quantified by the coefficient of determination’, ‘the 95% confidence interval (CI) [βmin; βmax] around β is computed from the sum of the residuals squared and β ∉ [βmin; βmax] is taken as an evidence that β ≠ 1’.


More precisely, the interval [0.95; 1.05] is usually considered as the range of linear regime of scaling. If β and its CI95% are distinct from (included in) this interval, the scaling regime is sublinear or superlinear (linear). In the case of an overlap, conclusion is uncertain or mixed.
One of the limitations of the OLS approach is the impossibility to include zero values in the computation, since log(0) is not defined. This flaw has also been underlined by Leitão et al. (2016), who remind us that ‘filtering is arbitrary because y = 0 is usually a valid observation’. In the case of non-ubiquitous attributes as LFDI flows, this means excluding cities from the computations. New investment decisions are concentrated in 40% of the French cities, reflecting the highly selective strategies of transnational firms. This means that 60% of cities would be excluded from the analysis in the OLS approach, even though zero is a valid observation for them. The fact that some cities are not touched by new investments is as interesting a fact as knowing that the 40% other cities are actually invested. The fact that the first receive no investment rather than ‘less than’ the second (the dual meaning of zero) is ignored by this traditional approach, despite the information it gives about the selectivity of investments.
Consequently, β does not represent the relationship between LFDI flows and population in the whole system, but only in the subset of cities which hosted an investment in the time frame considered. This is highly questionable in terms of robustness and interpretation: indeed, the statistical characteristics of the full data and those of the subset of data minus zero values slightly differ (online Supplementary Material 2).
There are several ‘tricks’ that could be used, such as replacing zero values by small positive values or to add a small value to every city; but results could be highly impacted by these ‘small’ decisions depending on what a small value is, especially on a logarithmic scale. As this is dissatisfactory, a serious rethinking about the log-linear model and the OLS estimation method is needed. An exploration of the possible options is presented hereafter.
Other models and estimation methods
Weighted OLS
One solution to avoid zero values could be to estimate β on groups of cities sharing the same approximate position into the urban system. Each bin is described by the mean population and the mean values of the urban attributes. β is then estimated through a weighted regression where the weight is given by the number of cities in each bin. Zero values are wiped and total values of population and attributes are maintained in each bin.
Maximum likelihood estimations: Better precision
Following the recent suspicion towards classical OLS methods (Clauset et al., 2009), especially in the presence of multiple zero values, Leitão et al. (2016) proposed a new method to estimate non-linearity. In the Maximum Likelihood Estimation (MLE) approach, models of scaling with different shapes of the noise can be compared (lognormal, Gaussian, etc.), each with two instantiations: one where β is allowed to vary and one where it is set to 1 (the linear model). All models are estimated and compared using the Bayesian Information Criterion (BIC, which takes into account the log-likelihood, the number of observations and of parameters, creating an index of performance of the model in terms of fit and parsimony). If the model constrained to β = 1 has a lower value of BIC than its unconstrained counterpart, then the nonlinearity is rejected.
OLS regressions correspond to MLE with a lognormal noise around the average, with no scaling of the noise. Leitão’s specifications of MLE models allow to change the shape of the noise as well as its scaling: Gaussian with the noise scaling with
Hurdle and Poisson models: A different approach to zeros
Another solution to dealing with zero values is to treat them specifically as a different kind of information (presence/absence rather than on a continuous scale), with models which estimate zero and non-zero values separately. Initially proposed by Mullahy (1986) in econometrics, Hurdle models work precisely that way, truncating the distribution into a left part of zero values and a right part of positive ones. Belonging to the family of generalized linear models and used for the estimation of count data, such models are composed of two parts (Cameron and Trivedi, 2013): one which estimates the probability of an observation to be nil (e.g. using a binomial logit model) and one which estimates the value of the non-zero observations (e.g. with a Poisson or a negative binomial model). Formally

Results
In this section, the results achieved by the OLS approach are compared to the other methods exposed in the methods section, into a sensitivity analysis considering different sets of cities in terms of size (each subset starts at rank 1 by population until a specific rank in the urban hierarchy).
355 cities and OLS approach
The analysis is firstly conducted with the OLS approach, each attribute being plotted against city size (Figure 1). Total employment scales very well with city size (R2 = 0.97), and its scaling regime seems to be sublinear (β = 0.94) or linear as CI95% intercepts [0.95; 1.05]. The relationship between LFDI stocks and city size is less systematic than the first one, even if the urban hierarchy still explains to a large extent the location of existing transnational investments. Here we probably face a superlinear regime (β = 1.13); it should be noted that small cities deviate more from the trendline than bigger ones: this heteroscedasticity reflects the well-known higher diversity of urban profiles among small cities – notwithstanding the higher level of economic specialization in individual cities. Finally, LFDI flows were expected to show an even clearer superlinear regime than LFDI stocks, but in that case β equals 0.90, a priori well below linearity but neither the sublinear nor the superlinear regimes can be excluded. Nevertheless, a look at the scatterplot shows how unsatisfying the fit is (Figure 1, in yellow): the trendline is totally unable to represent the LFDI flows to the big cities (with populations over 500,000 inhabitants).
This classical but unsatisfying approach would lead to the conclusions that on the long run, globalisation reinforces the hierarchical discrepancies between cities (as βSTOCKS > βEMPLOYMENT), and that a process of diffusion now emerges in the system (as βFLOWS < βSTOCKS). Transnational firms would tend to favour less populated cities in their recent locational decisions than it has been the case on the long term.
However, another hypothesis could be made to explain these unexpected results. It could be considered that the effect of zero values is marginal when there are a few of them and they are distributed in the whole urban system; in our case, none of these two affirmations are valid. The 60% of cities excluded from the computation (213 cities) here are primarily small ones (online Supplementary Material 3): almost 100% of the 55 most populated cities host LFDI flows but less than 10% of the 100 smallest do. There is no real issue to consider a system of 142 cities rather than a system of 355 cities when the sample is made on consistent criteria, which is definitely not the case here. The observation of LFDI flows is probably biased as smaller cities are only depicted by the exceptions (small cities hosting LFDI flows) where larger ones are depicted by all of them. This probably leads to a rotation of the trendline characterizing LFDI flows relationship with city size. To identify this effect, it is firstly suggested to test the sensitivity of the three different relationships by both restraining the definition of the urban system and using a weighted regression.
OLS approaches: sensitivity analysis according to the size of the urban system
To highlight the effect of zero values in the characterization of LFDI flows versus city size, a systematic analysis is implemented here by both using a weighted regression and restraining the size of the system under consideration. The non-weighted regression is ‘erroneously’ based only on cities where the attribute is strictly positive, whereas the weighted regression is based on every city but with ‘erroneously’ smoothed data in each bin. Here, 20 bins have been initiated from the top of the urban hierarchy to the smaller towns, the first three of them containing five cities each, the 17 following 20 cities. The definition of the urban system is moreover progressively reduced from 355 to 5 aires urbaines by excluding the 5 smallest at each step, while keeping the same definition of each city. This allows to consider at each step a more restrictive but still consistent definition of the French urban system.
The restriction of the set of cities under consideration and the comparison between both regressions should have a weak impact on results characterizing ubiquitous attributes: the self-similarity in the system should lead to a quite stable β. In the case of LFDI flows, the scaling parameters could slightly differ, since the proportion of zero values (concentrated in smallest cities) will be progressively lowered into the non-weighted OLS regression and as weighted regression will disallow zero values at each definition of the system.
Results of both regressions are shown in Figure 2, in color for the OLS regression, in grey for the weighted one.
Total employment, LFDI stocks and LFDI flows versus population through OLS and weighted OLS approaches: sensitivity analysis according to the size of the urban system under consideration (coloured version online).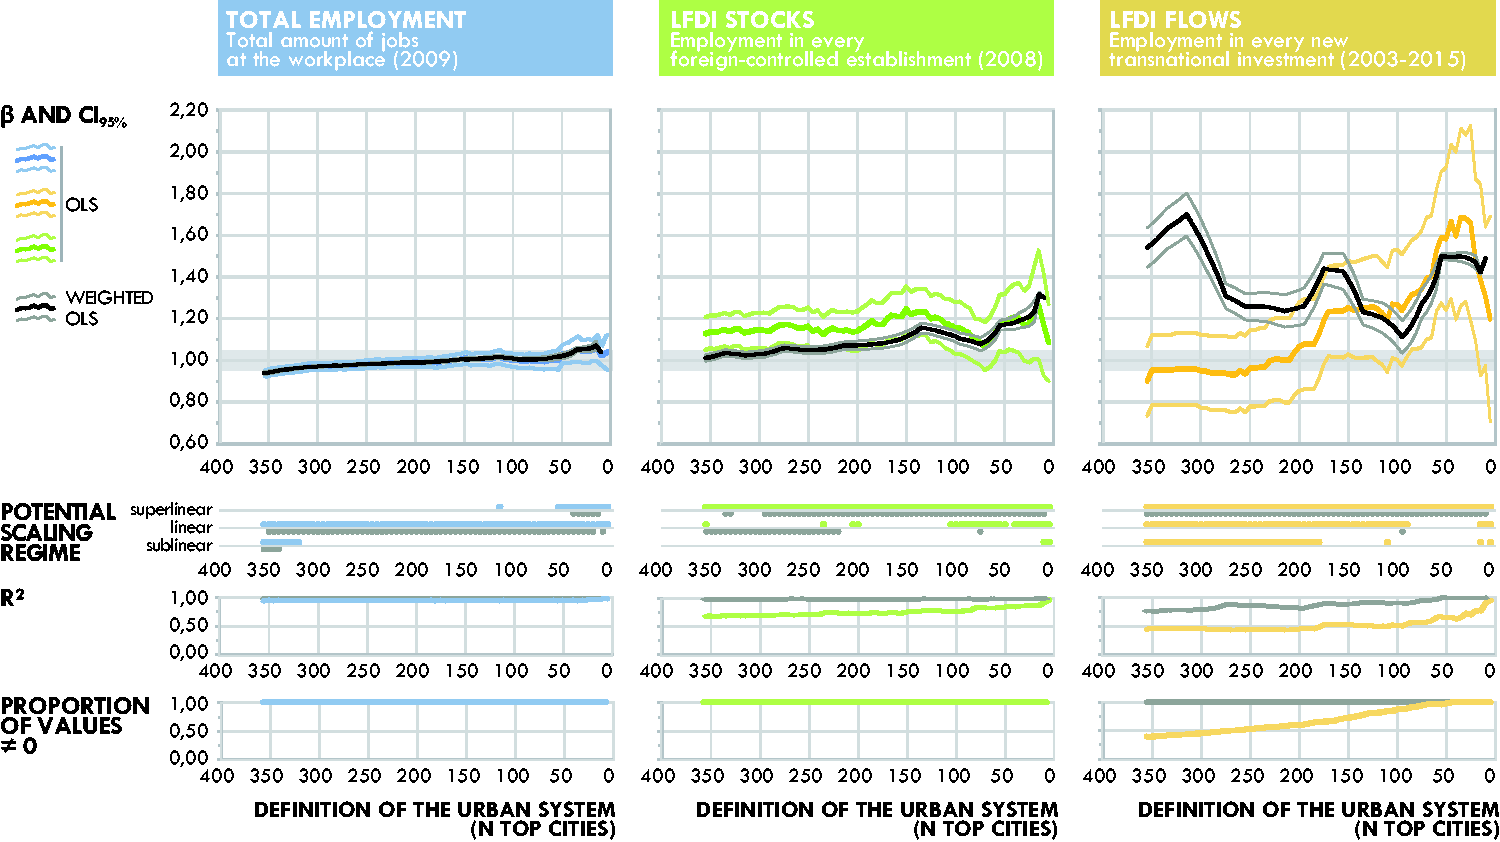
It appears that there is firstly a systematic but smooth elevation of β for total employment when the urban system is progressively restricted to larger cities, and that choosing weighted or non-weighted method does not change the results significantly. We can reasonably validate a linear regime of scaling. Secondly, β is clearly higher for LFDI stocks than for total employment for a broad number of definitions, especially when more than 100 cities are considered (for more restricted definitions, CIs start to overlap). For many sets of cities, the superlinear scaling regime of LFDI stocks is confirmed (it should be noted that the weighted regression tends to reduce the value of β in the widest definitions of the system).
More interestingly in the case of LFDI flows, β is outstandingly unstable when using an OLS regression, varying from 0.9 to 1.7 (even without considering CI95%). For most of the definitions, not only a linear regime could be the effective scaling regime but also sublinear and superlinear ones. β seem highly scrambled by the proportion of zero values: in our computations, a clear elevation of β is observed when the definition of the urban system is restricted and meanwhile the proportion of zero values lowered. On the contrary, there is only one valid conclusion while using weighted OLS regression where zero values are nil: LFDI flows follow a superlinear regime of scaling.
Regarding these results, it seems that while using non-weighted OLS regression, the urban system should be defined in a very restrictive way to find levels of β in accordance with the literature suggesting a high concentration of LFDI in metropolises. The only computations which lead to a superlinear regime of scaling are made on very restricted definitions of the urban system – those where the proportion of zero values is very low. The next subsections will try to deal differently with zero values in order to verify if this superlinear regime of scaling could be a valid conclusion by considering properly individual cities rather than bins.
Estimating ubiquitous attributes better with the MLE
As suggested above, the suspicion around OLS estimation of scaling exponents leads us to use more elaborate methods of estimation (Leitão et al., 2016), and in particular the maximum likelihood estimation (MLE) evaluation of concurrent models of scaling: one with β = 1 and one with a non-constrained β. The results are presented in Figure 3, alongside previous results obtained with (weighted-) OLS for various delimitations of the system (only 15 definitions of the system are shown ease of reading).
Total employment, LFDI stocks and LFDI flows versus population: comparison of three to five models according to data sparsity (coloured version online).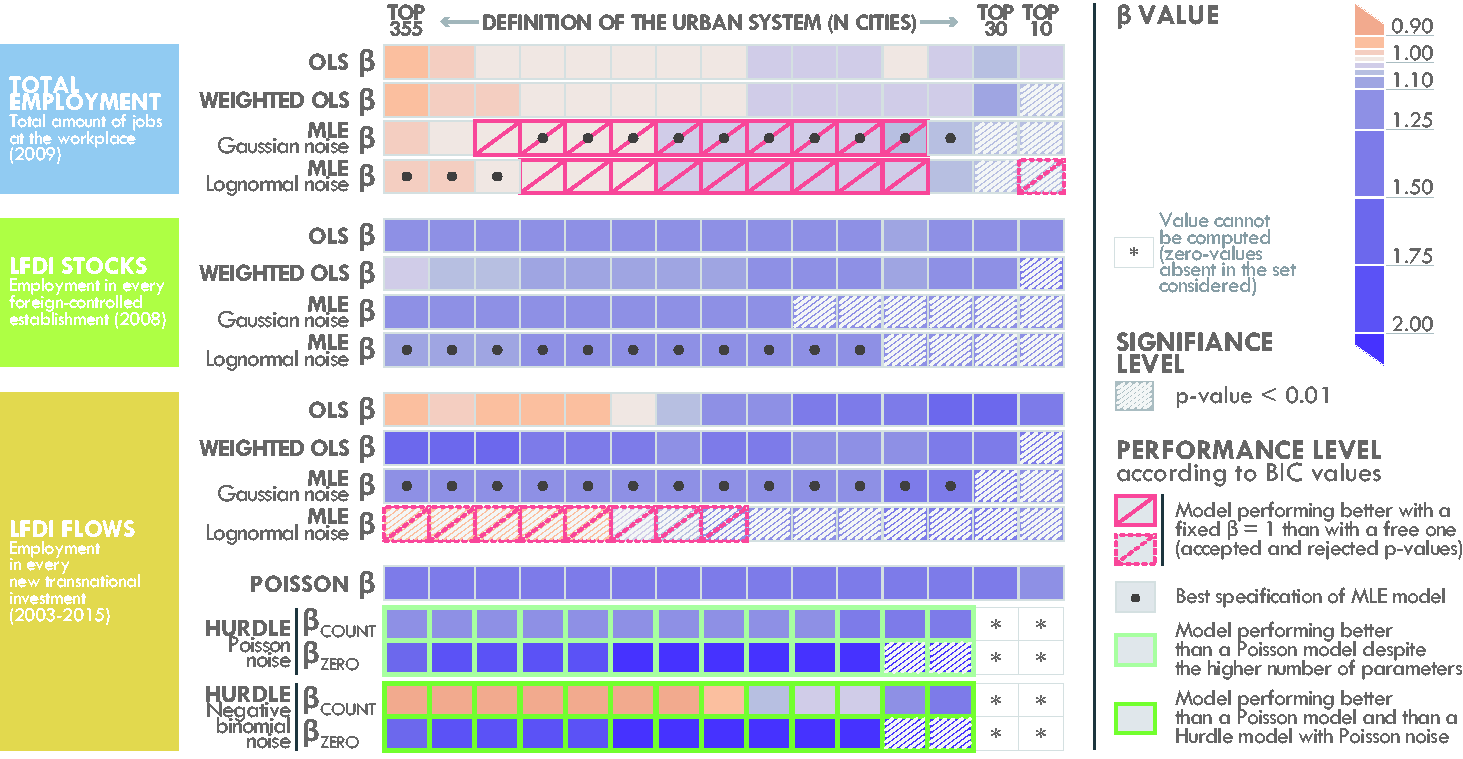
The comparison for the two ubiquitous attributes yields two main results. Firstly, MLE proves more conservative on significance, as larger samples of cities are needed to reach a satisfying significance level (p value < 0.01). For example, the value of β describing total employment becomes significant for systems of 55 cities onwards (whereas OLS and weighted OLS produced significant β even for a system of the top 10 or top 30 cities). In the case of LFDI stocks, the threshold is higher and the MLE methods give significant estimations for systems of more than 105 or 155 cities only. Secondly, and more importantly, we find that in most cases, the model with a free β parameter performs better than its linear constrained counterpart, according to the BIC (details about BIC values can be found in online Supplementary Materials 4 and 5). For LFDI stocks, non-linearity is thus confirmed for all scaling estimations, at values higher than the weighted model but lower than the OLS one for all definitions of the urban system. For total employment, some values (in red in Figure 3) indicate that the linear model has a lower BIC, i.e. performs better. This is in line with the results of other models. Moreover, the non-linear values estimated are still included in the interval [0.95; 1.05], suggesting a linear regime in traditional interpretations.
For non-ubiquitous LFDI flows, note that MLE with lognormal noise is not appropriate. MLE with Gaussian noise always indicated a better performance for models with a free β and a superlinear regime of scaling whatever the definition of the urban system. Results consequently differ slightly from the classical OLS procedure.
All in all, for ubiquitous attributes, MLE does not change the trends of previous results, but brings precision on significance. For LFDI flows, results from MLE estimations with Gaussian noise differ slightly from previous results. However, we still have not taken zero values into account.
Dealing specifically with zero values with Hurdle models
As we suggested above, Hurdle models give two types of results: the influence of the variables (employment in our case) on the probability of the independent variable to be zero or non-zero (βzero), then the influence of the variables on the final value of non-zero observations (βcount). The performance of the models is evaluated by comparing the resulting BIC to that of a simple Poisson model with no Hurdle component. We report the results of this analysis for LFDI flows in Figure 3.
The comparison yields three main results. Firstly, Hurdle models with Poisson and negative binomial noise are only significant in systems of 105 cities and more, but they perform better than a simple Poisson one. Between the two noise specifications for Hurdle models, the negative binomial count models perform better (BIC values can be found in online Supplementary Material 6). Secondly, we find that the range of values estimated for βcount are strictly superlinear and very similar to the values precisely estimated using the MLE method when the noise of the count model is Poisson-like, but is mostly sublinear when the noise modeled is a negative binomial law. Thirdly, and most importantly, we find that the value of βzero estimated always exceeds that of βcount. This means that the number of jobs received by cities from transnational firms' investment between 2003 and 2015 might be less than proportionately concentrated in the largest cities, but that the probability of receiving none is even more skewed towards large cities. This gives us an information on both the statistical effect of city size on investment flows and on its presence/absence in the entire system of city.
Conclusions
By using scaling laws in urban geography, we sometimes have to deal with non-ubiquitous attributes. Total employment, the total area or the total built-up area are not affected by this concern. But when we look at attributes which are not located in every city, as non-ubiquitous industrial sectors, we have to be conscious and to deal with zero values. These zeros reflect the dual nature of zero itself, which represents a qualitative phenomenon of absence as well as a quantity between −1 and 1. Most traditional urban scaling analysis is concerned with the estimation of quantities, but treats zeros as absent since they have to be ignored in order to compute the logarithm.
In this contribution, we have tried to measure the actual impact of zero values on computations and try to identify if results based on classical OLS are valuable in the cases where the attribute is sparsely distributed. We also provided some solutions to deal with the problem and to provide safer interpretation about the location of transnational investment in French cities. The zero values actually can change the regime of scaling estimated for different representations of the system (in terms of number of cities included in the analysis). Varying the extent of the system (and concomitantly reducing the proportion of zero values) firstly affects the value of the estimated scaling exponent (and CI95%). In the case of LFDI flows, we have seen that, when estimated with the OLS method, it indicates contradictory results for different definitions of the system: from an unsure sublinear relationship between investment decisions and city size for all 355 French cities (60% of them not hosting any new investment) to a clear superlinear relationship when considering only the top of the urban hierarchy (where zero values are nil).
We thus suggested several ways to deal with the problem of scaling estimation and zero values. Firstly, we crossed traditional and weighted OLS analyses while varying the definition of the system by looking at different samples of cities. Although the second method proves more robust, it was not entirely satisfactory. Secondly, we have used more sophisticated methods of estimation and model comparison with maximum likelihood to assess the robustness of the non-linearity. These more robust results have confirmed our hypotheses regarding the dynamics of scaling of foreign investment in the French system of cities, but have not provided a real solution to zero values. Thirdly, we have used Hurdle models to treat zero values specifically. Their good performance compared with previous models revealed that indeed, in the case of investment flows in French cities, the probability of hosting jobs or not scaled more strongly and superlinearly with city size than the actual number of jobs received, which was indeed found to be sublinear in the best performing (Hurdle) models. Therefore, city size seems to be a much stronger determinant of the selection process of presence/absence of investment than the actual count of jobs invested, which might exhibit signs of hierarchical diffusion among selected cities.
Not only this case study has shown the importance of dealing cautiously with scaling laws, but it has enabled to quantify the metropolisation process in France, seen as the differentiated attractiveness of large cities to foreign transnational firms. The disaggregation of Foreign Direct Investment and its location into the system of cities proved the high concentration of transnational firms establishments in the upper part of the urban hierarchy, while other studies based on World Cities (GaWC for instance) compare the process among a subset of metropolises only. At the time where many small and medium cities may enter a shrinking trend, it is more than ever necessary to identify which processes may contribute to that trend.
Supplemental Material
Supplemental material for Are the absent always wrong? Dealing with zero values in urban scaling
Supplemental material for Are the absent always wrong? Dealing with zero values in urban scaling by Olivier Finance and Clémentine Cottineau in Environment and Planning B: Urban Analytics and City Science
Footnotes
Acknowledgements
The authors are grateful to Erez Hatna for his advice and assistance in reproducing Leitão et al. methods. This work benefited from comments and suggestions made by the GeoDiverCity team, by the attendees of the CTCS 2016 and by two anonymous reviewers.
Declaration of conflicting interests
The author(s) declared no potential conflicts of interest with respect to the research, authorship, and/or publication of this article.
Funding
The author(s) disclosed receipt of the following financial support for the research, authorship, and/or publication of this article: This research was supported by the European Research Council (ERC) Advanced Grant GeoDiverCity.
Notes
References
Supplementary Material
Please find the following supplemental material available below.
For Open Access articles published under a Creative Commons License, all supplemental material carries the same license as the article it is associated with.
For non-Open Access articles published, all supplemental material carries a non-exclusive license, and permission requests for re-use of supplemental material or any part of supplemental material shall be sent directly to the copyright owner as specified in the copyright notice associated with the article.