
Abstract
Land-use change models that accurately replicate the complex dynamics of land development provide vital information for urban planning and policy. These models require both detailed data and advanced statistical methods. Many factors influence land-use change decisions, such as parcel characteristics, accessibility to activities, and current and historical neighborhood conditions. Therefore, spatial and temporal components must be incorporated in a model at the highest possible disaggregation level in order to achieve robust results. A spatio-temporal multinomial autologistic model, incorporating space and time and their interactions, is introduced to investigate land-use dynamics at the parcel-level, and is applied to Delaware County, Ohio. It is able to capture the impacts of the existing and historical neighborhood conditions of parcels with high accuracy. Advanced computational methods are used to deal with the computational challenges of parameter estimation. The model is validated, estimating 91.4% of all observations correctly for the period 2005–2010, and is applied to land-use forecasting.
Introduction
Formulating robust land-use change models is a challenging task, as these models try to mimic land-cover conversions as realistically as possible. These conversions depend on several factors, such as parcel characteristics, neighborhood structures, historical trends, available services and amenities, infrastructures, socio-economic factors, zoning and other policies. Such system complexity creates major challenges in both methodology and computation. The importance of incorporating historical and neighborhood conditions in land-use change models has been highlighted by various researchers over the last decade (Bhat et al., 2015; Huang et al., 2009; Irwin et al., 2003). In addition, the increasing availability of geocoded data at disaggregated levels provides spatially heterogeneous information that can help improve model accuracy.
Spatial logistic and probit models incorporating spatial dependencies in land-use change modeling could be expanded to control for temporal dependencies. However, these models are computationally infeasible for large datasets due to the need for inverting spatial weight matrices. Alternative methods, such as autologistic regression, also require complex methods to maximize likelihood functions with intractable normalization constants. However, these computational difficulties are manageable using advanced programming procedures.
In this study, parcel-level land-use changes are investigated with the Auditor’s geocoded tax database for Delaware County, Ohio. The available information on the year when construction took place on each parcel is used to derive measures of land-use dynamics. A spatio-temporal multinomial autologistic model, incorporating space and time and their interactions, is used to investigate parcel-level land dynamics. This model, which captures the impacts of past and contemporaneous neighborhood variables on land-use conversions, is a modified version of the autologistic model introduced by Zhu et al. (2008). Because methods for the estimation of the parameters of multinomial autologistic models are not available in commercial and open source software, a dedicated statistical program was written in Python to estimate Monte Carlo Maximum Likelihood parameters, using parallel processing techniques. The resulting model is validated with a high level of accuracy.
The remainder of the paper is organized as follows. Review of the literature section reviews the relevant literature. The modeling methodology is presented in Methodology section. The data are described in Data section. Model results are presented and analyzed in Results section. Model validation and forecasts are discussed in Model validation and forecasting section. Conclusions section concludes and presents areas for further research.
Review of the literature
Urban land is assigned to specific human activities and is generally classified into a finite set of land-use categories, based on the dominant activity. In the simplest case, urban land is classified as either being occupied by some human activity or being unused. The factors driving urban land-use changes have been investigated with various statistical and simulation techniques at different geographical scales. Irwin and Geoghegan (2001) and Verburg et al. (2004a) provide comprehensive reviews of the various issues and approaches to land-use change modeling, and classify models in terms of their economic content, spatial explicitness, dynamic features, neighborhood interactions, empirical data, and mathematical structure.
The model presented in this paper, and most of the works reviewed below, can be characterized as inductive, data-driven empirical approaches, where a very general theoretical framework of utility or profit maximization helps define proxy dependent and independent variables, which are then related through a regression model that operationalizes the theoretical framework. In inductive models, the underlying decision process is derived from the observed pattern, which is, in general, successfully reproduced. The alternative deductive approach, which derives pattern from process, uses a theoretical framework wherein the decisions of the various actors involved in land-use changes are simulated explicitly, using field data. Deductive approaches involve multiple agents and decision stages. A good example is PUMA (Ettema et al., 2007), a multi-agent model representing the behaviors of farmers, governments, investors, developers, firms, and households in the Ranstad region of the Netherlands. Overmars et al. (2007) compare the inductive (multinomial logit) and deductive approaches, as applied to forest and crop changes in a municipality in the Philippines. They conclude that the inductive approach is more appropriate in the case of small land-use changes, and the deductive approach is more suitable to handle discontinuities and new large-scale land uses. Koomen et al. (2015) argue for the integration of both the inductive and deductive approaches.
In the following, we first review representative studies of land-use change using discrete models. We next discuss the issues of both spatial and temporal dependencies in these models. Finally, we summarize the shortcomings of these approaches and outline how they are alleviated by the modeling approach proposed in this paper.
Qualitative choice models are commonly used to deal with the discreteness of land-use change. Chomitz and Gray (1996) use a multinomial logit to investigate the impacts of new roads on deforestation and land conversion to commercial and semisubsistence agriculture in Belize. Their sample includes data over a grid of 11,712 cells of 1 km size, and they consider distance to market, soil characteristics, and precipitations as major determinants. Carrion-Flores and Irwin (2004) use a probit model to analyze parcel-level residential conversion in the urban-rural fringe of the Cleveland metropolitan area, with independent variables such as distances to Cleveland center and the local town, population density, parcel size, soil types, and surrounding land-use shares within a 0.5 mile buffer around each parcel. They use three samples of around 4000–6000 parcels. Verburg et al. (2004b) use a stepwise logistic regression to analyze both historic land uses, as observed in 1989, and recent land-use changes (1989–1996) in the Netherlands, with grid cells of 500 m as units of observation. They find that historic patterns can be explained by variations in the biophysical environment (altitude, soil, accessibilities), while recent changes in residential, commercial/industrial, and recreation areas result from variations in accessibilities, spatial policies, and neighborhood characteristics. Lavalle et al. (2011) describe the Europe-wide land allocation simulation model EUCS100, where the basic spatial unit is a raster cell of 100 m. The endogenous selection of land cover classes is based on a standard multinomial logistic regression, where the independent variables are cell factors and a neighborhood effect. However, this effect is accounted for in a separate logistic regression that assesses the land composition of the three rings of cells directly neighboring the target cell. Nahuelhual et al. (2012) investigate timber plantation expansion in south-central Chile over two separate periods (1975–1990, 1990–2007), using autologistic regression estimated over a random sample of 2000 points extracted from a grid. They find that soil, slope, altitude, accessibility, property size and tenure, and previous land cover are major determinants of plantation expansion. Deng and Srinivasan (2016) also use autologistic regression to analyze rural-to-urban land-use change over 2000–2010 in Beijing, with various proximities, neighborhood densities, and physical and socio-economic characteristics as major determinants. A grid of 1 km cells provides the basis for the sampling of 2651 spatial units. Finally, Bhat et al. (2015) propose a spatial multinomial discrete-continuous probit model to analyze and predict both the type and intensity of land development patterns. Parcel-level data for Austin’s CBD and surrounding areas in 2010 are aggregated into a grid of 2383 cells of 0.25 mile, and four land-uses are considered. The maximum approximate composite marginal likelihood (MACML) method is implemented as an alternative to a simulation-based approximation of the likelihood function.
In order to achieve robust estimates, land-use change models must consider possible spatial dependencies. Among the above-reviewed works, both Chomitz and Gray (1996) and Verburg et al. (2004b) do not account for such dependencies. Carrion-Flores and Irwin (2004) focus on the spatial autocorrelation of the error term. Nahuelhual et al. (2012) and Deng and Srinivasan (2016) account for the spatial dependencies among the land-use change variables, and Bhat et al. (2015) use a spatial lag specification for the baseline utilities. Finally, the large-scale EUCS100 model (Lavalle et al., 2011) is an idiosyncratic hybrid approach that involves a standard multinomial logit with neighborhood effects estimated separately, hence the endogeneity of the interactions among the land-use variables across spatial units is not accounted for within the logit estimation procedure.
Accounting for spatial dependencies in discrete-response models is not as straightforward as in linear regression models, because of the need to solve multi-dimensional integrals. The expected maximization (EM) algorithm, Gibbs sampler, and simulation methods can be used to solve computationally difficult integrals (Carrion-Flores and Irwin, 2004; Fleming, 2004). The EM algorithm replaces the latent variable with an estimate (McMillen, 1992). However, this algorithm is infeasible when the number of spatial units is large. Alternatively, the Bayesian Gibbs sampler approach, proposed by LeSage (2000), is an extension of the Gibbs sampling method suggested by Geman and Geman (1984), and does not require inverting spatial weight matrices, thus making computations feasible even if datasets are large. While the concept of neighborhood is essential to spatial analysis, there are no firm rules for the definition of neighborhoods, which can be based on proximity, contiguity, or both.
Incorporating spatial dependence is, however, insufficient to achieve robust results in land-use change models, because temporal complexities and dynamics must also be considered. There are a few land-use change models that incorporate both spatial and temporal dynamics. Irwin et al. (2003) estimate a duration model for residential land-use conversion at the parcel level, but there is no explicit temporal lag in land development. Also, while surrounding land-use measures are used as proxies for neighborhood effects, the conversion duration for parcels in these neighborhoods are not treated as endogenous variables. Huang et al. (2009) investigate the spatio-temporal dynamics of rural-to-urban conversions in New Castle county, Delaware, over three separate periods (1984–1992, 1992–1997, 1997–2002). They use logistic regression combined with a smoothing technique common in time-series data analysis to uncover temporal trends. However, they do not include explicit temporal lagged variables, and spatial autocorrelation is filtered out with appropriately spaced sampling over a grid of 50 m cells (sample sizes vary between 600 and 800). Ferdous and Bhat (2013) introduce a spatial panel ordered-response probit model that incorporates both spatial interactions, using the spatial lag of the latent variable, and temporal dynamics, using a temporal autoregressive error term for each spatial unit. They use a sample of 783 parcels in Austin over the years 2000, 2003, 2006, and 2008, and consider four mutually exclusive land developments of increasing intensity: no development, single and two-family residential, other residential, and nonresidential. Finally, Wang et al. (2012) present a multinomial probit model that incorporates spatial and temporal dependencies to investigate parcel-level land-use changes in Austin over 8 years (2000–2007). Both dependencies are related to the error term, and not to the latent utility variable. Three land-use categories are considered: residential, nonresidential, and undeveloped. TAZ-level independent variables include employment and population densities, average income, and accessibility. The authors recognize the computational infeasibility of considering spatial dependencies across all 320,550 parcels, and estimate their model with Bayesian MCMC techniques over 48 subsamples of 100 parcels each and located around the centroids of Austin’s 48 zip code areas.
A synthesis of the previous review points to the following conclusions: (1) Sample sizes are small, ranging from 100 to 6000, whenever either or both spatial and temporal dependencies are considered; (2) Spatial dependencies across the dependent variables are only considered in atemporal autologistic models (Deng and Srinivasan, 2016; Nahuelhual et al., 2012), and in the models of Ferdous and Bhat (2013) and Bhat et al. (2015), while all the other models focus on the spatial dependencies of the error terms; (3) Whenever temporal dependencies are accounted for, they focus exclusively on the error term within each spatial unit, without considering spatial cross effects among the dependent land-use variables.
Small geographical scales, such as the parcel, can provide a wealth of information due to spatial heterogeneity, and the availability of such data has expanded due to advances in GIS technologies. However, this availability brings computational challenges to spatial regression models, because the datasets may become very large. In particular, estimation procedures that require the computation of inverses of spatial weight matrices may become computationally infeasible with very large datasets, hence the small samples considered in earlier research. However, an alternative methodological approach, like the spatio-temporal binary autologistic model (STARM), where parameters are estimated without computing matrix inverses, can be a feasible approach when datasets are large. Another distinctive feature of STARM is its ability to deal explicitly with the spatial and temporal dependencies of the endogenous variable, providing a unified treatment of these dependencies that is absent in earlier works.
A binary STARM is implemented by Zhu et al. (2008) to investigate Mountain pine beetle outbreaks in Western Canada, with the probability of outbreak at a given location assumed to be conditional on current and past neighborhood observations. Their model is estimated over a grid of 469 cells of 12 km over 13 years (1972–1984), with 2 years of data (1985–1986) used for model validation. A predefined spatial weight matrix is implemented in order to account for spatial dependencies, and a Markov chain assumption is made, where the conditional distribution of the dependent variable depends on the most recent time points, because historical tree conditions have an effect on current three conditions. Model results indicate that the outbreak probability depends on the number of days with a temperature below −40℃, the average temperature in August, the average elevation within a cell, and spatial and 1-year and 2-year temporal lags. Tepe and Guldmann (2017) adapt STARM to estimate the probability of a parcel changing its status from vacant to developed, using data for the 73,560 parcels of an entire county and over 15 years (1990–2004). The methodology presented in the next Section extends the binary STARM model into a multinomial framework. In contrast to earlier attempts, it explicitly accounts for the endogenous spatial and temporal interactions of the land-use change variables while resolving the computational challenges of very large datasets.
Methodology
The multinomial distribution is a generalization of the Bernoulli distribution, wherein individual trials are assumed independent, while outcomes are mutually exclusive and all inclusive. The probability of the simultaneous occurrence of two outcomes is zero and the probability of the occurrence of one out of all the possible outcomes is one. Equation (1) presents the joint probability distribution for V categorical outcomes

In the multinomial logit model, the logarithm of the odds for any category v to the base category V is calculated in equation (2)

Theoretically, land-use change occurs on a parcel if the expected benefits from the new land use are larger than the one-time conversion cost and expected benefits from the current land use. In general, this information is very difficult to obtain empirically. However, parcel characteristics, its accessibilities to points of interest, and its historical and contemporaneous neighborhood structures can be used as proxy variables. Online Supplementary Figure S1 illustrates the determinants of parcel land-use change. Online Supplementary Figure S2 illustrates the endogenous variable
The estimation of the parameters of the multinomial model log
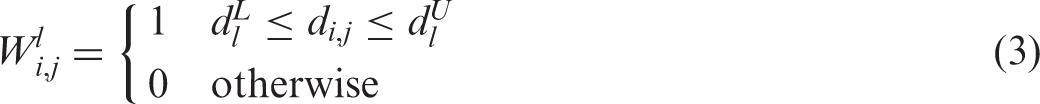
Model complexity can be reduced through neighborhood assumptions. The weight matrix
Multiple orders of the spatial neighbors matrix are considered, as illustrated in online Supplementary Figure S3.
Since incorporating all the available time points in the dataset increases model complexity, a Markov Chain assumption is made, wherein only the last S states influence the next state, that is, the probability distribution of the current state depends strictly on these previous states. In the model application, historical land developments in neighborhoods are assumed to have an effect on the probability of current development: the current development of parcel i at time t depends on the historical parcel developments in the neighborhood of parcel i at times t − 1,…, t − S.
Data
Delaware County (Ohio), located north of the city of Columbus, is selected as the study area (online Supplementary Figure S4). With a population of 189,113 in 2014, it has been one of the fastest developing areas in the United States. The County Auditor’s database provides a GIS coverage of its 73,560 parcels, together with property and parcel characteristics. Parcel construction year information is available and used to generate the historical development of each parcel. Parcel land-use information from the Auditor’s database is verified and updated with data provided by the Mid-Ohio Regional Planning Commission (MORPC). Historical patterns of population and density at the county and census-tract levels are drawn from the US Census. Prime land data are obtained from the US Department of Agriculture (USDA). Initially classified into 31 categories, land uses have been regrouped into four categories: small-lot single-family residential—SLSFR (parcel size <0.5 acres), large-lot single-family residential—LLSFR (parcel size ≥0.5 acres), other residential—OR (multi-family, condominium), and other land uses—OLU (commercial, industrial, public services, government, etc.). About 43% of the parcels are classified as SLSFR, 25% as LLSFR, 16% as OR, and the remainder as OLU. The sizes of parcels in these four categories vary as follows: (1) between 0.009 and 0.50 acres, with a mean of 0.27, for SLSFR; (2) between 0.50 and 137.4 acres, with a mean of 2.85, for LLSFR; (3) between 0.022 and 111.3 acres, with a mean of 1.02, for OR; and (4) between 0.002 and 498.9 acres, with a mean of 16.9, for OLU. Most parcels have less than 1 acre. The smaller parcels are located in and around city centers, as well as in the southern part of Delaware County, close to Franklin County and the City of Columbus. The average size of developed parcels has declined in recent years, because of smaller parcels for urban land-uses and reduced interest in agricultural development.
Figure 1 illustrates the historical pattern of development for these four land-use categories at the parcel level over the period 1950–2012. Online Supplementary Figure S5 represents the total annual number of parcels developed over the same period. While only 5960 parcels (8.1%) had been developed before 1950, 55,274 parcels (75%) had been developed by 2012. The peak development year was 2002.
Pattern of land-use development in Delaware County, 1950–2012.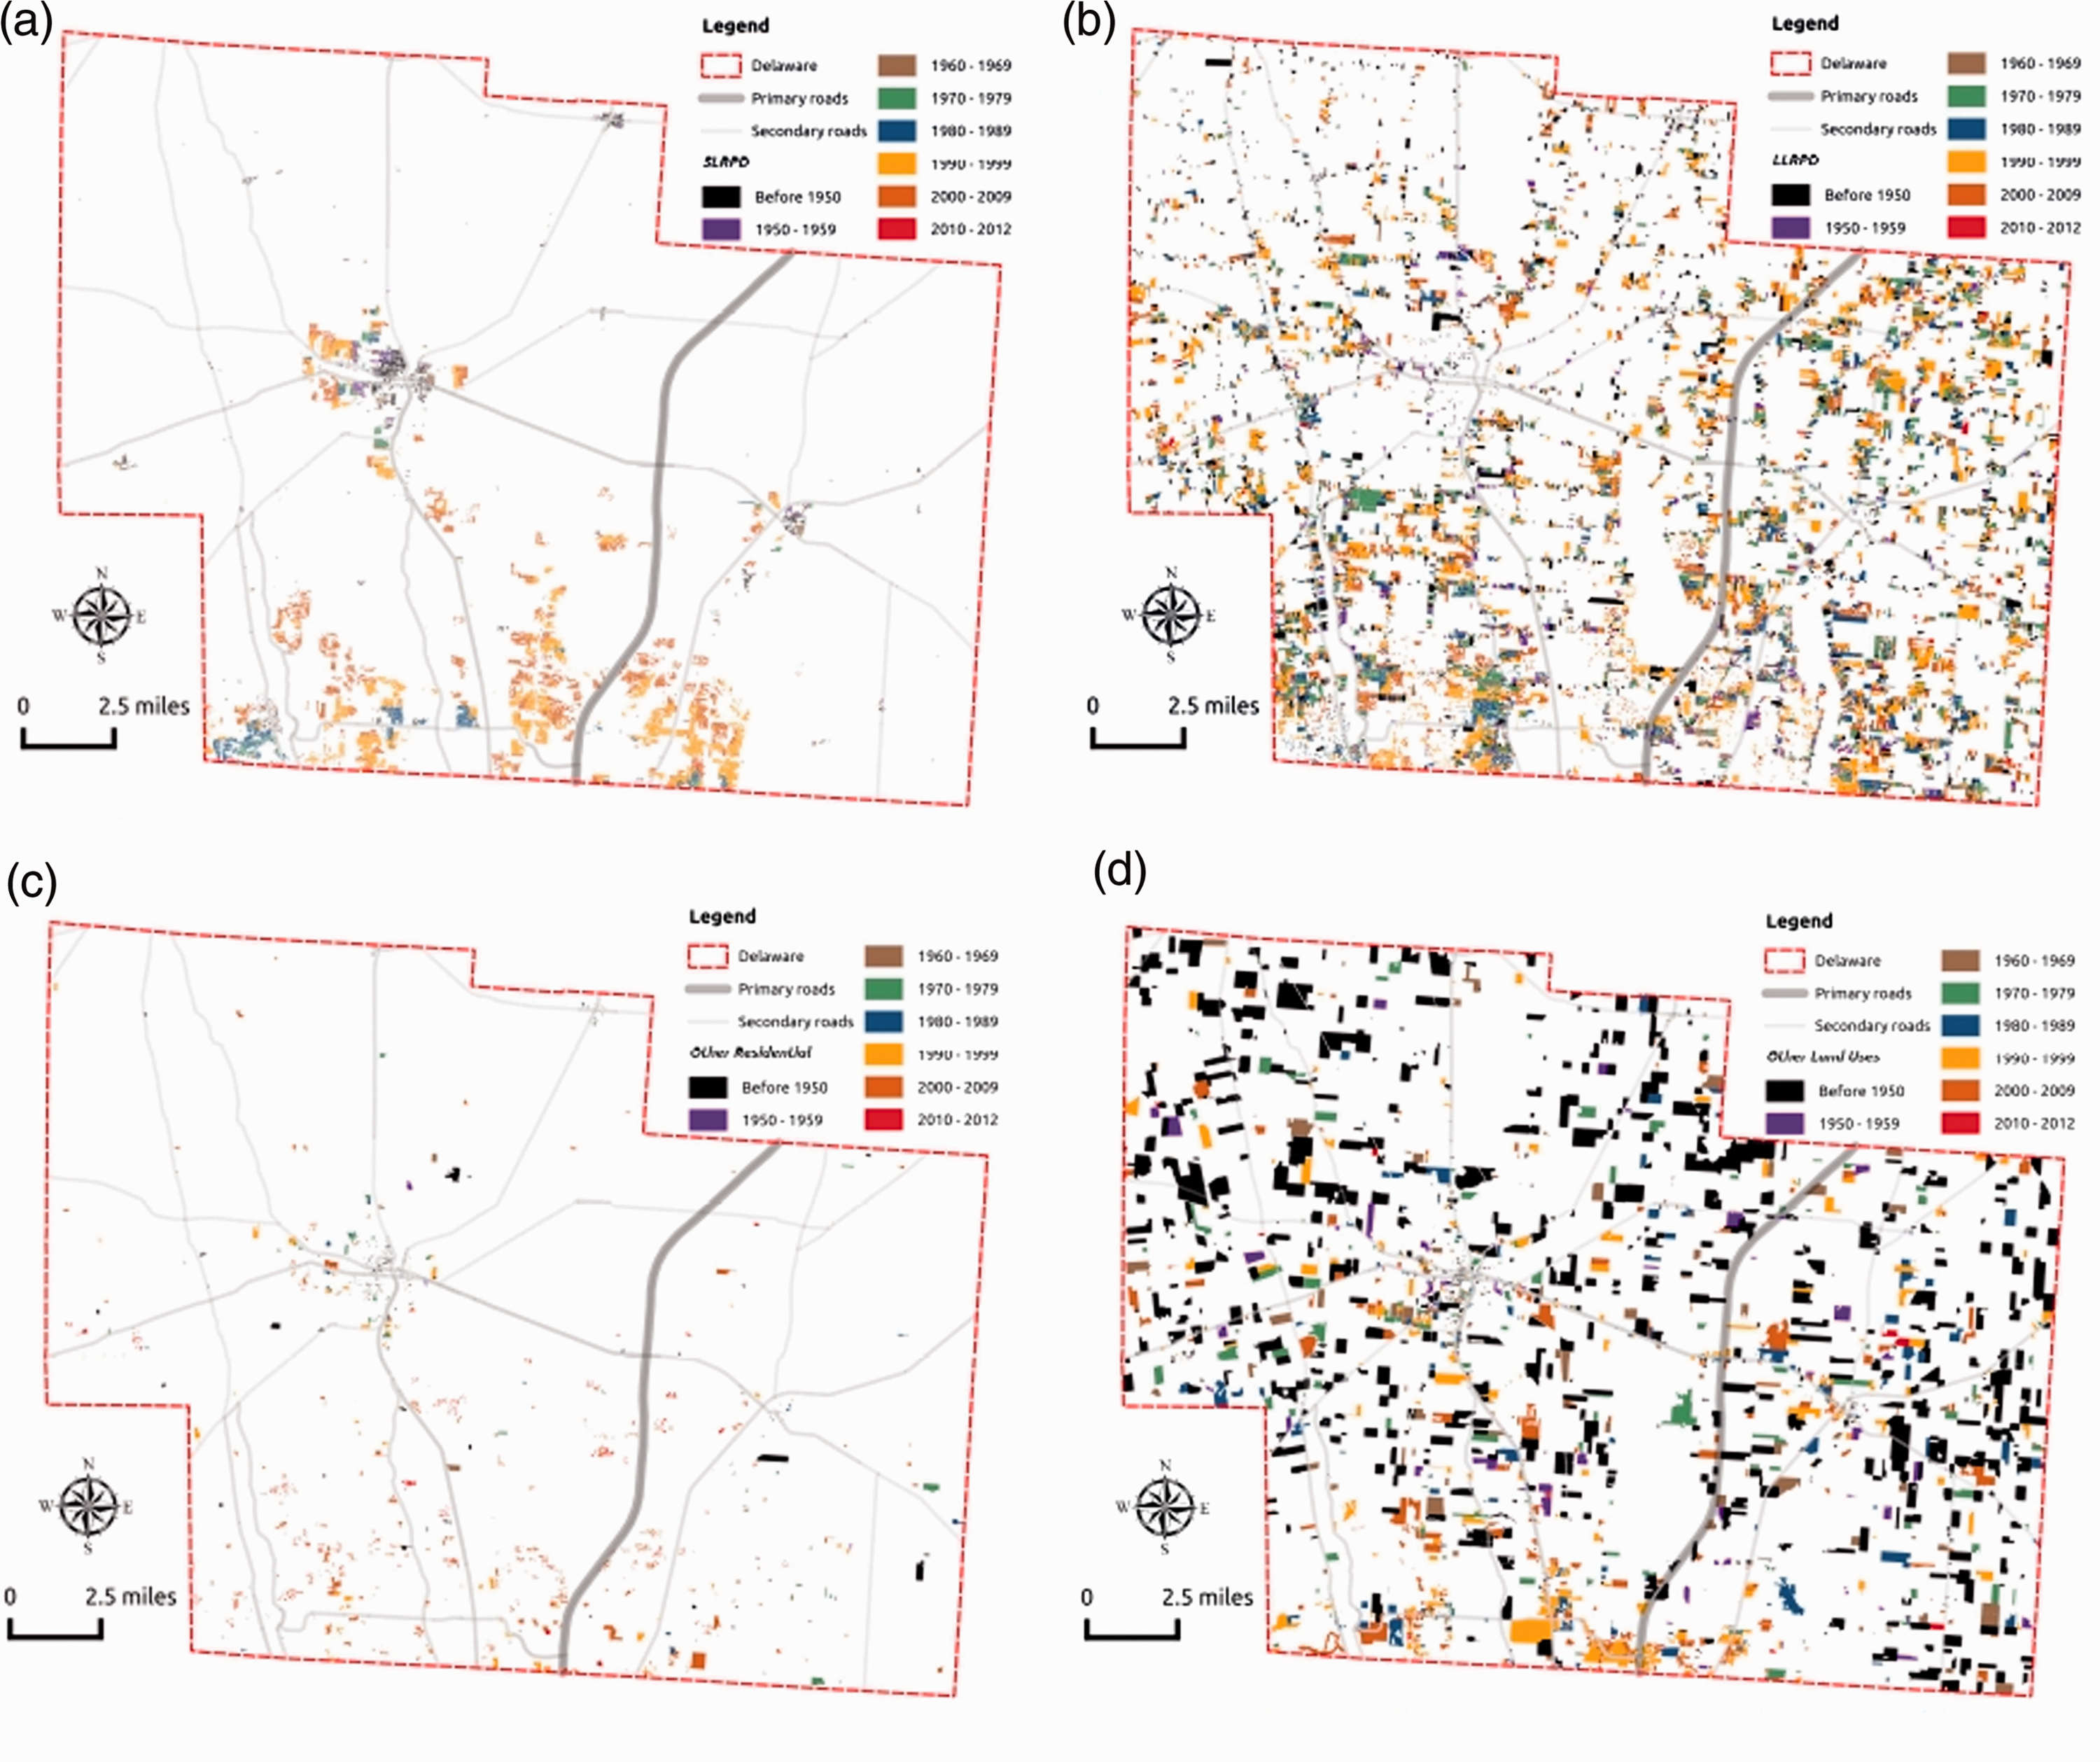
The 2012 land-use pattern is illustrated in online Supplementary Figure S6. The dominant land use is residential: 63,071 parcels (85.74%) are identified as residential, of which 80.27% (50,625) are single-family parcels. Vacant (zoned) residential is the next largest land use (10,645 parcels), followed by multi-family use, with 1331 parcels. About 1.4% of the parcels are designated for condominium use. Agriculture has 4148 parcels (5.64%), the second most common land use, followed by commercial land use, including community, neighborhood, regional, vacant (zoned) commercial, and neighborhood mix, with a total of 1956 parcels (2.62%). Furthermore, there are office (0.80%) and open space (0.72%) parcels. Vacant (zoned) parcels are all assigned to the undeveloped category. Parcels zoned as neighborhood mix land use are grouped with other similar uses. Commercial uses characterize 25% of these parcels, with the remainder applied to residential purposes. Parcels identified as open space includes golf courses, cemeteries and private conservation areas that are characterized by some form of “permanent openness,” but are not necessarily public spaces. Open space parcels are assigned to the undeveloped category if they have no year-built information in the database. When there is such information, it may be related to a built structure, such as a picnic shelter in a park.
Historical population growth was not investigated at the census-tract level because of significant changes in census-tract boundaries over the years. Using decadal Census population data for the whole county over 1850–2010, the following regression model was estimated

The availability of the year-built information provides an opportunity to derive historical conditions, with a parcel assumed vacant until the time when it is developed. However, historical information about parcel partitioning and consolidation is not available. Therefore parcel shapes and boundaries are here assumed fixed over time.
Shares of land uses have been calculated within a half-mile radius buffer circle centered at the centroid of each parcel and for each year from 1950 to 2012. Online Supplementary Figure S7 illustrates such a buffer around a parcel located in downtown Delaware city. Over 1950–2012, the shares of the agricultural, open space and vacant lands within these buffers have declined. In contrast, the mean residential share has increased from 11.2% in 1980 to 37.6% in 2010, reaching almost 40% in 2012.
Some locational characteristics relevant to land development are not directly available in the Auditor’s database. Euclidean distances between a parcel centroid and nearest points of interest, such as schools, hospitals, groceries, airport, road intersections, railways, city center, industrial facilities, open spaces, and public services, have been calculated for each parcel and time period. In summary, each parcel is characterized by the following data categories: (1) parcel characteristics: size, land use, development status, and distances to nearest points of interest; (2) neighborhood buffer: shares of various land uses; (3) socio-economic: county-level population trend. These data are available for each year over 1950–2012.
Results
The analysis of land development uses the data for 72,069 parcels, after excluding rights-of-ways and water parcels. Because of the complexity of the estimation computational process, the selected time unit is 5 years. The exogenous variables have therefore been averaged over 5-year periods. The model is estimated with the data over 1950–2000, while the data over 2000–2010 are to be used for model validation. If a parcel i changes its state to land-use v during a given 5-year period t, then v1 = small-lot single-family residential – SLSFR, with parcel size < 0.5 acres; v2 = large-lot single-family residential – LLSFR, with parcel size ≥ 0.5 acres; v3 = other residential – OR: two-family, three-family, multi-family and condominium; v4 = other (nonresidential) land uses – OLU; v0 = undeveloped parcel (base category).
Description of the exogenous variables.
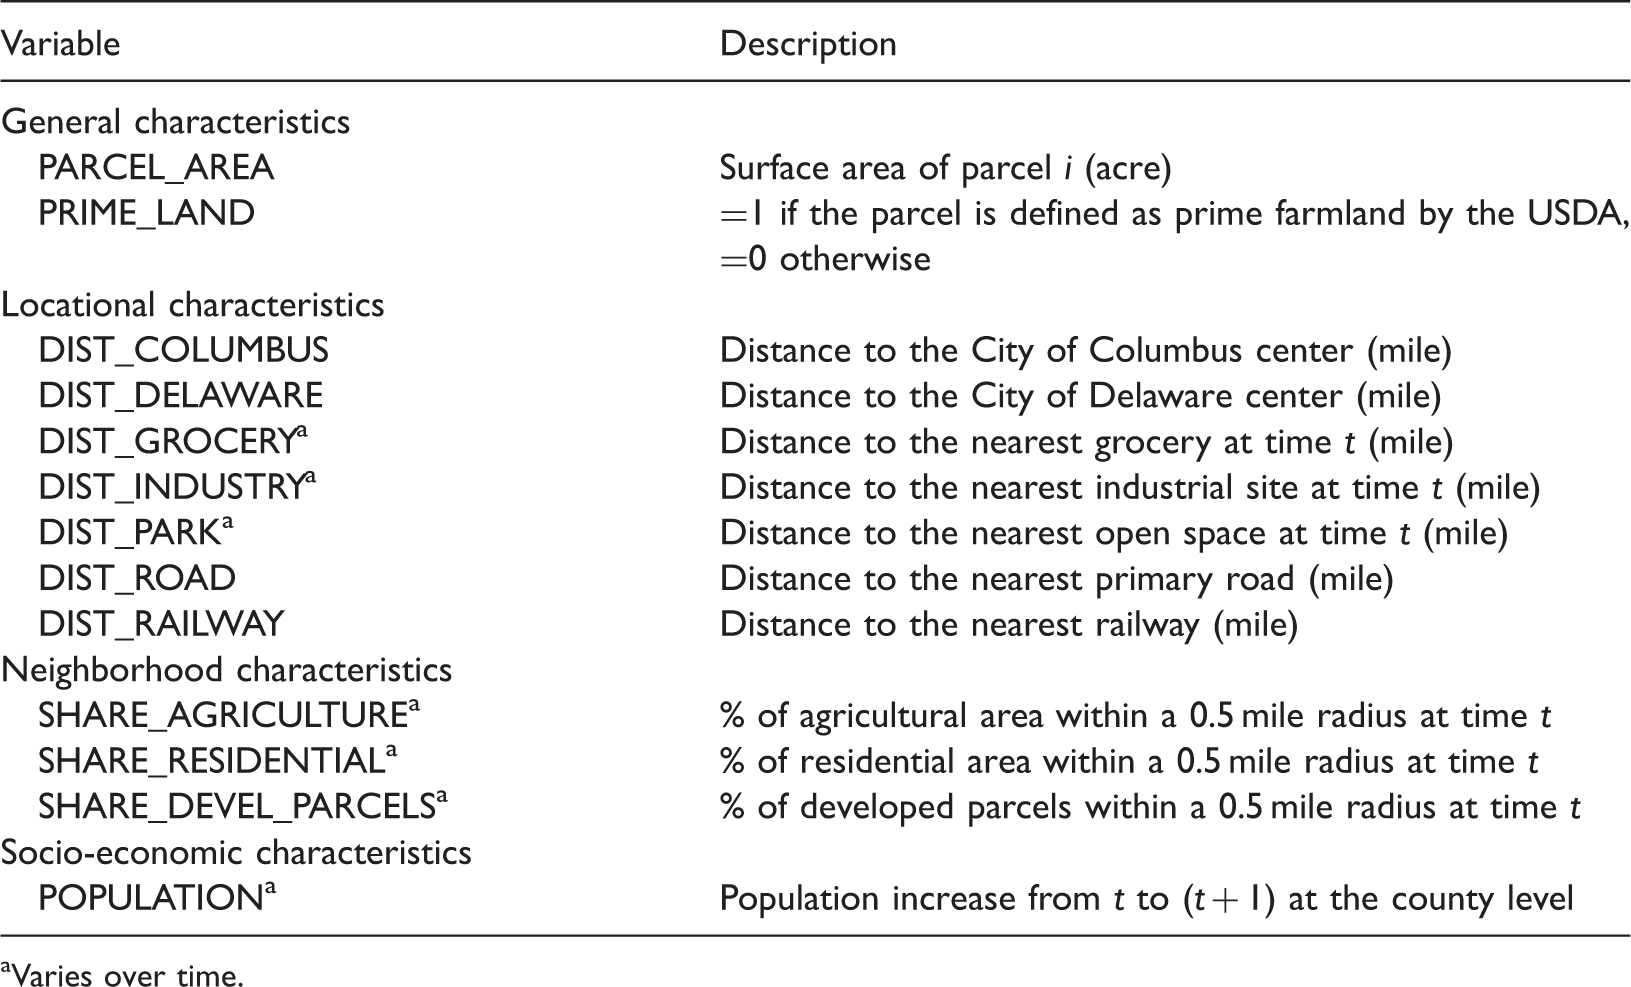
Varies over time.
Descriptive statistics (1950–2000).
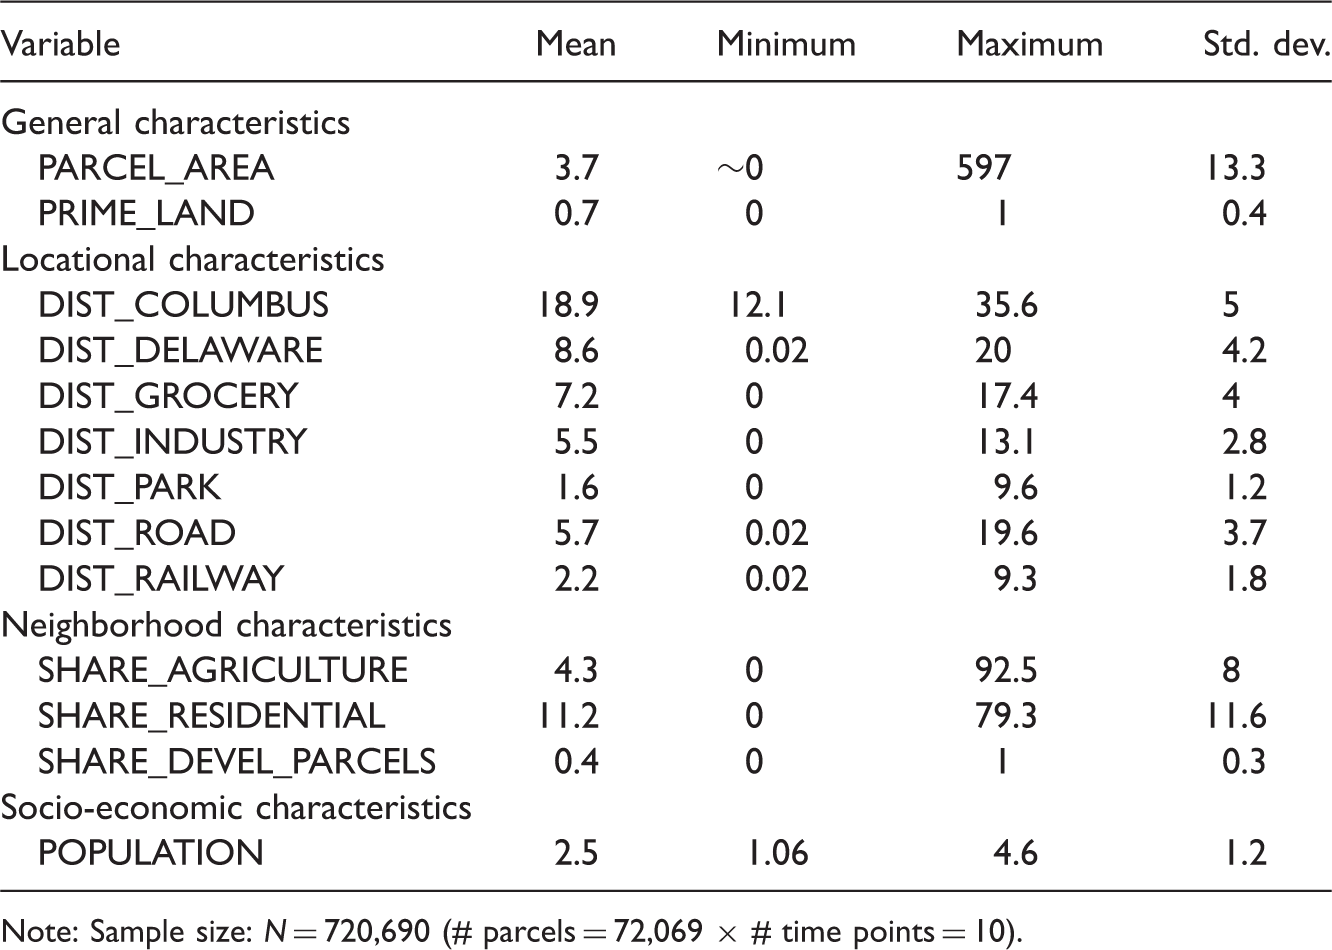
Note: Sample size: N = 720,690 (# parcels = 72,069 × # time points = 10).
Model estimation results.
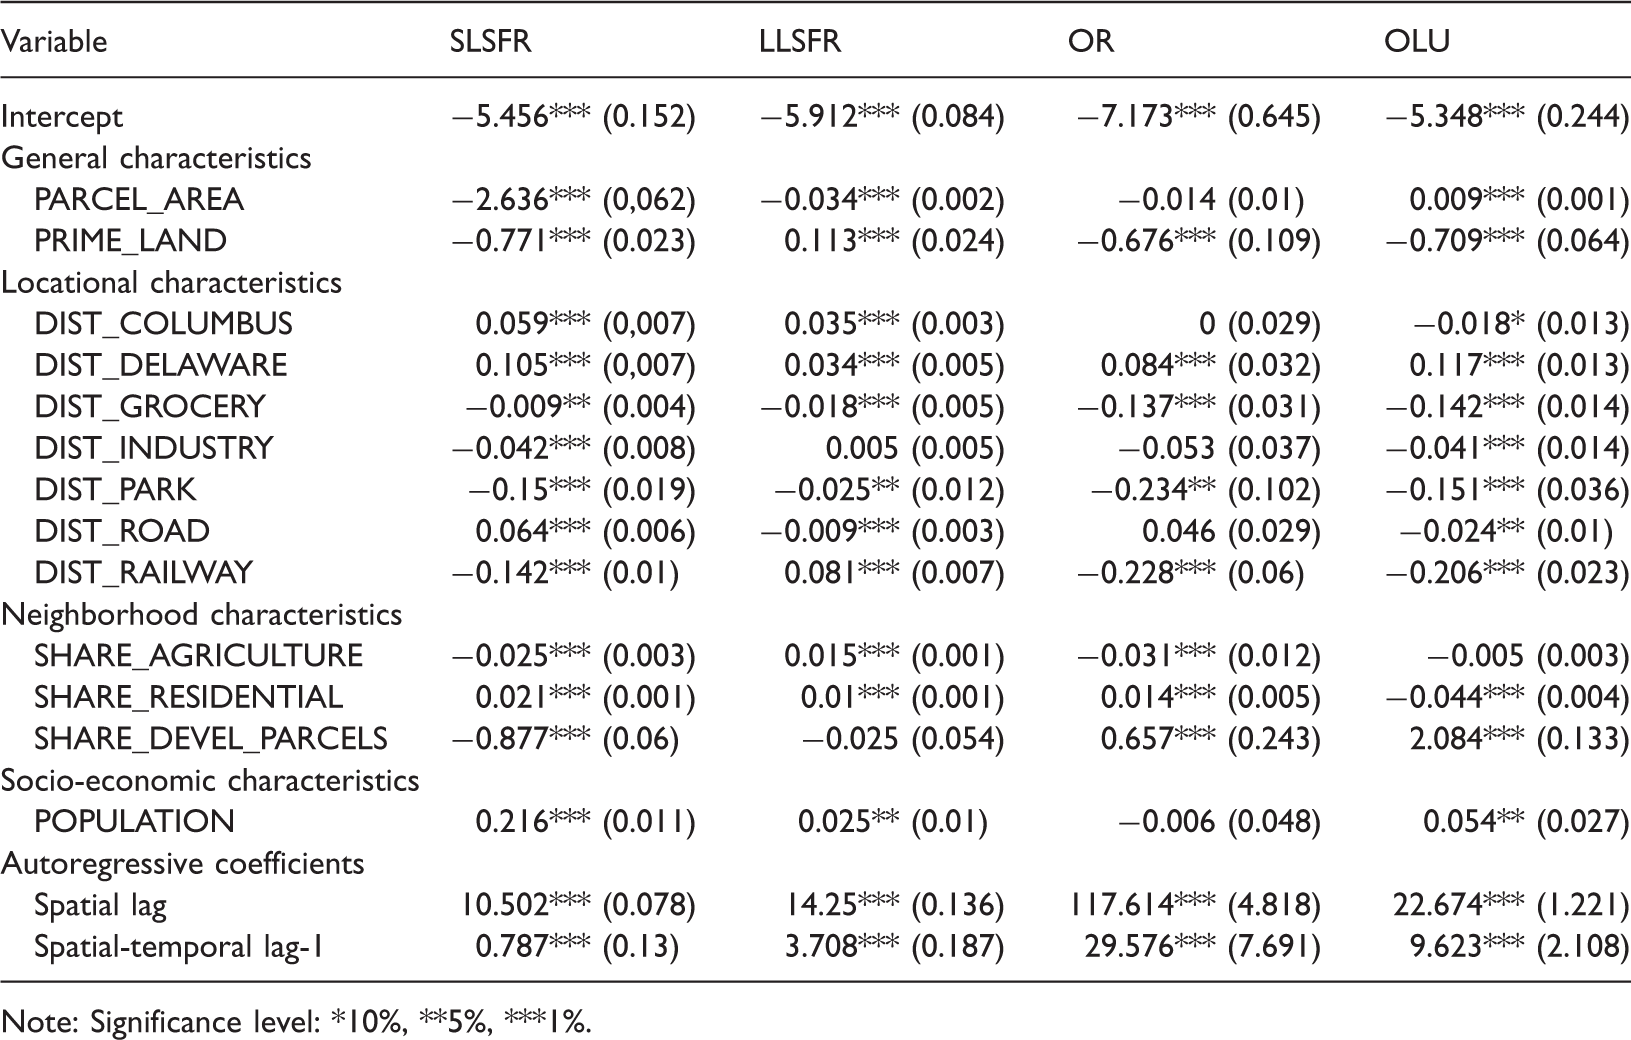
Note: Significance level: *10%, **5%, ***1%.
The model correctly captures some common behaviors of homeowners. As parcel size increases, the probability of all residential developments decreases, which suggests that homebuyers tend to buy smaller residential parcels in order to minimize investment and tax expenditures. Locations in closer proximity to the Columbus and Delaware city centers have less potential for all three types of residential developments, because peripheral areas offer more affordable land. In contrast, nonresidential activities are attracted to locations in closer proximity to the center of Columbus, due to available services and infrastructures. An increase in the distance to the nearest primary road increases the probability of SLSFR development, but reduces the likelihood of LLSFR and nonresidential development. In contrast, an increase in the distance to the nearest railway reduces the likelihood of SLSFR, other residential, and nonresidential developments, but increase the probability of LLSFR development. The magnitude of the railway distance effect is larger than that of the primary road for all land-use categories.
Prime farmland attracts LLSFR development, which favors land located in peripheral areas, but discourages other types of development. Locations in closer proximity to the nearest grocery, industry and open space have an increased probability of development for all land-use categories, pointing to the goal of minimizing travel distances to these points of interest.
As the share of agricultural land within a buffer increases, the probability of LLSFR development increases, but the reverse applies to the other land uses. Neighborhoods with much agricultural land offer good conditions for large-lot residential development, because this land is located in peripheral areas where average parcel sizes are larger than in more central areas. An increase in the residential share within a buffer increases the probability of development for all residential land-use categories, while discouraging nonresidential land-uses. This result points to strong clustering effects for residential developments.
Small- and large-lot residential developments are less likely when the share of developed parcels in the neighborhood increases, which points to the effect of restricted land supply. However, the reverse applies to the other type of residential and nonresidential developments, which may be more attracted to dense areas with available services and infrastructures. Finally, the expectation of a population increase over the next period (5 years) increases the likelihood of development for all land-use categories, except for other residential land uses.
Model validation and forecasting
Land-use patterns can also be predicted using the multinomial STARM, for both validation and forecasting purposes. To do so, the variable 
The latent variable, 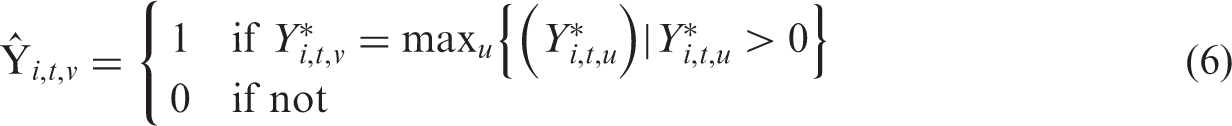
The model, estimated with data over 1950–2000, is validated over the period 2000–2010 by predicting, over all the parcels that remain undeveloped, the land-use development variable
The accuracy (AC) of the model is then assessed by comparing predictions with observations. An error function, 
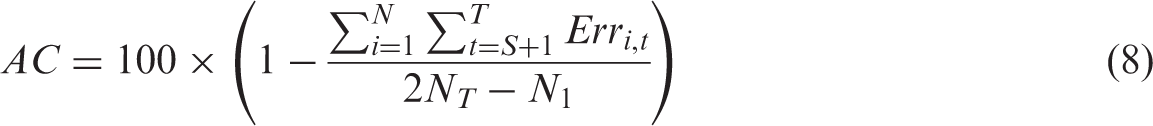
The model estimates 91.35% of all observations correctly over 2005–2010. Figure 2 illustrates these results.
Model validation for the period 2005–2010. (a) Actually developed parcels. (b) Model probabilities of development.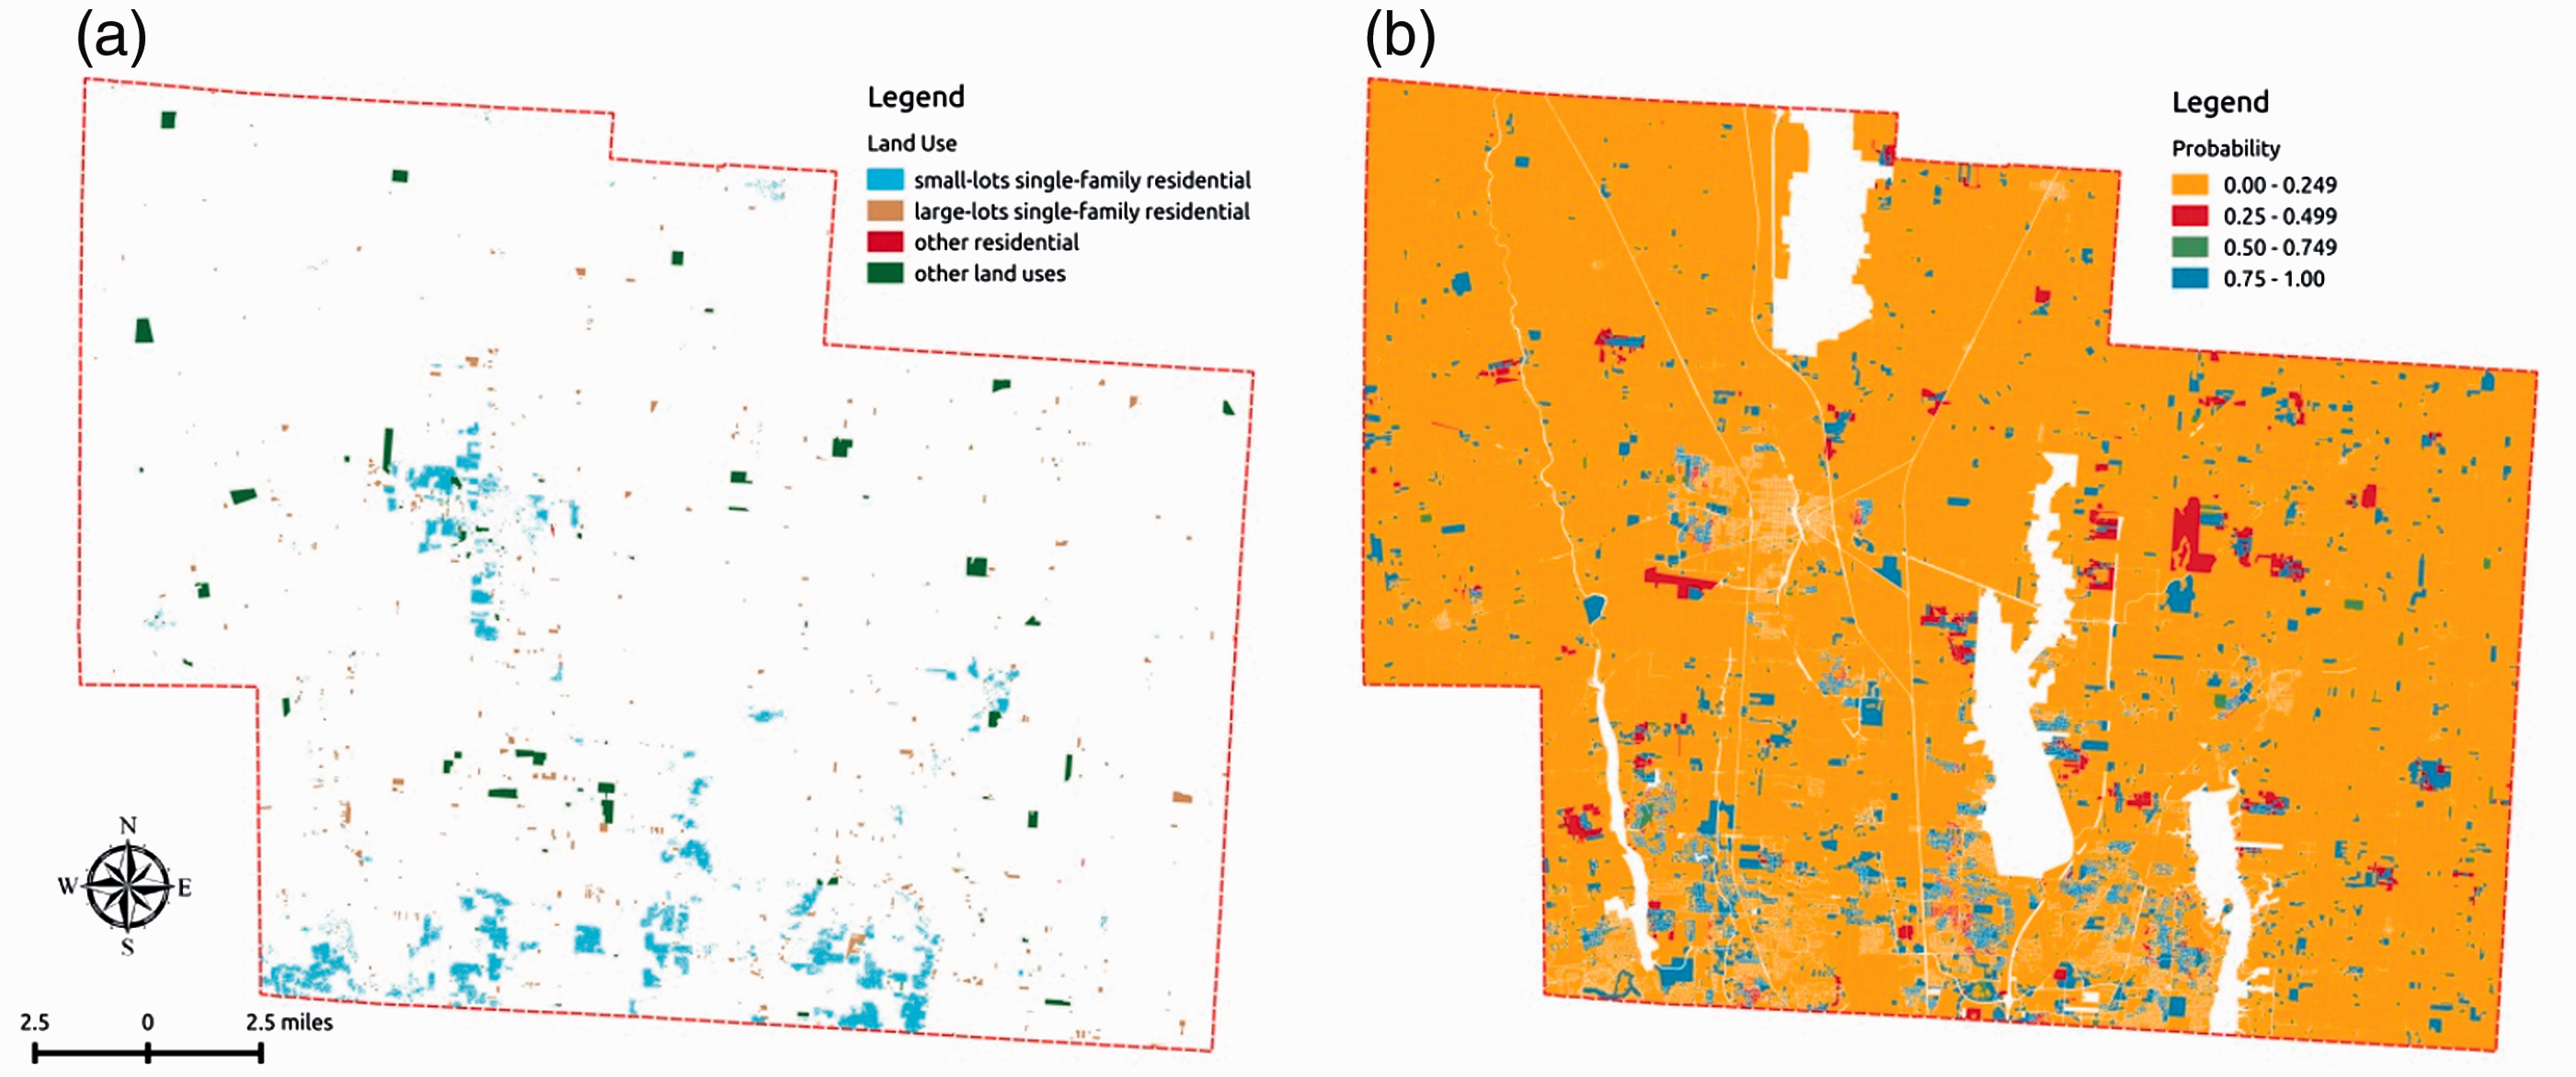
STARM’s forecasting potential is illustrated by predicting the parcels to be developed over 2010–2015. The model predicts that 3363 small-lot residential parcels, 3758 large-lot residential parcels, 527 other residential parcels, and 887 nonresidential parcels will be developed over 2010–2015. Figure 3 indicates the locations of these new parcels.
Location of predicted parcel development in Delaware County over 2010–2015.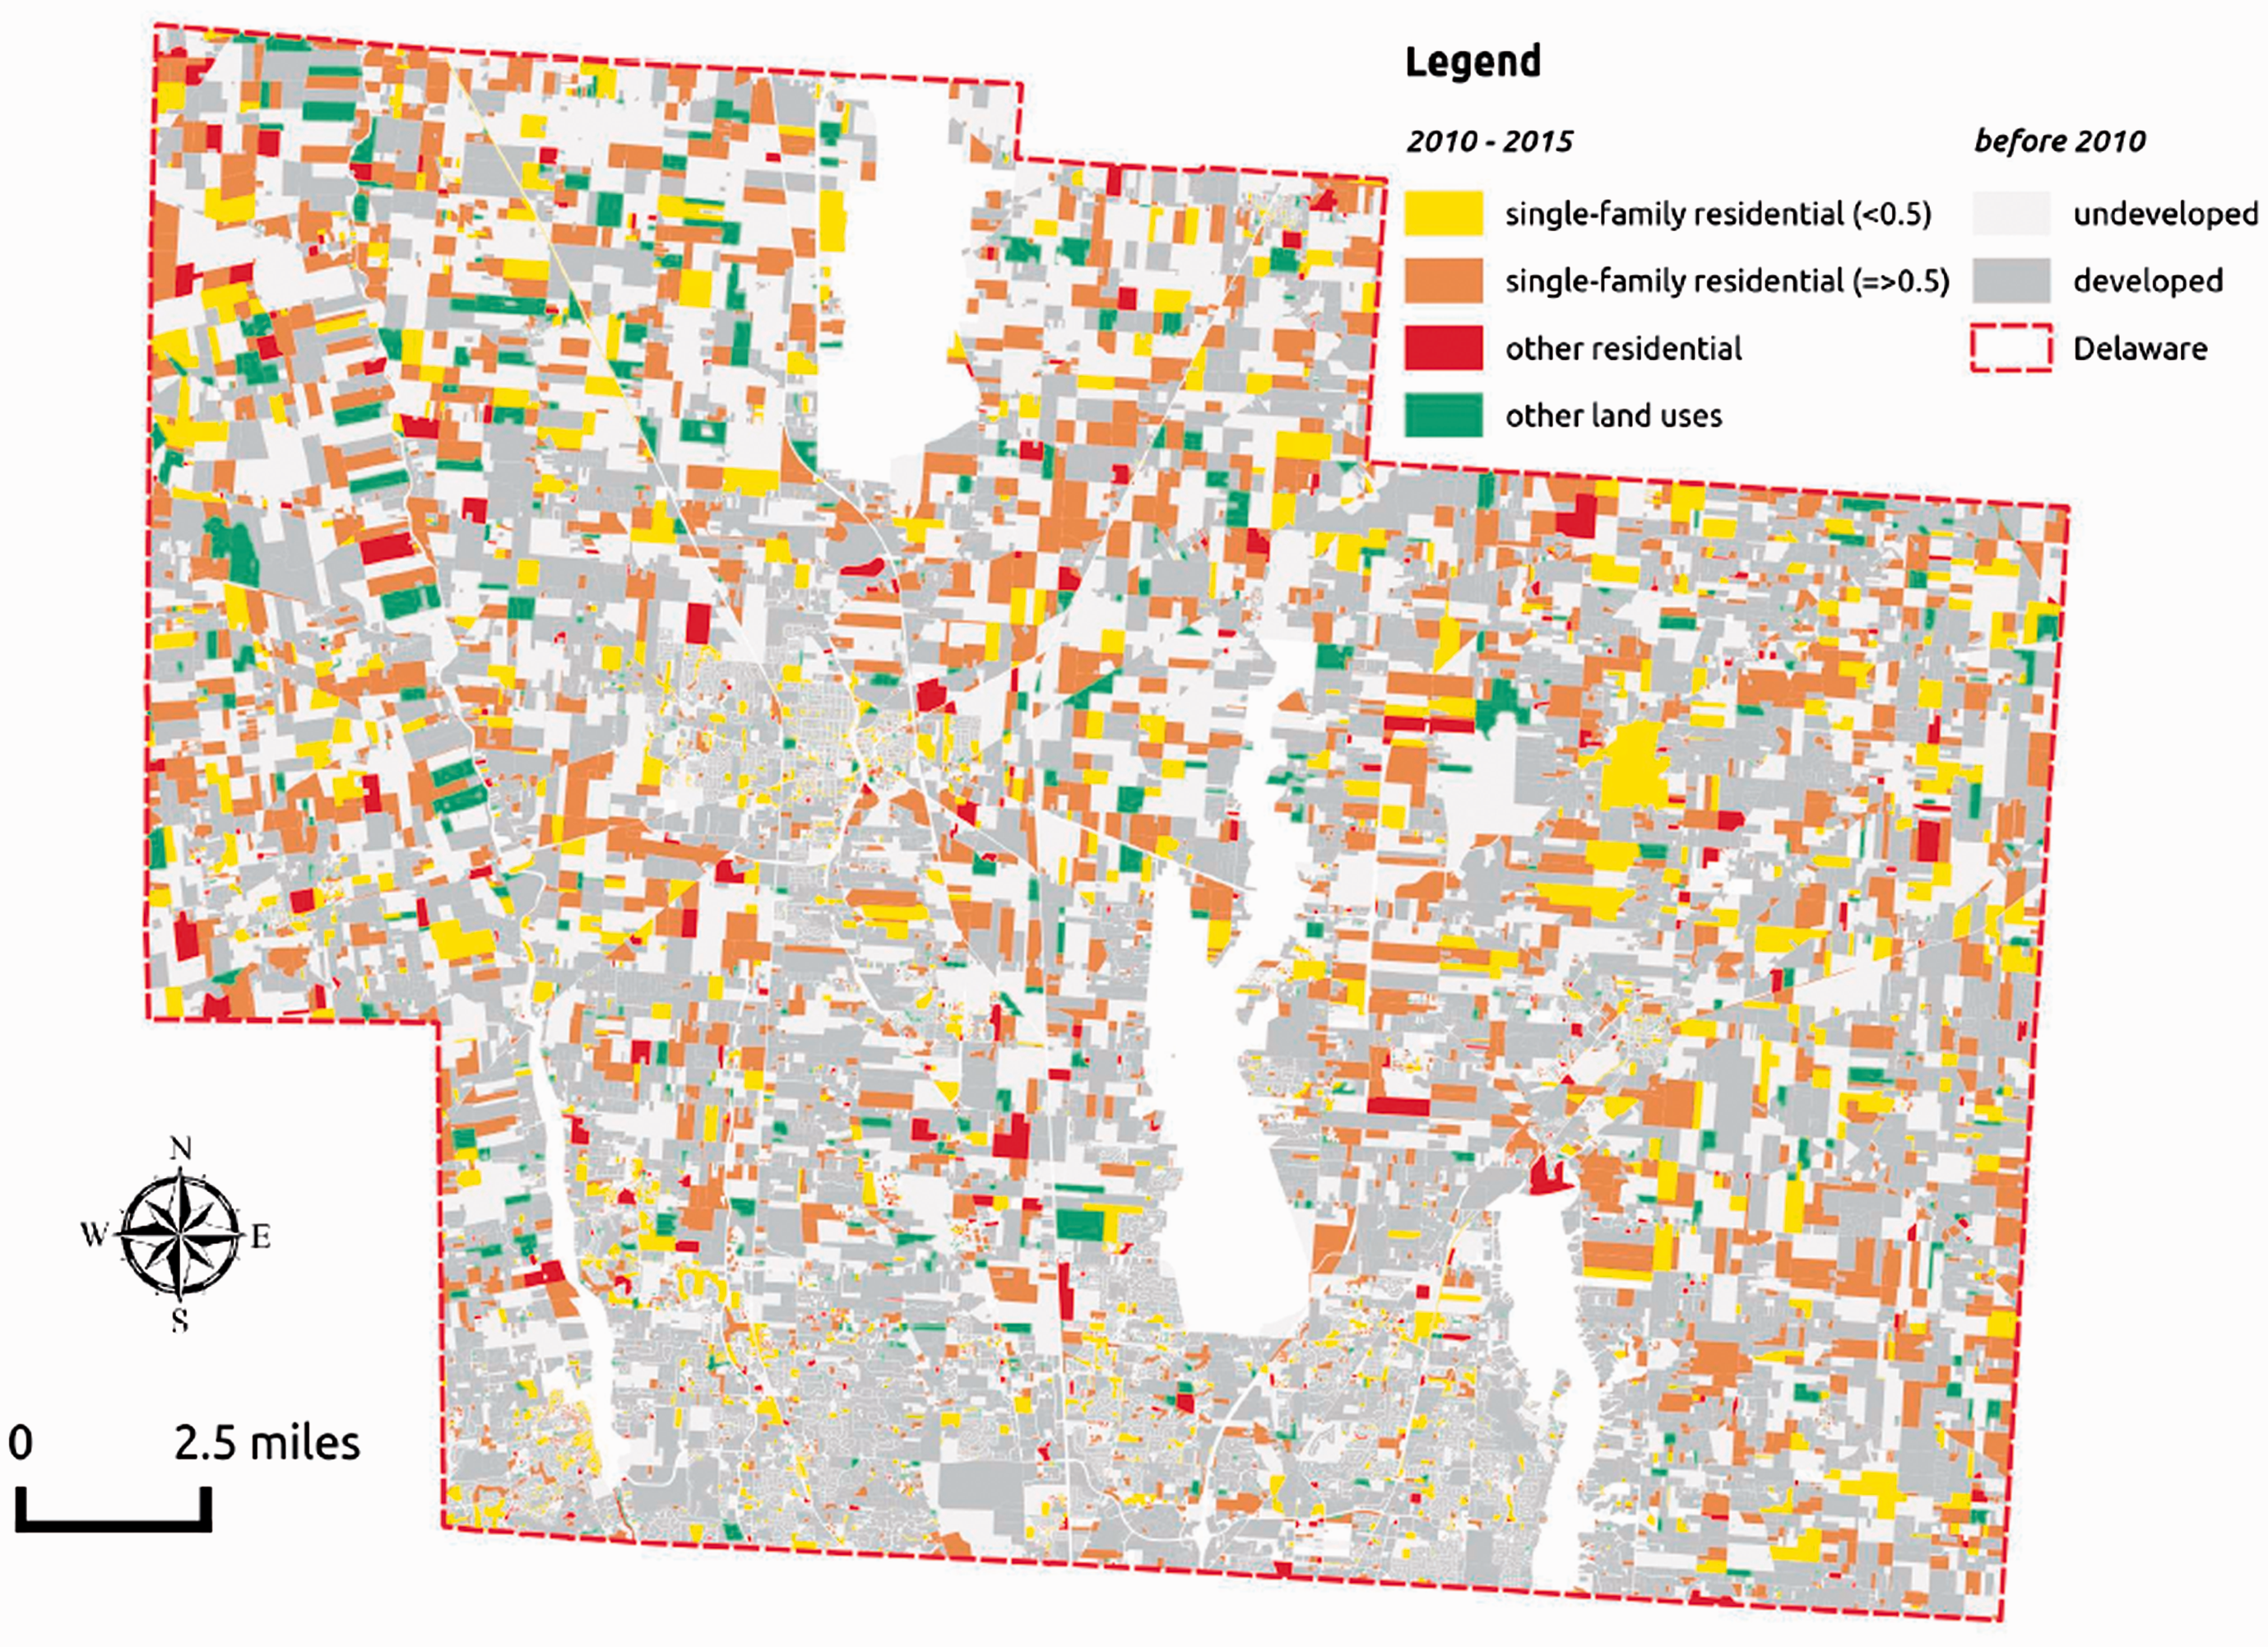
Conclusions
This paper has proposed a new and computationally feasible methodology, STARM, for large-scale land-use change models at the parcel level, while accounting for spatial and temporal dynamics explicitly. Standard spatial econometric modeling limits the number of usable observations, due to the computational burden of neighborhood matrix inversion for parameter estimation. However, STARM estimates parameters by using numerical methods that do not require inverting the neighborhood matrix. The proposed numerical procedure requires the collection of a large number of Monte Carlo samples and converges slowly. Model complexity is reduced by making specific spatial neighborhood and temporal Markov Chain assumptions. The case study application provides numerical evidence of the modeling methodology’s ability to successfully process a very large and spatially heterogeneous dataset (72,000+ parcels) and to account for spatial and temporal dependencies.
Model estimation results are consistent with earlier research. The spatial and spatial-temporal autoregressive coefficients are positive for all land-use categories, indicating that: (1) the probability of parcel status change to a given land-use category increases with neighboring parcel developments in the same category; (2) recent (lag-1) parcel development in a land-use category in the neighborhood attracts more contemporaneous parcel development in the same category. These results point to a strong clustering effects. Results related to distance and accessibility effects are similar to those of other studies.
There are several areas for further research. The method presented here generates accurate land-use change models when complete geocoded data are available. However, it may not perform as well when data are sparse or are characterized by missing information. Methodological modifications should be considered to deal with this potential problem. Also, the present method assumes that all land-use categories are equally possible. However, in reality more complex rules may apply, and nested logistic models, controlling for spatial and temporal dependencies, might be considered to test for more complex transition rules. Finally, another potential improvement in the modeling approach is related to the assumption of parcels with fixed shapes and boundaries over time. Land partitioning and consolidation also play an important role in land dynamics. Land development and land partitioning/consolidation can be viewed as closely linked decisions. However, in order to expand the STARM framework to incorporate land partitioning/consolidation, well-documented historical data would be required. These were not available in the case of Delaware County. Alternative approaches could be considered, such as the cellular automata simulation model combined with an automated land partitioning algorithm proposed by Yao et al. (2017).
Supplemental Material
Supplemental material for Spatio-temporal multinomial autologistic modeling of land-use change: A parcel-level approach
Supplemental material for Spatio-temporal multinomial autologistic modeling of land-use change: A parcel-level approach by Emre Tepe and Jean-Michel Guldmann in Environment and Planning B: Urban Analytics and City Science
Supplemental Material
Supplementary Figures - Supplemental material for Spatio-temporal multinomial autologistic modeling of land-use change: A parcel-level approach
Supplemental material, Supplementary Figures for Spatio-temporal multinomial autologistic modeling of land-use change: A parcel-level approach by Emre Tepe and Jean-Michel Guldmann in Environment and Planning B: Urban Analytics and City Science
Footnotes
Acknowledgements
The authors would like to thank the Ohio Supercomputer Center for grant PAS1156-1 to carry out the necessary computations, Shoreh Elhami for providing critical parcel data, and two anonymous reviewers for insightful comments that led to substantial improvements over the earlier version of this paper.
Declaration of conflicting interests
The author(s) declared no potential conflicts of interest with respect to the research, authorship, and/or publication of this article.
Funding
The author(s) received no financial support for the research, authorship, and/or publication of this article.
Supplementary Material
Supplementary material for this article is available online.
References
Supplementary Material
Please find the following supplemental material available below.
For Open Access articles published under a Creative Commons License, all supplemental material carries the same license as the article it is associated with.
For non-Open Access articles published, all supplemental material carries a non-exclusive license, and permission requests for re-use of supplemental material or any part of supplemental material shall be sent directly to the copyright owner as specified in the copyright notice associated with the article.