
Abstract
The interaction between environmental noise and the built environment is an often-neglected area in the practice of urban planning and design. Most quantitative research is limited to single value loudness metrics and ignores the more complex spatial nuances of the noisescape. Qualitative soundscape research, on the other hand, is difficult to generalize to the urban scale. We report on an exploratory noise sensing project in Los Angeles, CA that investigates both qualitative and quantitative aspects of the noisescape. Using an experimental array of noise sensors mounted on city street lights, we collected preliminary data that demonstrate the promising and revealing nature of spatially and temporally granular urban sound data. By analyzing sounds in various frequency bands at different resolutions, we investigate how aspects of urban design such as landscaping, material choice, and building typologies impact the sonic environment. Our results reveal the spatio-temporal structure of low-frequency noise in traffic-exposed areas; a phenomenon not captured by traditional A-weighted decibel metrics. Based on these results, we present a model predicting noise based on historic traffic data. These results provide insights for future methods that can be applied to long-term policymaking and planning decisions.
Introduction
In urban planning and design, the sensory aspects of the environment such as sound and light are often merely an afterthought. The ephemeral nature of these phenomena can be challenging to control and consider in the design process. Planners and policy makers treat the environmental soundscape mostly as a source of unwanted noise exposure, and to a far lesser extent, as a sensory modality that helps people to orient themselves in the environment, serves as a source of aesthetic experience, and provides a sense of place. The first aspect is recognized as a public health concern and in most places regulated to some extent. The second aspect is equally important for public wellbeing, but is considered a design concern that is not often addressed. The lack of attention can be attributed to the difficulty of measuring and assessing the soundscape in its spatial and temporal complexity and the lack of a nuanced spatial representation of the auditory environment. To account for the complex interactions between the soundscape, human activity, and the built environment requires training and experience; most professionals are not equipped to account for the physical, physiological, psychological, and cultural aspects of the auditory domain.
We believe that a sensor network approach to ambient sound sensing can be useful to address both of these challenges. A dense network of identical calibrated measuring devices that capture a broad range of parameters facilitates the comparison of environmental sound across space and time. If the measured values are fine-grained enough to capture local specificities such as the interaction of sound with building facades or moving sound sources, such an installation would also serve as a tool for planners to study the properties of sound from a design perspective. In this paper, we discuss the results of a prototypical Internet of Things project, a noise sensor network installed on LED street lights in the City of Los Angeles (LA) from August 2016 through January 2017, and discuss its implications for planners, urban designers, and architects. Instead of single point measurements, the nodes within the sensing array are close enough to capture overlapping auditory regions, allowing the study of the spatial structure of the soundscape.
Noise as a public health concern and a source of environmental information
Environmental noise, described by the US Clean Air Act of 1963 as “unwanted or disturbing sound” (US Congress, 1963) is a serious concern for public health. Among the scientific community as well as the public, there is a broad consensus that noise can be both annoying and unhealthy. Epidemiological studies have shown that populations exposed to night-time aircraft and road traffic noise (>65 dB) tend to suffer from elevated blood pressure (Halonen et al., 2015; Jarup et al., 2008; Recio et al., 2016; van Kempen et al., 2002). Chronic noise exposure also increases psychological stress, is detrimental to sleep quality, learning ability, and general health, and is associated with higher morbidity (Baliatsas et al., 2016a; Hall et al., 2016; Hume et al., 2012; Klatte et al., 2013; Stansfeld and Shipley, 2015). Beyond these general effects, parts of the population, including children, the elderly, and sufferers of a condition described as hyperacusis, are especially sensitive to environmental noise (Baguley and McFerran, 2011; Basner et al., 2014). Furthermore, noise exposure often coincides with other forms of pollution and exacerbates environmental stress factors and conditions such as asthma and other respiratory diseases, which affect populations living along busy traffic corridors (Franklin and Fruin, 2017).
The most widely used measure for environmental noise power is the A-weighted decibel metric, suggesting a sustained level of 65 dB(A) as the threshold beyond which chronic health problems become noticeable. However, there are indications that this single measure is an insufficient descriptor of the many ways ambient noise affects humans and non-humans. Some dynamic phenomena are more disruptive than others. Low-frequency noise comprised of frequencies below 200 Hz is prevalent in urban space, caused by the powerful engines found in ventilation systems and machinery, vehicles, and aircraft. Several studies have found this type of noise to be especially harmful and disruptive (Baliatsas et al., 2016b; Leventhall, 2004; Roberts, 2010). However, most regulatory frameworks do not consider this noise component, since the A-weighted metric used in these frameworks does not adequately represent it.
The dynamic qualities and frequency components of noise are especially crucial since sound is a crucial medium of information for most humans and animals. Human speech and animal communication rely on particular frequency bands, just as the auditory environment itself provides many cues important for spatial perception and orientation. In the case of human communication, consonants are located above 4 kHz in the frequency spectrum. High-frequency noise will therefore impact language intelligibility. By masking essential frequencies and drowning relevant cues, environmental noise can disrupt communication and make urban space acoustically opaque and illegible. Since a single sound source can degrade the auditory quality of space for everyone else, the sonic environment is, therefore, a commons–a scarce, rivalrous resource that requires a system of governance (Odland and Auinger, 2009).
The soundscape, a term introduced by urban designer Michael Southworth and popularized by Canadian composer Murray Schafer, describes the immersive quality of the acoustic environment in its full complexity (Schafer, 1977; Southworth, 1969). The spatial qualities of urban soundscapes are still poorly understood and are difficult to model. Sound interacts with the built environment, bounces off flat facade surfaces, gets absorbed and diffused by vegetation, masked by fountains and other sources, and is shaped by the spatial rhythms of buildings and streets (Blesser and Salter, 2009; LaBelle, 2010). It makes a big difference if a street is bounded by two tall, flat, and parallel facades on each side, if the facades have instead many elements such as balconies that diffuse the sonic reflections, or if one side of the street is unbuilt (Augoyard and Torgue, 2006).
All of these phenomena have implications for urban designers but are difficult to operationalize for their every practice. Most soundscape research used a qualitative approach, which requires training and skill in active listening—a skill still rare in the profession. However, humans are very skilled at recognizing auditory cues to locate and orient themselves in their surroundings, even if they are not aware of this skill or cannot articulate its process. Even untrained individuals can distinguish surface materials and are able to tell whether a door is closed or open in a room with sufficiently low background noise (Blesser and Salter, 2009).
Noise regulation in the US and EU and its problem of measurement
To describe current noise regulations in the US as insufficient would be a euphemism. Environmental noise was first recognized as a form of pollution in title IV of the Clean Air Act of 1963, which established the Office of Noise Abatement and Control (ONAC) to study the public health effects of noise, and recommend appropriate policies. The Noise Control Act of 1972 authorized ONAC to set noise abatement standards and enforce them (US Congress, 1972). However, in 1981, the office was defunded by the Reagan administration, shifting the responsibility to states and municipalities. As a result, the US has currently no coordinated federal noise policy, comprehensive infrastructures for data collection, and noise regulations.
In Europe, the European Environmental Agency promulgated the Directive on Environmental Noise (2002/49/EC), which ordered states and larger cities to map the level of noise exposure and make this information available in a public database. Further, the states are ordered to develop noise management action plans for cities and transportation infrastructure.
While the new directive has spurred efforts to measure noisescapes at the urban and national scale, these efforts are hampered by a lack of tools to measure noise exposure adequately. Most noise maps are simulations extrapolated from a small number of point measurements, and the results obtained from different software packages can vary considerably (Murphy and King 2014, 96). Although recent models take building geometry and surface materials into account, comprehensive 3d building data is not available for most cities. In terms of measurements, not only the spatial resolution but also the placement and altitude of a sensor can make a big difference. To enable a differentiated understanding of urban auditory phenomena, a spatially and temporally dense array of measurements is necessary that go beyond single dB(A) values and capture a range of frequencies and dynamic aspects.
Effective urban design guidelines and policies require a nuanced understanding of the spatio-temporal nature and quality of the urban soundscape. Until now, such fine-grained measurements of ambient noise were not available, as noise measurements conducted by cities are too sparse to allow examining how the built environment and human activity influence the soundscape. Crowd-sourced sensing using smartphone microphones promises to increase the resolution of measurements but is limited by unsystematic data collection and uncalibrated devices. Furthermore, crowd-sourced noise sensing rarely manages to engage the number of participants necessary to convey a coherent picture of the soundscape.
The LA noisescape experiment
The approach discussed here involves a dense array of networked noise sensors mounted on streetlight poles at the height of the light fixture or luminaire. This height was selected to avoid vandalism and simplify maintenance and mounting. The prototypical deployment conducted by Philips Lighting in collaboration with the LA Bureau of Street Lighting involved around 30 sensors covering a small area of about 50 acres (0.2 km2) in East Hollywood. The selected location is characterized by mixed land use including industrial, commercial, and housing, a school and a home for the elderly. It contains side streets covered by a tree canopy as well as busy streets including Santa Monica Boulevard and North Virgil Avenue.
The sensors were located in proximity to each other and configured to report at regular intervals, yielding a high spatial and temporal resolution. The sensors were mounted at heights of 25–30 ft or about 7.5–9 m. Each sensor measured nine different parameters, including the minimum, maximum, and continuous equivalent (Leq) decibel values, both raw and A-weighted, using a sample window of 15 seconds. Besides noise power, the sensors measured three frequency components every 5 seconds: low frequencies ranging from 20 to 400 Hz, voice-range frequencies between 400 and 8000 Hz, and high frequencies of 8000 Hz and above. The aggregate decibel values were encoded as floating-point values, the frequency components as 8 bit integers (yielding a resolution of 256 steps). The number of captured parameters, its timing intervals, and data formats were determined by the available bandwidth of the GSM
1
modems used to transmit the data in real time. Figure 1 provides an overview of the project deployment area.
Noise contours of the mid-frequencies, at 1 p.m. on 1 September 2016. The data show higher values for the streets Santa Monica and North Virgil.
Related work
In the wake of the smart city discourse, sensor networks for collecting environmental data such as air quality, temperature, noise, or light levels are increasingly used in the urban environment. Starting in 2009, Smart Santander, a project funded by the European Union, deployed around 750 sensor nodes, including 50 noise sensors distributed across the Spanish city of Santander (Sanchez et al., 2014). The sensor readings 2 are accessible in real time 3 and capture a single, A-weighted dB value. Several sensing projects were specifically initiated to monitor noise and create or update municipal noise maps. Noise sensors collecting a continuous, A-weighted dB value was deployed in the Spanish cities of Girona (a total of five sensors) and Alicante (15 sensors). 4 In addition to noise indicators, some platforms collect and transmit compressed audio (Pham and Cousin, 2013) or conduct a signal analysis on a location to identify events such as gunshots (Showen et al., 2009).
Participatory sensing represents an alternative measurement strategy, which relies on crowd-sourced measurements conducted by citizen volunteers using dedicated smartphone apps (Maisonneuve et al., 2009; Walker, 2015). Noise modeling also relies on indirect measurements, including citizen complaints submitted via 311 systems and data scraped from social media (Wang et al., 2014; Zheng et al., 2014). Information acquired through participatory sensing and citizen requests can potentially produce large data volumes; 5 a review of crowd-sourced noise measurement apps reveals however only a few active users who produce spatially and temporally sparse measurements. Additional issues are inherent biases due to self-selected reporting and data quality issues stemming from the use of uncalibrated devices and measurement protocols. Hybrid forms between infrastructural and participatory sensing approaches exist, as in the example of Chicago’s Array of Things, where sensor nodes are installed in by the city, but the protocols, code, and data collected by these devices are made directly available to the citizens. 6
Most sensor-network based projects are concerned with noise measurement, usually collecting only a single A-weighted noise value. Exceptions are the Citygram project at New York University, which tries to capture more detailed qualities of the soundscape, and the Sound Score project, which combines a survey instrument with participatory sensing covering different frequency bands (Park et al., 2012; Walker, 2015).
Our project differs from other initiatives in several aspects. First, the noise sensors used in this project measure nine indicators, including minimum, average, and maximum decibel, both raw and A-weighted, as well as three different frequency components. Second, the use of lamp posts as a sensing infrastructure offers a higher spatial density compared to other projects, allowing the comparison of local conditions. Sonic events are registered at several adjacent sensors, providing the opportunity to study the diffusion of sound and potentially their interaction with the built environment. Third, our sensors are static and calibrated, allowing comparison across space and time. The use of light poles, however, also comes with a considerable limitation: the height at which the sensors are placed is several meters above the street, and therefore does not accurately capture the noisescape a pedestrian would encounter.
Research design
Our exploratory analysis focused on the potential to study the spatial structure of the soundscape and sought to answer several of questions. First, is the sensor set-up in terms of configuration of the noise array – its measured parameters and its spatial, temporal resolution – sufficient to capture the interaction between soundscape and the urban environment? For example, were street sections with closed building facades noisier than those with more open space? Did foliage and canopy have a noticeable effect? Second, was the sensor setup sufficient for identifying the auditory signatures of moving sound sources, for example, follow the trajectory of an emergency vehicle via its siren? Our research was also interested in gaining insight into different qualities of noise. Would, for example, the sound profiles of busy streets significantly differ from those on quieter streets? Finally, we were also interested in comparing and matching the collected noise data with other urban data sources of the same area, including official traffic counts, citizen complaints, and historical weather data.
To investigate these questions, we used a mixed methods approach. To complement the quantitative analysis of the sensor data, we conducted qualitative observational studies in the deployment area, paying close attention to events in public space and the features of the urban environment. We also verified the accuracy of the sensors through manual noise recording on location.
Exploratory analysis of the sensor data
The basis of the investigation were measurements collected from 27 nodes over four months, between September and December 2016. We excluded six nodes from the analysis due to data artifacts and mis-calibration issues. We also limited our analysis to the period from 26 August to 6 October, since this was the only period during which all sensors were consistently active.
In an initial exploratory analysis, a clear spatial pattern emerges. Santa Monica Boulevard and North Virgil Avenue are consistently noisier than all other streets. The contour plot of interpolated loudness values reveals the intersection of the two streets as a location of peak noise intensity (Figure 1). This spatial pattern is stable across all hours of the day. The sensor data show an average noise difference between either of the two streets and all other streets at about 10 dB(A), sometimes exceeding 20 dB(A) during peak hours. While Santa Monica and North Virgil are the loudest streets in absolute terms, they have the lowest variance in loudness (Figure 1s in online supplement).
Averaged across all sensors, the difference between weekdays and weekends is less pronounced than one might expect. Aggregated by street and hour of day, differences appear depending on locations and weekdays. The afternoon peaks remain relatively stable throughout the week, while the morning and evening levels differ by day and street. The hourly noise profiles aggregated by street show a common overall shape for weekdays: noise picks up around 5 a.m., reaches a first peak at around 7 a.m., followed by slight decline and then a higher peak at around 3 p.m. Noise finally fades off in the evening after 8 p.m., falling back to its lowest value at around 3 a.m. (Figure 2).
Comparison of the loudness and frequency components of a single sensor on Santa Monica over one day. Note the bump in the low frequencies (dark red line) during the afternoon, which remains hidden in the average loudness (L eq dB(A)—middle blue line), which is the standard measure on most systems.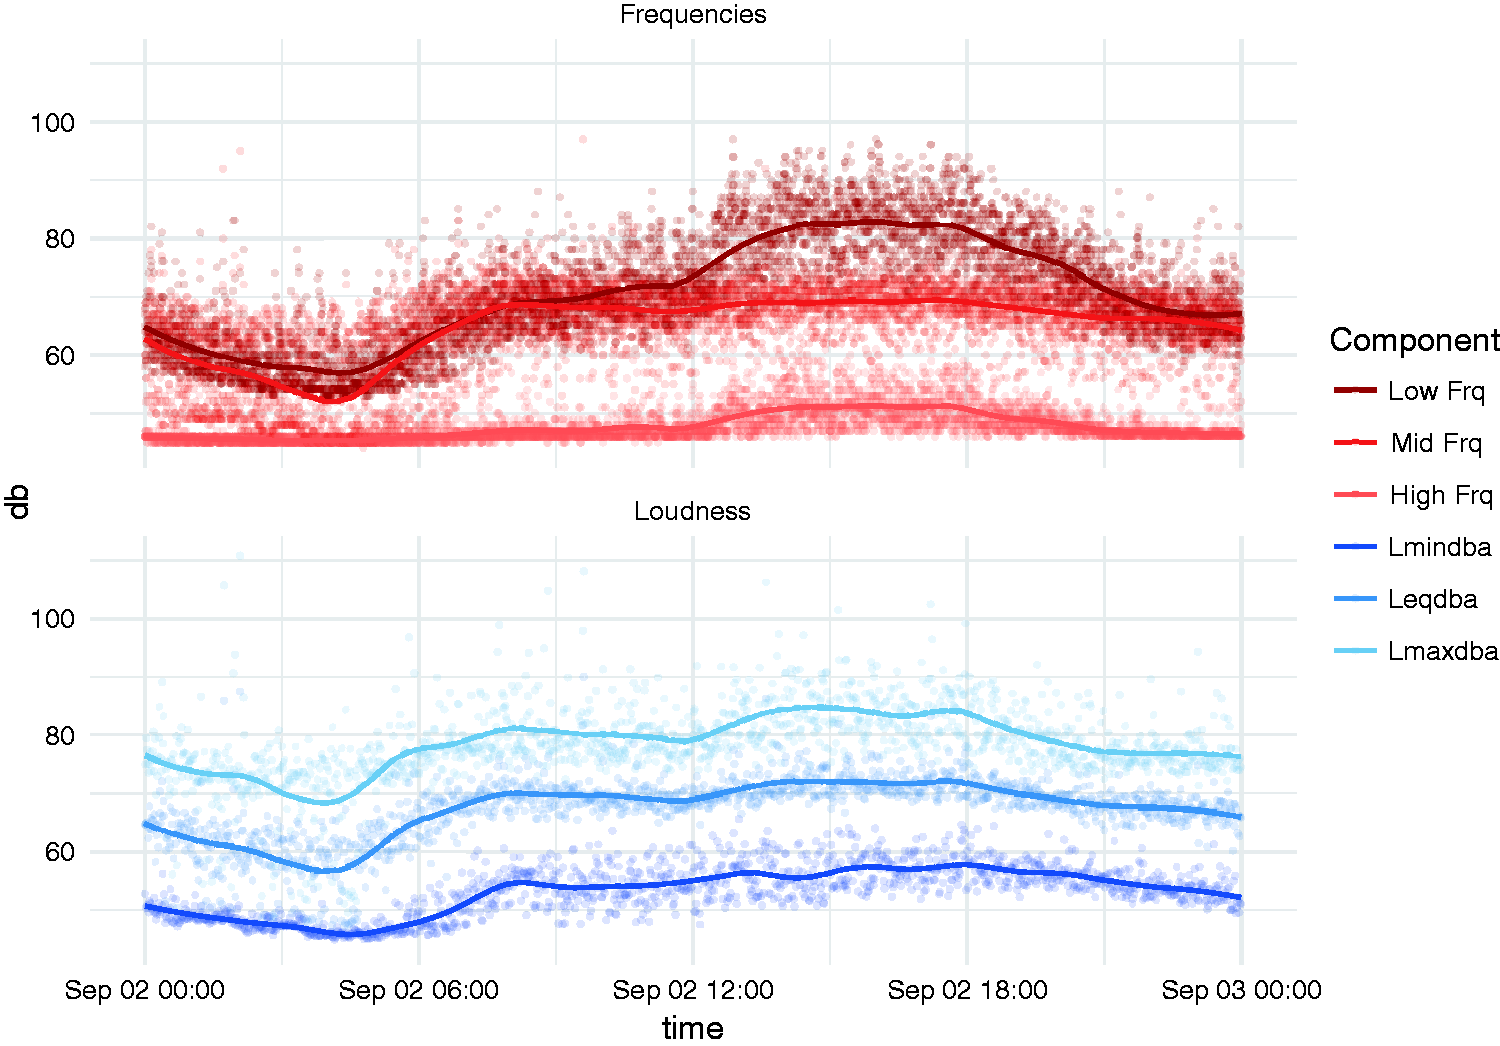
The frequency composition reveals a distinct temporal pattern not visible in the loudness values. Mid-range frequencies maintain a relatively stable level of around 70 dB throughout the day between 7 a.m. and 10 p.m. The low frequencies, otherwise closely following the levels of the mid frequencies, seem to increase significantly during afternoon, peaking at around 5 p.m. We hypothesize that this low-frequency afternoon “bump” results from low-frequency noise emissions of the large diesel engines of trucks and busses, which travel more frequently on Santa Monica and North Virgil (Figure 3). These values have to be placed in perspective, considering that the sensors are mounted at heights of 7.5–9 m above the road surface. Since loudness diminishes with distance from the source, measured values are expected to be lower than on street level.
Hourly profiles by street and measured component (minimum, maximum, average noise in dB(A) and low, mid- and high frequencies). Note that all profiles exhibit the low-frequency afternoon peak described earlier.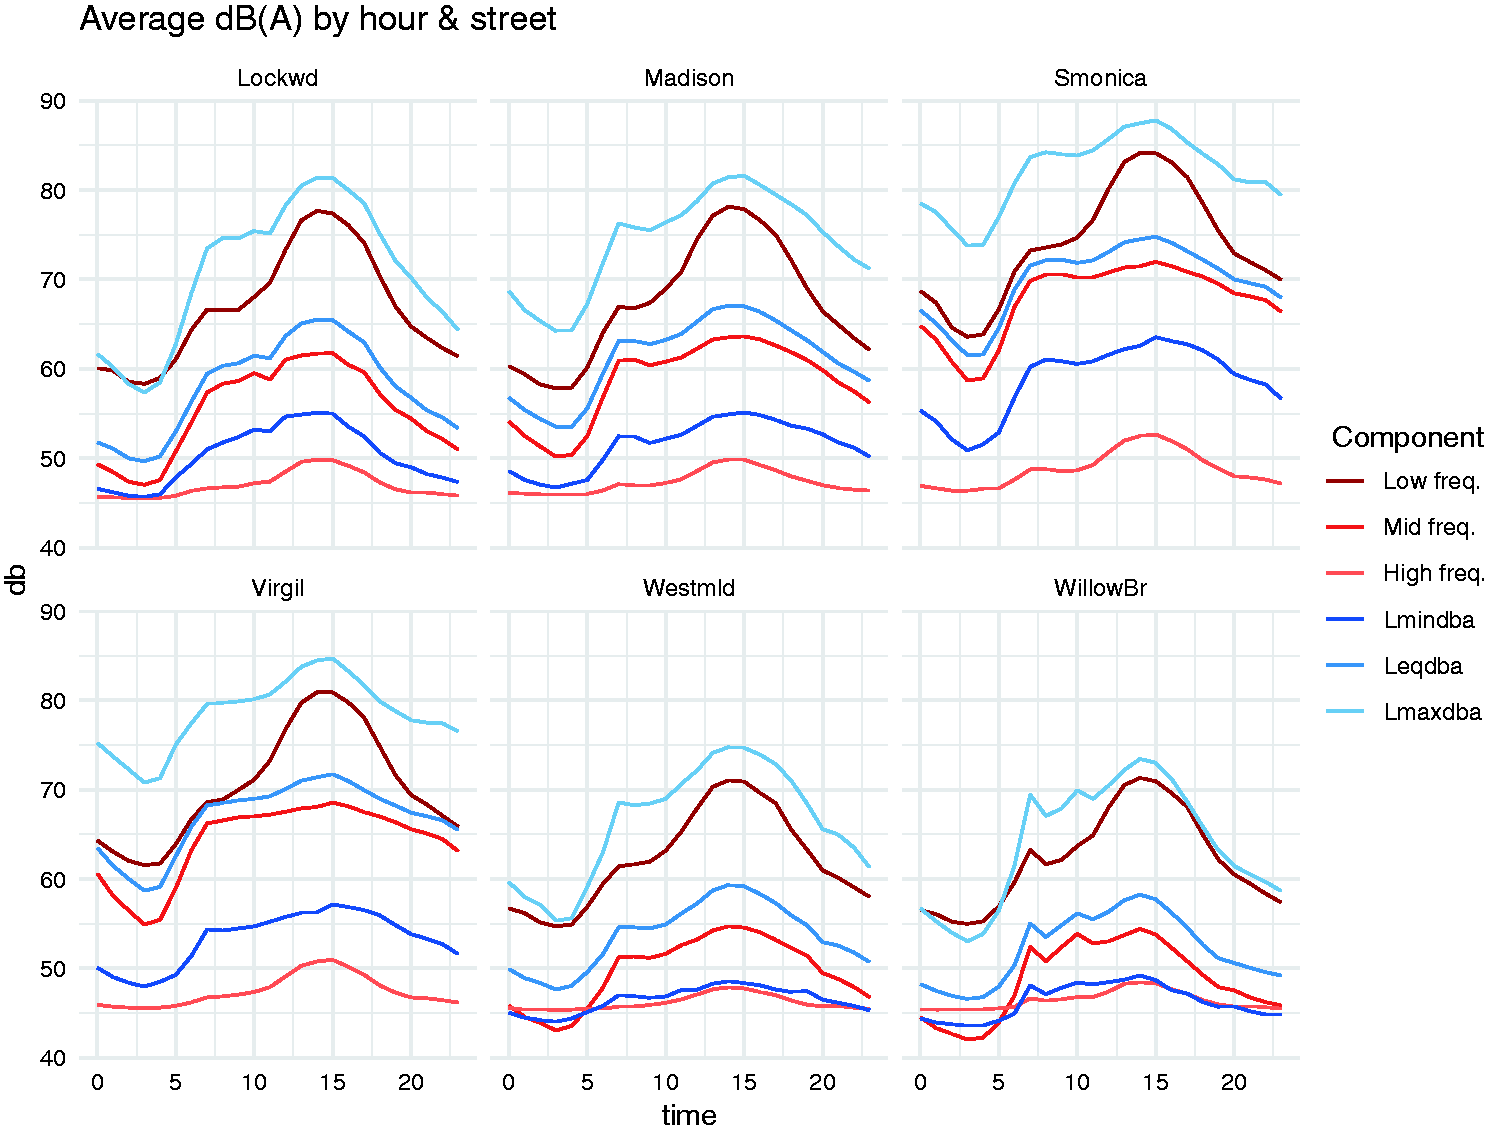
Modeling noise intensity based on historic traffic and weather data
Auditory space is a dynamic phenomenon that is shaped by numerous factors. These include not only the activities such as traffic or the physical shape of the environment, but also variables such as temperature, rain, and wind.
Historic traffic count dates and locations.

Despite these limitations, the hourly profiles of historic traffic counts and measured loudness values are remarkably similar. Both show the same pattern of peaks and slopes, indicating that the temporal structure of traffic has remained relatively stable over the years (Figure 4). The number of cars counted correlates highly with the loudness values measured at the respective streets on a weekday (r = 0.9 for both Santa Monica and North Virgil). The scatter-plot indicates an exponential relationship between counted cars and noise dB(A), which is to be expected due to the logarithmic nature of the dB metric. A logarithmic transformation of the traffic count reveals a robust linear relationship with the measured loudness values, especially for voice frequencies and dB(A) values, to a lesser degree for raw dB values. However, above values around 72 dB(A) or 1300 cars per hour, the linear relationship becomes weaker. A comparison of the temporal profiles reveals that the afternoon rush hour peak appears to have shifted over the years, registering about 2 hours earlier in the noise measurements than in the historic traffic count data (Figure 5).
Historic traffic counts by primary street and hour of day (LADOT, 2017). Comparison of measured loudness values (average dB(A)) and historic traffic counts on Santa Monica and North Virgil streets. Notice the shift of the afternoon peak on both locations compared to the historical counts.


Regression results.
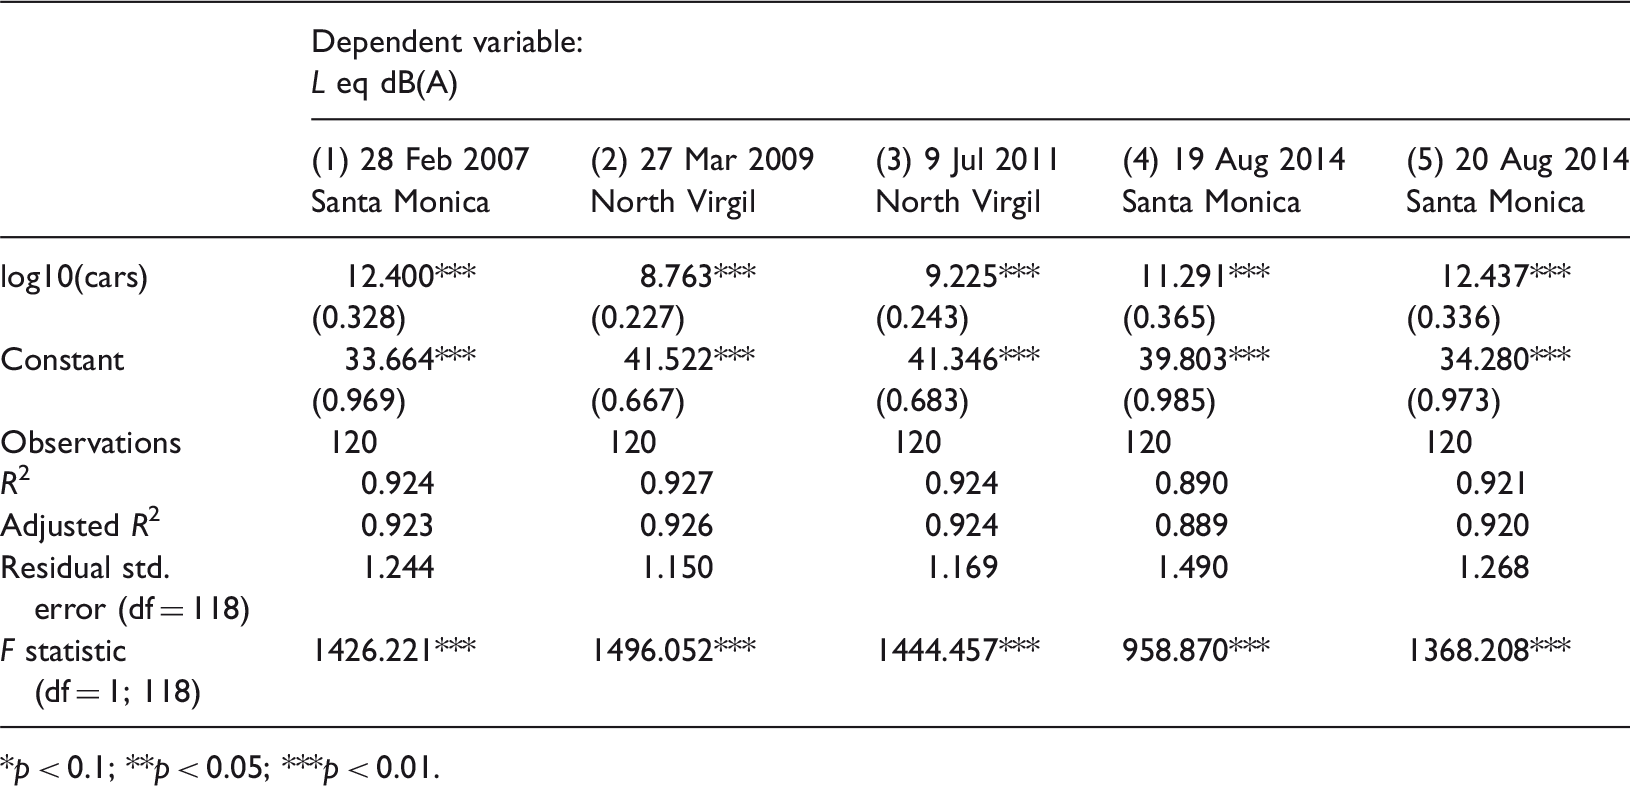
p < 0.1; **p < 0.05; ***p < 0.01.
Especially, the coefficients for the North Virgil models show similarities to the noise model by the Wright Air Development Center (WADC) (2), one of the earliest estimation models for traffic noise (WADC, 1952). The most notable difference is the higher constant value in the historic model, which corresponds to the assumed background noise level

Besides traffic, weather was another factor potentially influencing the ambient noisescape of the environment. Unfortunately for the analysis, the weather was very consistent throughout the pilot phase—rain and strong winds were almost entirely absent. Higher wind speeds registered as higher noise levels in the sensors, but with significant differences depending on exposure and location of the sensor. On average, an increase in wind speed of 1 mph registers as an 0.8 dB(A) increase in measured loudness.
The local environment and the soundscape
Each sensor shows a distinct profile concerning magnitude and frequency distribution over time. These differences are caused by different local conditions that include many factors, including intensity and composition of traffic on nearby streets, the configuration, shapes and materials of the surrounding architecture and landscape, the effect of trees and vegetation, and activities taking place in proximity. To get a better sense of these local conditions, we conducted on-site field research while the sensors were operational.
Events and activities
The pilot was installed in a mixed-use area, including a considerable number of apartment buildings and single-family homes, retail, and industrial facilities. Furthermore, the area contains two major streets and moderate traffic exposure. The capacity to measure citizens’ perception of noise exposure is limited since the 311-citizen complaint system of LA does not offer a category for noise. 8 A review of the issues discussed at the East-Hollywood Neighborhood Council in the project area reveals that traffic noise raised less concern than the noise from human activity, notably the activities of street vendors and the noisy environment at swap meets. 9
Within the project area, Willow Brook street is home to an elementary school, and the noise of children coming to school in the morning is clearly visible in the noise data captured by proximate sensors. Another event that left its signature in the sensor recordings was the municipal garbage collection on Westmoreland street that took place during the fieldwork. Its characteristic signature on Thursday morning was also visible in the measurements collected during the following weeks.
Other signatures of environmental noise sources identified in the recorded data in combination with the on-site fieldwork included idling trucks and roadworks activities. Their step-like sonic signature was also a useful marker for investigating the propagation of noise across space as captured by adjacent lamp posts, with the noise intensity diminishing with increasing distance. It was also interesting to observe that different frequencies declined at different rates, with high frequencies falling quicker with distance from the noise source (Figure 6).
Noise signature of an idling truck diminishing over adjacent sensors (distances between sensors are not equal). Note how the high frequencies drop off quicker than the lower frequencies (the second sensor from the left did not report frequency values and is missing from the upper row).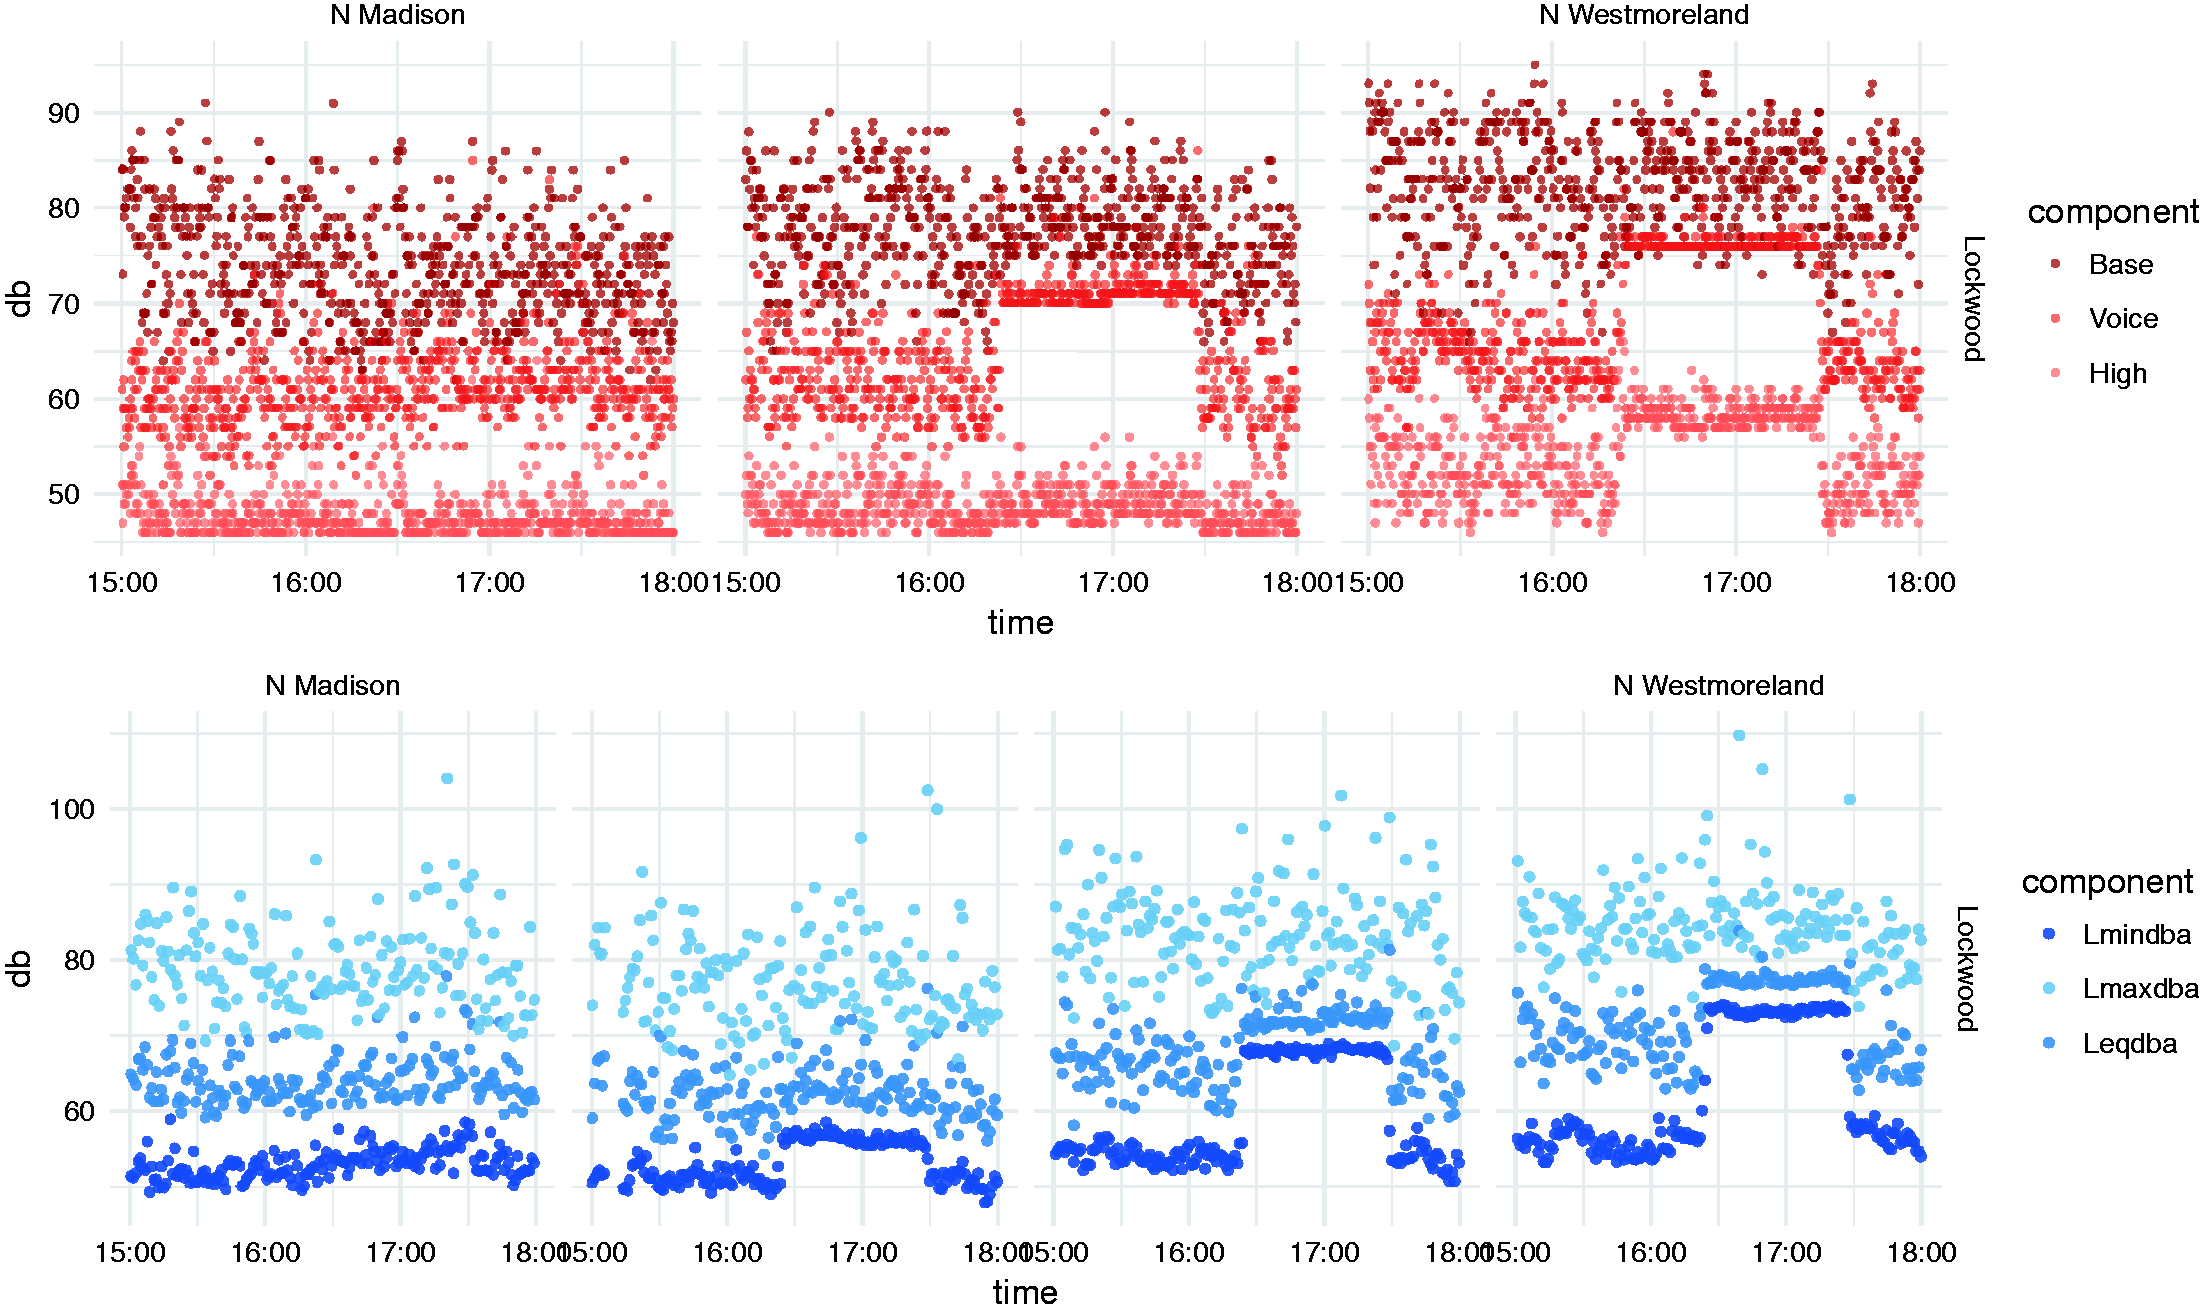
We investigated the capacity of the sensor array to detect moving sound sources across adjacent sensors, but unfortunately, the 5 and 15 second intervals were too long to capture fast sources such as moving emergency vehicles. We managed, however, to identify the noise peaks generated by waste collection. Once we matched the patterns in the data with the collection time recorded during the observational study, we were able to identify the same pattern in the data of the following weeks.
Plants and trees
Plants can be effective noise barriers—the leaves diffuse high frequencies, while soil and roots dampen low frequencies. Literature reports a difference of 5 dB for a 10 m wide vegetation belt close to the road (Huddart, 1990; Peng et al., 2014). Within the scope of the exploratory study, the results obtained remain anecdotal. The trees in the study area do not shed their foliage during winter; therefore, their effect on noise propagation cannot be directly observed. We had to exclude one sensor located underneath a dense, street-covering canopy from our study due to calibration issues. An effect was observable at the locations on two other sensors on Westmoreland and Willow Brook, both covered by a tree canopy—the sensors reported lower noise values than neighboring sensors, but due to the differences in the local conditions between the two locations, we do not consider this result to be significant (Figure 6s in supplement).
Facades and architecture
Building facades reflect sound and therefore increase the perceived and measured loudness. Again, due to the small study area and the impossibility to control for all possible confounding factors, the results are anecdotal. On Westmoreland street, a sensor was located right in front of a tall, flat facade, while the adjacent sensor was freestanding on the opposite side of the road. The sensor in front of the facade produced on average 5 to 10 dB higher readings than the free-standing sensor, but more research is needed to overcome the limitations of the exploratory study.
Conclusion, design, and policy recommendations
The results of this exploratory study have several implications for noise policy, architecture, and urban design. First, the project demonstrates the importance of a more nuanced understanding of noise that distinguishes between noise qualities. The measurement of noise frequencies revealed a temporal structure: a peak of low frequencies in the afternoon, which is not captured by the dB(A) metric. This observation is important because low-frequency noise, typically generated by the powerful engines of trucks, aircraft, and ventilation systems, are experienced as especially disruptive and annoying. These results add to the evidence that the A-weighted loudness value alone is an inadequate metric for urban noise regulation and that a qualitative treatment of noise created by different vehicle types is beneficial. Beyond frequency composition, noise qualities also include temporal dynamics—the noise of cars differs from air conditioning units, trucks, or motorcycles. The sensor array captures the spatial, temporal, and frequency components that make an adequate investigation of noise qualities possible.
Second, the high spatial resolution of noise sensors attached to streetlights allows a more accurate investigation of the spatial aspects of the soundscape. The range of temporal noise profiles across space shows that the urban soundscape is rich and nuanced and that the local conditions, its building typology, vegetation, and activities are essential. The results are not always conclusive due to the spatial and temporal limitations of the study and show the need for future work. The results, however, indicate that the sensor array is able to capture the interactions between sound sources, architecture, and vegetation at the scale of the whole city.
The results have implications for the architecture and urban design disciplines, which are concerned with the visual appearance of streets and buildings, but less with their influence on the auditory experience. We attribute this imbalance to a lack of adequate tools and methods. Mitigating noise pollution requires designers to consider the aural qualities of different materials, surfaces, and geometries, and the sensor array provides a test bed for observing their auditory effects at the urban scale. Architectural projects could be evaluated based on another set of criteria beyond their visual qualities. As mentioned with lighting early on in this paper, it is the ephemeral qualities of an environment that often drive people’s subjective sense of comfort and ease. Sound data could add a valuable aspect to evaluating urban design—not to mention in cities undergoing rapid upheaval through new construction.
Among the potential unexpected outcomes might be the way these data could be appropriated by the private sector. Real estate developers, for example, often select qualitative differentiators to distinguish one neighborhood from another. As cities like Los Angeles aim to make as much data public as possible, it is important to consider the possible impacts on urban dynamics. The LA Open Data Policy 10 describes how the city imagines stimulating entrepreneurial activities with ready access to non-personally identifiable data. It is likely that continuous sound data would provide a powerful additional source of inspiration for the same target community. It may, however, also have unintended consequences such as increasing the rate of gentrification or driving up real estate prices. Data governance models for these types of data are currently actively discussed.
The comparison with traffic counts data reveals a surprising historical continuity of traffic patterns while highlighting its changes over time. Our statistical models are largely consistent with simplified traffic noise models and show that fine-grained noise data can be used to estimate traffic and vice versa. This stability of the observations across time also allows the use of noise data as a proxy for traffic counts if the sensor data are calibrated to the local environmental and urban conditions.
Methodologically, the pilot study demonstrates that quantitative sensor measurements can support qualitative inquiries into the geography of the urban soundscape and therefore offer a simple and scalable alternative to traditionally qualitative studies, which are time and cost intensive while limited in scope. A mixed methods approach combining observational studies is especially powerful for studying the sonic signatures of urban phenomena.
Finally, the collected data indicate a rich sonic landscape that underscores the need for a more holistic and continuous urban design practice beyond noise mitigation. Instead of considering noise a substance that can simply be disposed of, noise is considered a necessary consequence and reflection of human activity. Streets and regulations can be designed in a way to make cities sound better and make them more legible.
Related to this final insight, relying on continuous data has significant implications for master planning as well. Instead of taking a snapshot in time and then rolling out a plan over 10 years, some cities are taking a more iterative approach. Vienna, for example, used its Masterplan Licht (lighting masterplan) in a continuous way rather than as an absolute. In domains such as construction and infrastructure development, this approach also allows cities to apply the latest technologies rather than remain wedded to past specifications.
For urban researchers examining the visual aspects of the city, a wide array of tools is available ranging from remote sensing infrastructures to tools such as Google Street View and crowd-sourced data sources. Methods and infrastructures for studying the soundscape, on the other hand, are still underdeveloped. Current auditory tools and infrastructures are largely limited singular point measurements that do not represent spatial qualities or crowd-sourced data collection with its inherent biases and omissions. We have demonstrated that a dense array of noise sensors offers new opportunities towards a better understanding of the soundscape and the development of sonic design competencies for planners and architects.
Supplemental Material
Supplemental material for Los Angeles noise array—Planning and design lessons from a noise sensing network
Supplemental material for Los Angeles noise array—Planning and design lessons from a noise sensing network by Dietmar Offenhuber, Sam Auinger, Susanne Seitinger and Remco Muijs in Environment and Planning B: Urban Analytics and City Science
Footnotes
Declaration of conflicting interests
The author(s) declared no potential conflicts of interest with respect to the research, authorship, and/or publication of this article.
Funding
The author(s) received no financial support for the research, authorship, and/or publication of this article.
Supplemental material
Supplemental material for this article is available online.
Notes
References
Supplementary Material
Please find the following supplemental material available below.
For Open Access articles published under a Creative Commons License, all supplemental material carries the same license as the article it is associated with.
For non-Open Access articles published, all supplemental material carries a non-exclusive license, and permission requests for re-use of supplemental material or any part of supplemental material shall be sent directly to the copyright owner as specified in the copyright notice associated with the article.