
Abstract
The streets in the traditional residential areas of severe cold cities in China often have openings leading to enclosed courtyards. These openings connect the street to the courtyard space, which affects the physical environment of the residential streets. This paper uses field measurements and numerical simulation to study the wind–sound environment in the street, comparing and analysing the effects of the existence, size and form of openings on the wind–sound environment in the street. The results indicate that both the average wind velocity and sound pressure level have some degree of reduction around the opening, with the difference of wind velocity reaching 1.0 m/s and the difference in sound pressure level reaching 0.5–1.6 dB. Additionally, the T30 changes from 0.2 s to 0.4 s around the opening, while the average T30 in the street also varies. Increasing the width of the opening by 1 m increases the influential range of the opening on the sound environment by 0.5–4 m. In contrast, the width of the opening has little effect on the sound pressure level and the T30. Compared with an entrance of the same width, a gap intensifies the fluctuation of the local wind velocity and causes the average T30 to reduce by 0.3 s. The results of this paper lay a data foundation for further studies on the optimized design of the physical environment in enclosed residential areas.
Keywords
Introduction
As winter in severe cold cities is long and frigid, the most common form for the traditional residential area is the enclosed block. Taking Harbin as an example, the proportion of enclosed blocks is about 25% of the total residential areas, and the proportion of parallel blocks is about 16–20% of the total residential areas. A peripheral layout is adopted inside the enclosed blocks, causing the integrated buildings to have internal courtyard space of various sizes. These courtyards not only provide a site for residents’ daily activities, but also make communication and transport more convenient and enrich the variety of architecture space. In Harbin, a typical northern city in China, every integrated building has an opening leading to the internal courtyard. The number of openings for each building depends mainly on factors such as the building's size, as shown in Figure 1. Generally, these openings take the form of either entrances or gaps.
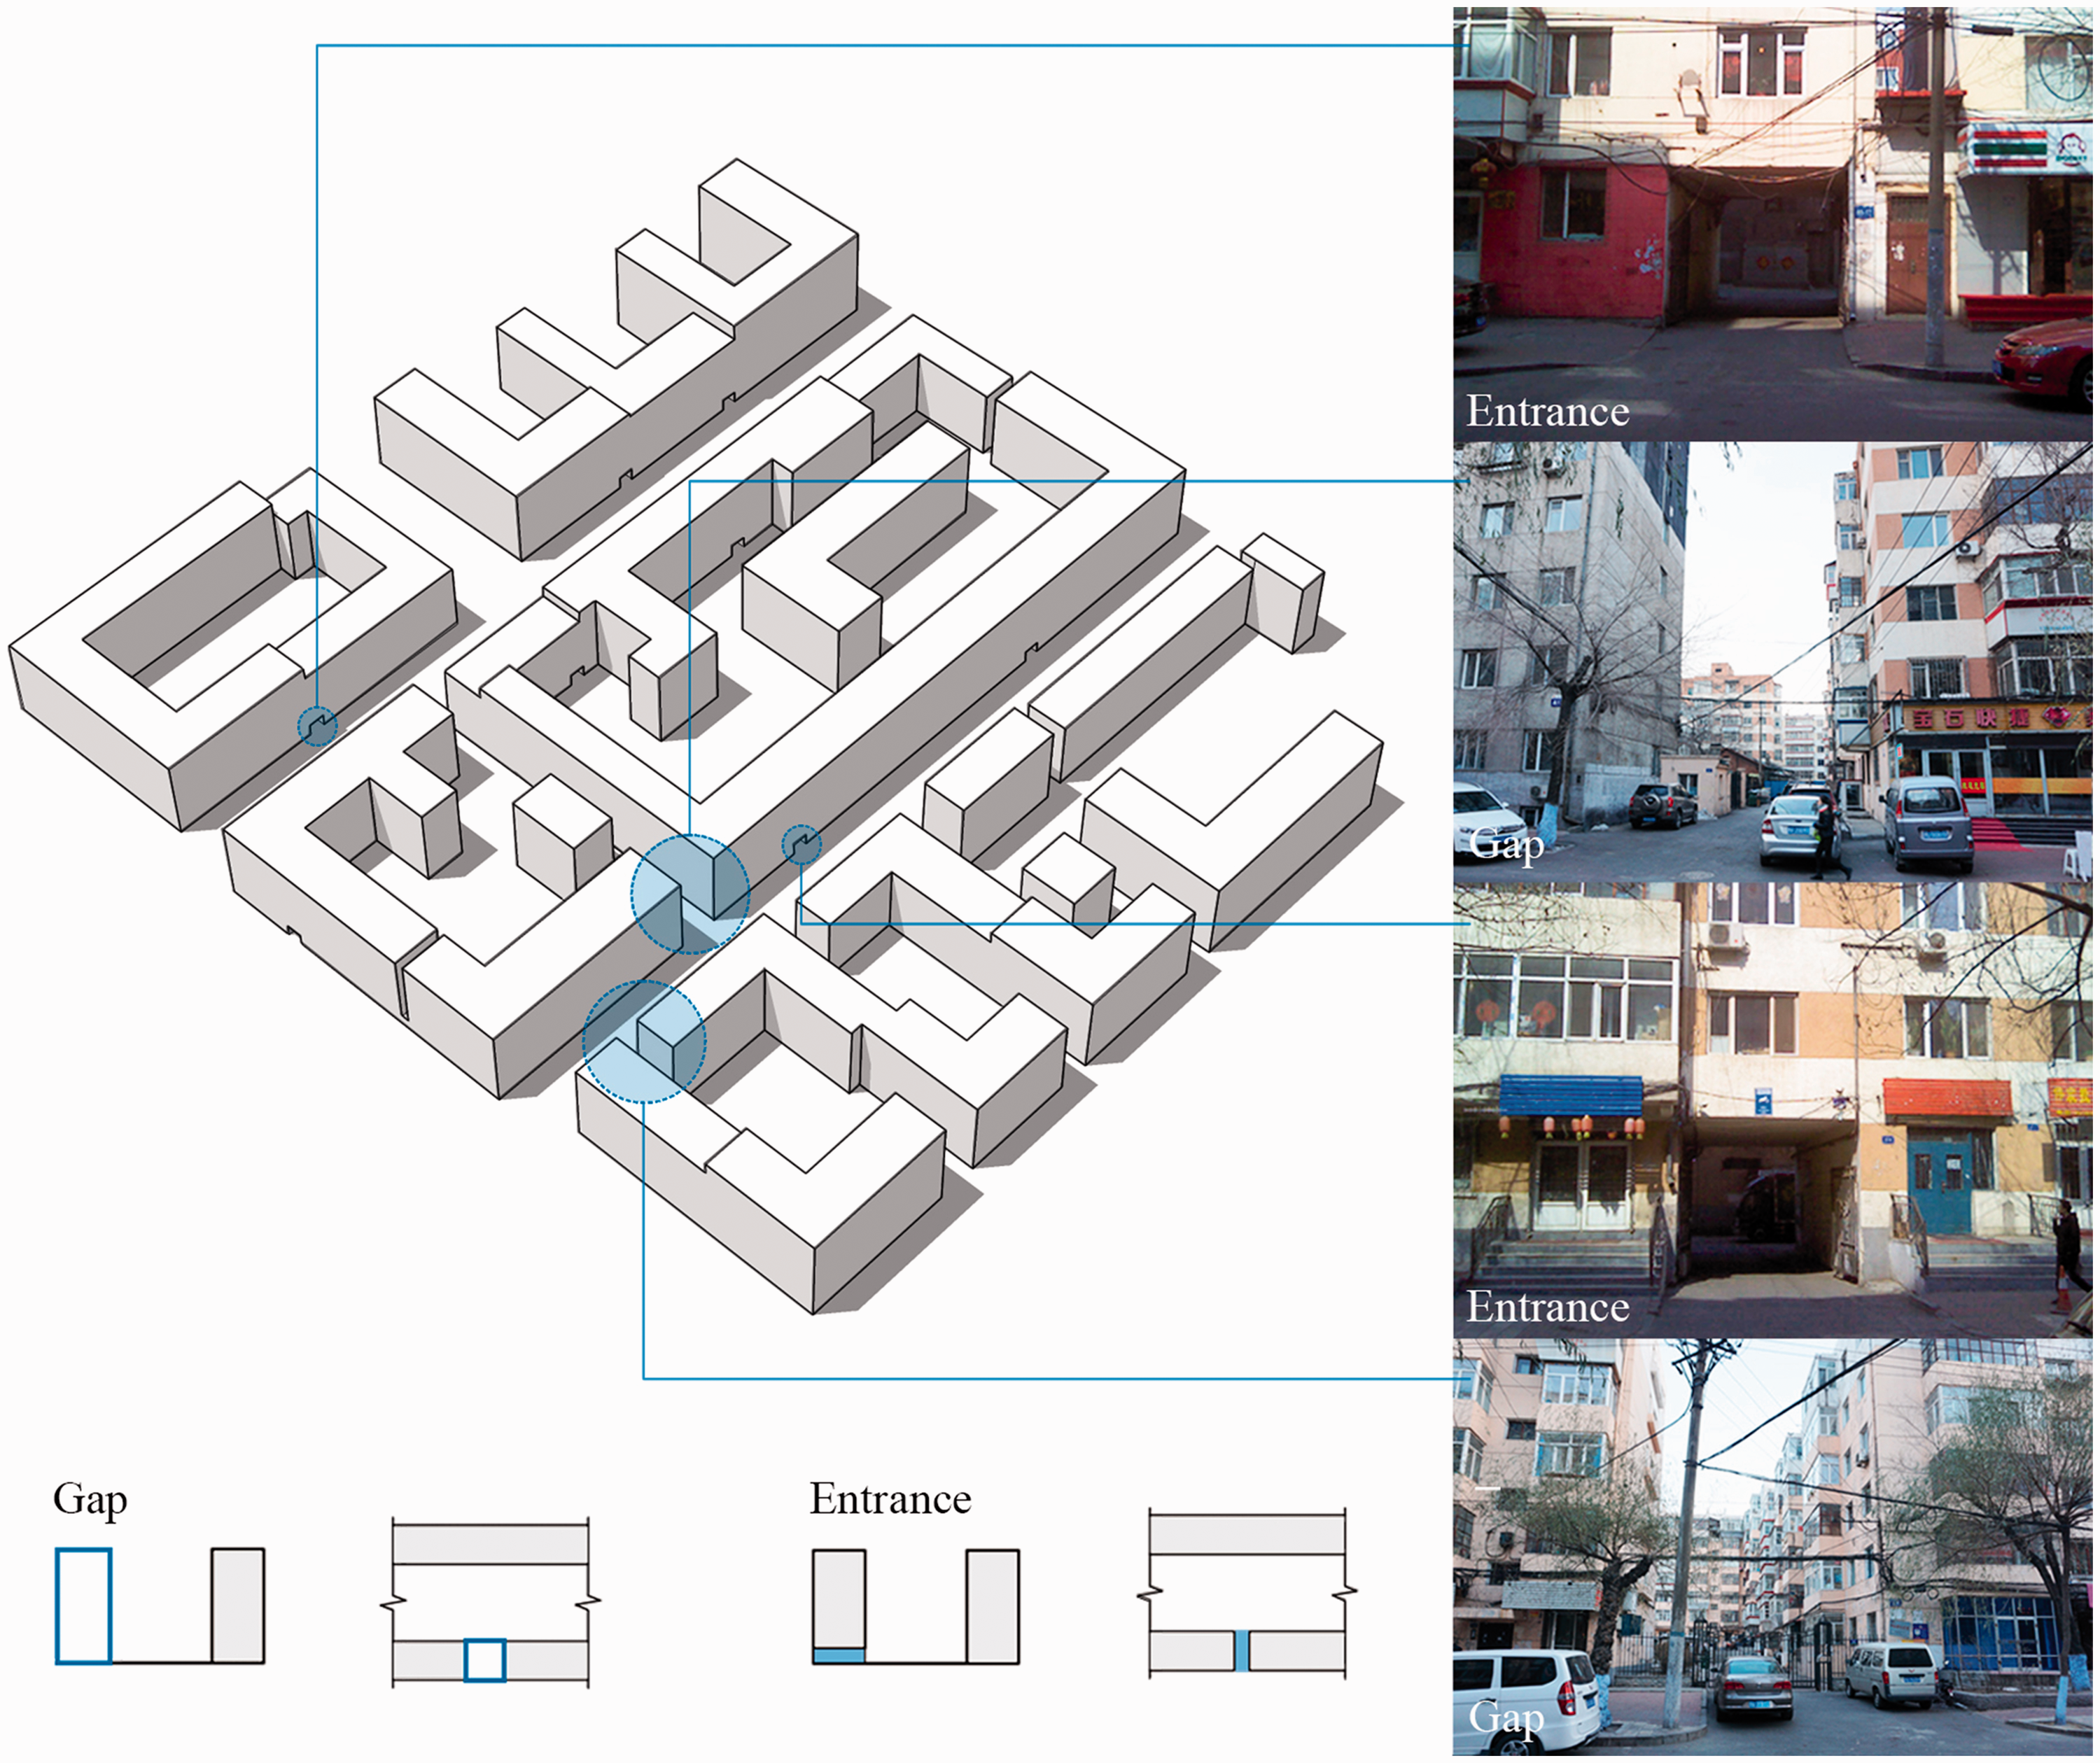
Diagram of the openings along the street.
The existence of openings may alter the continuity and closure of their adjacent block space, coupling the independent street space to the courtyard space, affecting the physical environment of the street. In the case of the sound environment, previous studies show that edge absorption has a significant effect on the reduction of sound energy reflection and the overall sound pressure level (SPL) in a street. Many elements, such as opened windows, gaps between buildings, etc., can act as absorbers When the absorber is a gap, it can provide attenuation up to 2–3 dB, especially near the gap (Kang, 2001, 2002). Additionally, 5–10 m2 openings increase the SPL among buildings over 20 metres in height by more than 3 dB (A) (De Ruiter, 2005). However, some studies note that the openings have dual effects. On the one hand, the opening can reduce the reflection times of the sound in the street, thus reducing the SPL of the street. On the other hand, the sound would transmit through the opening, enlarging the SPL of the courtyard (Salomons et al., 2009). When a courtyard has an opening, its SPL would increase by 10.1 dB (A), compared with that of the same sound passing through a roof. However, by increasing the sound absorption coefficient of the opening, the negative effects of openings can be restrained. Moreover, either crossroads or the opening of courtyards can diffract sound, but the effect may dramatically weaken with the increase of the distance from the sound source (Hornikx and Forssén, 2011). Another study notes that when a street façade had openings, the reflection coefficient of sound presented current peak values in each low frequency. However, for courtyards without openings in the façade, the obvious peak values only presented themselves at the lowest frequency. At the same time, the location of the openings affects the linear transmission of sound from its source to the courtyard, depending on proximity. So there is a difference in the amplitude of the fluctuation (Molerón et al., 2014).
In terms of the thermal environment, some studies indicate that the openings have a dramatic effect on radiation temperature: when a number of openings exist along a street, the average black globe temperature in the street increases dramatically in winter. Therefore, adding more openings reasonably in the street can not only offer access to the residents living in the block but can also effectively increase the thermal comfort of pedestrians in winter (Jin et al., 2016). Some studies also note that openings in the courtyard are very likely to result in changes in air flow, which is favourable for heat dissipation and aids cooling in summer. However, this same effect can also be a disadvantage in winter, making people feel colder. Ultimately, the direction and location of the opening would define the relationship between the wind velocity and the wind direction (Chatzidimitriou and Yannas, 2004). However, the opening does not significantly change the thermal comfort for people staying at the centre of courtyards; the only area where thermal comfort is significantly changed is around the opening due to the higher wind velocity, with this effect exacerbated in cases of comparatively elevated openings (Berkovic et al., 2012).
Previous studies show that an opening would cause an effect on the sound environment and thermal environment (Jin et al., 2017). Owing to the building arrangement in the traditional residential areas, all residential courtyards must have such openings. Therefore, it is essential to determine how the openings should be designed. Such research is particularly important in severe cold cities, due to the severe physical environment in streets in winter. Through a survey on the resident comfort evaluation, it was found that the thermal environment and sound environment have the greatest effect on people's evaluation. As most of the severe cold cities are dry all year round, the air humidity has relatively less effect on people. In the case of extremely low temperature in winter, people are less sensitive to relatively small temperature change. However, people are always sensitive to the changes in wind speed, even if the change is not significant. Therefore, the integrated effect of wind and sound could be significant.
The aim of this paper is to study the effects caused by openings on the wind–sound environment in the street. Through field measurements and numerical simulation, the study analyses the effects of the existence, size and form of openings on the wind–sound environment in the street. Based on these outcomes, some advice on environmental improvement is proposed.
Methodology
Field measurement
The field measurements were carried out in the Lujia block, in Harbin, China. As shown in Figure 2, this block has all the typical features of the traditional residential areas in northern Chinese cities. Its orientation is between 30° and 40° north by east. The buildings are mainly of 6–8 layers, 17–24 m in height with the adjacent streets being 18–25 m in width. The residential buildings within the block form the enclosure plane, with each integrated building having at least one opening to the street. Since most of the residential areas were built a comparatively long time ago, there are no parking lots in the courtyards and the width of the entrances is relatively narrow. The narrowest width is 3 m, the normal width is 4–6 m, and the height is generally 3 m, while the typical width of a gap is 6–10 m.
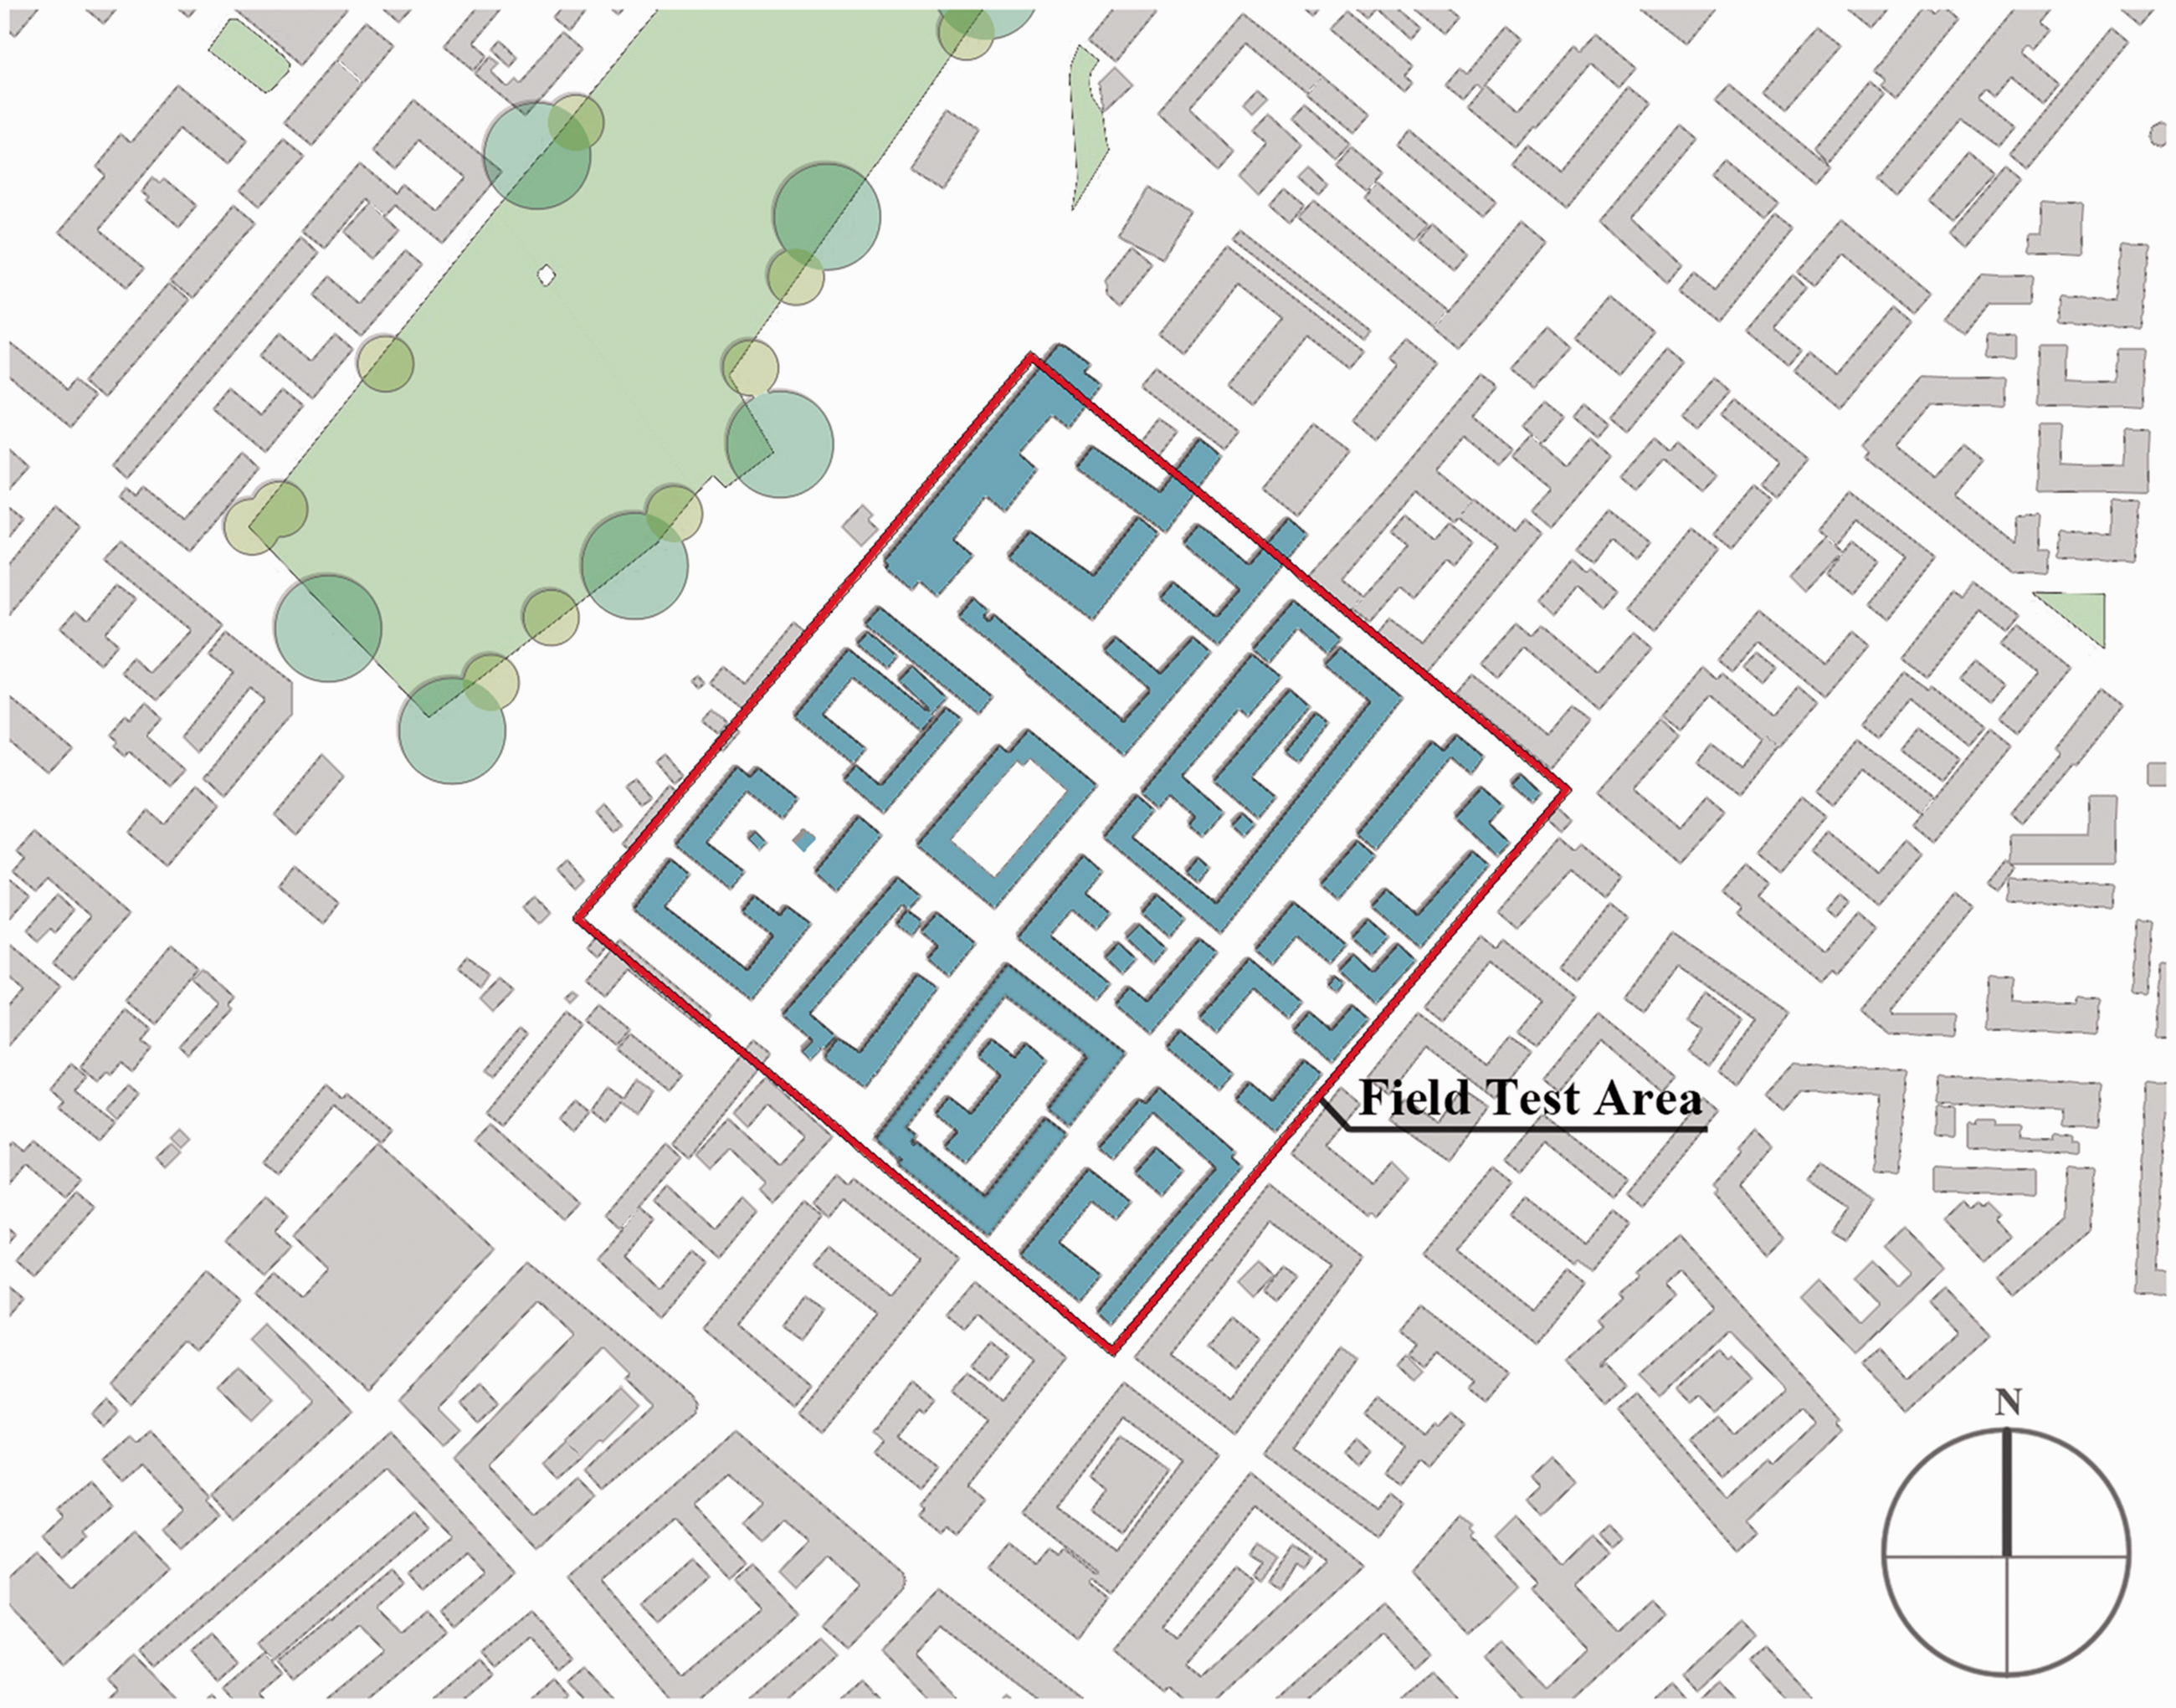
Field measurement site.
To compare the effects of the existence, size and form of openings on the wind–sound environment in the street, four fixed points were arranged simultaneously along two streets to measure the wind velocity near the opening. As indicated in Figure 3, w2 was located in front of the entrance, w4 was located in front of the gap, with w1 and w3 being their comparative points. During the measurement, four pairs of points were also arranged to monitor the SPL around the opening. Two measuring points of each pair were placed at the same distance from traffic lines, in which a1 and a7 were in front of the entrance, with a2 and a8 being their comparative points; a4 and a6 were in front of the gap, with a3 and a5 on the opposite side.
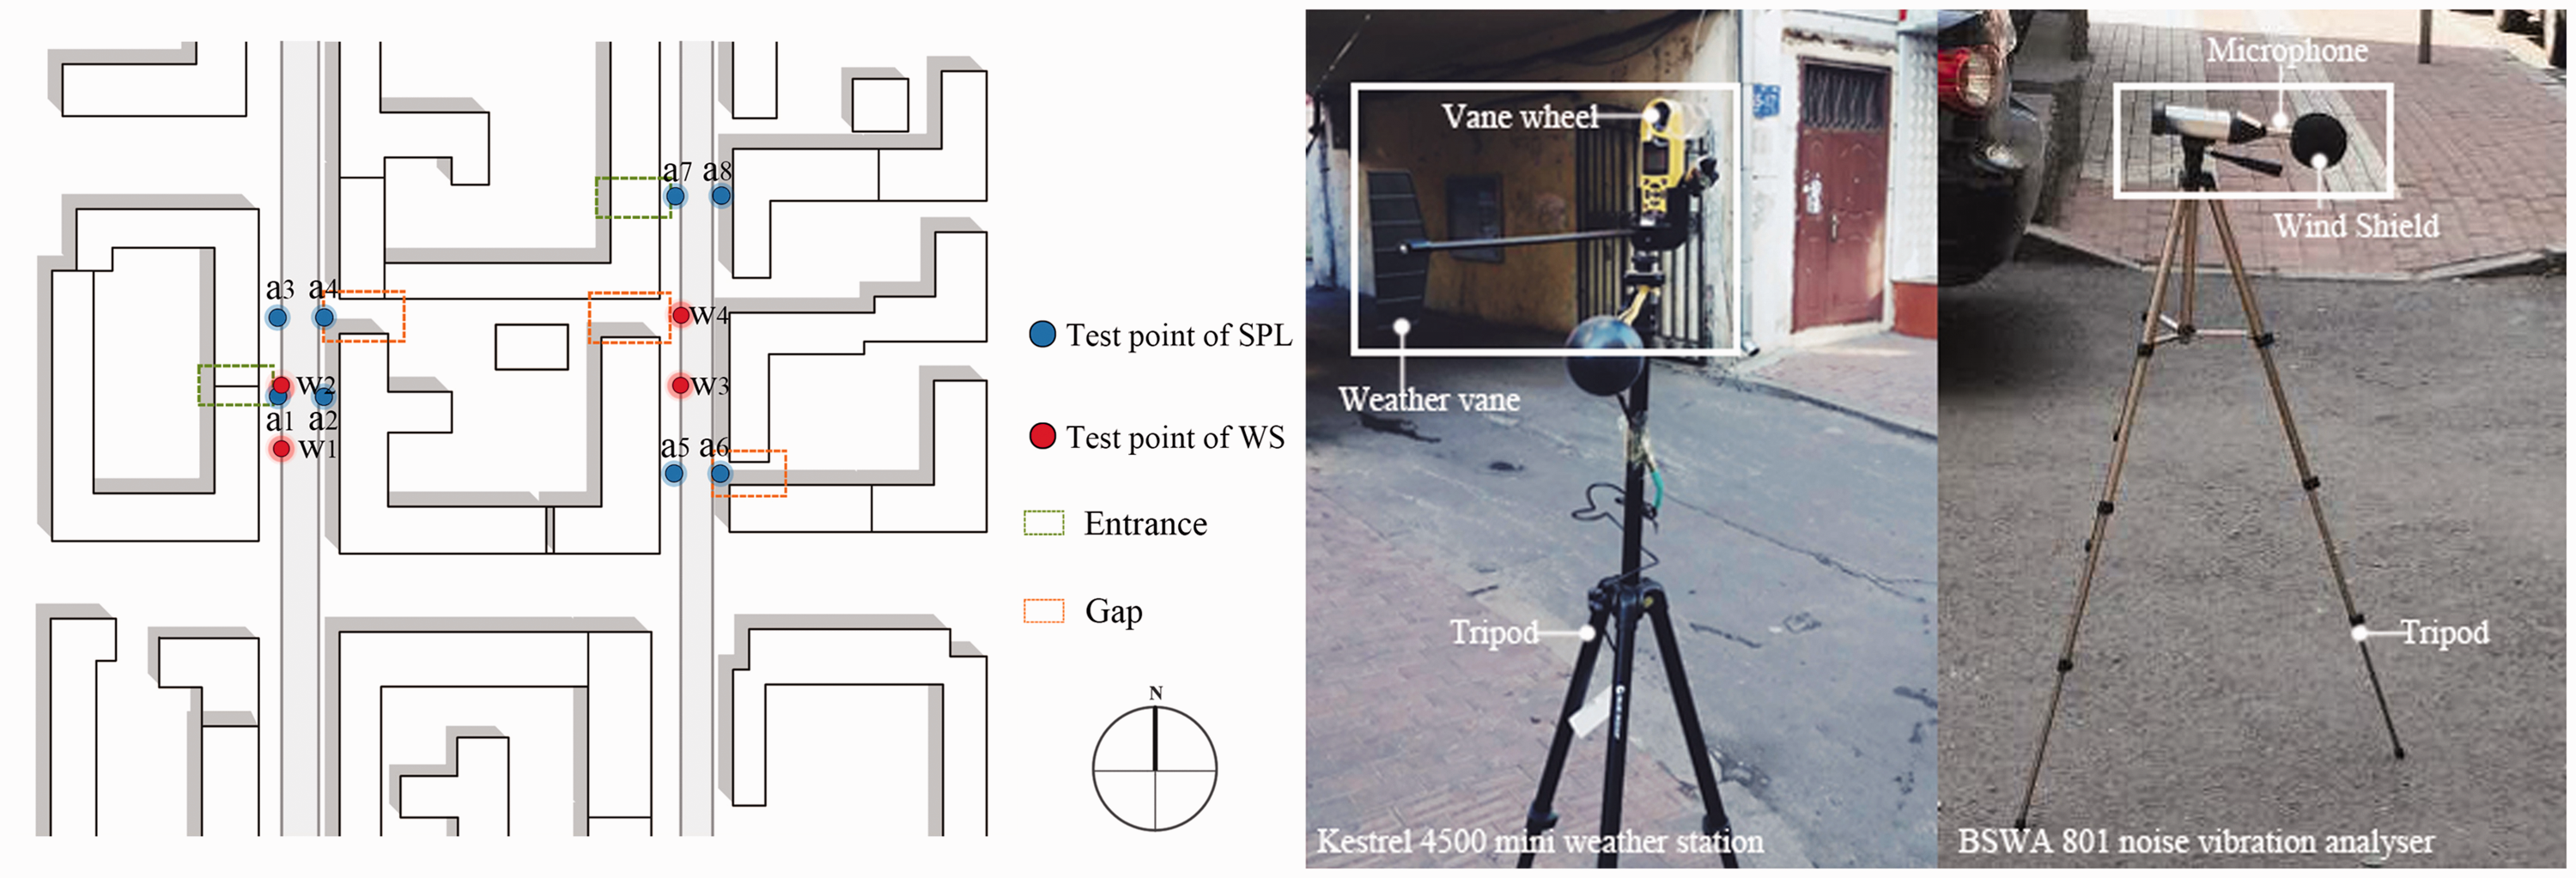
Diagram of measuring points and instruments.
The wind blew south-westward (the leading wind orientation of Harbin in the winter), with a velocity of 3.0 m/s on the measuring day. Portable Kestrel 4500 weather stations were employed to record the wind velocity and wind orientation, with an accuracy of ±0.1 m/s. BSWA801 noise vibration analysers were used to record the SPL of the environmental noise, the microphones of the analysers were placed inside the wind shield for a more accurate outcome. As the study was to determine the wind–sound environment at the height of pedestrians, the measuring instruments were respectively mounted on tripods to keep the sensors of weather stations at 1.5 m height, while the noise vibration analysers and the microphones were placed horizontally at 1.2 m height. The wind velocity and wind orientation were recorded with a time interval of 1 minute, while the recording interval of the SPL data was 10 s, and a sample size of 25 for each group.
Numerical simulation
In this part, wind speed was selected as an index to evaluate the wind environment, SPL and reverberation time were selected as indicators to evaluate sound environment. Although SPL is the most important index for evaluating the acoustic environment in urban streets, previous studies have confirmed that reverberation studies in open spaces are also important (Steenackers et al., 1976). Kang (1988, 1997, 2001) showed that with a constant SPL, noise annoyance was greater with a longer reverberation time, and an appropriate reverberation time, such as 1–2 s, could make ‘street music’ more enjoyable.
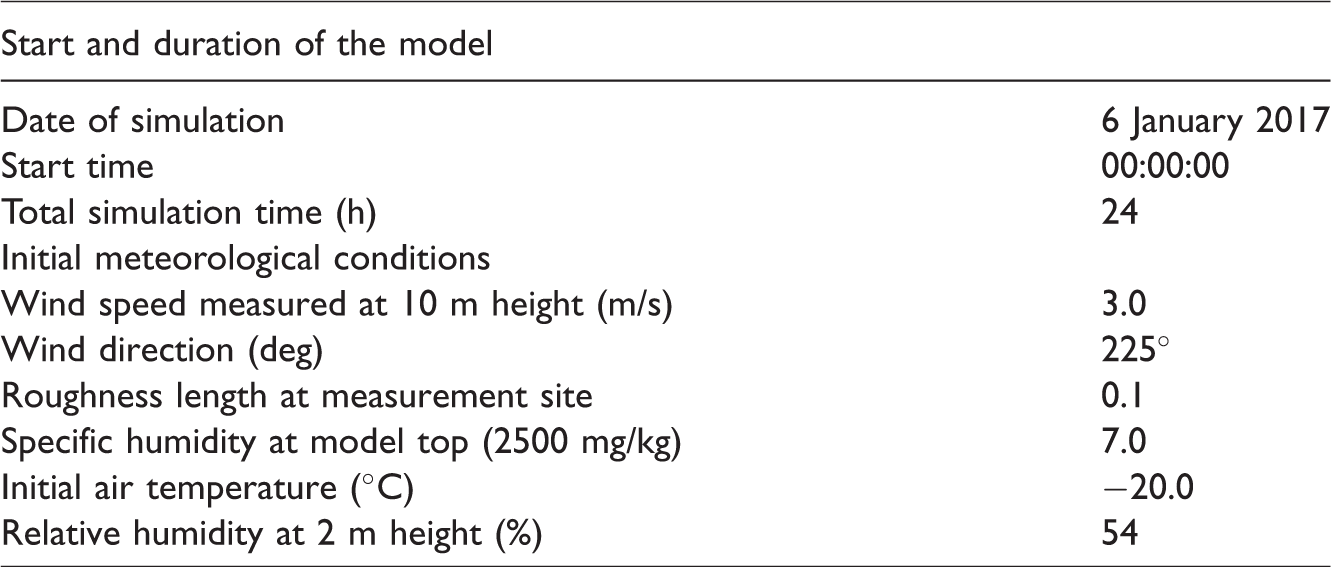
ENVI-met software was employed in simulating the wind environment of the street in this paper, which is a microclimate three-dimensional simulation software (https://www.envi-met.com/). The accuracy of the software has already been well validated by many studies (Ghaffarianhoseini and Berardi, 2015; Taleghani et al., 2015; Yang et al., 2013; Yang and Lin, 2016). A previous study (Jin et al., 2017) used both field measured data and wind tunnel tests to demonstrate the effectiveness and accuracy of the simulation software. The results showed that it is credible to use ENVI-met to predict the outdoor wind environment. By establishing a 3D model of the measuring site, the measured wind velocity was compared with the simulated results in this paper. It was found that though all the simulated values were higher than those measured, with differences from 0.25 to 0.54 m/s, the alteration trend and scale of wind velocity were perfectly identical to those obtained on site, signifying that the accuracy of the simulation was acceptable. The grid resolutions were 1 m in the horizontal direction in the two-dimensional plane and 2 m in the vertical direction, except that the lowest vertical grid cell was divided equally into five sub-grid cells. Meanwhile, five nesting grids were set around the model area to weaken the influence of external conditions on the simulation results. As shown in Figure 4(a), 10 reception points (a1–a5, b1–b5) were separately fixed around the opening and its opposing side to obtain the wind velocity in the vicinity of the opening. The forced lateral boundary conditions for turbulence were used in this paper, which meant that the logarithmic wind power profile of the kinetic energy and its dissipation rate calculated in the 1D boundary model were copied directly to inflow boundary and top boundary of the main 3D model. For the initial meteorological boundary conditions, the observation data by the national weather information Centre of China were used (shown in Table 1).
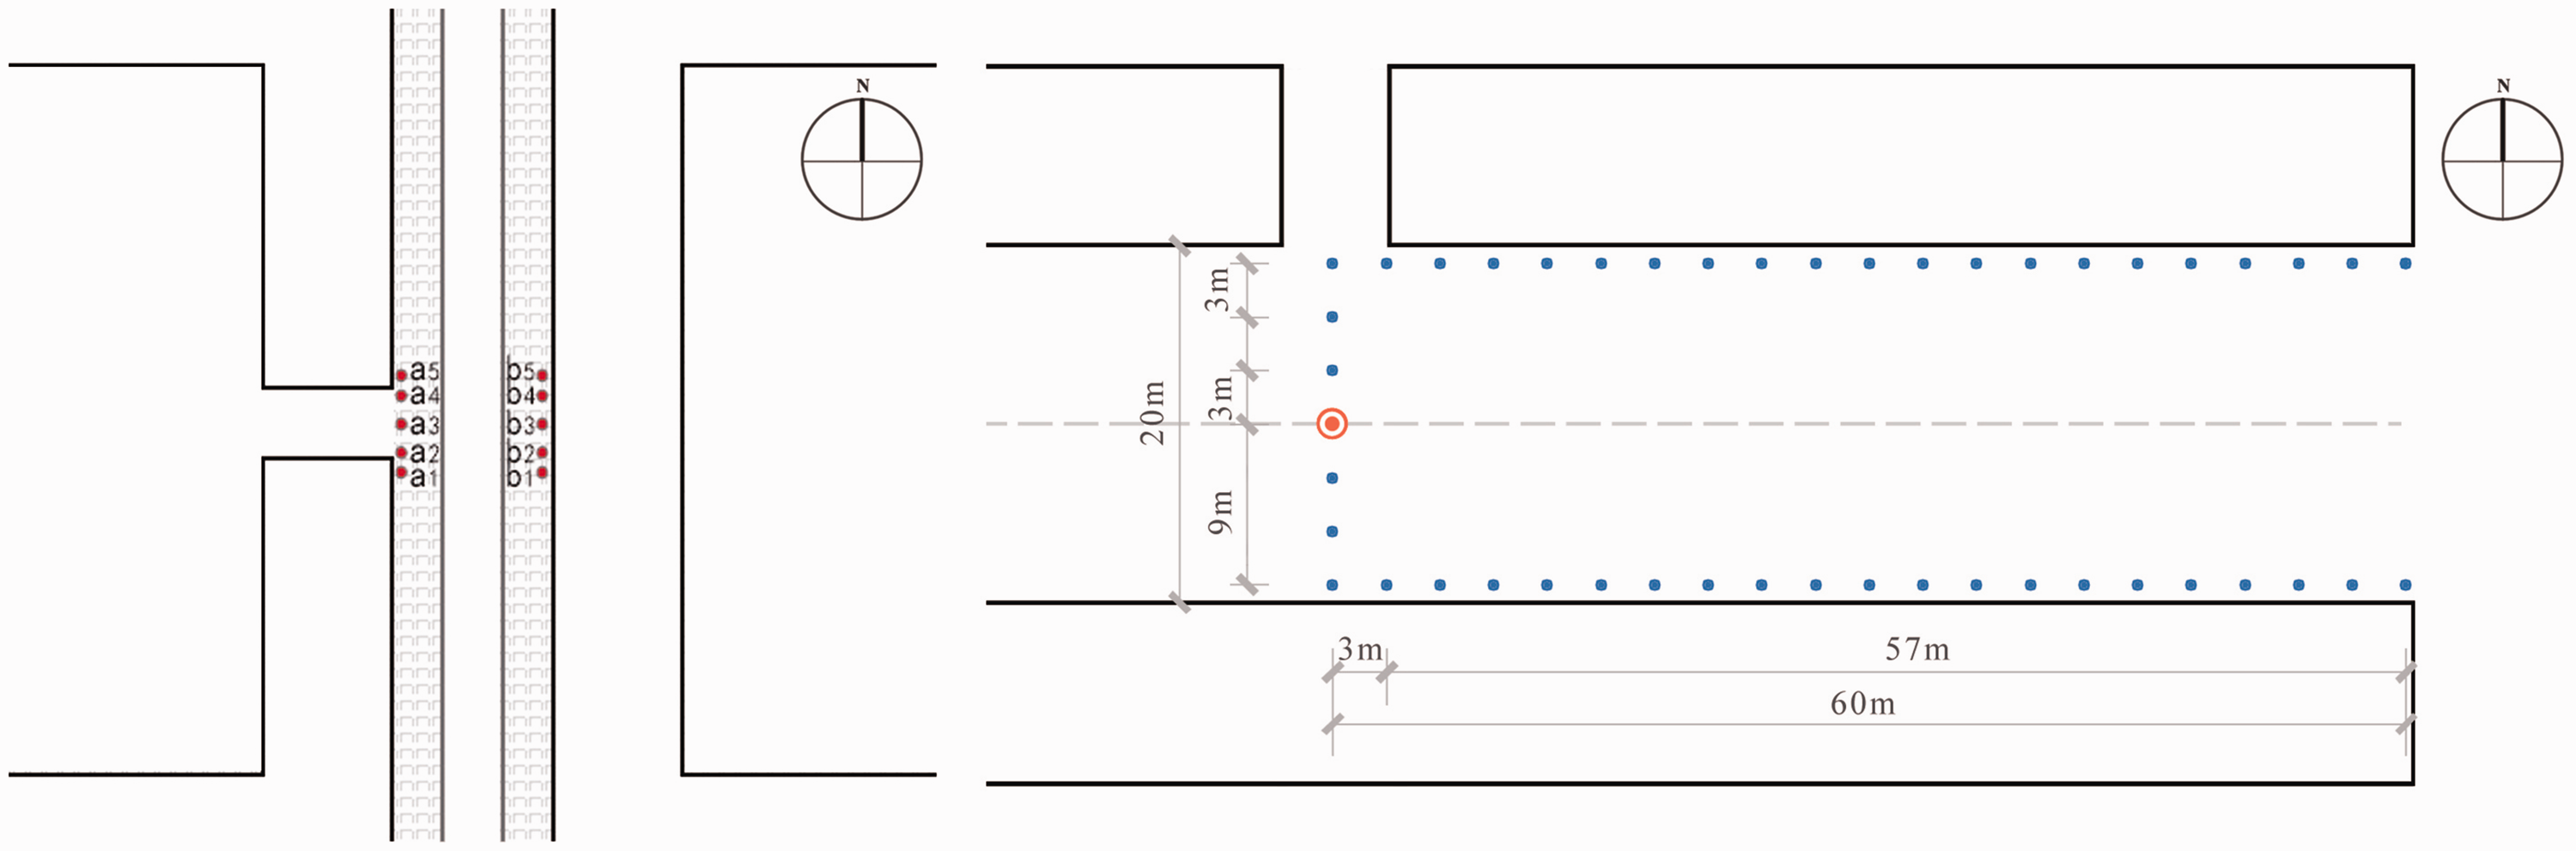
Configuration of simulation receptors. (a) Receptors in ENVI-met. (b) Receptors in Odeon.
Initial configuration data in the ENVI-met simulation models.
In this paper, Odeon software was used to simulate the sound environment of the street, which is a software for simulating and measuring the interior acoustics of buildings (https://odeon.dk/). With the appropriate treatment, outdoor situations can be studied as well. Lee and Kang (2015) explored the applicability of Odeon in simulating the sound environment in streets and found that the difference between the simulation and the measurement was less than 15% in T30 and about 1 dB in SPL. Paini et al. (2004) simulated the sound environment of public squares/places with Odeon and compared the simulation results with the measurements, which indicated the accuracy of the software. In addition, more studies on sound propagation of streets were based on Odeon (Jang et al., 2015; Kim et al., 2014; Wu et al., 2019). In this experiment, it was found that although the simulation results were slightly lower than the measured results, with differences ranging from 0.1 to 0.26 dB, the consistency was high, so it was acceptable. As shown in Figure 4(b), with the sound source being set in the middle of the north-south direction, receptors were set at an interval of every 3 m. In the east-west direction, receptors were set up with the same interval. This arrangement was mirrored on the opposite side of the street. Meanwhile, a unit grid with an interval of 1 m was also set in the model and the height of every reception point was 1.2 m to account for the average pedestrian's height. To facilitate the comparison of attenuation of SPL, the SPL of the sound source was set to 0, the origin of the sound source was set to x = 0 and y = 0, and the source's height was 0.5 m.
In this case, too many rays do not significantly improve the accuracy of the calculation, so a 1,000,000-ray parameter was selected. The initial estimate showed that the reverberation time in the street was about 3–4 s, so the impulse response length was set at 3000 ms, as the impulse response length should be at least two-thirds of the reverberation time. Since most of the traffic noise was at the medium-low frequency, the selection of sound absorption materials was based on the purpose interacting with sound whose frequency was ≤4000 Hz. The effects of vegetarian was not taken into account (Yang et al., 2013). Table 2 shows the coefficients of the sound absorption materials for each interphase during the simulation.
Coefficients of the sound absorption materials (Liu, 2010). Building Physics, Beijing, China Architecture&Building Press: 506.

Results
Effect of existence/absence of opening
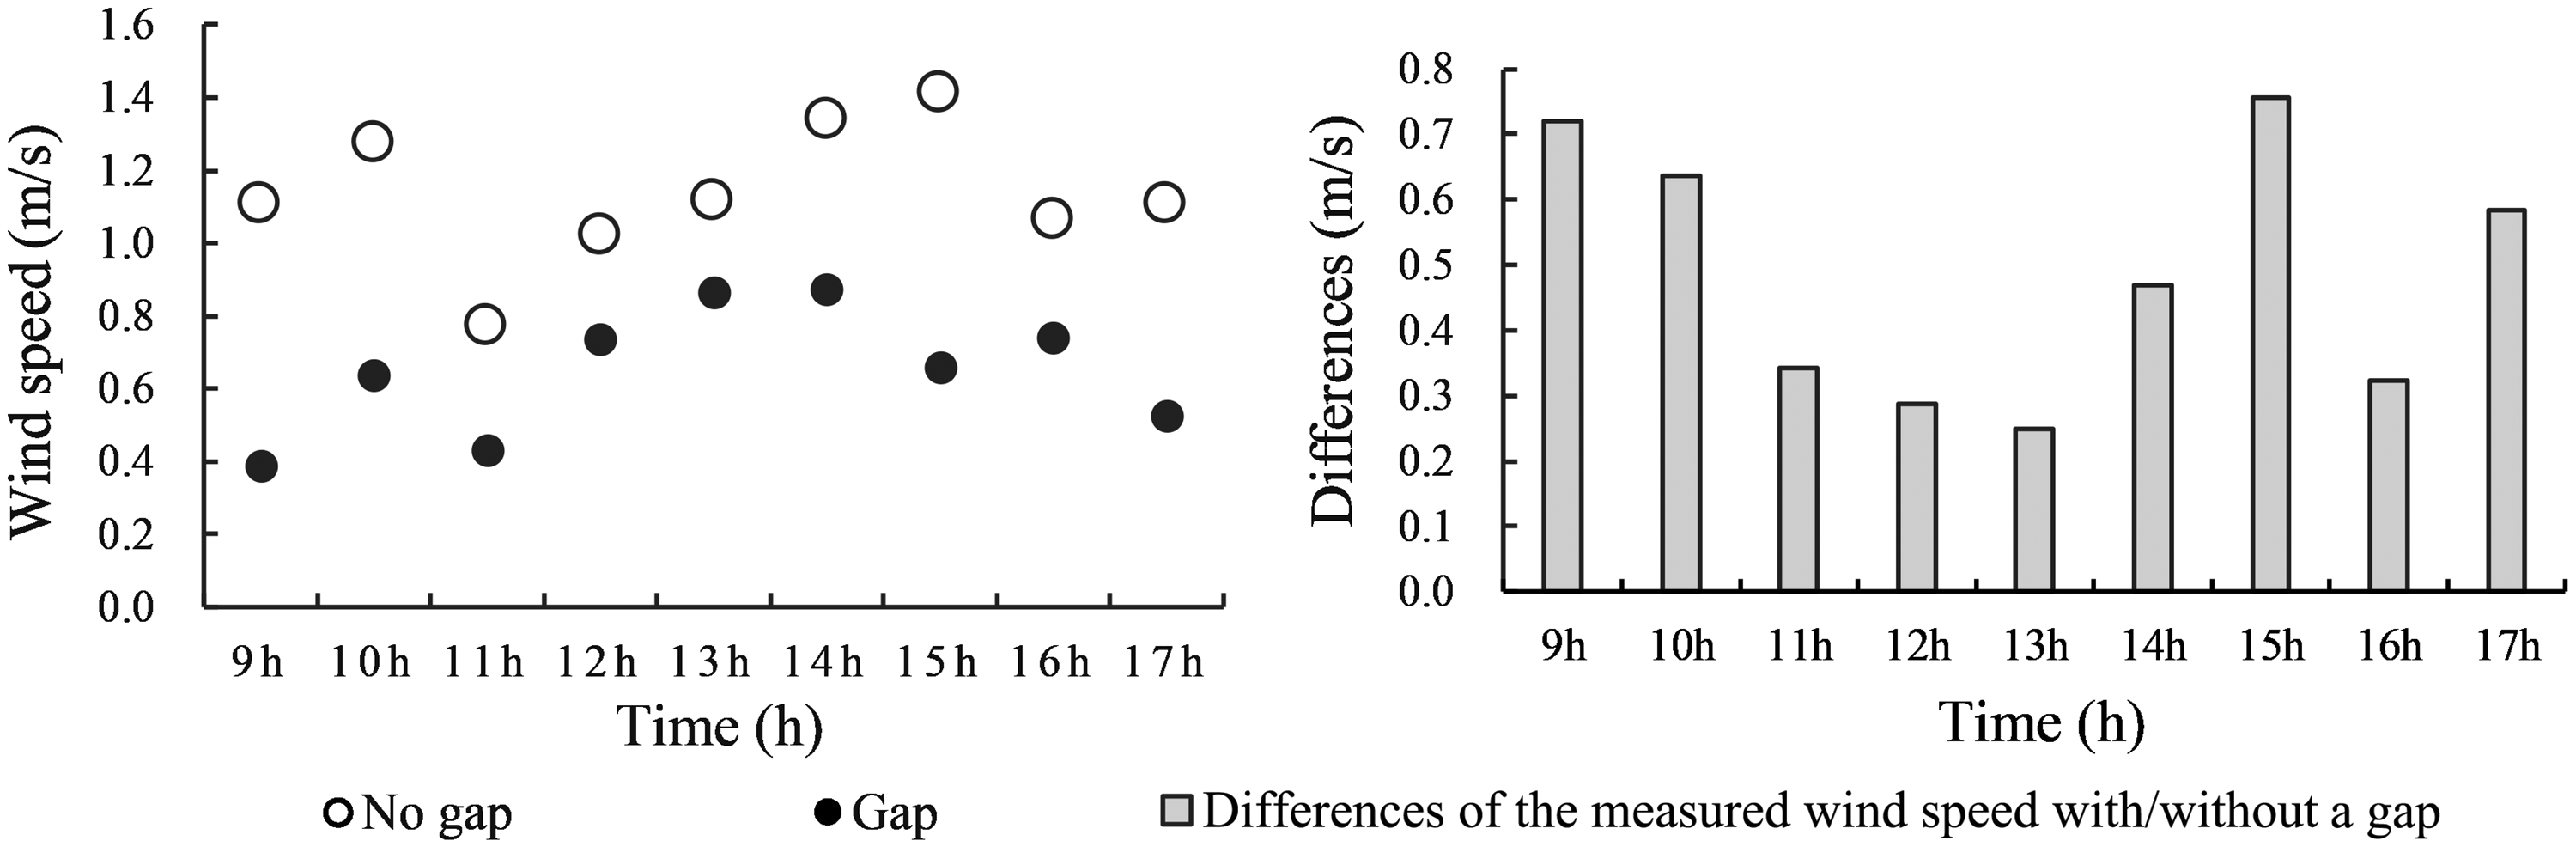
Figure 5 shows the measured wind velocity and differences in the street with/without an entrance. Although the trends of wind with/without an entrance are consistent, the wind speed near the entrance is always lower than the place without an entrance. The average difference is about 0.3 m/s and the maximum difference is 0.8 m/s.
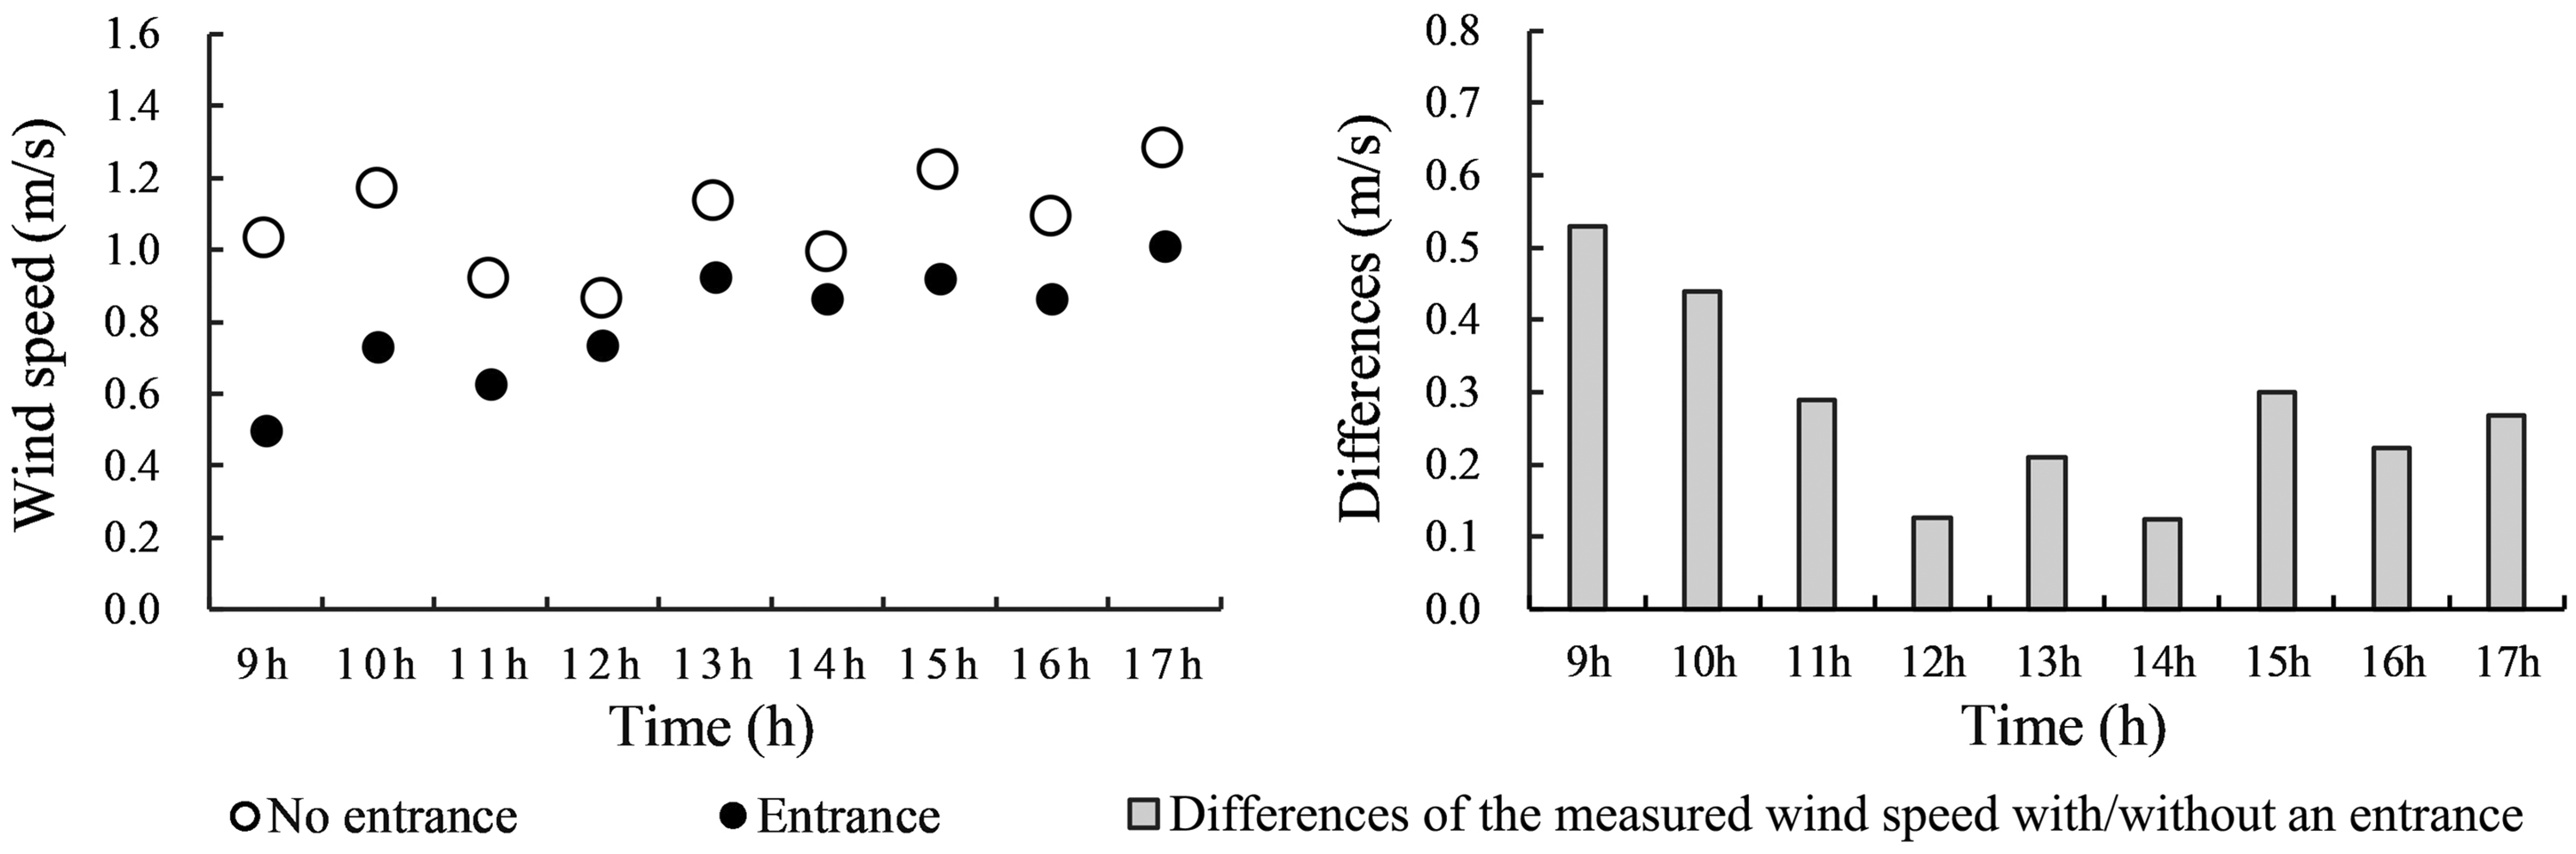
Measured wind speed and differences with/without an entrance.
Figure 6 shows the measured SPL and differences in the street with/without an entrance. Although there are some differences in the sound environment between the two pairs of measuring points, the results are completely consistent. It can be seen that the SPL near the entrance is lower than the place without an entrance. The average difference is 0.5 and 0.6 dB, respectively, and the maximum difference can be about 3 dB. There are several anomalous data due to the interference sound sources that appeared during the measurement, although they do not affect the conclusion from the measurements. These measured results show that when there is an entrance in the street, the wind speed and SPL near the entrance would be attenuated.
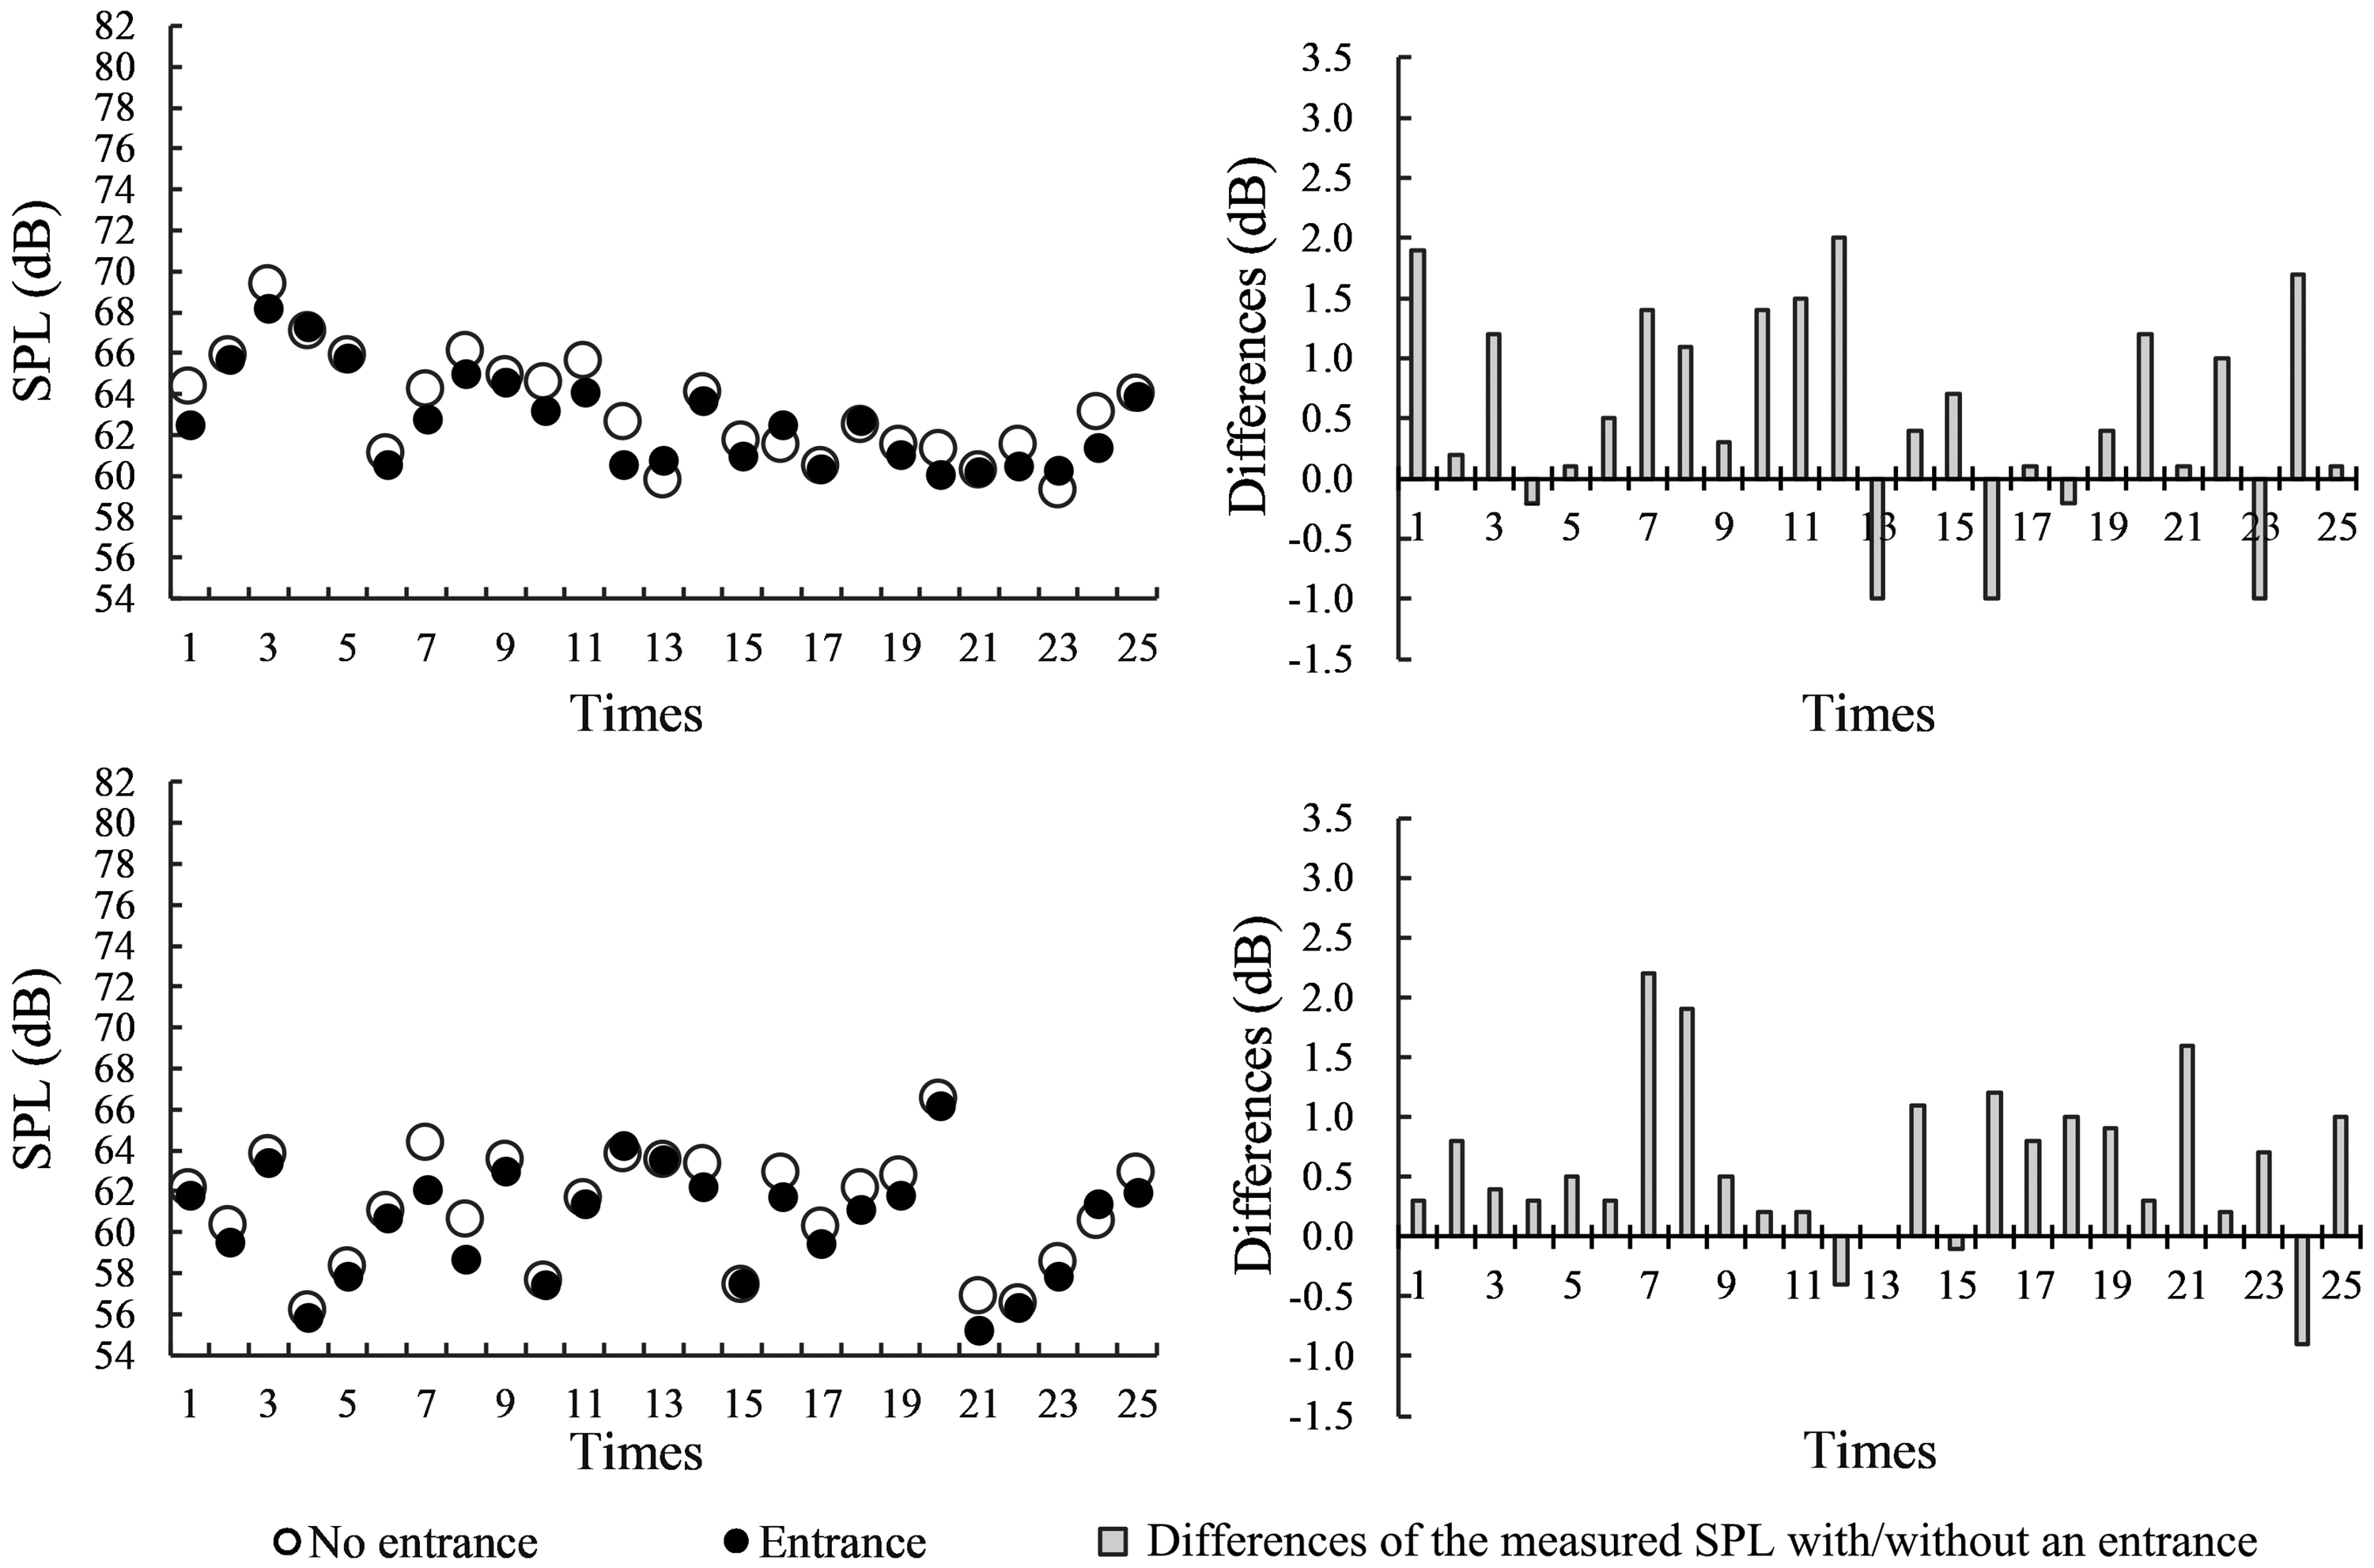
Measured SPL and differences with/without an entrance.
To accurately find the influence range of the opening, a numerical simulation is carried out. Figure 7 demonstrates the simulated results of the wind–sound environment in the street with/without an entrance, showing that the wind velocity near the entrance weakens dramatically. At the same measuring point, the differences of the wind velocity with/without an entrance are 1.0 m/s. However, there are no such variations on the opposing side of the entrance. Through simulation, it was found that entrances 3–6 m in width can affect the sound environment of the adjoining street for a range of 0–12 m. For the same measuring point, the simulated attenuation of the SPL near the entrance increases by 1.3–1.4 dB and these results are consistent with the measured data. At the same time, the attenuation on the opposing side of the opening increases by 0.5 dB. The T30 near the entrance (the first reception point on the sidewalk) increases by 0.2 s, the differences of the opposing side are even larger, with the difference value being 0.3–0.4 s, while the average T30 in the street increases accordingly. This is due to the entrance connecting to the street, causing a portion of the sound which should have been reflected in the street to be reflected into the entrance first. As the path of the reflected sound reaching the measuring point is extended, the T30 is obviously longer.
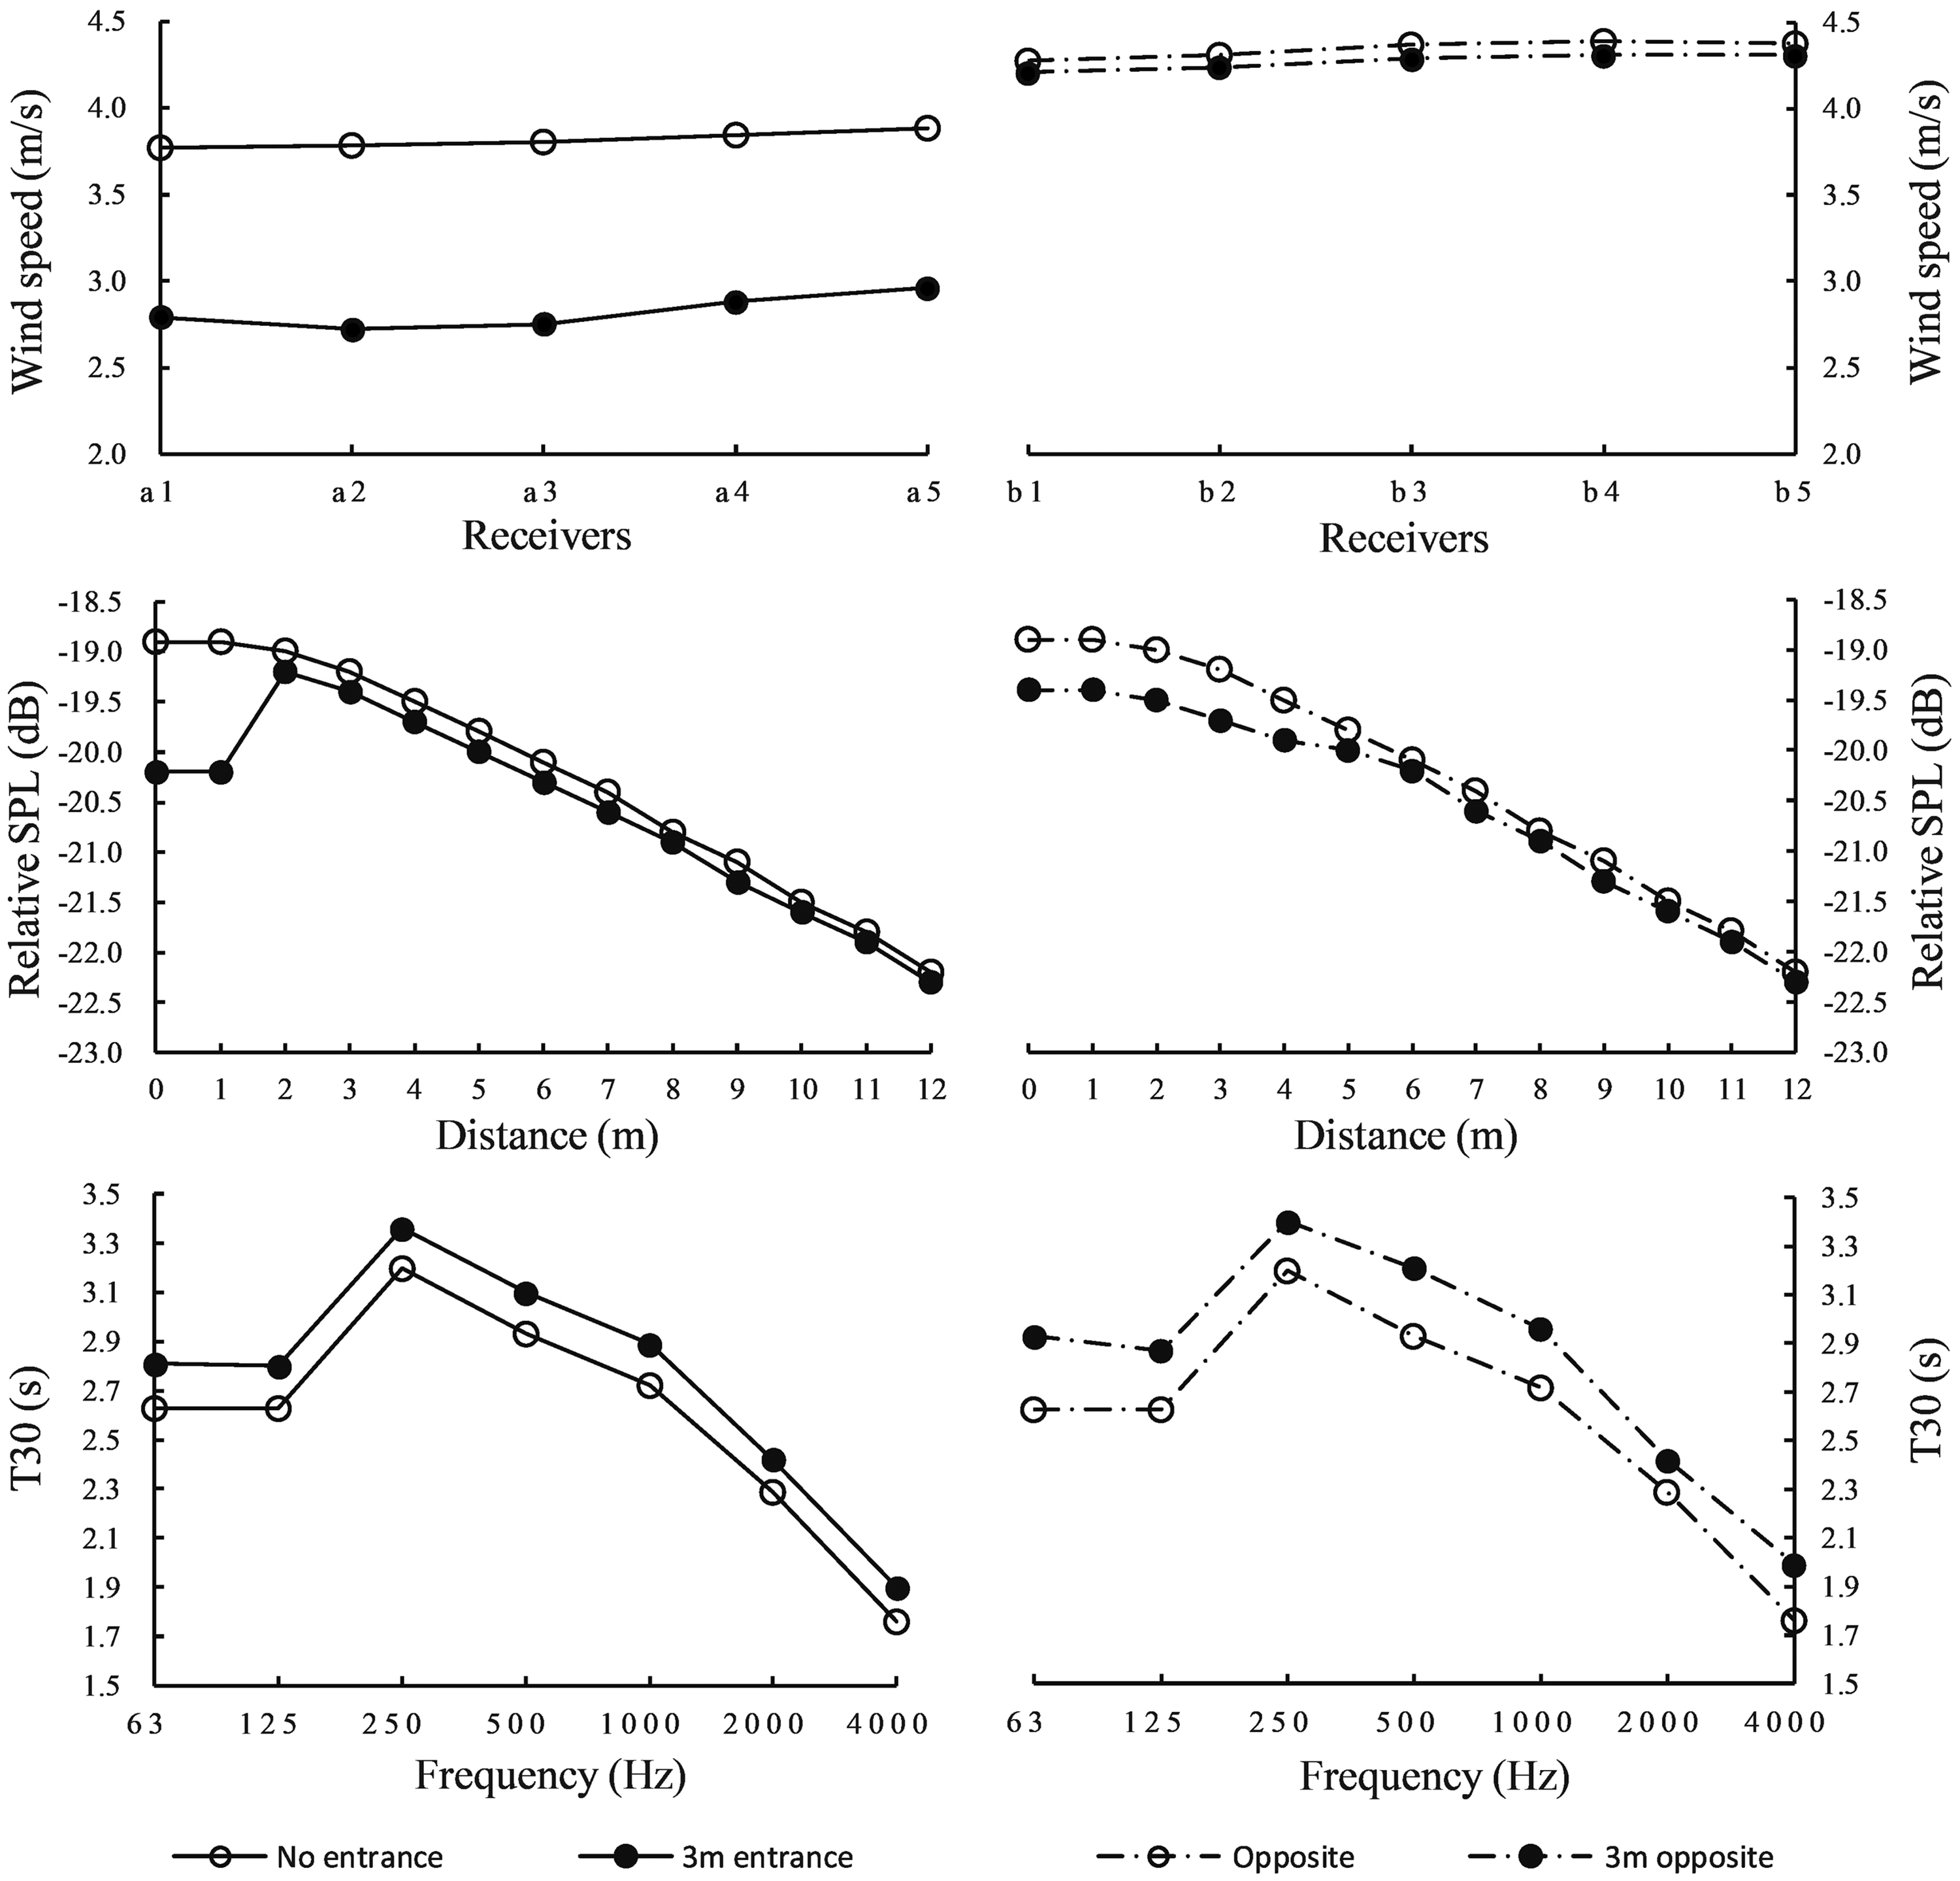
Simulated results of the wind–sound environment with/without an entrance.
Figure 8 shows the analysis of the measured wind velocity and differences in the street with/without a gap. Unlike the condition with the entrance, the consistency of the wind speed with/without a gap is not so obvious, and it can be seen that the wind speed in the vicinity of the gap fluctuates. As the gap is comparatively large in size, part of the air flow in the street enters the courtyard, causing the air volume near the gap to decline dramatically. The differences of the average wind velocity with/without a gap reach 0.6 m/s.
Measured wind speed and differences with/without a gap.
Figure 9 shows the analysis of the measured SPL and differences in the street with/without a gap. The SPL fluctuation obtained at the same distance from the opening is consistent with the change of traffic, with the SPL data obtained near the gap always being 1–2 dB lower. There are few anomalous data due to the interference sound sources that appeared during the measurement, although they do not affect the conclusion from the measurements. These measured results show that when there is a gap in the street, the wind speed and SPL near the gap would be also attenuated, and the wind speed would fluctuate.
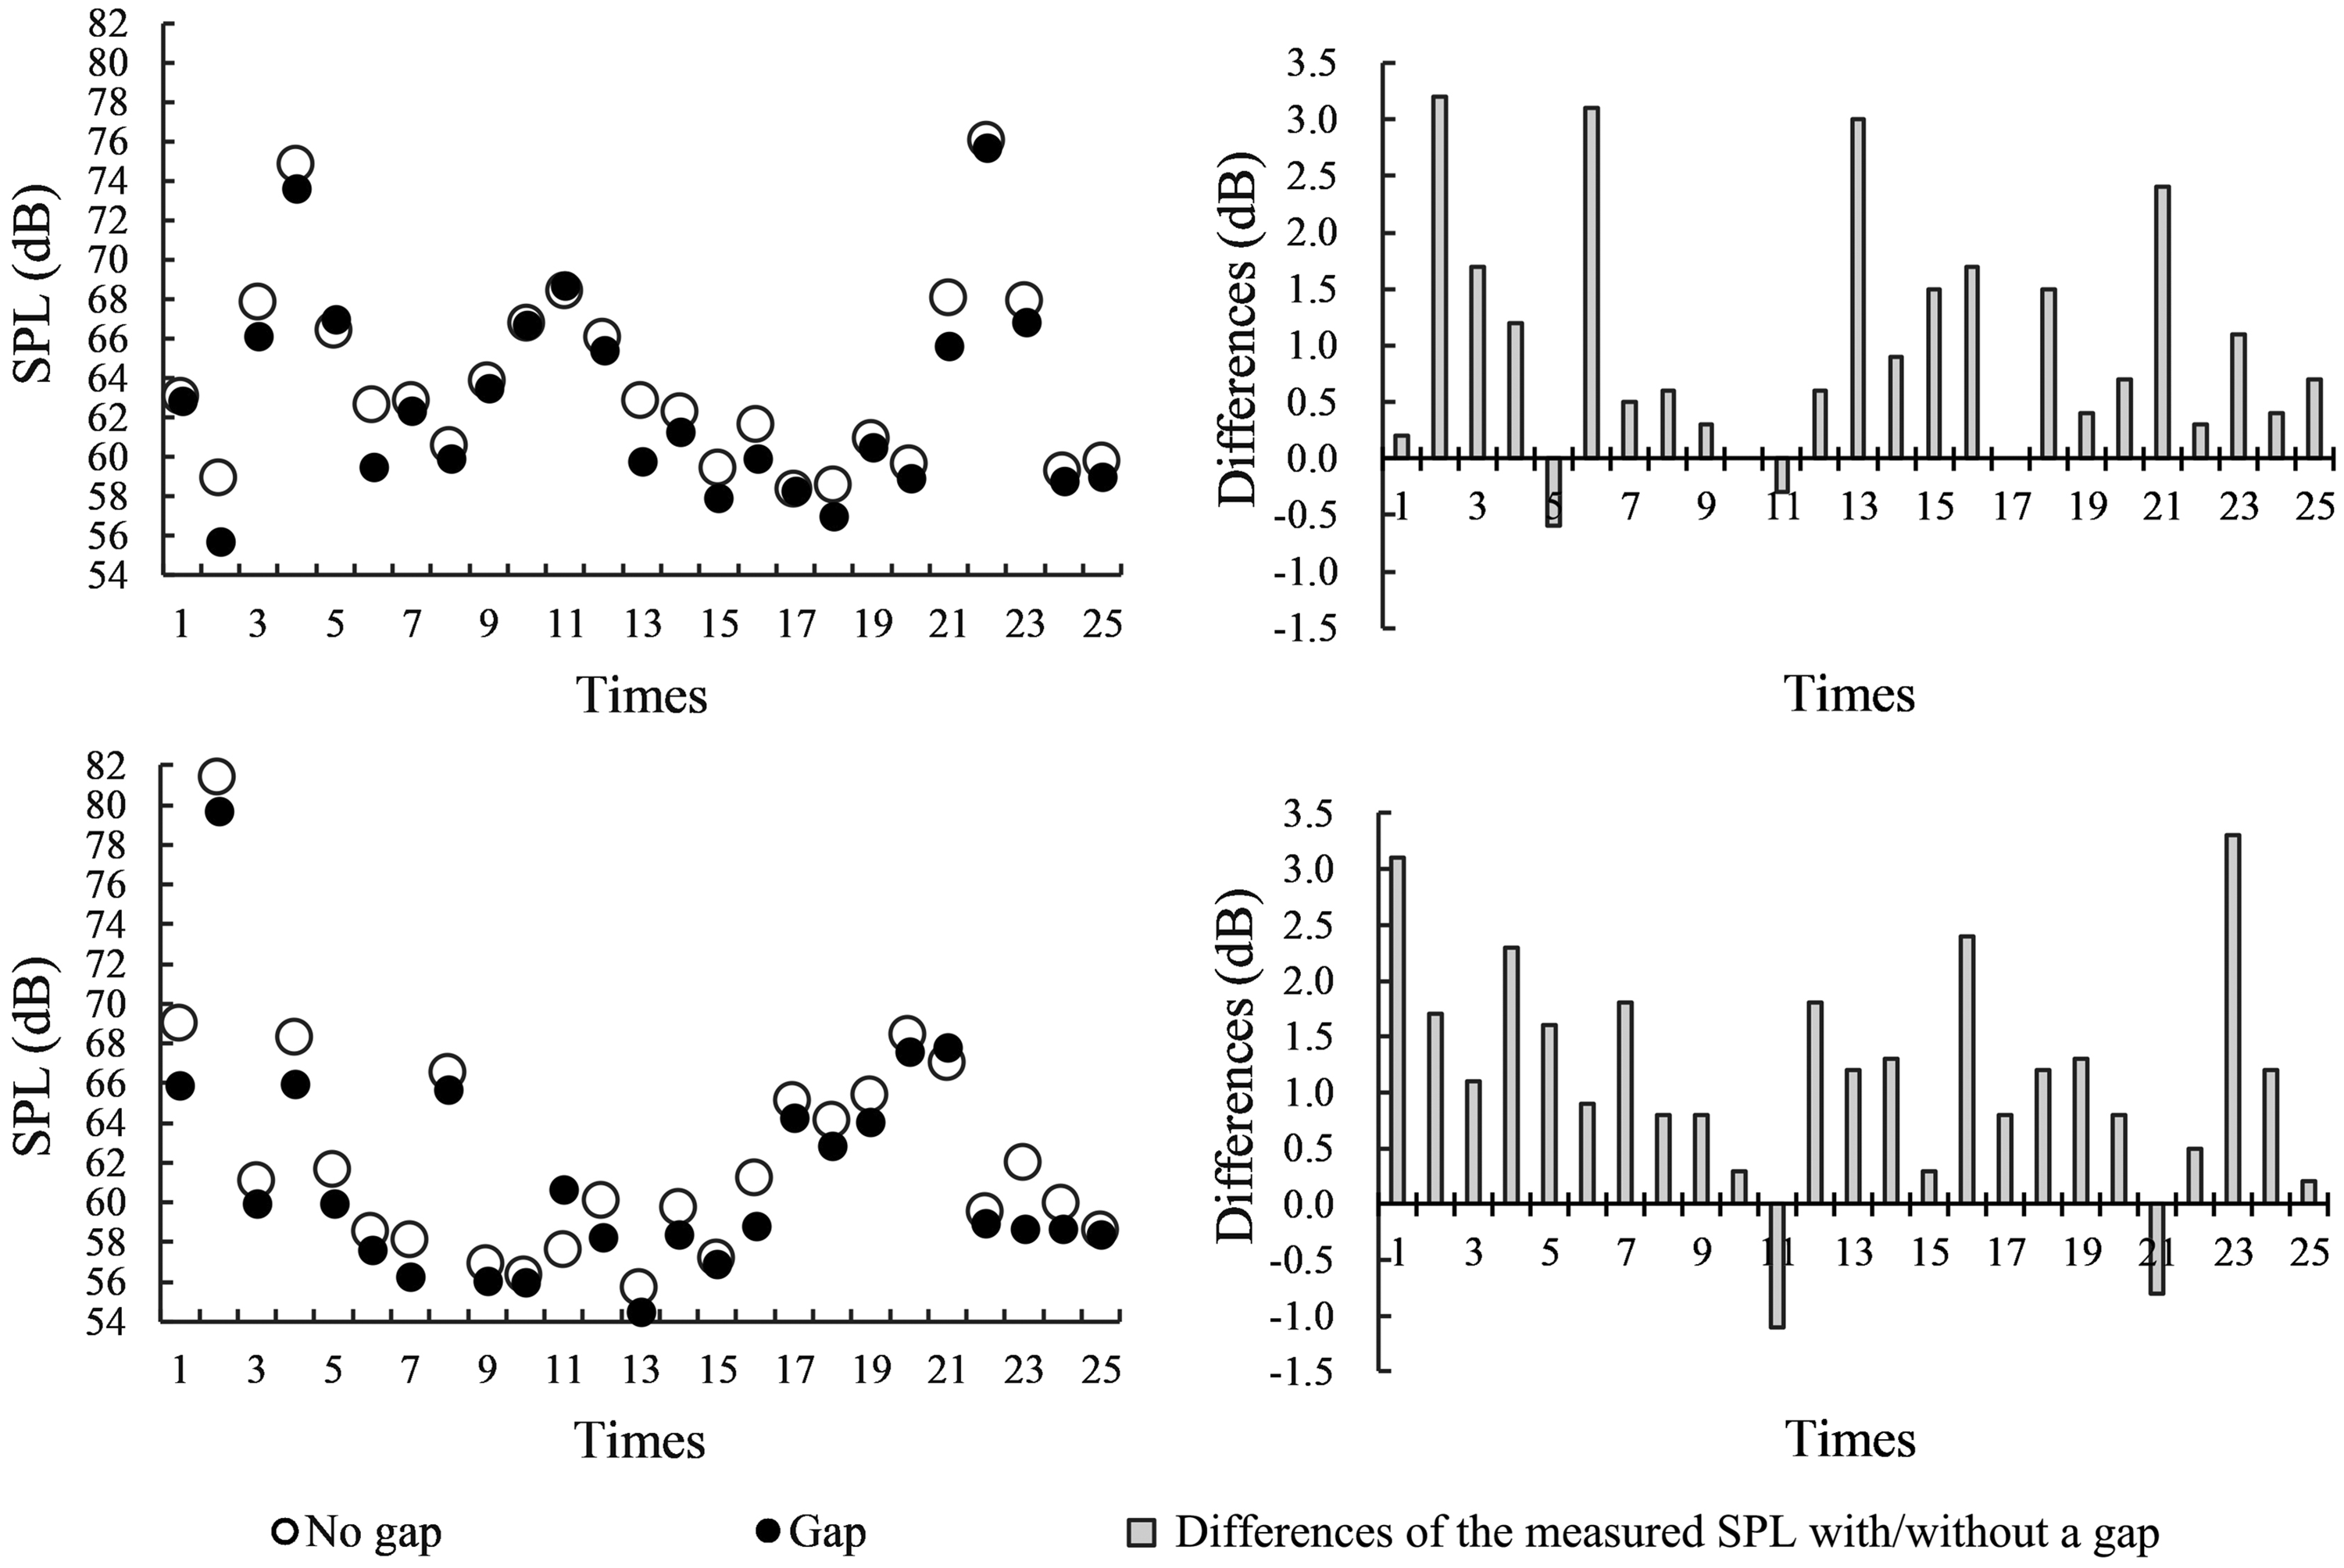
Measured SPL and differences with/without a gap.
Figure 10 demonstrates the simulated results of the wind–sound environment in the street with/without a gap. By comparing the wind environments, it was found that though the wind velocity near the gap weakens dramatically (with the average difference up to 1.2 m/s), the gap intensifies the fluctuation of the wind velocity in the street. As the gap is comparatively large in size, there is a partial air flow entering the courtyard through the gap, bypassing the buildings facing the wind. This forms a wind velocity mutation area, and as the wind pressure inside the gap is comparatively low, air from the northeast flows into the gap. This forms a local vortex wind or a reverse wind, which may affect the wind velocity. The effect caused by the gap is limited in range, as the gap has no dramatic effect on the wind velocity on the opposing side. By simulation, it was found that the effect of a 6–10 m gap on the sound environment is most obvious within 0–20 m of the gap. For the same measuring points, the attenuation of SPL increases by 1.6–1.7 dB around a gap, while the attenuation on the opposite side would increase by 0.6–0.7 dB. The T30 around the gap is shorter than the place without a gap, with the difference value of 0.1–0.3 s. This is because the existence of the gap represents a missing portion of the façade and that portion can be regarded as a complete sound absorption space. Increasing the size of the gap increases its sound absorbing volume, shortening the reverberation time. The T30 on the opposing side of the gap increases by over 0.3 s, but the average T30 in the street decreases by about 0.3 s.
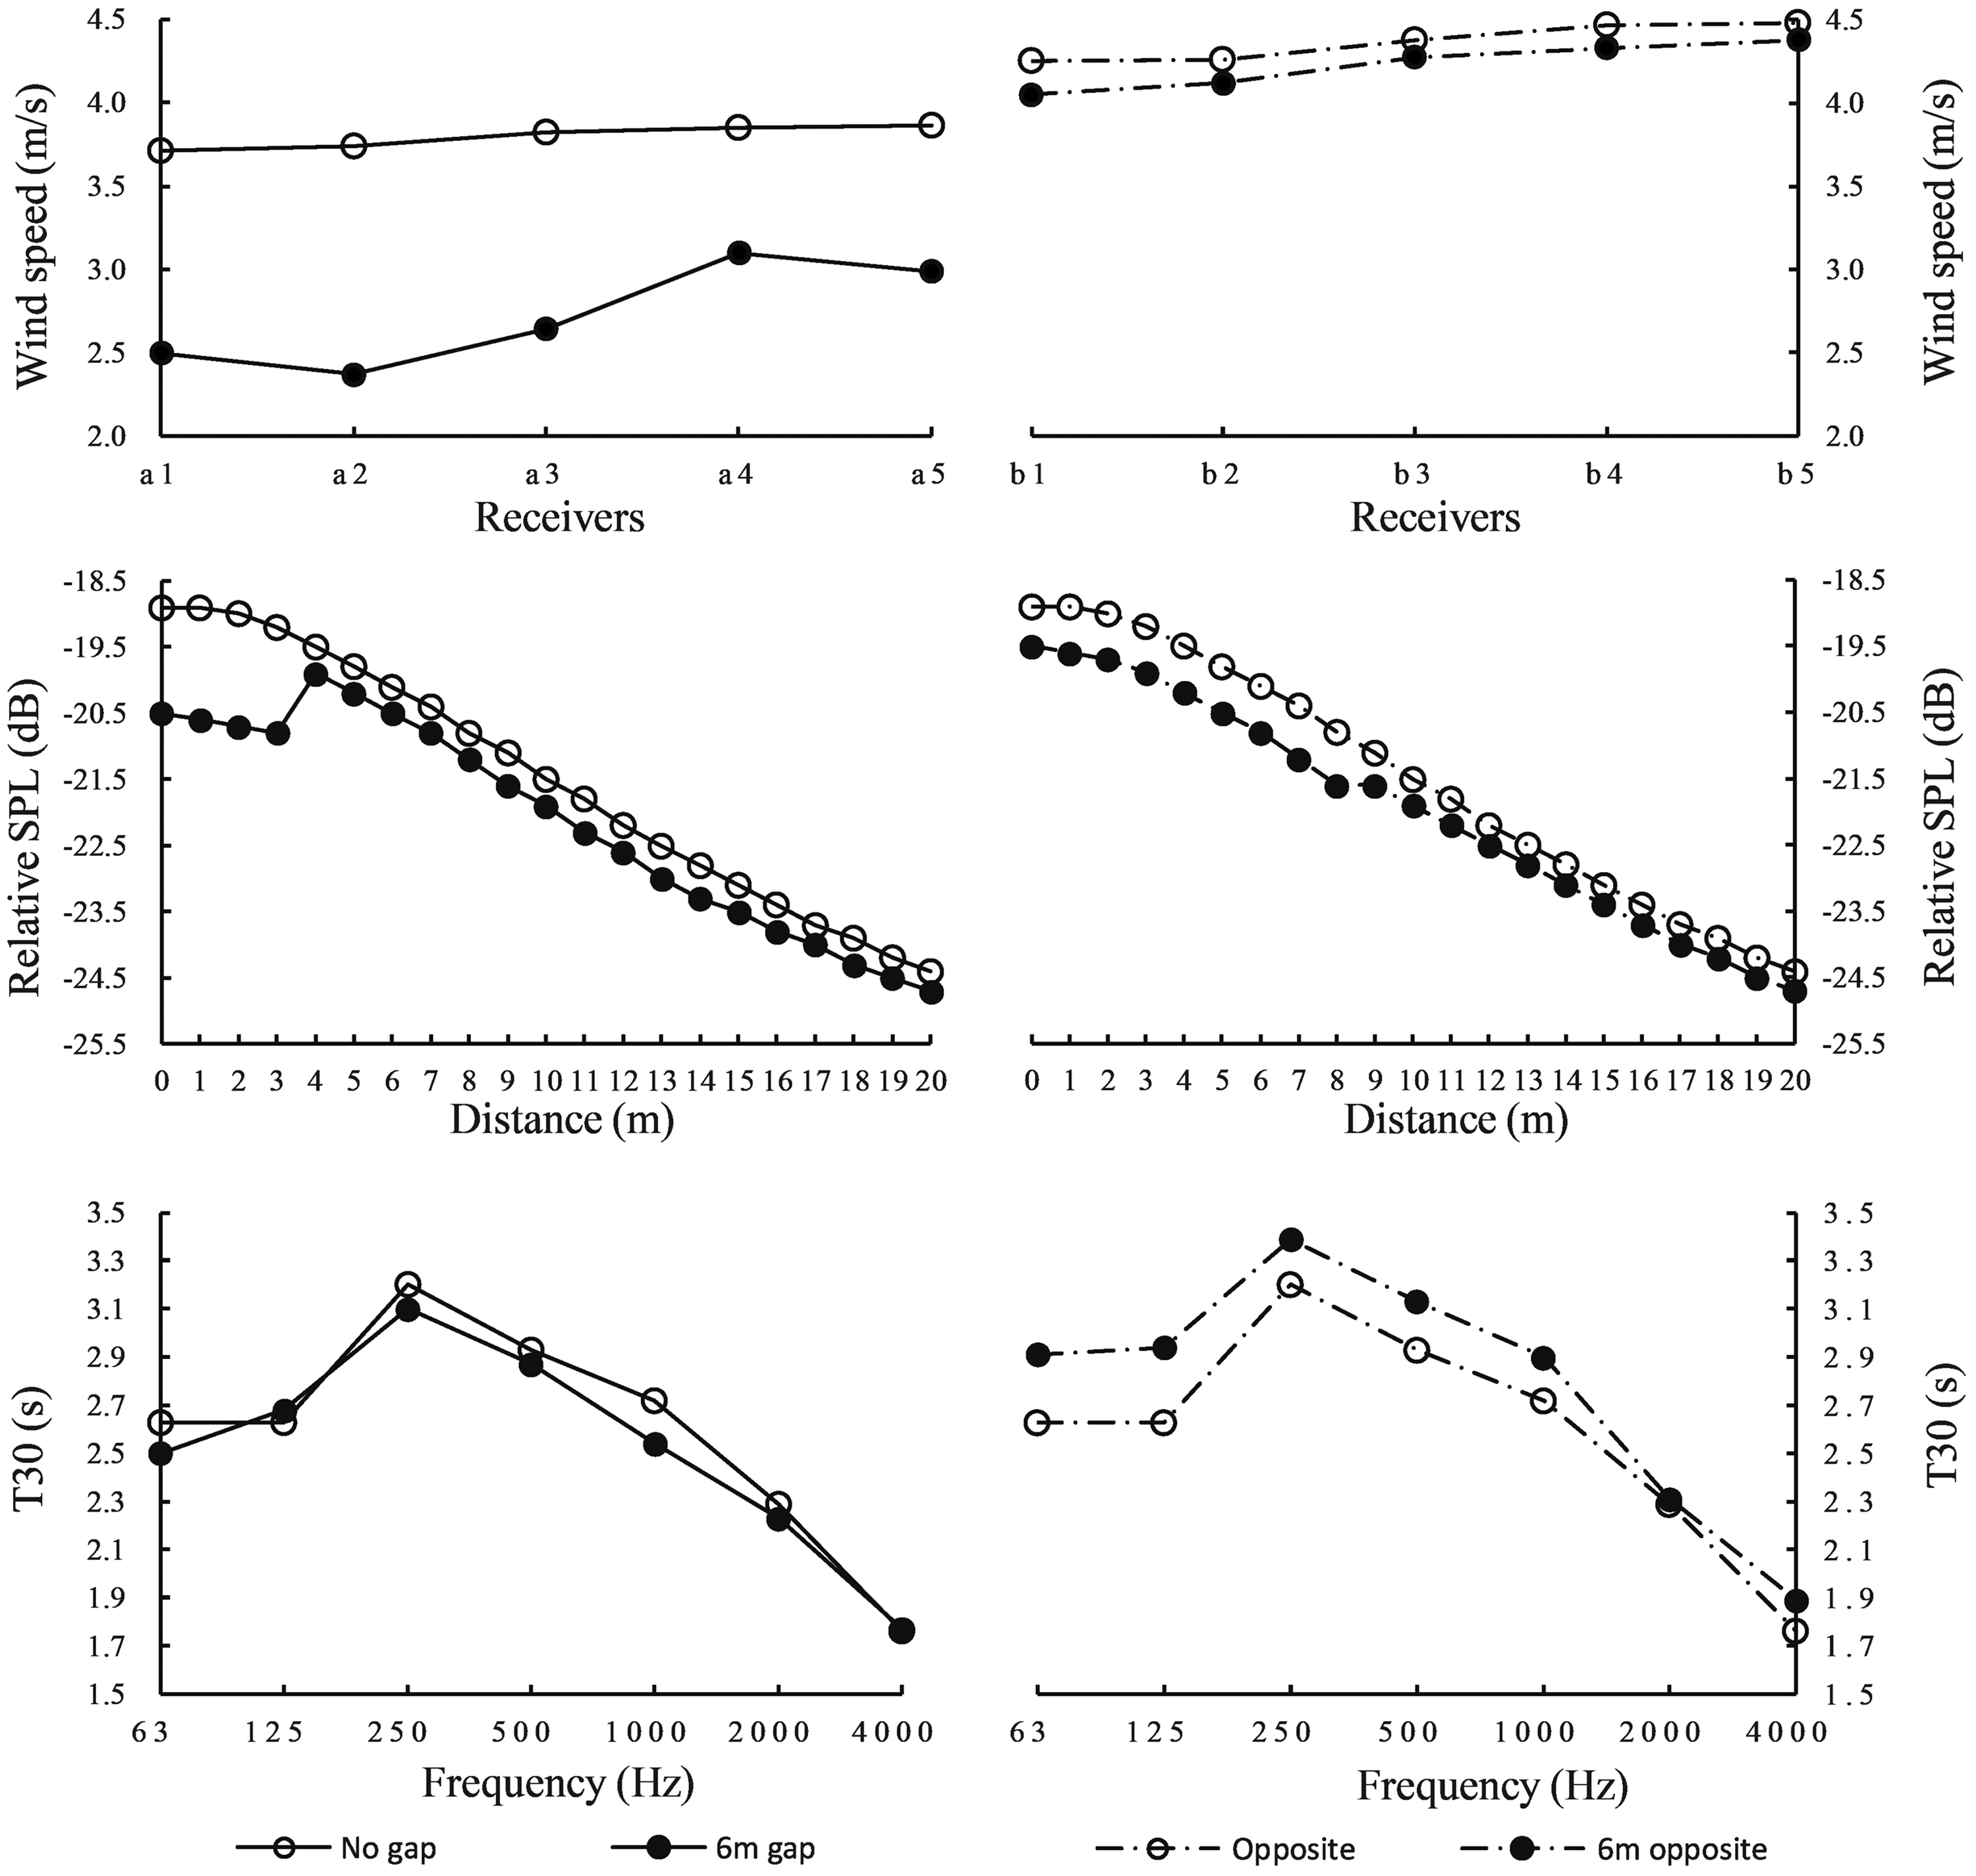
Simulated results of the wind–sound environment with/without a gap.
From this evidence, it can be seen that the existence of an opening has a notable effect on the wind–sound environment in the street. When a street has an opening, both the average wind velocity and the SPL around the opening would be lower, with the differences of the wind velocity reaching 1.0 m/s, while the differences in the SPL can be 1.3–1.6 dB at the opening side and 0.5–0.7 dB on the opposite side. The effect on the T30 depends on the form of the opening. If the opening is an entrance, the T30 around the entrance and its opposing side increases by 0.2–0.4 s, while the average T30 in the street would increase accordingly. If the opening is a gap, the average T30 both around the opening and in the street decreases by 0.1–0.3 s. When a street has an opening, the wind velocity and the SPL near the opening would decrease in varying degrees. This may help improve the wind–sound environment in the street in winter.
Effect of opening width
Figure 11 shows the simulated results of the wind–sound environment in the street with entrances of different widths. With an increase of width, the wind velocity near the entrance decreases; with an increase of the width by 1 m, the wind velocity within 1 m surrounding the entrance decreases approximately by 0.1 m/s. The width of the entrance has a minor effect on the wind velocity on the opposite side. Varying the width of the opening results in differentials of wind velocity less than 0.1 m/s.
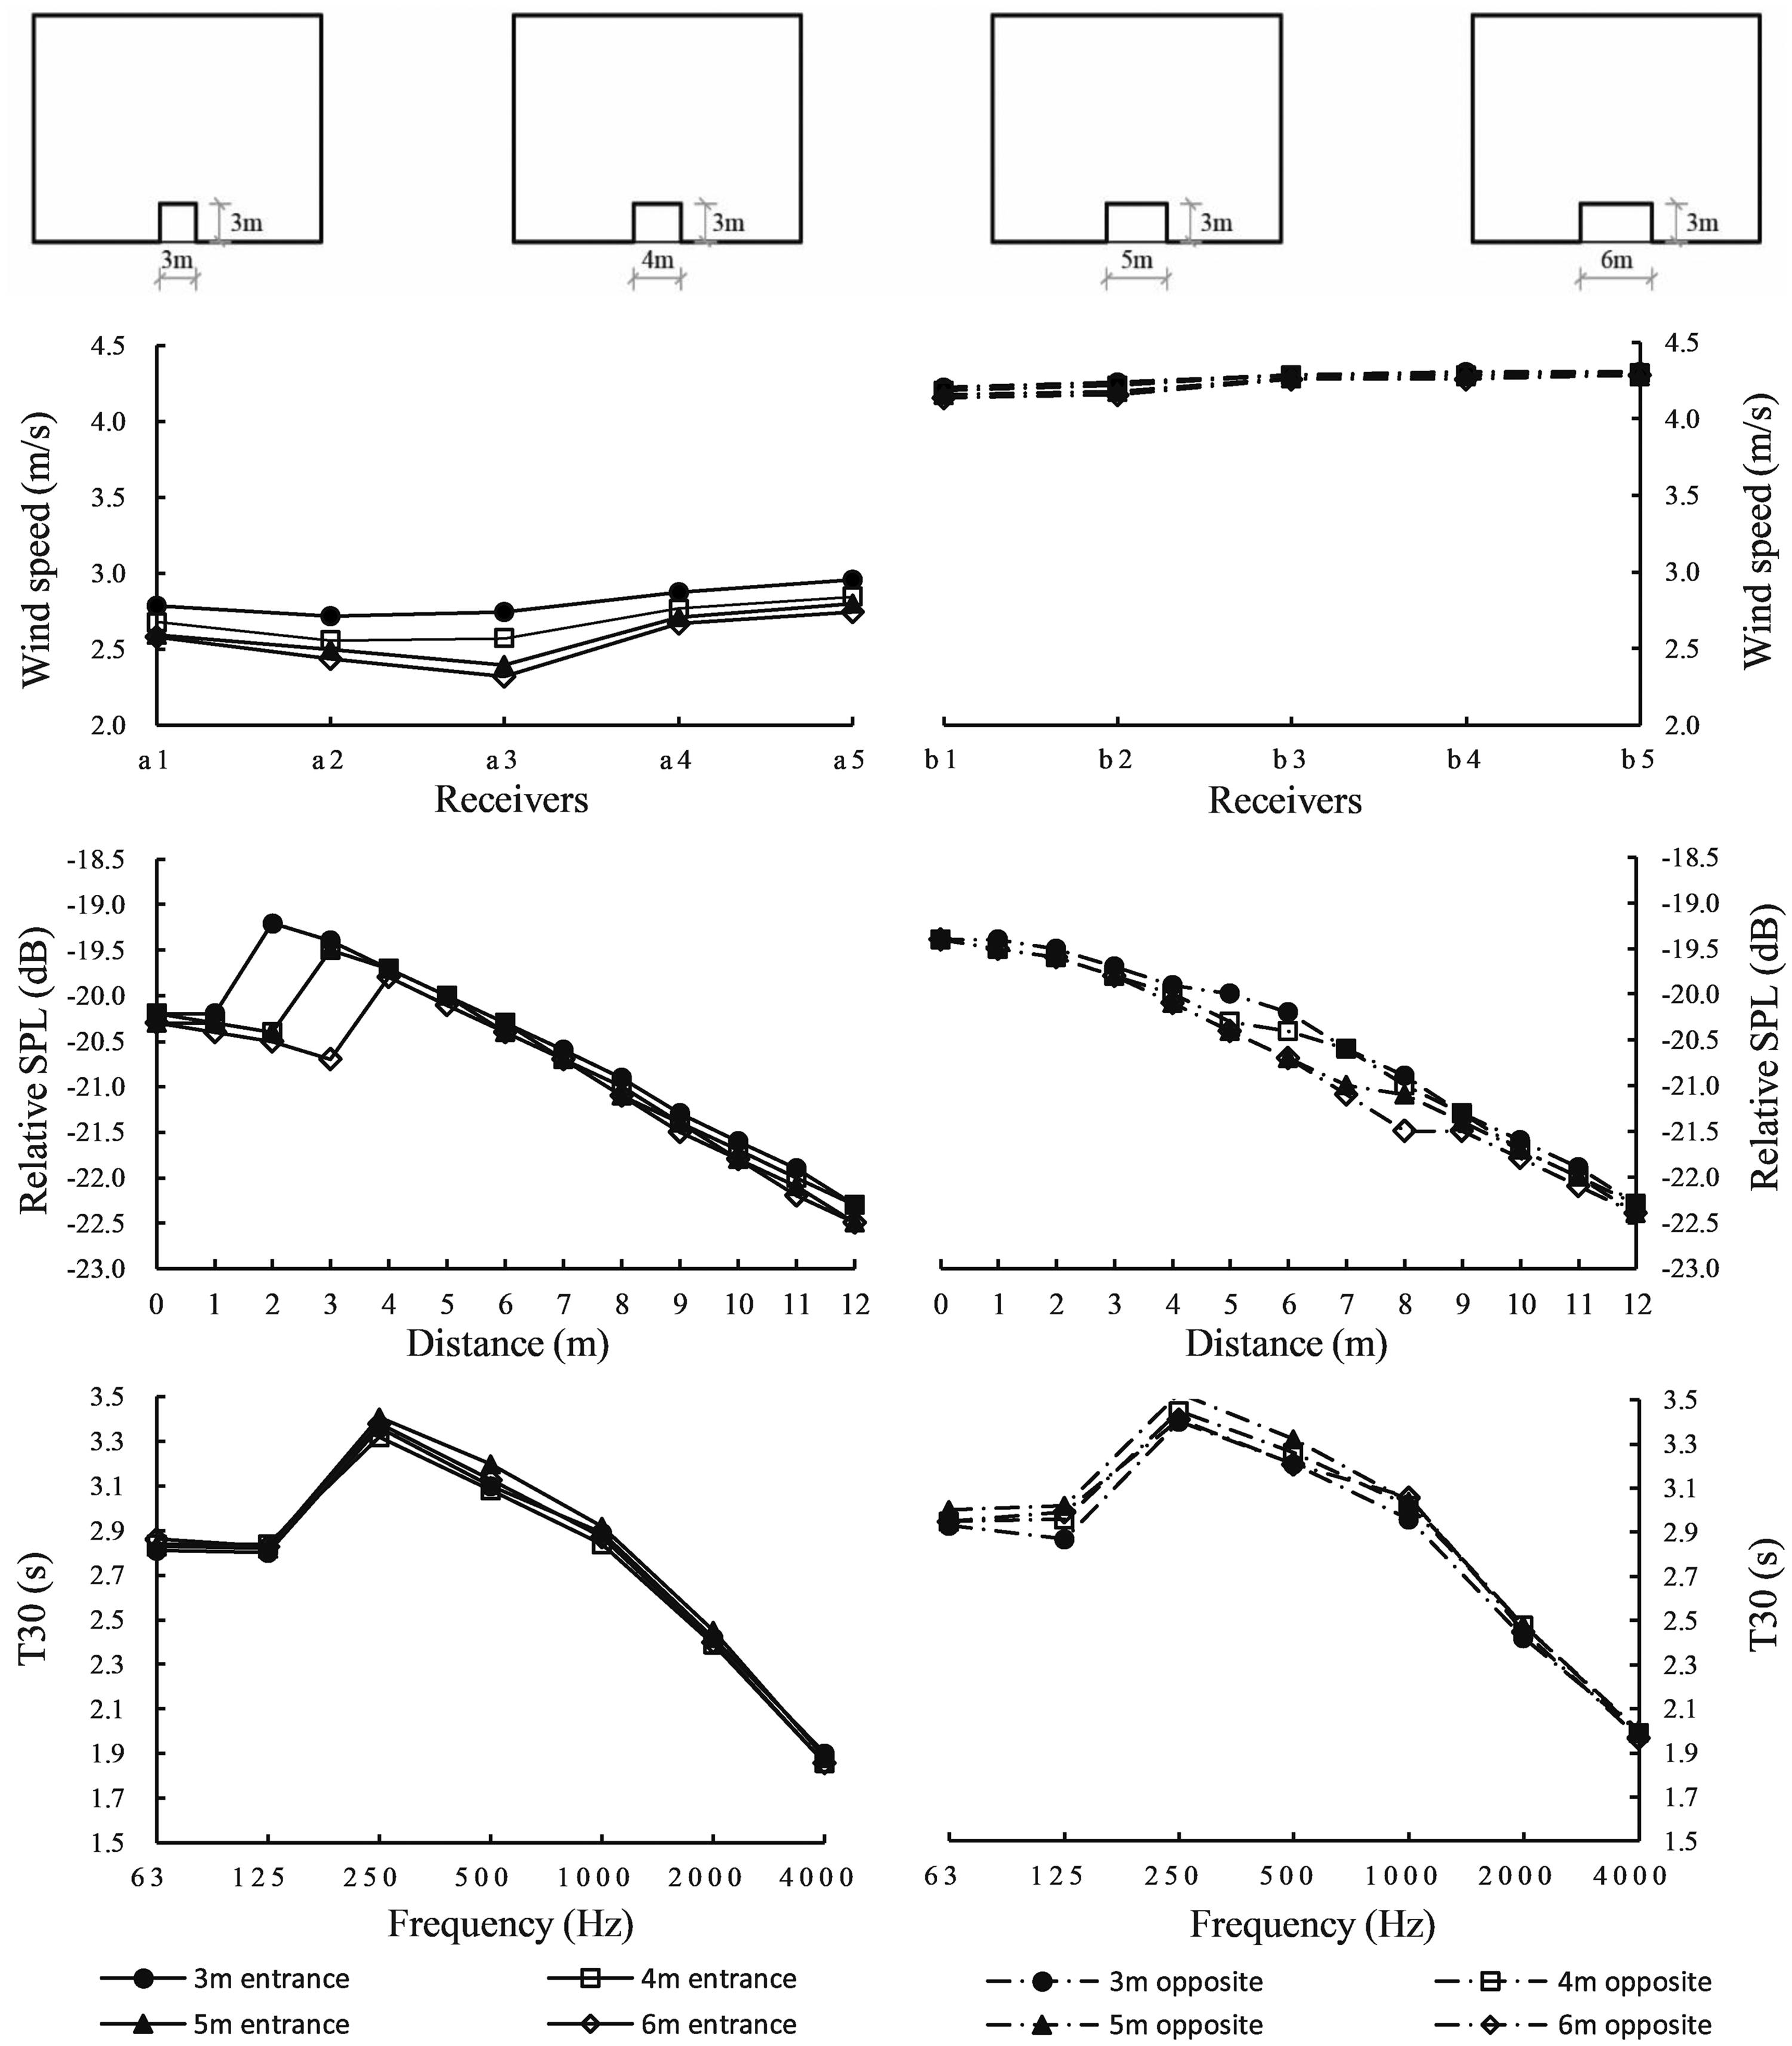
Simulated results of the wind–sound environment with entrances in different widths.
Within a range of 12 m from the centre of the entrance, the differences of the SPL for different entrance widths are only approximately 0.1 dB. Increasing an entrance's width changes its influence range on the sound environment greatly (0.5–1 m). Moreover, as the width increases, the SPL attenuation on the opposing side correspondingly varies. However, this influence is confined to 4–9 m away from the centre of the entrance, which means that the sphere of influence is delayed on the opposite side. With every 1 m increase of width, the influence distance would increase by 0.5 m accordingly. However, even with this influence, the variation differentials of the SPL attenuation are less than 0.2 dB.
Although the transmission of sound from the entrance to the street is not completed instantly, the entrance has little effect on the T30 due to the limited width. The differences of the T30 at the different frequencies are less than 0.1 s at most. On the opposing side of the entrance, the differences are slightly bigger, approximately 0.1–0.2 s.
Figure 12 demonstrates the simulated results of the wind–sound environment in the street with gaps in different widths. With an increase of gap width, the differences of the wind velocity on both the entrance and opposing sides increase. With an increase of width by 1 m, the wind velocity would increase by 0.1 m/s. Although this will cause the fluctuation of the wind velocity, the variation of the average wind velocity is not very obvious. A fluctuation in wind velocity on the opposing side also occurs to some extent, but under different widths, the differences of the wind velocity are 0.2 m/s at most.
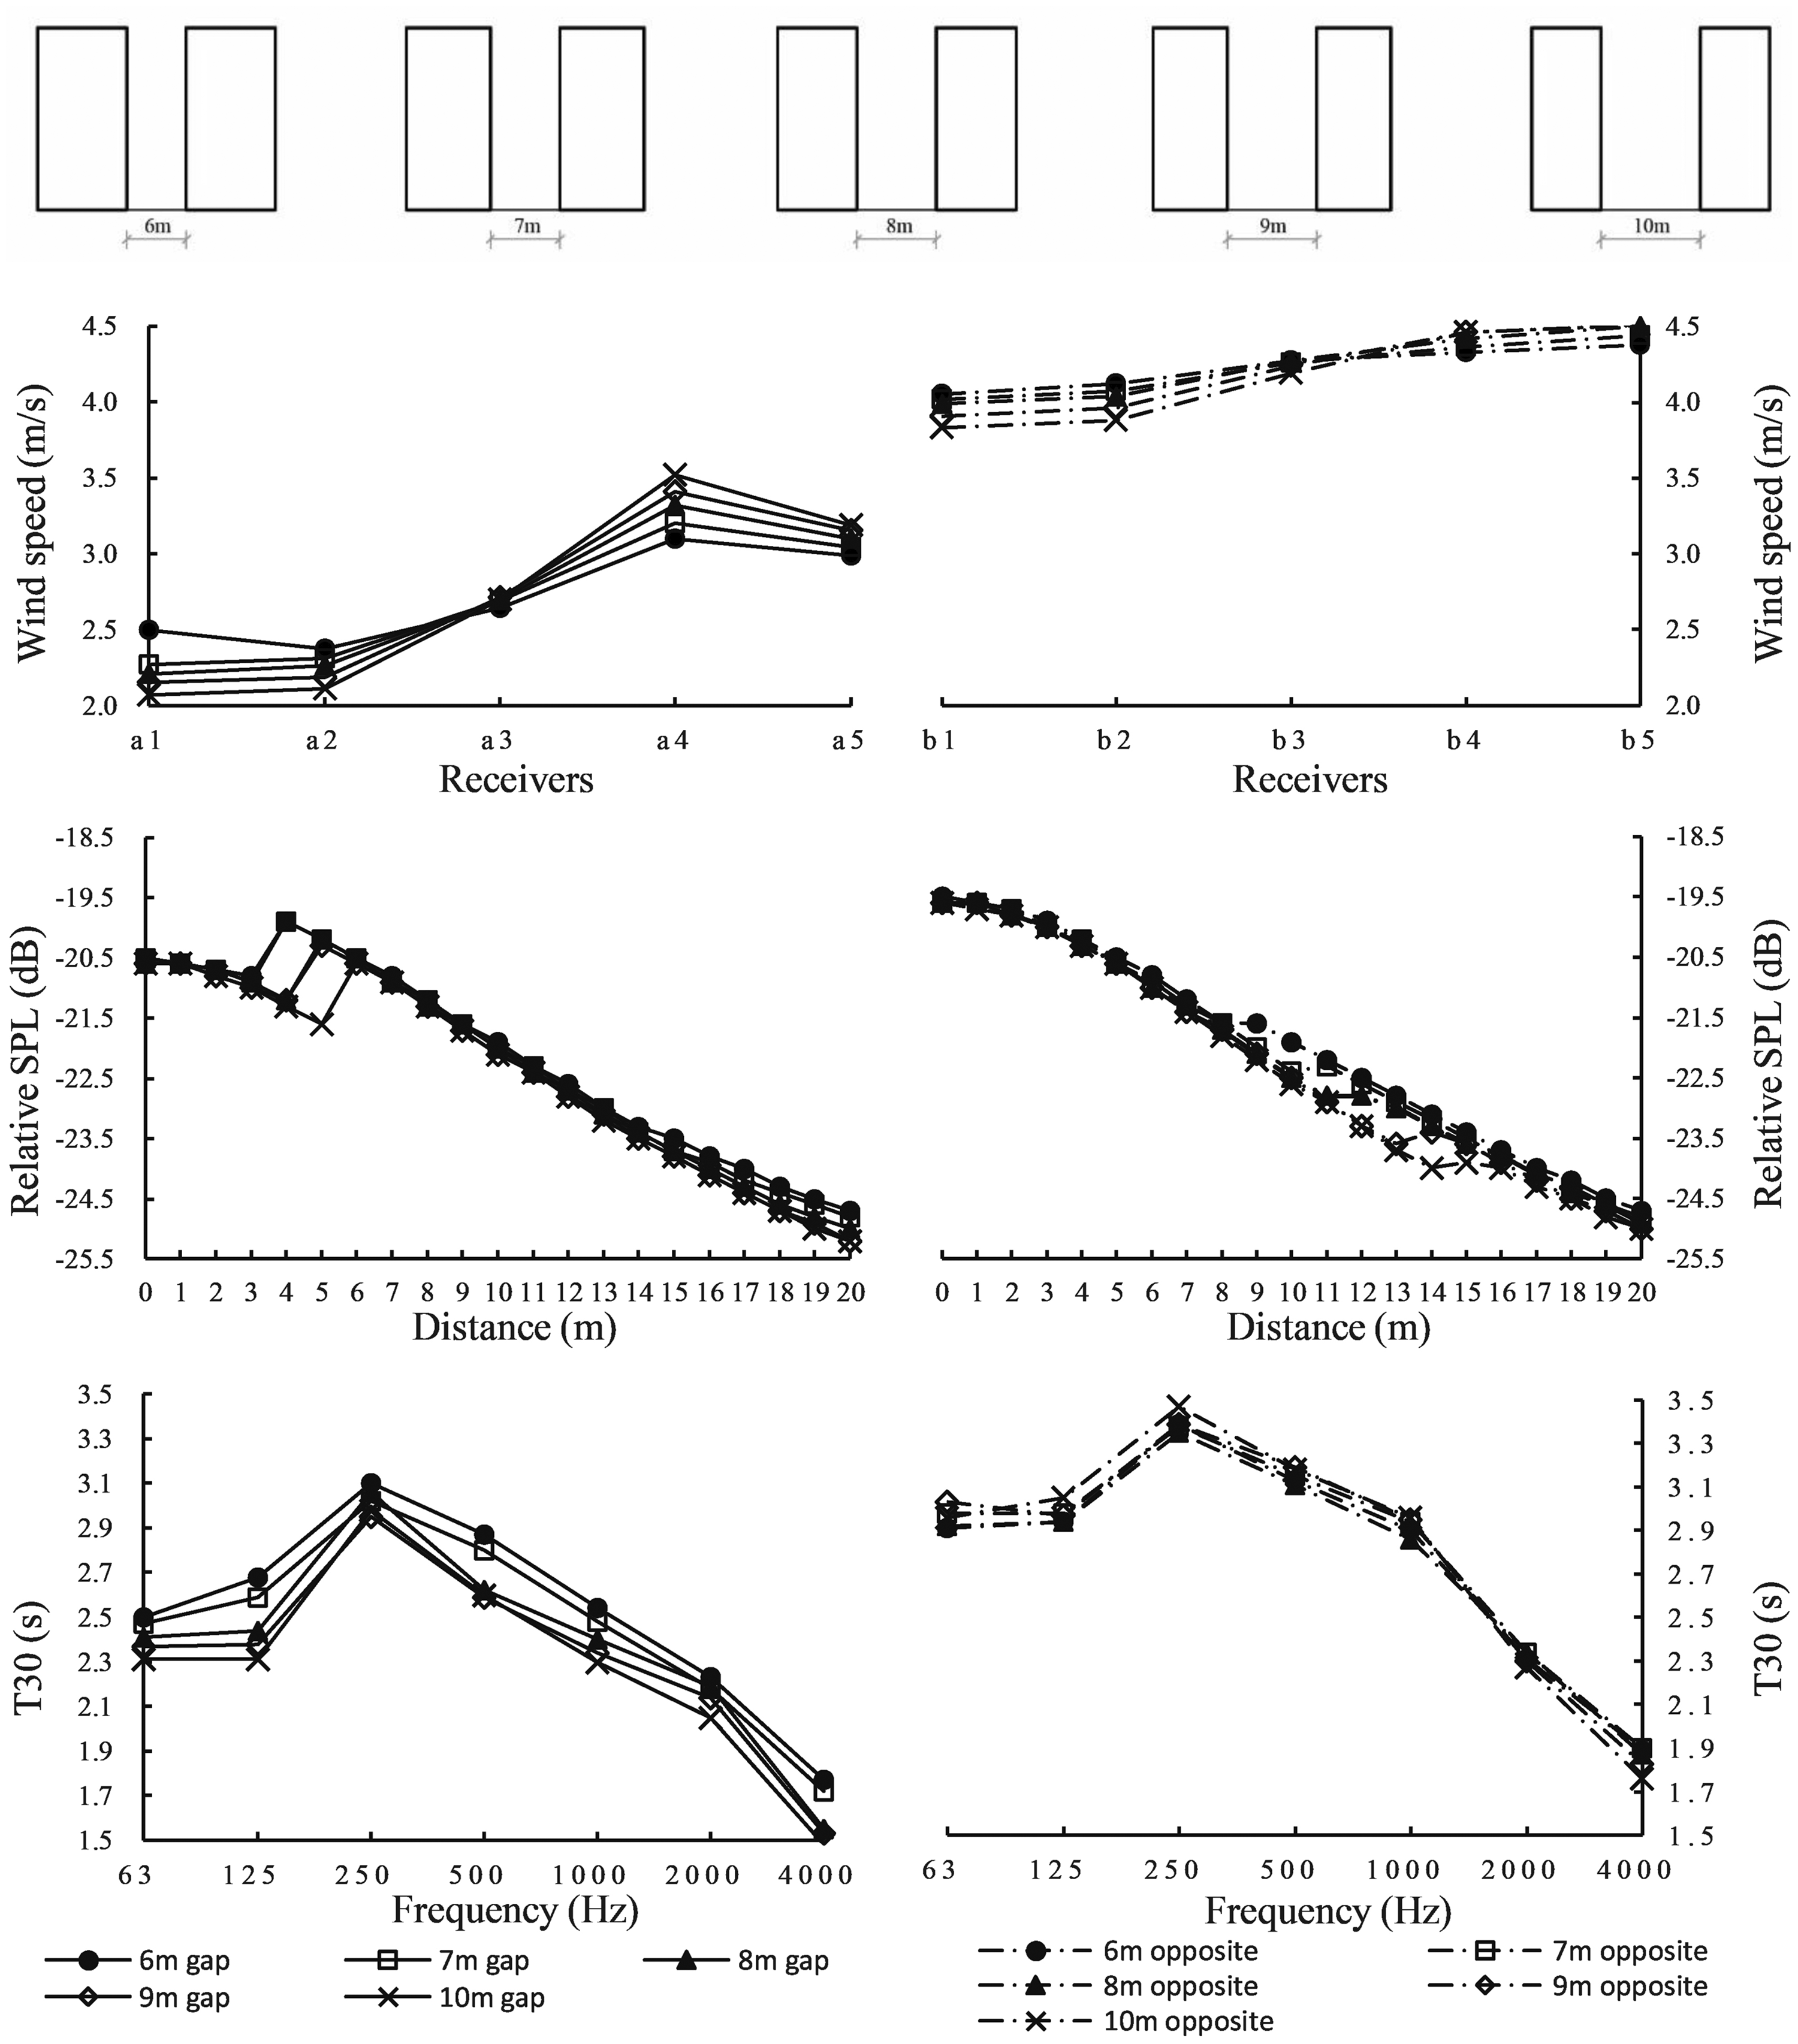
Simulated results of the wind–sound environment with gaps in different widths.
Within a range of 20 m from the centre of the gap, the differential of the SPL around different width gaps is less than 0.1 dB. However, as the width increases, the influence range of the gap to the sound environment is different, with results indicating that the influence range is approximately 1 m surrounding the gap. On the opposing side, the SPL attenuation varies distinctly with increasing gap width, with the influence distance confined to within 8–16 m of the centre of the gap. With an increase of every 1 m in width, the influence distance would increase by 2 m.
The width also has some degree of effect on the T30, the transmission of sound from the street through the gap will incur some delay. The larger the opening is, the more obvious the delay is. With an increase in width by 2 m, the T30 on the opposing side increases by 0.1 s. Because sound with a higher frequency is more likely to be absorbed in transmission, the existence of a gap intensifies the absorption of this portion of the sound. Therefore, the T30 of the sound with frequency ≥2000 Hz is even shorter.
From this, it is evident that the width of the opening affects the wind–sound environment around the opening. For an entrance, increasing the width by 1 m resulted in a decrease in the wind velocity within a 1 m range around it by 0.1 m/s. Meanwhile, the influence distance to the sound environment increases by 0.5 m correspondingly. However, the width of the entrance has little effect on the SPL and T30. The maximum differential of the SPL is 0.1–0.2 dB and that of the T30 is merely 0.1 s. Because the width of an entrance has little effect on the sound environment, it is sufficient that the design of an entrance can satisfy the requirements of the wind environment. In the case of a gap, an increase of width by 2 m results in an increase in wind velocity of 0.2 m/s, but the variation of the average wind velocity is relatively small. Moreover, with an increase of width by 2 m, the influence distance to the sound environment increases by 2–4 m, while the T30 changes by 0.1 s. The width of a gap has little effect on the SPL, with the maximum difference of the SPL being only 0.2 dB. As the width of the gap has an effect on the wind environment, a gap's width should not be too large in order to avoid the fierce fluctuations of the wind. In circumstances where such large gaps are necessary, a number of smaller gaps can be added for the purpose of improving the wind–sound environment in the street.
Effect of the form of opening
Figure 13 demonstrates the comparisons of the wind–sound environment around the opening between different types of openings. When the width is the same, the average wind velocity around the gap is roughly the same. The wind velocity near the gap is 0.4 m/s larger than that near the entrance, while the wind velocity on the opposing side shows no significant change, meaning that the influence of the type of the opening on the surrounding wind environment is very limited.
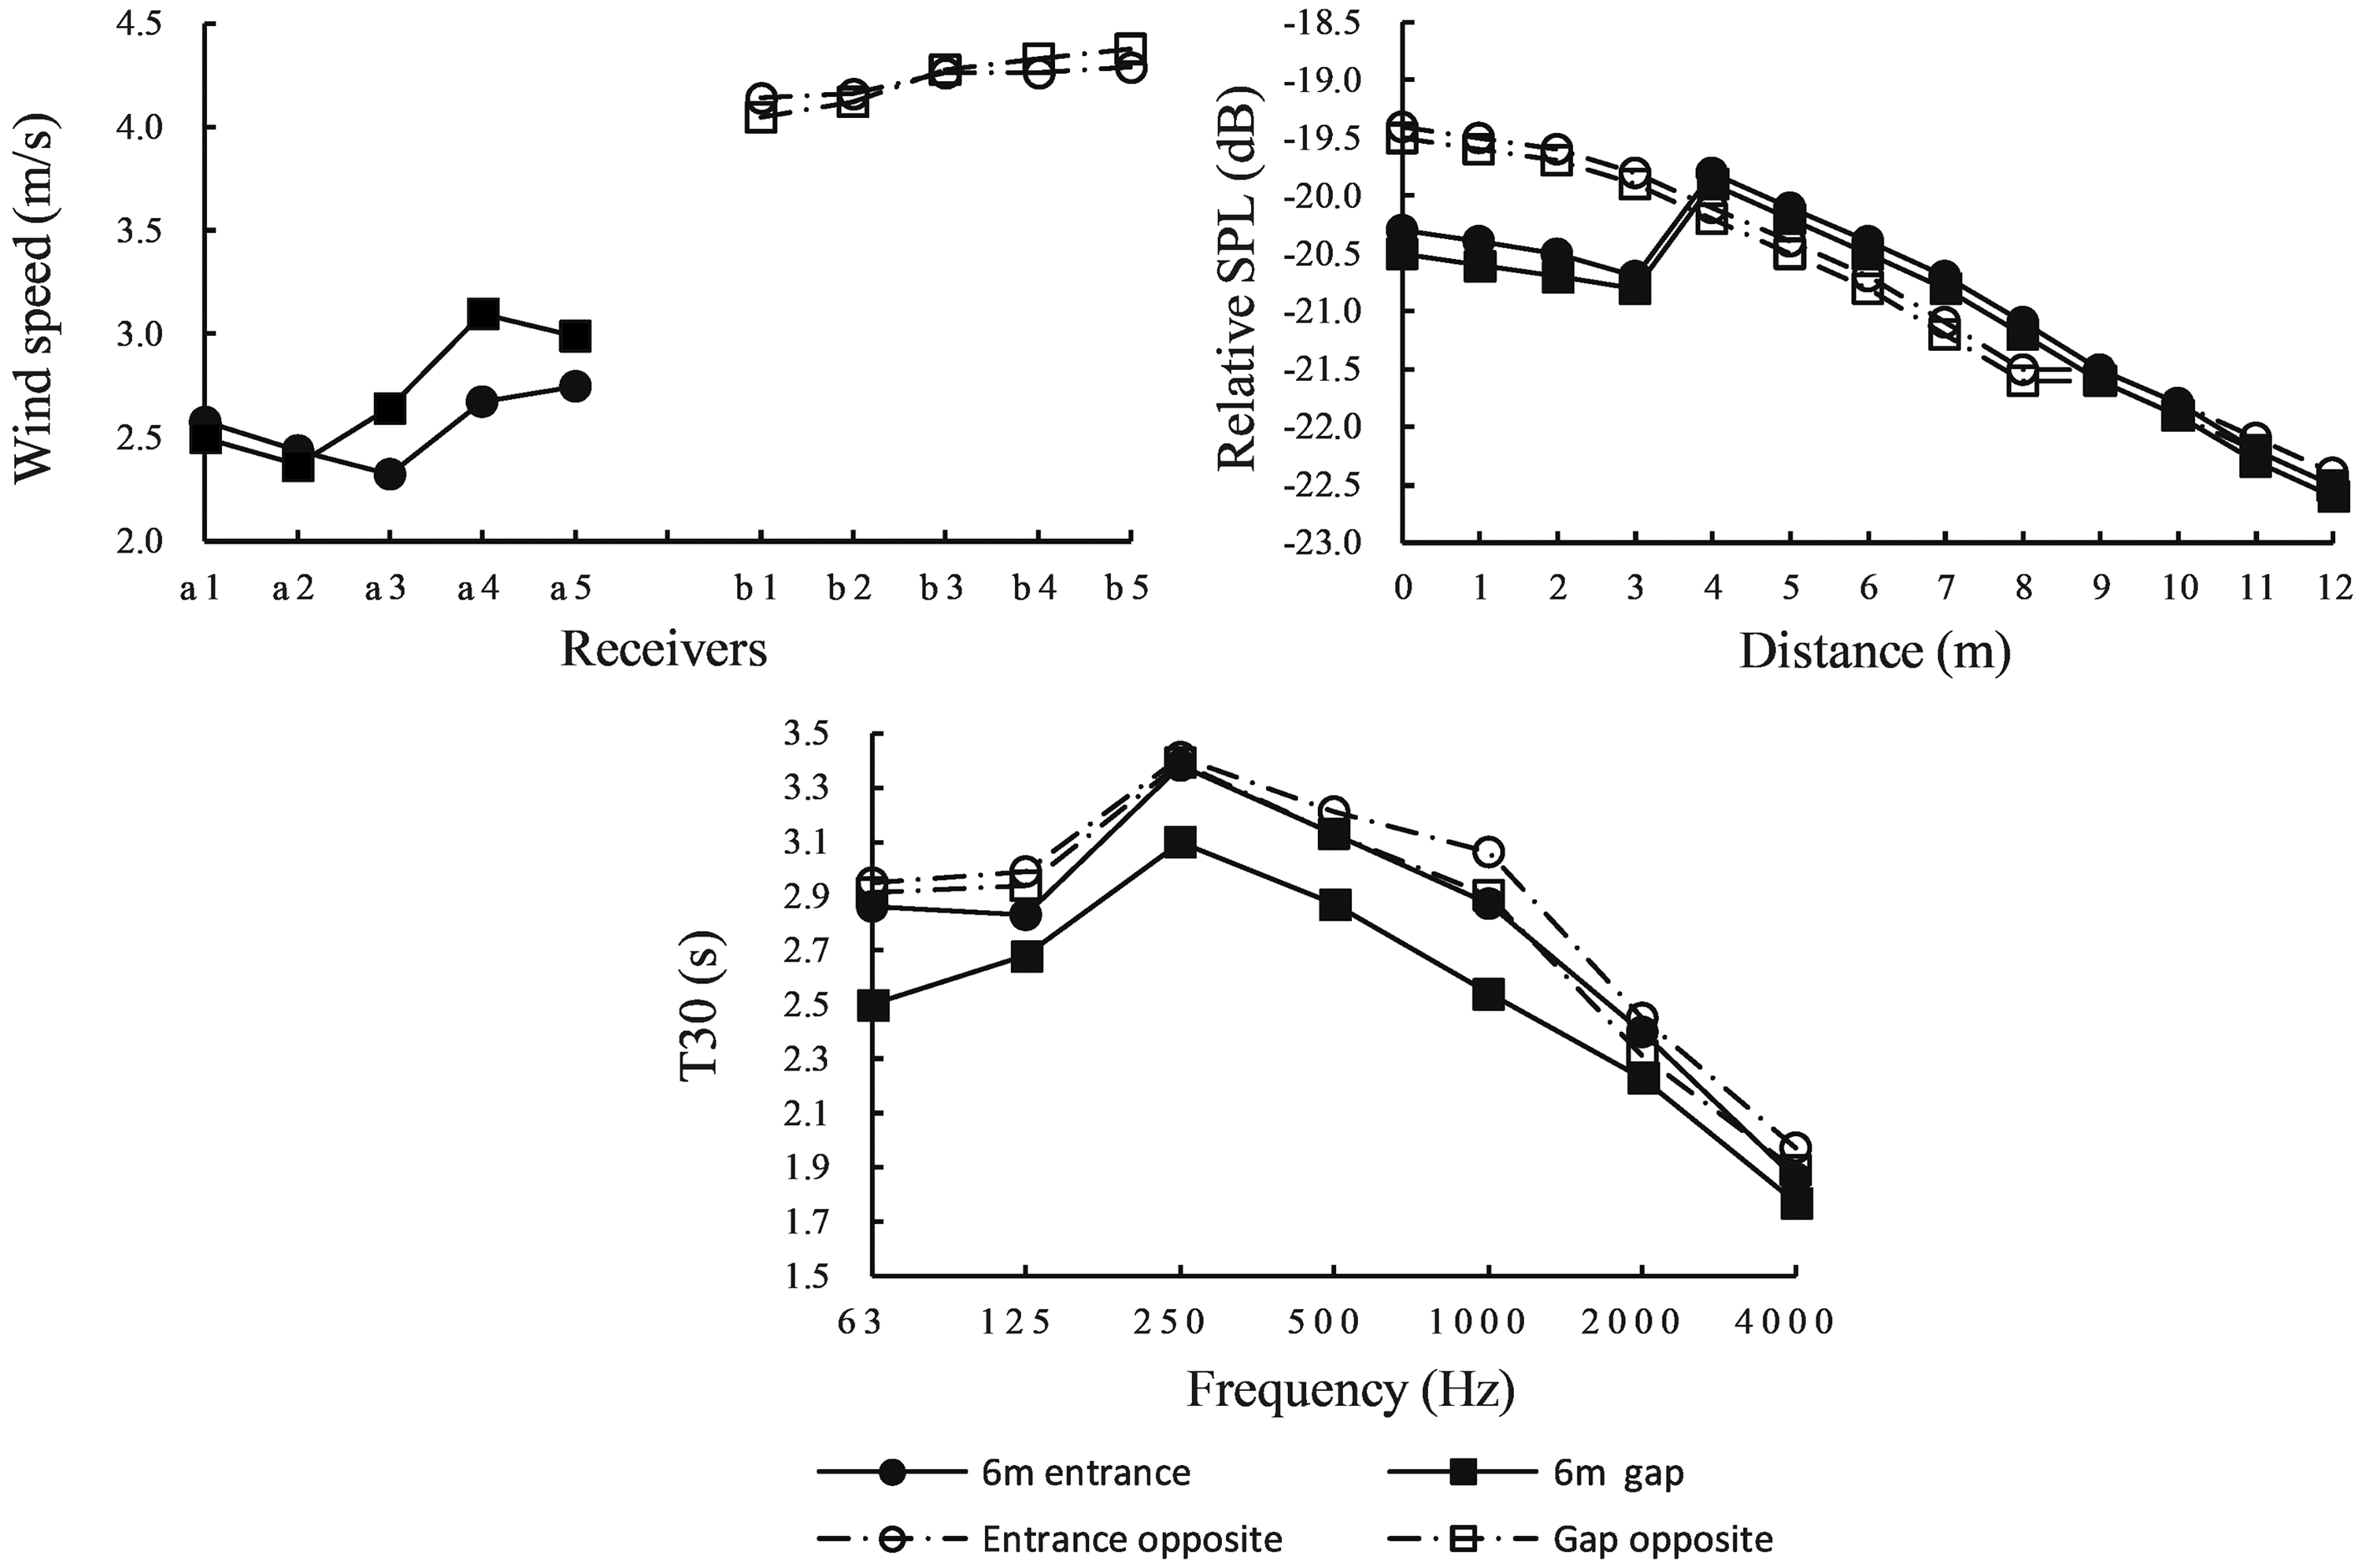
Comparisons of the wind–sound environment between the entrance and the gap.
When the width is the same, the attenuation trend of the SPL near an entrance equals to that of a gap, and their influence range is also identical to each other except within the range 0–3 m away from the centre where the SPL near the gap is 0.2 dB lower. When the width is the same, the T30 of the opening for different frequencies is generally the same. However, the T30 around the entrance is obviously longer than that around the gap, with an average difference of 0.3–0.4 s. With increasing frequency, the difference in the T30 continuously decreases. When the frequency is ≥2000 Hz, the difference is only 0.1 s. Additionally, the T30 on the opposing side is longer than the opening side.
The type of opening has a certain degree of effect on the wind–sound environment in the street. Compared with an entrance in the same width, the gap intensifies the fluctuation of the partial wind velocity, but the overall wind environment of the street is the same. The wind velocity at the gap is 0.4–0.6 m/s larger than that at the entrance. At the same time, the average T30 at the gap is approximately 0.3 s shorter than that at the entrance.
Conclusions
Through field measurements and numerical simulation, this paper analyses and demonstrates that the existence, size and form of openings have different effects on the wind–sound environment in the street.
The opening has a significant effect on the wind–sound environment in the street. Compared with a street without openings, the attenuation of the average wind velocity and the SPL around the opening have different varying degrees, which is beneficial to the improvement of the winter wind–sound environment in the streets of severe cold regions. The differences of wind velocity with/without the opening can be as high as 1.0 m/s, while the differences of the SPL are 1.3–1.6 dB on the opening side and 0.5–0.7 dB on the opposing side. The average T30 would increase when the street has an entrance and the average T30 would decrease accordingly if the opening is a gap. The size of the opening causes a certain effect on the wind–sound environment in the street. When the width of an entrance widens by 1 m, the wind velocity within a range of 1 m decreases by 0.1 m/s and the influence range to sound environment increases by 0.5 m. In contrast, the width of the entrance has little effect on the SPL and the T30. Although there are no obvious differences as to the average wind velocity around the gaps in different widths, the differences on both sides of the gap increase by 0.2 m/s with the gap width increasing by every 2 m. Meanwhile, for the same increase, the influence range on the sound environment increases by 2–4 m and the T30 changes by 0.1 s. Nevertheless, the width of the gap has little effect on the SPL. When the width is the same, the effect caused by entrances and gaps on the wind–sound environment varies. The gap intensifies the fluctuations of the local wind velocity, while the average wind velocity on the gap side is 0.4 m/s higher than that on the entrance side. Additionally, the average T30 near the gap is 0.3 s shorter than that near the entrance.
Footnotes
Declaration of conflicting interests
The author(s) declared no potential conflicts of interest with respect to the research, authorship, and/or publication of this article.
Funding
The author(s) disclosed receipt of the following financial support for the research, authorship, and/or publication of this article: This work was supported by the National Natural Science Foundation of China (Grant No. 51438005) and the Fundamental Research Funds for the Central Universities (Grant No. HIT.KISTP.201419).