



Abstract
A better understanding of the relationship between the built environment and urban processes is central in guiding urban processes in more sustainable trajectories. Of particular importance to this endeavour is the idea of urban types. However, on closer scrutiny, while such types may capture the symbolic dimension of urban form, they frequently do not capture its performance or functional dimension. This prohibits precise policy formulation on the topic. This paper first presents a methodology for generating urban types relevant to urban practice (using analytical and statistical methods) and, second, an empirical test of the differences in performance concerning their influence on the presence of people in public space (an essential driver of many other urban processes). For this reason, a large (and to our knowledge unique) pedestrian survey of three European metropolitan areas was conducted and used to test the performance of the urban types developed. The results prove that the methodology for developing the types is robust, as it picks up generally recognised spatial patterns in all three cities. Further, the types were able to explain the intensity of pedestrian flow, its spatial distribution and fluctuations of intensity in space and time. These are vital steps forward and provide more useable typologies in urban planning and design practice.
Introduction
General background and aim
In a rapidly urbanising world, the challenge is to better understand the relationship between the built environment and urban processes so as to guide urban processes in more sustainable trajectories. Research aimed at doing this can be divided into two major directions: (1) urban morphology, typically applying qualitative and descriptive approaches (cf. Oliveira, 2016) and (2) spatial analysis, displaying typical analytic and quantitative methodologies (cf. Batty, 2013). In this paper, we continue a long-term endeavour to bring these approaches closer to each other under a common framework of spatial morphology (Berghauser Pont and Marcus, 2014; ibid., 2015). Of particular importance to this endeavour is the idea of urban types, central to urban planning and design (cf. Kostof, 1991). However, on closer scrutiny such types are typically heuristic and vague, capturing the symbolic dimension rather than the performance or functional dimension. Therefore, the aim of this paper is to develop a systematic and rigorous methodology for generating urban types relevant to urban practice and to then empirically test the differences in performance when it comes to their influence on the presence of people in public space, which is an essential driver of many other urban processes (cf. Hillier et al., 1993). For this reason, a large (and to our knowledge unique) pedestrian survey of three European metropolitan areas was conducted. 1 The three metropolitan areas included in the study – Stockholm, Amsterdam and London – were selected because, on the one hand, they have certain socio-economic and historical similarities, while, on the other, they vary in their spatial structure.
The paper is structured as follows: first, the role of typologies in general is given, plus the specific choices for generating types related to the aim of this paper; second, the methods for actually generating the types and collecting the pedestrian data are discussed; and third, the results are presented so as to draw conclusions, discuss the importance of these results for practice and formulate directions for further research.
Traditions in the development of urban types
Typologies play a role in both urban planning and design practice and in public debate on urban development. However, analytically we argue that they remain weak in acknowledging the complexity of real urban environments. Typical typo-morphological studies use descriptive and deductive methods. This yields much understanding of how cities, urban areas and buildings have evolved over time, but does not immediately support more stringent comparisons or tie such descriptions to their performance (Moudon, 1994). Besides, many authors have expressed difficulty in describing the contemporary city, which may be characterised as having more diffuse urban forms (cf. Prosperi et al., 2009) and, with some exceptions (cf. Levy, 1999), few have focused on developing methods to do this (Oliveira, 2016).
It is argued that quantitative methods can play an important role in describing these more diffuse urban forms (Serra, 2013), but they have played a limited role in typo-morphological studies, with occasional exceptions such as the work of Martin & March from 1972 (Moudon, 1994). Only recently, have studies of urban morphology once again aimed for classifications based on quantitative description of its spatial elements (cf. Berghauser Pont and Haupt (2010) and Colaninno et al. (2011) classifying buildings; Vialard (2014) classifying street-blocks; Barthelemy (2015), Gil et al. (2012) and Serra (2013) classifying streets; Fusco and Araldi (2017), Song and Knaap (2007) and Steiniger et al. (2008) classifying urban fabrics). Because the aim of this paper is to develop a typology relevant to urban design practice, it should combine both fine-scale data, incorporating premises relevant to urban design practice and large-extent analysis, to allow the study of larger-scale processes (Batty, 2007). This has implications for the units of study, the descriptive measures chosen and the scale(s) of analysis. First, the types need to be developed using morphological units that are important to design practice and which can be grouped into two distinct urban spaces: (1) a continuous and publicly accessible space of streets, primarily used for movement and (2) a discontinuous space, comprising plots and buildings used for the generic function of long-term occupation (Hillier, 1996). Second, these units need to be treated separately, so as to study their role in urban processes alone and in combination. It could be argued that combining them all into one typology might be more effective for descriptive purposes, but for generative or urban design purposes it is important to keep the design components apart. Third, the measures used to generate the types need to capture both the form and pattern of the (local) built environment and its position in the larger urban context.
These three requirements have led to the choice of two morphological units: streets and buildings. To describe urban space in relation to its larger context, the configurational approach (as used in space syntax) has proven effective, especially in predicting pedestrian movement (cf. Hillier et al., 1993; Peponis et al., 1997; Read, 1999a). To describe the form and pattern of the local built environment, the combination of two density measures (as proposed by Berghauser Pont and Haupt, 2010) has proven effective. This allows for numerically distinguishing between building typologies; an example is high rise development from block typologies. Moreover, density is often discussed as a good indicator of the intensity of activities and movement in cities (cf. Jenks and Burgess, 2004; Ozbil et al., 2011) and therefore especially relevant to our purpose.
Key measures for generating and testing urban types
Following the latest methodological developments in the field of space syntax, angular betweenness centrality is used in this paper to describe street configuration. It measures the sum of the shortest path overlaps for a particular street segment, between all pairs of origins and destinations. The shortest path is defined as the path with the least angular distance. Angular distance has proven more powerful in predicting pedestrian movement than measures using metric or topological distance (Hillier and Iida, 2005; Hillier et al., 2012; Turner, 2007). This has been confirmed in detailed observational studies showing that people tend to choose paths with the least angular deviation (cf. Conroy Dalton, 2003). The angular betweenness value of each street segment can be calculated by considering the shortest paths between all other streets in the network (global betweenness) or only between those within a certain radius (local betweenness). This results in a large number of possible calculations for different radii of analysis.
The two key density measures used in this paper are floor space index (FSI 2 ) and ground space index (GSI). FSI is used to describe the total built floor space in an area, while GSI describes the division between built and non-built land in an area. Berghauser Pont and Haupt (2010) have shown how GSI also describes the interface between buildings and streets or, to put it another way, between public and private space. This is argued as important for active street life (cf. Hanson, 2000; Jacobs, 1961). Because we are interested in density as a variable that captures how spatial form structures people and things in space, rather than the density on each plot or block, a measure of accessible FSI and GSI is used. This calculates the total amount of built floor space or built land that can be reached within a set distance threshold. This is then divided by the total land area that can be reached within the same distance threshold. The distance threshold used in this paper is 500 metres because this is a distance that most people are willing to walk (Gehl, 2010).
To test the performance of the urban types in terms of the presence of people in public space, the most commonly used variable is the total number of people walking a street for a defined period of time. In this paper, we refer to this as the intensity of pedestrian flow 3 for the count of pedestrians during a whole day and fluctuation of pedestrian flow when discussing hourly changes. The latter describes the urban rhythm, contributing to the temporal continuity and distinctiveness of urban places (cf. Wunderlich, 2008).
Summarising the above, angular betweenness centrality is used as a measure of distance that describes space as part of movement routes. FSI and GSI are used as measures of density, which describes space that can act as a destination. It thus induces movement, but also generates movement due to its concentration of people and things. These will be used as input variables to generate types, which will then be related to intensity and fluctuation of pedestrian flow.
Overall methodology for generating and testing urban types
This section will describe the main methodological steps taken in this study: (1) spatial analysis to calculate street centrality and built density for Stockholm, Amsterdam and London 4 ; (2) statistical clustering methods used to generate the types; (3) gathering of empirical data on pedestrian movement; and finally, (4) statistical analysis to test the performance of the generated types in relation to pedestrian movement. 5
Spatial analysis
Angular betweenness centrality is calculated for the non-motorised street network of each city.
6
This includes all streets and paths that are accessible for people walking, including those shared with vehicles and bicycles. Because the aim of this paper is to obtain a description that can also explain the intensity of pedestrian flow, the radii included for analysis are close to the more local scales of pedestrian movement with a maximum of 5 kilometres. This results in 10 different radii, from 500 metres to 5 kilometres at 500 metre intervals using PST.
7
Angular betweenness centrality (B) is calculated using the following equation
8

For the accessible floor space index (AFSI), first the gross floor area (GFA) for each building polygon is calculated by multiplying the average building height
9
by the built area (BA). Next, the accessible GFA and accessible BA are calculated using the equation for attraction reach (AR), as implemented in PST

Accessible floor space index (AFSI) and accessible ground space index (AGSI) are then calculated as follows


Cluster analysis
To generate the street types, k-medoids unsupervised cluster analysis is used (Tan et al., 2005). This means we did not pre-define the final number of clusters, but instead used silhouette plots to determine their optimal number. 11 Because the input variables show multicollinearity and cluster analysis is sensitive to this (Wilmink and Uytterschaut, 1984), a principal component analysis (PCA) is conducted prior to clustering, using the method proposed by Serra (2013). Further, the input variables are scaled to avoid unit variance. 12 PCA was done separately for each city, to ensure that the resulting principal components would be meaningful for each one. 13 The PCA reduced the 10 radii of angular betweenness centrality into three principal components in each city, explaining around 90% of the total variance in the original variables. 14 The loadings of the three components show which radii dominate: the first component showed high values at the lower radii; the second component had high values in the middle scales, but dropping value at both higher and lower radii; and the third component showed increasing values at higher radii. This is consistent with the findings of previous work by Serra (2013).
K-means semi-supervised clustering 15 was used to generate the building types. This means that the numbers of clusters (k) and cluster centres were predefined based on earlier work by Berghauser Pont and Haupt (2010: 191). The results were plotted in scatter diagrams so as not to miss any new, emerging clusters. This clearly showed a distinct group of observations with much higher FSI values than any of the clusters defined earlier by Berghauser Pont and Haupt (ibid.). A seventh cluster was therefore added, after which the clustering was repeated.
Empirical data on pedestrian movement and statistical analysis
The pedestrian survey included 20 neighbourhoods per city and was done over a three-week period in October 2017. 16 The areas were selected with the main objective of covering all building and street types. Because we are interested in the isolated effect of urban types on pedestrian movement, we ensured that no big attractors such as train stations or large shopping malls were located on or near the selected streets. Data were collected on a total of 846 street segments but, in this paper, we only used street segments where complete data were available, reducing the total to 789 (a reduction of 7%).
We used detection of anonymised wi-fi signals from mobile phones to record pedestrian movement. Samples of wi-fi signals were collected when devices were searching for wi-fi networks (known as wi-fi probe requests). Each sample included a timestamp, a received signal strength indication and an anonymised ID. This method was chosen because it is technically advanced and appropriate for collecting anonymised big data, as well as GDRP-compliant, 17 meaning that it can be used in all European cities. The detection devices were positioned at every street crossing in the selected areas, and each neighbourhood was monitored continuously for one workday from 6 a.m. to 10 p.m.
Following data collection, the processing included ‘noise’ removal (such as signals from wi-fi printers), scaling 18 and extrapolation (e.g. when a device malfunctioned for a brief period). The data were organised by street segment and hour to produce the two variables for testing the performance of the urban types: the total intensity of pedestrian flow for a full day and the fluctuation of pedestrian flow from hour to hour.
The final step of the methodology was statistical analysis, which used one-way and multi-way ANOVA to test the separate and combined impact of street and building types on the intensity of pedestrian flow. 19
Results
Street types
The clustering of street centrality resulted in four street types with different profiles or, to use the terms of Peponis et al. (2015), differentiation of scale (Figure 1). The ‘Background streets’ (Scl1) represent the majority of street segments with low angular betweenness values at all scales; in other words, these streets do not play a significant syntactical role on any scale in the urban structure. The ‘City streets’ (Scl3) include street segments with increasing angular betweenness centrality at higher scales and thus a more important role in through-movement at the 5 kilometre scale. The third type, ‘Neighbourhood streets’ (Scl2), represents street segments with consistently high betweenness on most scales, but dropping clearly on the lowest and highest scales; these streets have an important function at the in-between neighbourhood level. The fourth type, ‘Local streets’ (Scl4), includes street segments with high betweenness only on the very local scale, but dropping centrality on all others. Thus, these street segments have an important role in through-movement within neighbourhoods.
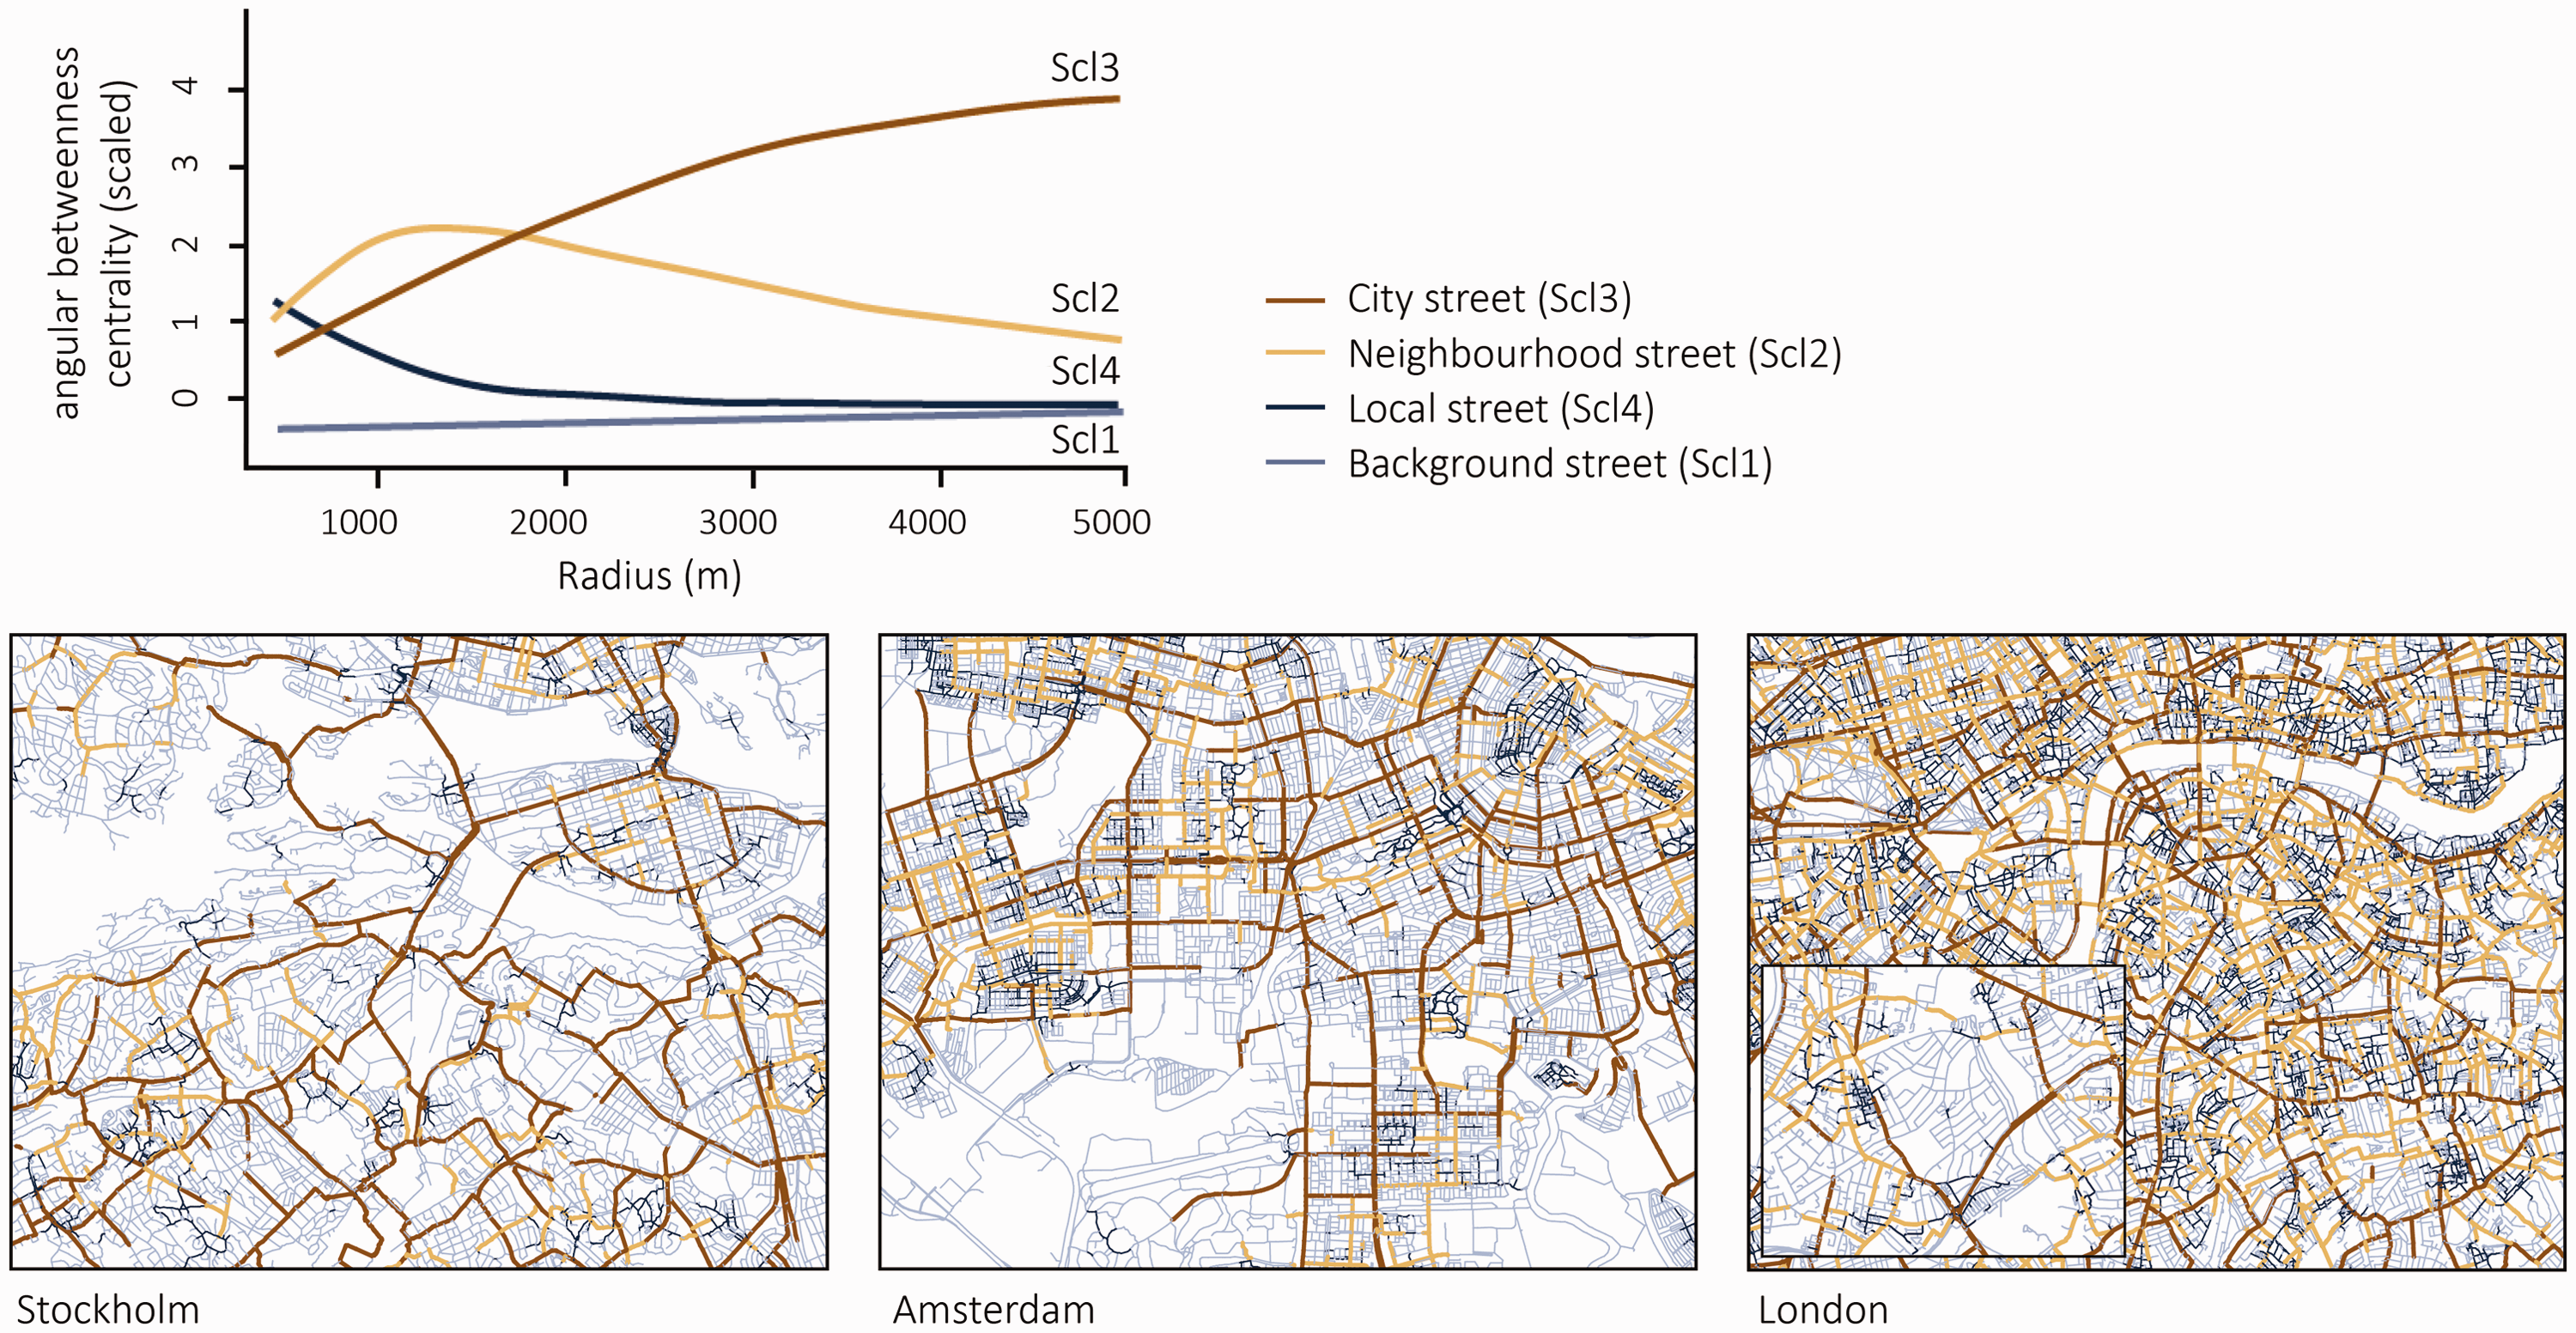
The centrality profiles of the four street types with angular betweenness centrality on the y-axis and the radii of analysis on the x-axis. Maps showing the distribution of street types in Stockholm, Amsterdam and London. The city cores are located in the upper right corner of each frame. An extra frame has been added to London to show the distribution at the periphery.
Compared to the other street types, both Neighbourhood and City streets (Scl2 and Scl3) have higher betweenness centrality values on all scales, giving them (according to the writings of Hillier et al., 1993), potential for higher-intensity pedestrian flow. The argument is that the overlaps of high betweenness at different radii correspond to an overlapping of scales of movement.
The maps in Figure 1 reveal the generic identity and role of the street types in structuring the three cities. For instance, we may observe different grids articulating different scales and speeds, as discussed by Read (1999b) plus the strong differentiation between scales of syntactic structure, as discussed by Peponis et al. (2015). The City street type (Scl3) defines the (deformed) supergrid of primary roads, while the other types represent the inserted local streets. Further, the Neighbourhood streets (Scl2) function as bypasses within the supergrid, while the Local streets (Scl4) function as bypasses for the Neighbourhood streets. In other words, the four types discussed in this paper add detail to the distinction made by Hillier (2002), between a few long primary streets and the many shorter streets, which form the bulk of their fabric. This is consistent with Peponis et al. (2015), who discussed the ‘different morphologies within a relative constant framework of major streets …, creating a network of minor streets co-extensive with the network of major streets’ (111). All three city cores show a continuous supergrid while in the periphery, the grid is more fragmented and in some places dissolves into a linear structure. However, the continuous core in Stockholm is smaller than in Amsterdam, despite Stockholm’s larger size. Meanwhile, the core is much larger in London but, even here, it becomes more fragmented at the periphery.
Building types
The clustering of density resulted in seven building types. Six of these are similar to the earlier findings in Berghauser Pont and Haupt (2010) while a seventh, clearly distinct cluster, has been added. This seventh cluster is only found in London and mostly in the Canary Wharf area. A predominance of very tall, podium-structure buildings, results here in very high FSI values. The profiles of the seven types are presented in Figure 2. 20 The first cluster, ‘Spacious low-rise’ (Bcl1) combines low accessible FSI and low accessible GSI values and is dominated by villas or other freestanding buildings. The second type, ‘Compact low-rise’ (Bcl2), has medium GSI and FSI values and represents areas dominated by terraced houses. The third low-rise type, ‘Dense low-rise’ (Bcl4), has the highest FSI and GSI values of the three. Within this type, we find both very old compact urban patterns and compact industrial areas dominated by large sheds.
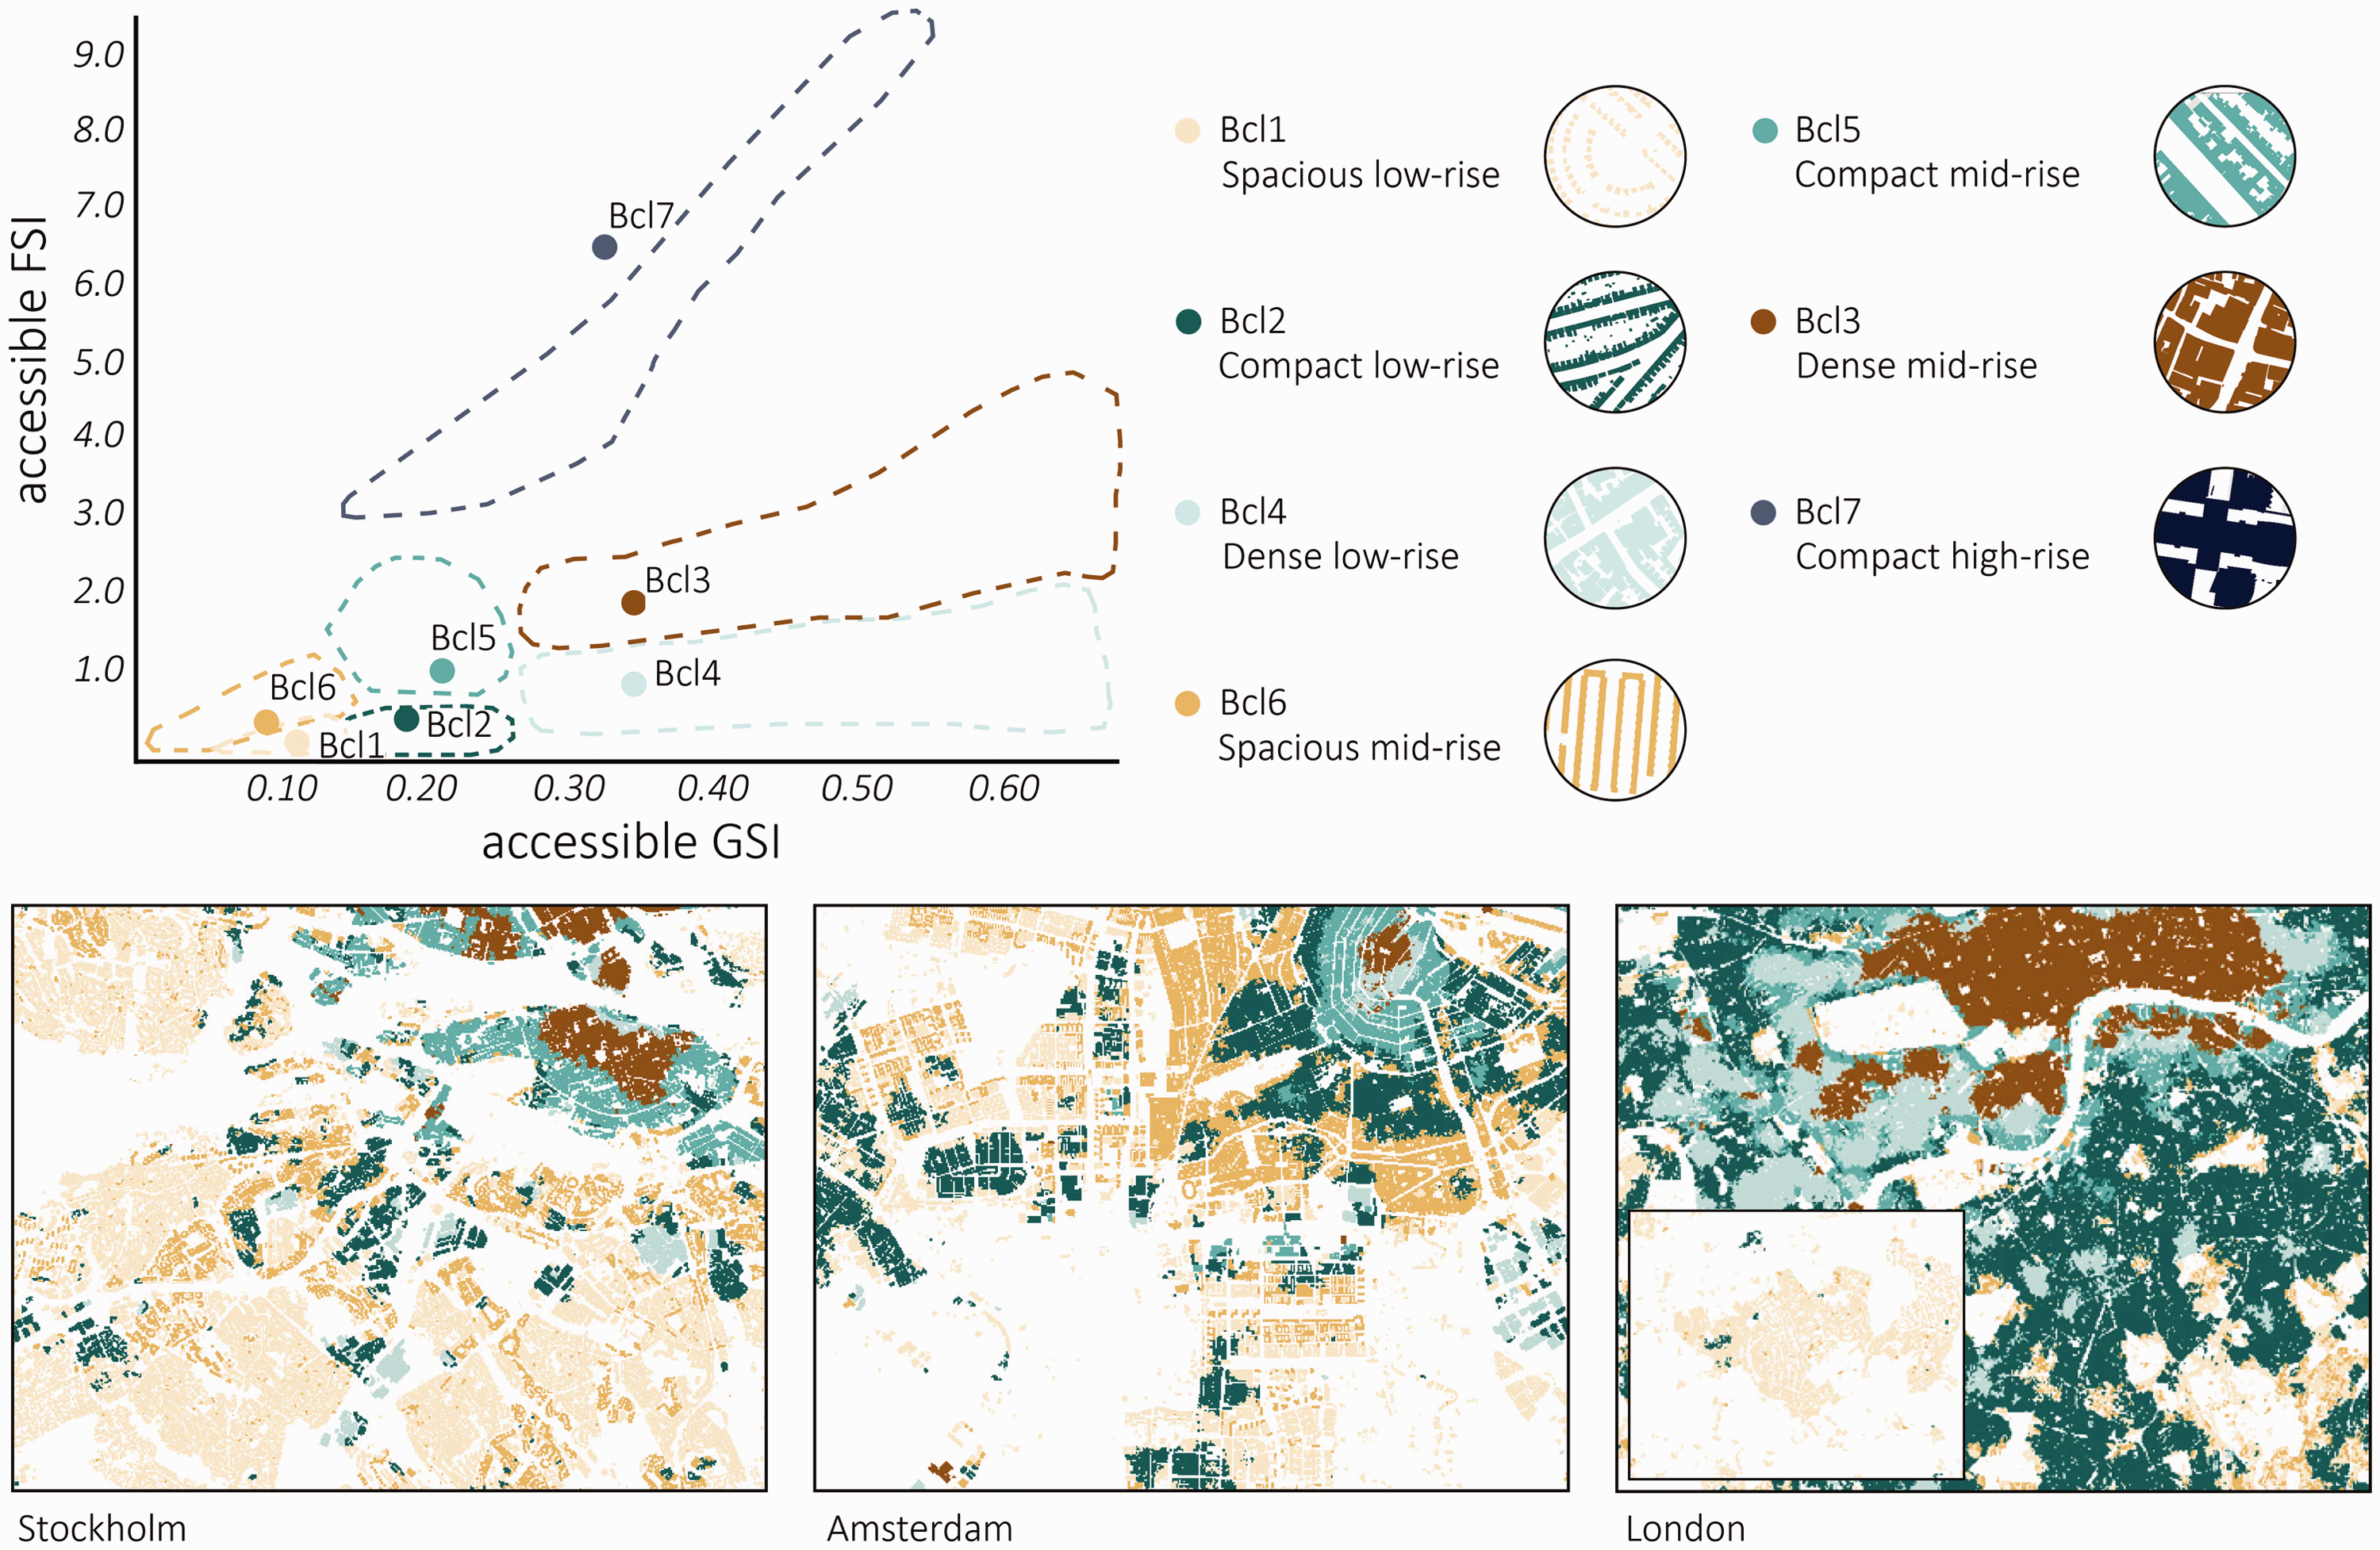
The density profiles of the seven building types with accessible FSI on the y-axis and accessible GSI on the x-axis. Maps showing the distribution of building types in Stockholm, Amsterdam and London. The city cores are located in the upper right corner of each frame. An extra frame has been added to London to show the distribution at the periphery. FSI: floor space index; GSI: ground space index.
The next three building types have a higher average building height and thus higher FSI values, with the ‘Spacious mid-rise’ type (Bcl6), having the lowest GSI values of the three. We find such things as point and slab buildings (typical of the modern era) but also perimeter blocks with large inner courts. The ‘Compact mid-rise’ type (Bcl5) has slightly higher FSI and GSI values, followed by the ‘Dense mid-rise’ type (Bcl3) with the highest combination of FSI and GSI. The two latter types represent perimeter building blocks, varying in size and compactness with a dominance of late 19th century buildings. The seventh cluster, ‘Compact high-rise’ (Bcl7), has the highest FSI values due to the building heights which are, on average, higher than in any of the other types. This type is found in only one location in London: Canary Wharf, one of the main financial centres of Europe comprising a high concentration of tall buildings.
The maps in Figure 2 give an objective summary of the spatial organisation of the building types. The most striking factor is the predominance of the Spacious low-rise type (Bcl1) in Stockholm (occupying over 80% of the land) and of the Compact low-rise type (Bcl2) in Amsterdam and especially London. This type is rare in Stockholm, occupying only 7% of the land. 21 Together, these two low-rise types occupy over 80% of land in all three metropolitan areas, while the three most urban types, Compact mid-rise (Bcl5), Dense mid-rise (Bcl3) and Compact high-rise (Bcl7), jointly, use less than 3% of the land, predominantly in the older cores of the three cities.
Intensity of pedestrian flows
The results of the one-way ANOVA show a clear and almost similar pattern in all cities (Figure 3). The lowest intensity of pedestrian flow is found in the areas with the lowest FSI and GSI (Spacious low-rise type, Bcl1), while the highest is in the areas with the highest combination of FSI and GSI (Dense mid-rise type, Bcl3). This confirms that FSI is an important driver of the number of pedestrians, but that GSI (describing the interface between public and private space) is equally important. Comparing the Compact low-rise type (Bcl2) and Spacious mid-rise type (Bcl6) with the Spacious low-rise type (Scl1) shows that the more compact building type (Bcl2, with a higher GSI) has a higher intensity of pedestrian flow than building type Bcl6, with a higher FSI. The building types with both a high FSI and GSI result in the highest intensity of pedestrian flow. The findings for the Compact mid-rise type (Bcl5) in London deviate from this logic; this can be explained by the limited number of observations in such areas in London. The correlation between building types and intensity of pedestrian flow is moderate and highest in London (R2 = 0.386), followed by Amsterdam and Stockholm (R2 = 0.183 and 0.133, respectively), all with high significance.

Results of the one-way ANOVA with the intensity of pedestrian flow (full-day data) as the dependent variable and building type (above) and street type (below) as explanatory variables. ANOVA: analysis of variance.
The same analysis, but now using the street types as explanatory variable, shows that in Stockholm and Amsterdam, the City street type (Scl3) has the highest intensity of pedestrian flow, followed by, in decreasing order: the Neighbourhood (Scl2), Local (Scl4) and Background street type (Scl1). This confirms the theory that the overlaps of high betweenness at different radii correspond to a higher intensity of pedestrian flow. Again, the findings in London deviate slightly from this logic, with the Local street type (Scl4) showing a slightly higher intensity of pedestrian flow than the City and Neighbourhood street types (Scl2 and Scl3). One explanation may be the high incidence of the Local street type in areas of the Dense mid-rise building type (Bcl3) which, as we have discussed, generally has a much higher intensity of pedestrian flow. Overall, correlations between street type and intensity of pedestrian flow are relatively low with, in decreasing order, Stockholm (R2 = 0.174), Amsterdam (R2 = 0.161) and London (R2 = 0.095).
When considering the multi-way ANOVA, including both street and building type as explanatory variables, the correlations increase compared to the one-way ANOVA with, in decreasing order, Amsterdam (R2 = 0.547), London (R2 = 0.525) and Stockholm (R2 = 0.453) all highly significant. In other words, while building or street types alone may explain some of the variation in the amount of pedestrians, the combination explains it significantly better.
This can also be seen when comparing three neighbourhoods of different building types (Figure 4). The intensity of pedestrian flow (thickness of the purple lines) is lowest in the Spacious mid-rise area and highest in the Compact mid-rise area. Further, the highest intensity of pedestrian flow (relative to the average in each area) is found in the City and Neighbourhood street types (Scl3 and Scl2). In other words, high-density areas have more pedestrians than low-density ones. Further, street types explain how this intensity (regardless of how high or low) is distributed within those areas. Thus, despite the number of people in each area, their distribution pattern is similar and related to street type.

Three areas of different building type, showing the street types (left) and intensity of pedestrian flow (right).
Fluctuations of pedestrian flows over time
The hourly fluctuations of the intensity of pedestrian flow show a clear peak in pedestrian intensity during the morning and afternoon rush hours, especially in the Spacious low-rise (Bcl1) and Spacious mid-rise (Bcl6) areas (Figure 5). This is probably because these are typical residential, commuter-based areas where people leave in the morning and do not return until late afternoon. The pattern is strongest in Stockholm with very low intensities during the rest of the day. In Amsterdam, we observe a higher number of pedestrians in the afternoon, which might be explained by the higher proportion of part-time workers in the Netherlands (over 35%) compared to the UK (almost 25%) and Sweden (less than 15%). 22 Looking at the variations in morning peak between the cities, we can conclude that Stockholm starts its day earliest. Its peak during morning rush hour is 7 a.m., followed by Amsterdam at 8 a.m. and London at 9 a.m.
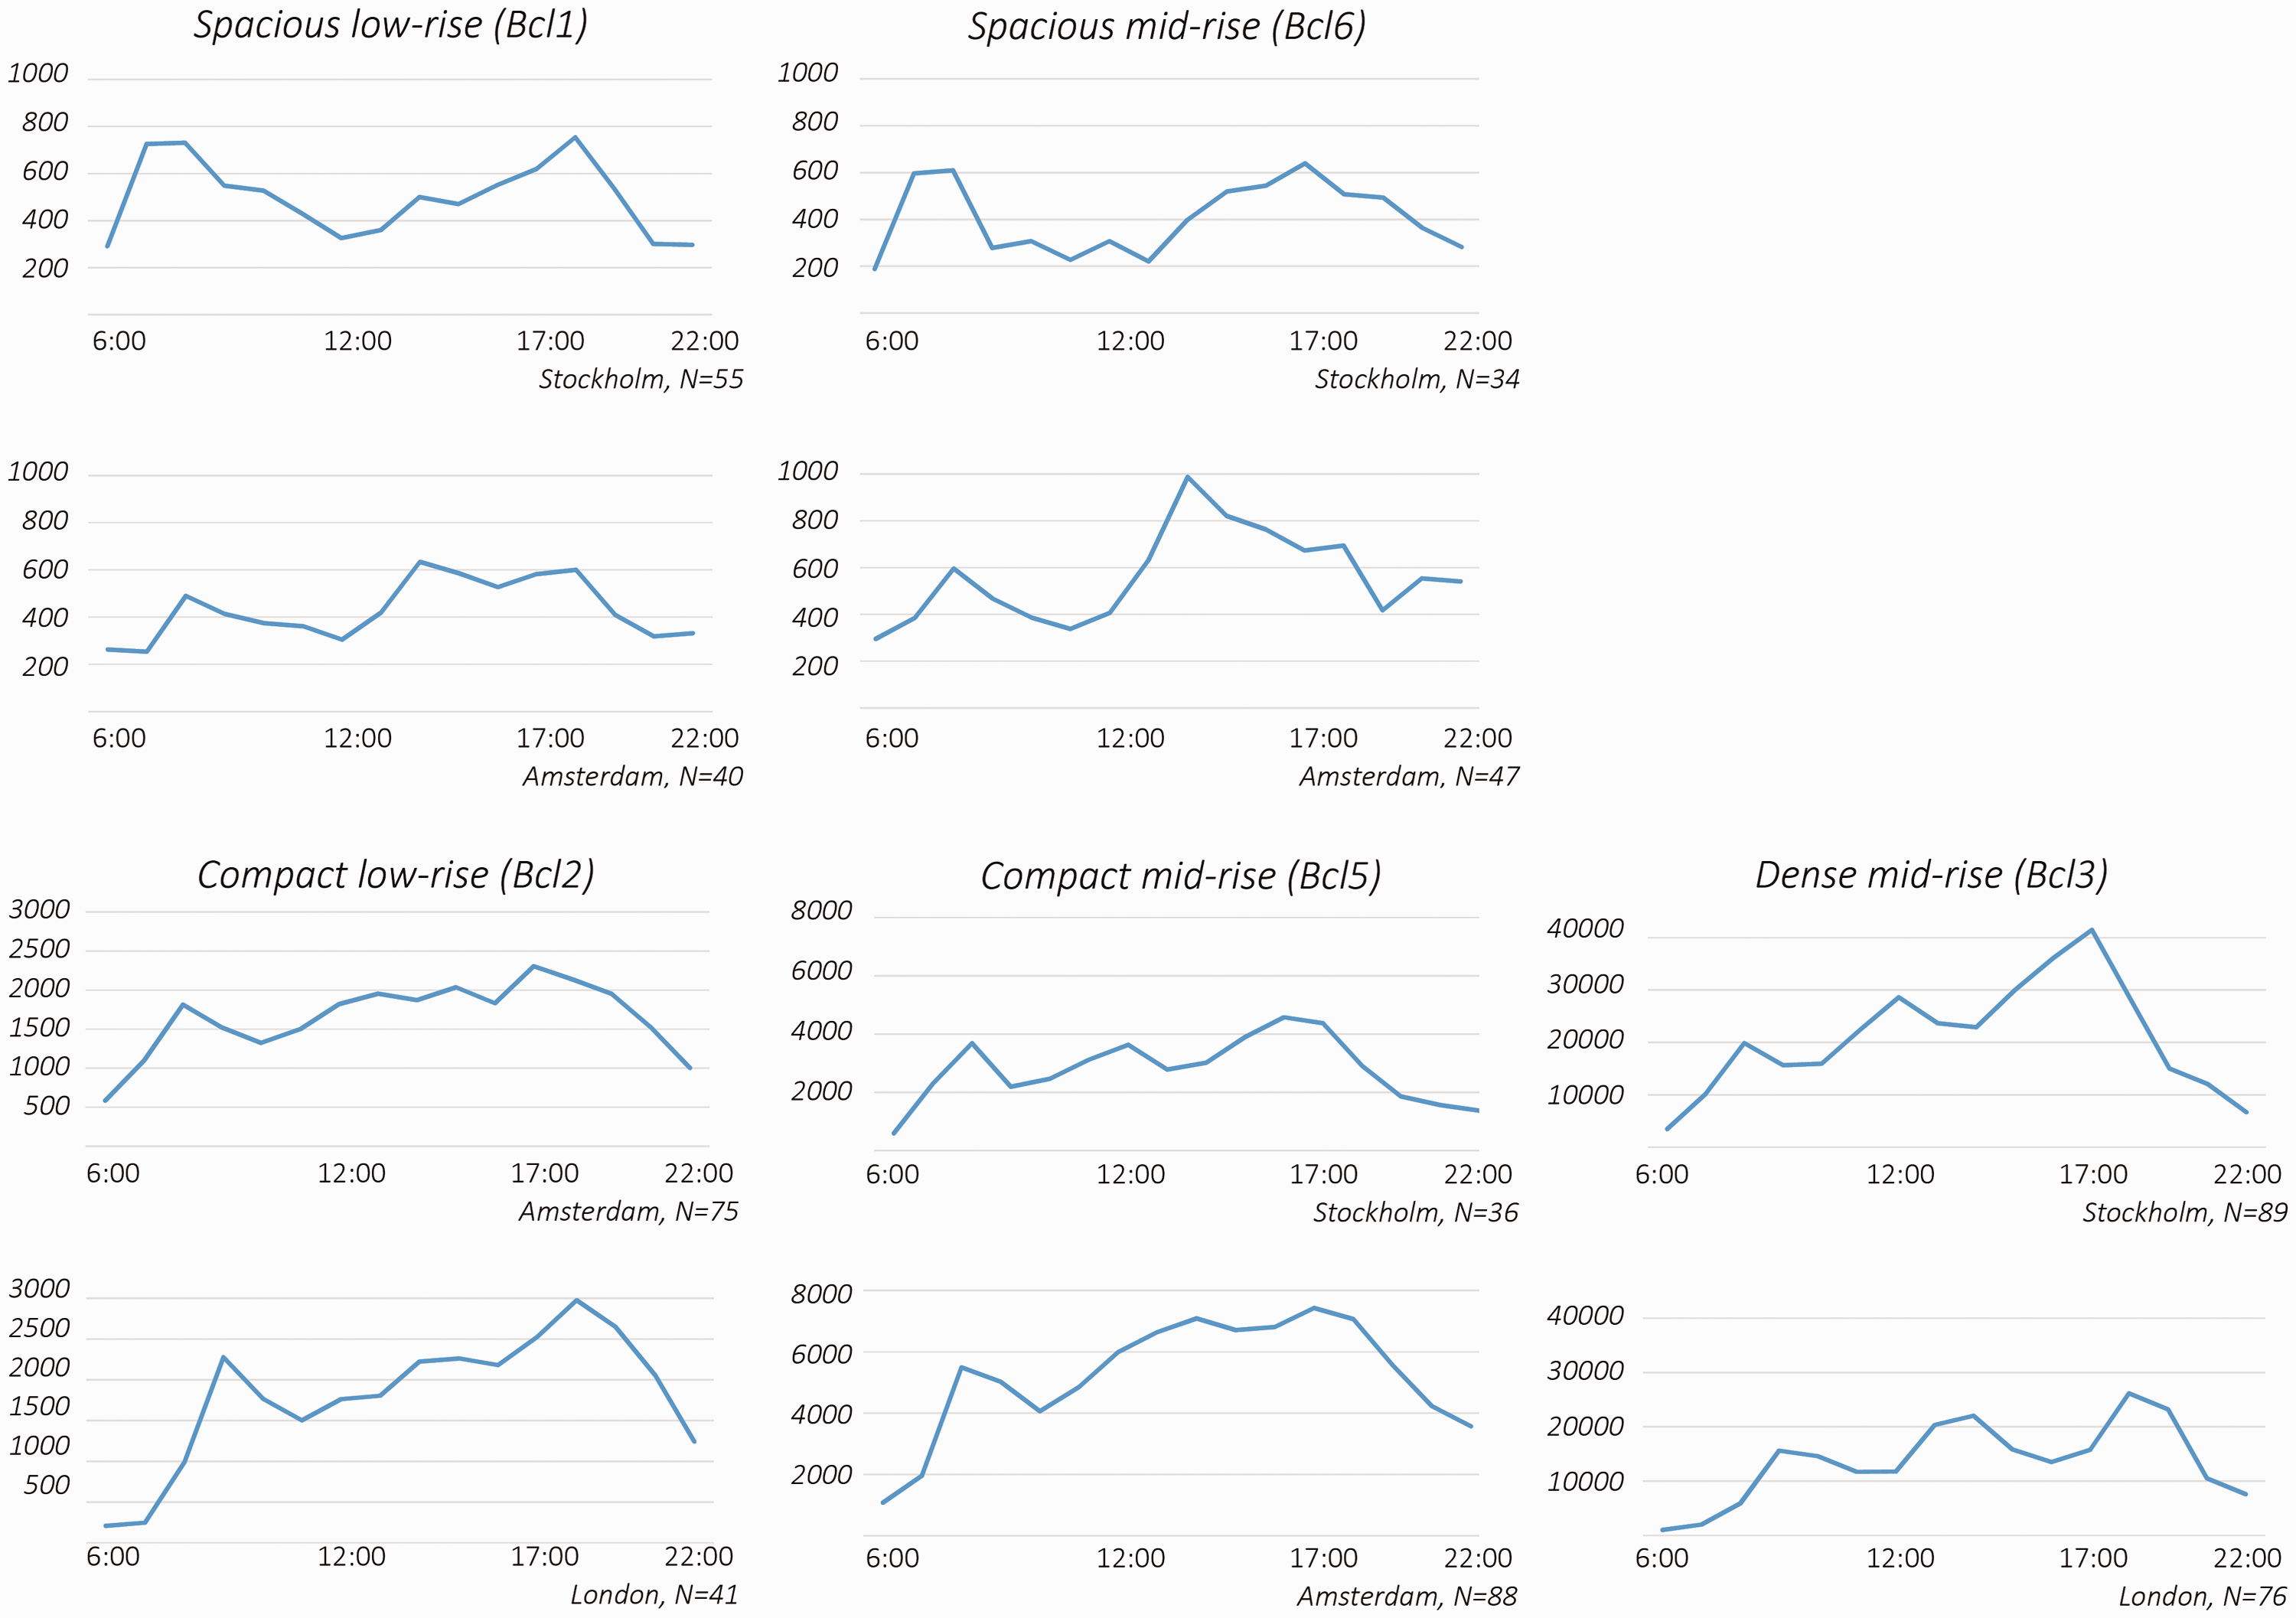
The fluctuations of intensity of pedestrian flow on the y-axis and the time of day on the x-axis. Note the differences in maximum values on the y-axis (results are only shown for types with over 25 observations).
The urban areas with higher FSI and GSI values, Compact mid-rise type (Bcl5) and Dense mid-rise type (Bcl3), show a steady increase in the number of pedestrians during the day, peaking in the afternoon around 5 p.m. These areas also show a peak in the morning. However, the afternoon peak is much higher than the morning peak and a third peak can be observed during lunch hour, although lower than the afternoon peak. This indicates that these areas are typically multi-functional, activating the use of public space throughout the day.
The fluctuations over time for the different street types were also tested, but the results were similar for all of them. This shows that urban rhythms are influenced primarily by building type and not by street type.
Discussion and conclusion
Responding to central needs from urban planning and design practice, this paper has aimed to develop a methodology for generating typologies, emphasising the performative dimension by focusing on their influence on the intensity of pedestrian flow – an essential driver of many other urban processes.
The methodology for developing the types is robust in that it picks up generally recognised spatial patterns in all three cities, such as the six building types defined by Berghauser Pont and Haupt (2010). The method also enabled recognition of a distinct, new seventh type in London. Further, with the proposed methodology, we were able to identify supergrids, as discussed in the work of Hillier (2002), Peponis et al. (2015) and Read (1999b) in cases when these are not so evident. This confirms the discussion about the importance of quantitative methods to describe more diffuse urban forms (Serra, 2013).
The most important result of this paper is the distinct difference in performance between the generated urban types regarding pedestrian flow. We identified weak, but significant correlations in all three cities when including the street and building types separately, but substantial correlations when combining street and building types. We have shown, first, that building types explain the intensity of pedestrian flow, while street types explain the distribution of this intensity within the areas. Second, high GSI is as important to the number of pedestrians as high FSI. In other words, the interface between public and private space, captured by GSI, is an important factor of active street life. Third, building types may explain the fluctuations in pedestrian flow during the day, which is something that the street types were unable to do. The same fluctuation patterns were found in all three cities, thus identifying a generalisable relationship between building type and aspects of daily life.
For planning and design practice, these results may prove highly significant, as they highlight some strategic design choices. First, they allow designers to think in terms of street types which have a syntactical meaning, such as the supergrid and nested local streets. Similarly, building types are associated with an understanding of both FSI and GSI. Second, it provides insights into the importance of the relationship between street and building types in designing areas with different qualities, whether aiming for urban buzz or quiet residential areas.
In summary, we argue that these are vital steps towards: first, an increased integration between methodological approaches in spatial analysis and urban morphology; second, a better understanding of the relationship between the physical structure of cities and urban processes (with pedestrian movement patterns as a vital intermediary process); third, better informed and more useable typologies in urban planning and design practice.
Future steps are possible in several directions. First, adding other urban components, such as the plot system, plus demographic variables to distinguish the effect of urban form and social factors; second, further testing the performance of the types, in relation to, say, local markets; third, testing the usability of the types in real urban planning and design cases and how this can be further supported by integrating the methodology into design support tools.
Supplemental Material
Supplemental material for Development of urban types based on network centrality, built density and their impact on pedestrian movement
Supplemental material for Development of urban types based on network centrality, built density and their impact on pedestrian movement by Meta Berghauser Pont, Gianna Stavroulaki and Lars Marcus, in EPB: Urban Analytics and City Science
Footnotes
Acknowledgements
We would like to thank the researchers from the SMoG research group at Chalmers, especially Jorge Gil, Kailun Sun, Jesper Olsson and Ehsan Abshirini. Further we would like to thank participants of the international workshops during 2015 and 2016 where we discussed parts of the work presented in this paper: Miguel Serra, Ann Legeby, Birgit Hausleitner and Ashley Dhanani. Lastly, we thank the team working on the pedestrian survey, especially Håkan Eriksson and Antonio Sanna.
Declaration of conflicting interests
The author(s) declared no potential conflicts of interest with respect to the research, authorship, and/or publication of this article.
Funding
The author(s) disclosed receipt of the following financial support for the research, authorship, and/or publication of this article: This research is funded by Chalmers foundation, Sweden.
Supplemental material
Supplemental material is available for this article online.
Notes
References
Supplementary Material
Please find the following supplemental material available below.
For Open Access articles published under a Creative Commons License, all supplemental material carries the same license as the article it is associated with.
For non-Open Access articles published, all supplemental material carries a non-exclusive license, and permission requests for re-use of supplemental material or any part of supplemental material shall be sent directly to the copyright owner as specified in the copyright notice associated with the article.
