
Abstract
This paper proposes that urban informatics can represent a flow of information from diverse and voluminous data into and back from the planning process. We present a proof-of-concept of how an urban informatics approach can improve public understanding of essential information in the planning process, and we propose a theoretical construct of how it can make planning processes more democratic and participatory, especially for disadvantaged groups. Specifically, this study uses a multi-dimensional spatial scan technique to discover household movement patterns in Chicago from millions of household address records between 2006 and 2015. The results locate the types of movement and displacement associated with specific places at a highly detailed spatial resolution. A user-interface is developed and proposed to enhance sharing of the information to the general public and involves diverse stakeholders in policy-making processes.
Keywords
Introduction
Since the mid-20th century, scholars have routinely presented optimistic views of how computer models might transform the practice of urban planning (Harris, 1965; Klosterman, 1997; Pan et al., 2019a, 2019b; Voorhees, 1959).These views envisioned complex geospatial models that could help communities make wise decisions by articulating complicated planning information in ways that could be used and understood by a variety of planners, residents, environmental groups, and policy-makers (Ceccato and Snickars, 2000). These ambitious technologies would also make the planning process more forward-thinking, data-driven, transparent, and efficient (Harris, 1965).
Current conceptions of the role of digital data in planning are equally optimistic. The increasing omnipresence of digital technology, data availability, smart systems, and transformational speeds of computational resources are providing a new wave of confidence in the role of technology in the practice of planning (Foth et al., 2011). New communication and internet technologies are noted to facilitate broader public participation, feedback, and the potential for systems monitoring (Angelidou, 2017; Stratigea et al., 2015). Smart cities promise to improve urban living with information and communication technologies (ICTs) to make computing truly ubiquitous (Albino et al., 2015). Understanding and planning for these transformational changes and the smart information systems require ways of dealing with uncertainty and complexity. This transformational outlook calls for a move away from prescriptive planning approaches and toward planning for emergent behaviors (Batty, 2013).
Similar to early conceptions of computer models, planning support systems (PSSs) are intended to make the planning process more transparent to a broader range of individuals from a broader spectrum of socioeconomic conditions, through producing information that can be used and understood by a variety of practitioners and stakeholders (Pan and Deal, 2019). The information typically generated from PSS tools has been used to support participatory processes, convene collaborative deliberations, simulate planning consequences, and gather public inputs to improve local plan-making practices and inclusiveness (Auerbach et al., 2018; Bailey and Grossardt, 2010; Jankowski et al., 1997; Malczewski, 1996; Mennecke et al., 2000). New PSS approaches defined by “urban informatics” include new data collection and data science-driven manipulation techniques, visualizations for interpretation, and processes for engaging with the new knowledge (Foth et al., 2011). Although not new, this approach to the creation, application, and use of ICTs in the context of cities and urban environments is changing the landscape of planning and planning tools.
This paper argues that urban informatics can be defined by the flow of information. In urban planning terms, it is represented by the diverse and voluminous data that flow into and back from the typical planning process. In this way, urban informatics connects the science of cities to the science of planning and PSS technologies. A proof-of-concept of this information flow is presented in this paper. It uses a multi-dimensional spatial scan technique (see Gao et al., 2018) to analyze residential relocation patterns in Chicago. Millions of household address records that include to/from spatial locations during the period 2006 and 2015 are used to locate the types of movement and displacement associated with specific places (by identifying places into types such as “gentrification” or “high-income flight”). The analytical spatial unit is the specific street address. This fine resolution enables a more meaningful analysis on the origination and destination of households of different socioeconomic backgrounds. A user-interface is proposed to enhance sharing of the information to the general public and solicit feedback.
Based on the previous literature on combining geographical data science models and big data to improve a public understanding of essential information in the planning process (Batty, 1992; Lim et al., 2018), our model provides a further theoretical construct for combining big data, spatial models, user-interface development, and planning processes (a compressive “urban informatics” approach) to promote involvement and advocacy for disadvantaged groups in planning processes. The practical contributions of this paper include a deeper understanding of the residential mobility patterns of specific populations in highly urbanized areas and a better understanding of the realities of the mobility constraints that exist within these groups. The paper also discusses how to use state-of-the-art “data to interface” technology to make the modeling process easily replicable for updating urban informatics models with user inputs.
The remainder of this paper is organized into four sections. The next section presents a literature review that critically assesses current work in residential mobility and its connection to PSS technologies. The “Methods” section introduces our multi-dimensional spatial scan and planning support tool methodologies through a case study application in Chicago, IL. The “Results” section is the results of our Chicago analysis. The “Discussion” section demonstrates a planning support tool development from the analytical results with discussions on policy implications of our study. The final section concludes with a review of our main findings, contributions, and applications, along with a discussion of potential improvements and next steps.
Literature
Planning practitioners are constantly challenged to anticipate the potential consequences of proposed policies and their social and environmental impacts. “Geo-information-technology based instruments” (Batty, 1995) were created by early technical optimists in the field of urban planning to address these problems—now more commonly known as PSSs (Geertman and Stillwell, 2004). With decades of PSS development and evaluation, it is generally accepted that an important metric in evaluating the usefulness of PSSs is how well they support the planning process (Pan and Deal, 2019). For example, Deal et al. (2017b) show how land use simulations were used to develop policy in McHenry County, IL and how those policies could be reevaluated in subsequent years to gauge their success using similar technologies. Scholars have also coupled various impact assessments with PSS models to improve PSS functionality. For example, Boulange et al. (2018) present a customized land use planning software into a walkability PSS that enables urban planners to explore the implication of tested policy on community and localized walkability. Pan et al. (2018) integrate a socio-hydrology modeling system with a land use PSS to inform potential stormwater management policies in both Chicago and Stockholm.
In recent years, the emerging “big data” and “smart city” movements have ushered in a strong emphasis in collecting, analyzing, and visualizing large volume data to support urban planning and management practices (Deal et al., 2017a). As a result, they begin to blur the distinction between systems, tools, apps, social media, big data, and web interfaces and their role in planning. We have also seen the rise of a new science of cities (Batty, 2013) and data science as applied in the context of shaping cities (Thakuriah et al., 2017). The intersection of city or urban science, data science, and informatics is offering new possibilities and approaches for supporting urban planning and management with technologies. The new approaches of planning support are defined by “urban informatics” (Foth et al., 2011), which include collecting and analyzing data with data science, interpreting the data for users, policy-makers, and stakeholders with visualization, and engaging knowledge created by such systems in the planning process. Sensors and other smart city-related technologies present a great opportunity but perhaps an even greater challenge for using urban informatics to support planning practices. Vast quantities of data can be produced at very fine temporal resolutions and can conduct analysis at real-time, with data on the site streaming into the hands of planners (Batty, 2013).
Cardullo and Kitchin (2018) argue that citizens should be empowered to negotiate and even co-create the city through and with data. Auerbach et al. (2018) developed a tool that allows citizens to negotiate and even co-create the city through and by voluntarily offering their household-level data. Bailey et al. (2011) integrated visualization and geospatial technologies into large-scale public involvement in planning, and Redaelli (2012) developed a GIS tool that can be used by a local government to communicate with participants delivering technical and scientific knowledge. Bailey and Grossardt (2010) addressed how collaborative geospatial and geovisual systems can achieve greater measures of spatial justice for public goods allocation. These systems are believed to be able to create more inclusive, more equitable, and ultimately more sustainable outcomes for difficult and complex planning problems (Du and Zhang, 2020; Fu and Zhang, 2018; Mennecke et al., 2000).
Some of the spatial justice related geo-visualization work focuses on mobilization with a strong emphasis on disadvantaged populations (Elwood, 2001, 2002; Elwood and Ghose, 2001) and gentrification (Ellen and O’Regan, 2011). Most of the existing studies in socioeconomic mobility are conducted on very large spatial aggregations or over relatively long intervals, due to a dearth of individual and longitudinal data sources (Ding et al., 2016). Aggregation to census blocks (or larger spatial units) poses several statistical challenges, including the modifiable areal unit problem—a bias that occurs when point-based spatial data are aggregated into districts (Randon-Furling et al., 2018). In addition, the results of these types of studies are generally not available to the disadvantaged groups that most need the information. This study provides a proof-of-concept of urban informatics-based approaches that includes diverse and voluminous data sources along with geo-visualized interfaces. The approach aims to address the limitations of previous studies by communicating individual residential mobility information to households and to populations across the entire socioeconomic spectrum.
Methods
This study adapts Gao et al.’s (2018) multi-dimensional scan techniques for origination–destination (OD) household move data to discern the socioeconomic characteristics of places that experience major changes (influx/outflux) in households between 2006 and 2015 in Chicago, IL. The change in OD locations is classified as either “gentrification,” when significant households in higher incomes replace households with lower incomes; or “flight,” when significant households in lower incomes replace higher income households. Household incomes are organized using Department of Housing and Urban Development (HUD) designations, averaged over a 10-year period (2006–2015): “high” (in Chicago this means higher than $88,980 annual household income), “medium” (between $59,320 and $88,980), and “low” (lower than $37,075). The identification of characteristic places uses a fine resolution, 100 meters×100 meters spatial scanning window applied over the entire Chicago region. A visual interface of displaying the results and soliciting community feedback was constructed. The interface includes an area for discussion on the applicability of the outcomes to real-life planning processes, especially aimed at interactions with disadvantaged social groups.
Study area and data
Over the course of its history, Chicago has served as a national policy laboratory for low-income housing. The city has historically adopted several housing-related policy experiments such as the federal Moving to Opportunity for Fair Housing Demonstration Program and the HUD’s Moving to Work demonstration program. There is also a plethora of previous low-income housing studies in Chicago to compare with and complement the findings of this study, such as urban residential disparity (Chaskin et al., 2012), massive neighborhood types (Greenlee, 2019), accessibility and land use heterogeneity (Pan et al., 2020), and proactive policy measures (Chaskin et al., 2012). Lessons from Chicago can be used to inform cities worldwide in terms of the residential mobility of households from diverse socioeconomic backgrounds.
To measure longitudinal household locational characteristics, we used data from the InfoUSA consumer database. Researchers previously used InfoUSA data on business locations to measure local employment accessibility and labor market characteristics, particularly in studies focused on food deserts and other public health issues (Greenlee, 2019; Hoehner and Schootman, 2010; Moore and Diez Roux, 2006). The primary business use of the database includes targeting potential consumers’ mailing addresses in advertising campaigns. InfoUSA also maintains a consumer database that contains both historical and current household information by residential address. At the national level, InfoUSA’s consumer database contains information on more than 155 million households. These data are updated on a monthly basis, drawing household address information from the United States Postal Service, the National Change of Address database, the Locatable Address Coding database, and the Delivery Point Verification database. The data help to identify probable residential locational changes. Public records including tax assessor information and deed transfers are also used to assess household demographics.
In this study, each household is assigned a unique identification number that is maintained across the study years. This allows for the linking of yearly records into a longitudinal data set. Each yearly record reflects the household residential location in December of the year in question. Ten annual yearly “snapshots” (2006–2015) of residential locations are merged into one longitudinal database using the unique household identifier to organize records into longitudinal sequences. We used a 10-year average for three main reasons: (1) HUD median-income calculations have already taken inflation into account; (2) because of the economic crisis that occurred within the 10-year period, adjusted household income cut-off in Chicago does not have drastic changes; and (3) the income cut-off is only used to identify neighborhood level, not individual level; thus, the neighborhood income-level variations are limited in the 10-year period. We demonstrate the evidence supporting the three arguments in Supplemental material S1.
To determine household moves involving a change in neighborhood, we joined 2010 definition census tracts to our household address data. We flagged those households as moves who have a change in residential address that involves moving to a different census tract. We also created a separate data flag indicating a within census tract change in address.
Figure 1 shows the graphic representation of the origination and destination trajectories for households from low-, medium-, and high-income neighborhoods in Chicago over the study period. The OD comparison shows that mobility, to some extent, mitigates concentrated poverty for low income. However, the mitigation of concentrated poverty comes with a cost.Average moving distance of low-income households is 3.6 and 3.3 kilometers for extremely low-income households, which are both significantly higher than the average of 3.0 kilometers for medium and high-income households (and the differences are significant at a 95% confidence interval by pair-wise t-tests). Thus, low-income households need to move longer distances at higher costs to find better opportunities and neighborhood conditions. It is interesting and important to understand the comprehensive landscape of residential mobility in Chicago across the income spectrum to determine the driving forces of the results shown in Figure 1.
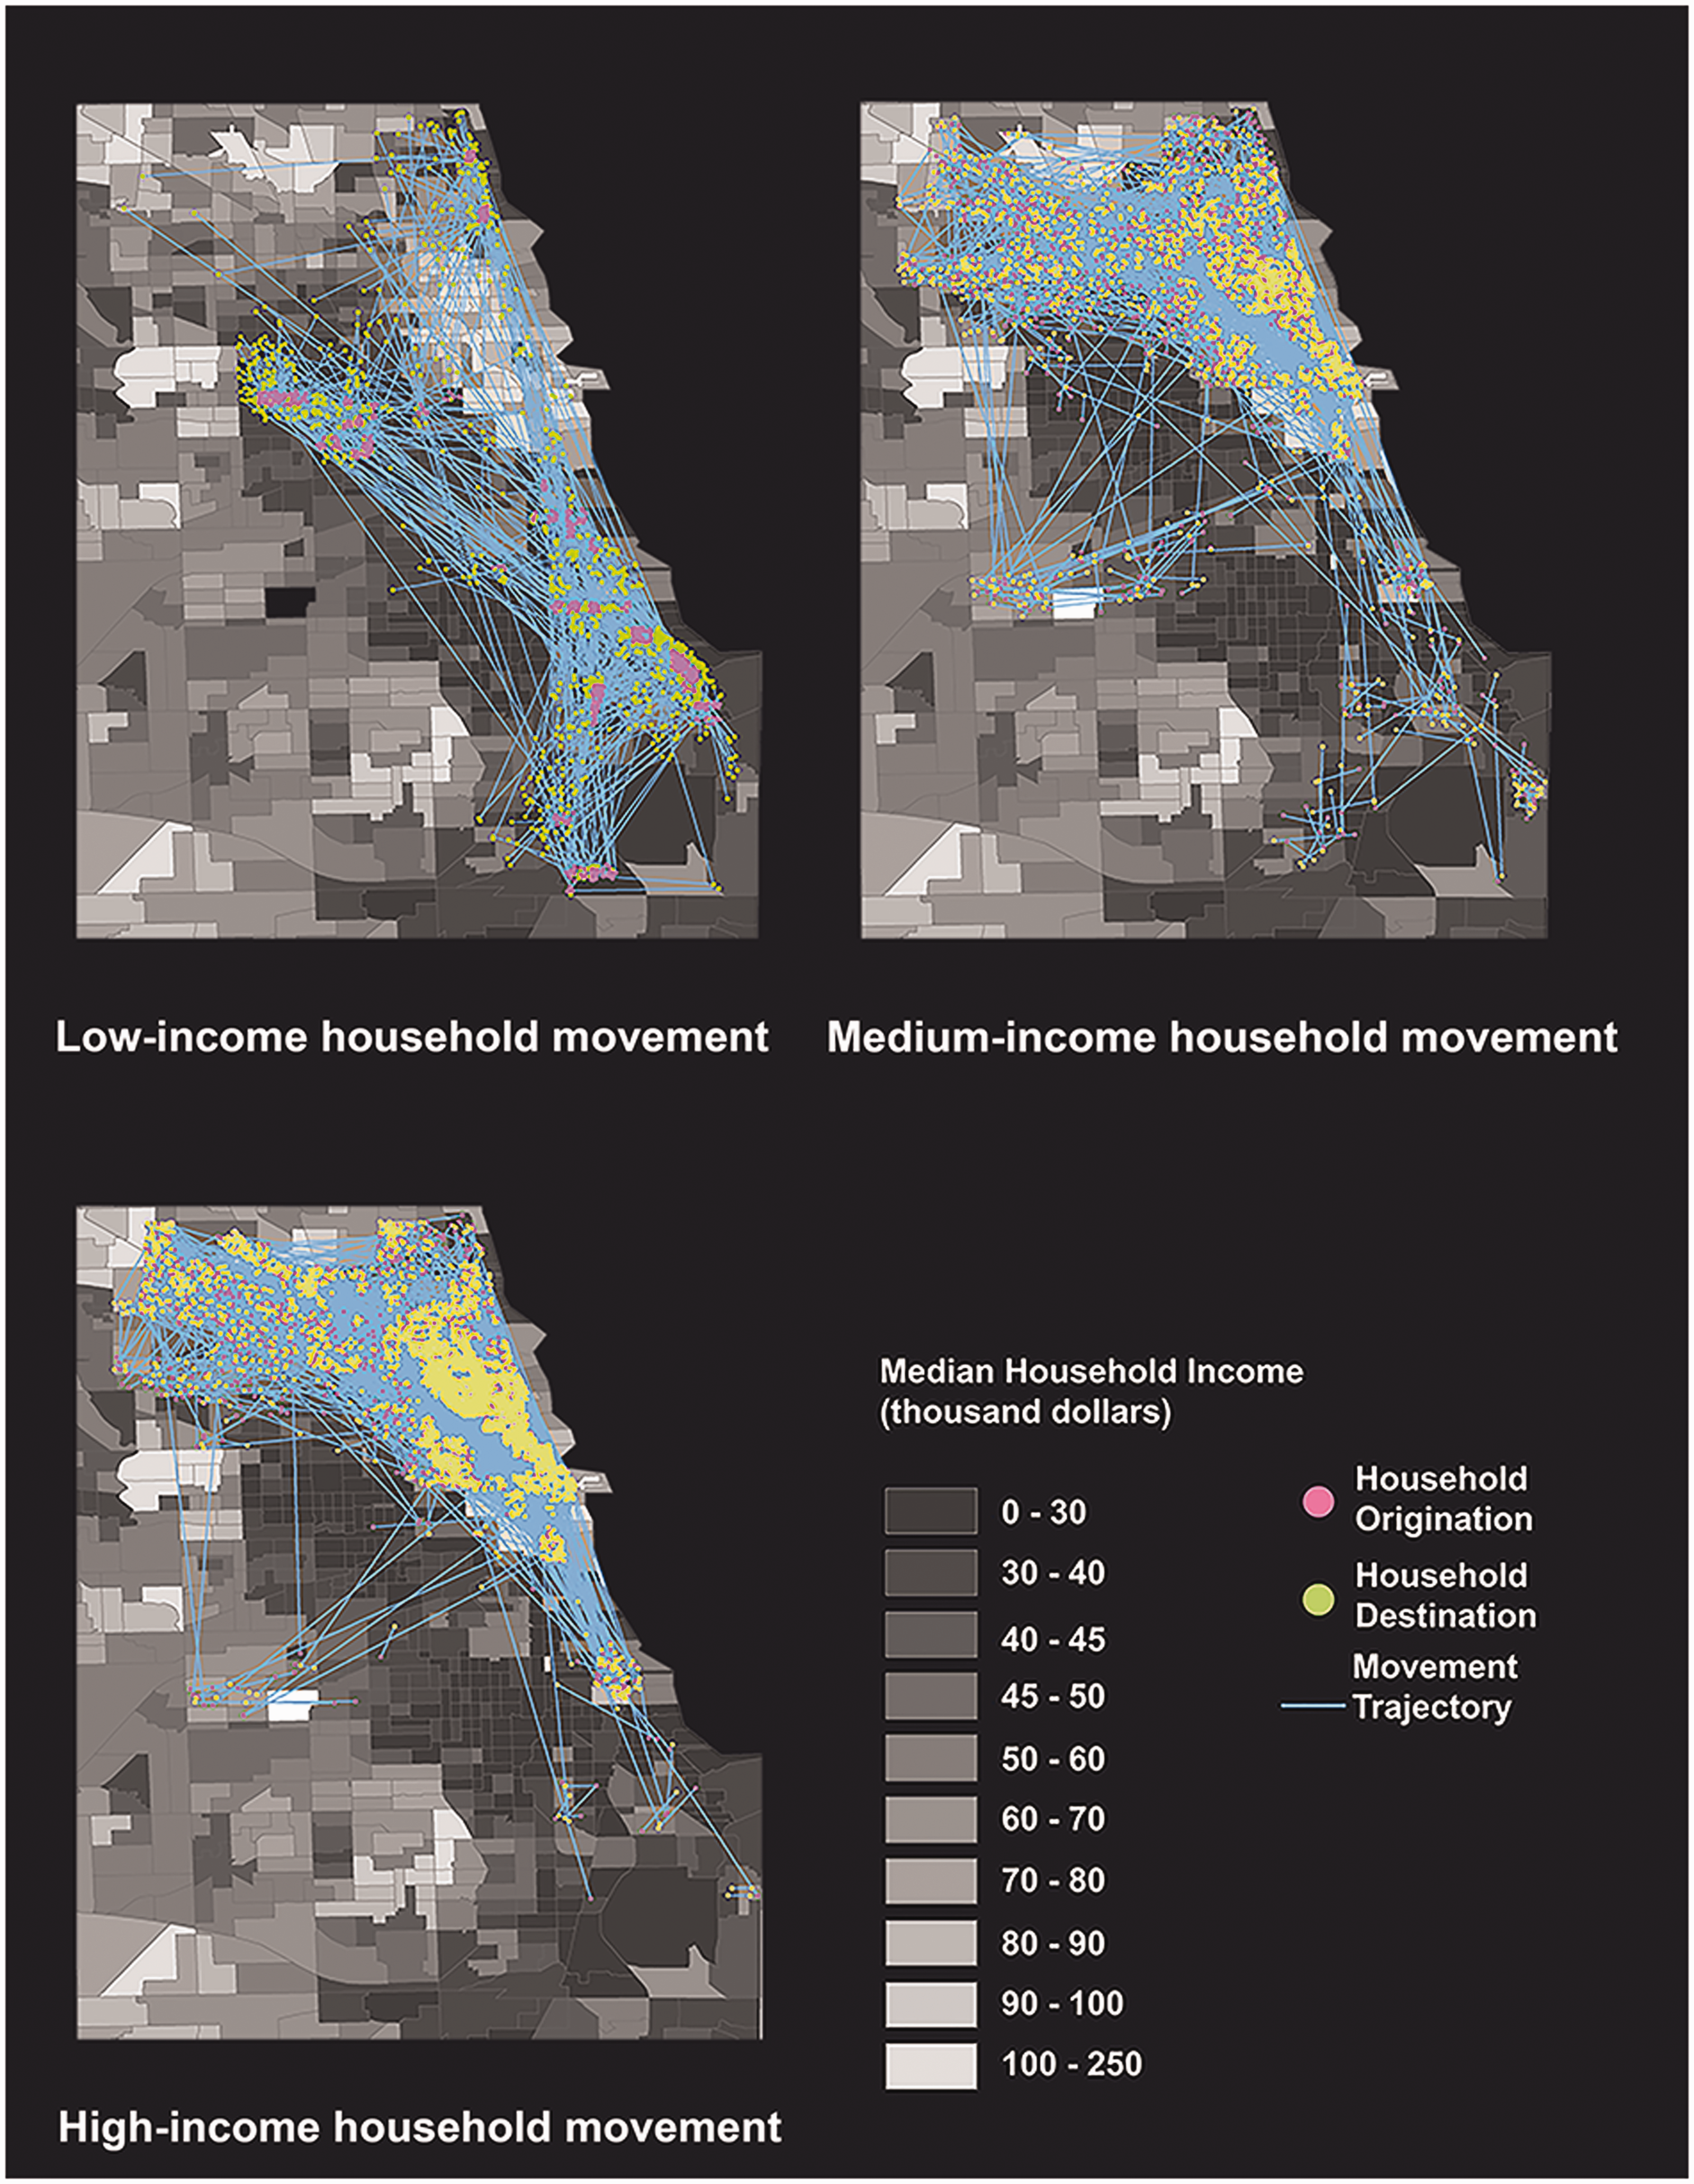
Origination and destination trajectories of movers of low (upper left), medium (upper right), and high-income (lower left) household tracts in Chicago from 2006 to 2015.
Multi-dimensional spatial scan for OD data
Gao et al.’s (2018) multi-dimensional spatial scanning (MDSS) statistical approach for OD data has previously been used to compare morning and afternoon taxi trips in New York, and county-to county migration between age groups for the entire U.S. The approach successfully discovered trip identity and clusters beyond TAZ levels and migration groups beyond traditional identified borders (state or metropolitan).
This study adapts the MDSS method for three main reasons: (1) spatial scale: the multi-dimensional spatial scan can find clusters of individual household movements at a very fine spatial scale (100 meter scale); (2) OD data suitability: most spatial scan data are suitable for point or polygon use; the MDSS approach is specifically designed for OD data sets and uses a four-dimensional space to represent coordinates for each pair of OD locations; (3) model scalability: the method uses parallel processing techniques to analyze large amount of data (millions of households in this case) within a reasonable computational time.
The process of conducting MDSS is briefly described as follows (see Figure 2). First, every OD locational set is tagged with two pairs of X and Y coordinates. All the OD pairs are then randomly clustered—to test the null hypothesis that spatial data clusters are randomly organized. Multiple scanning windows are created with diameter
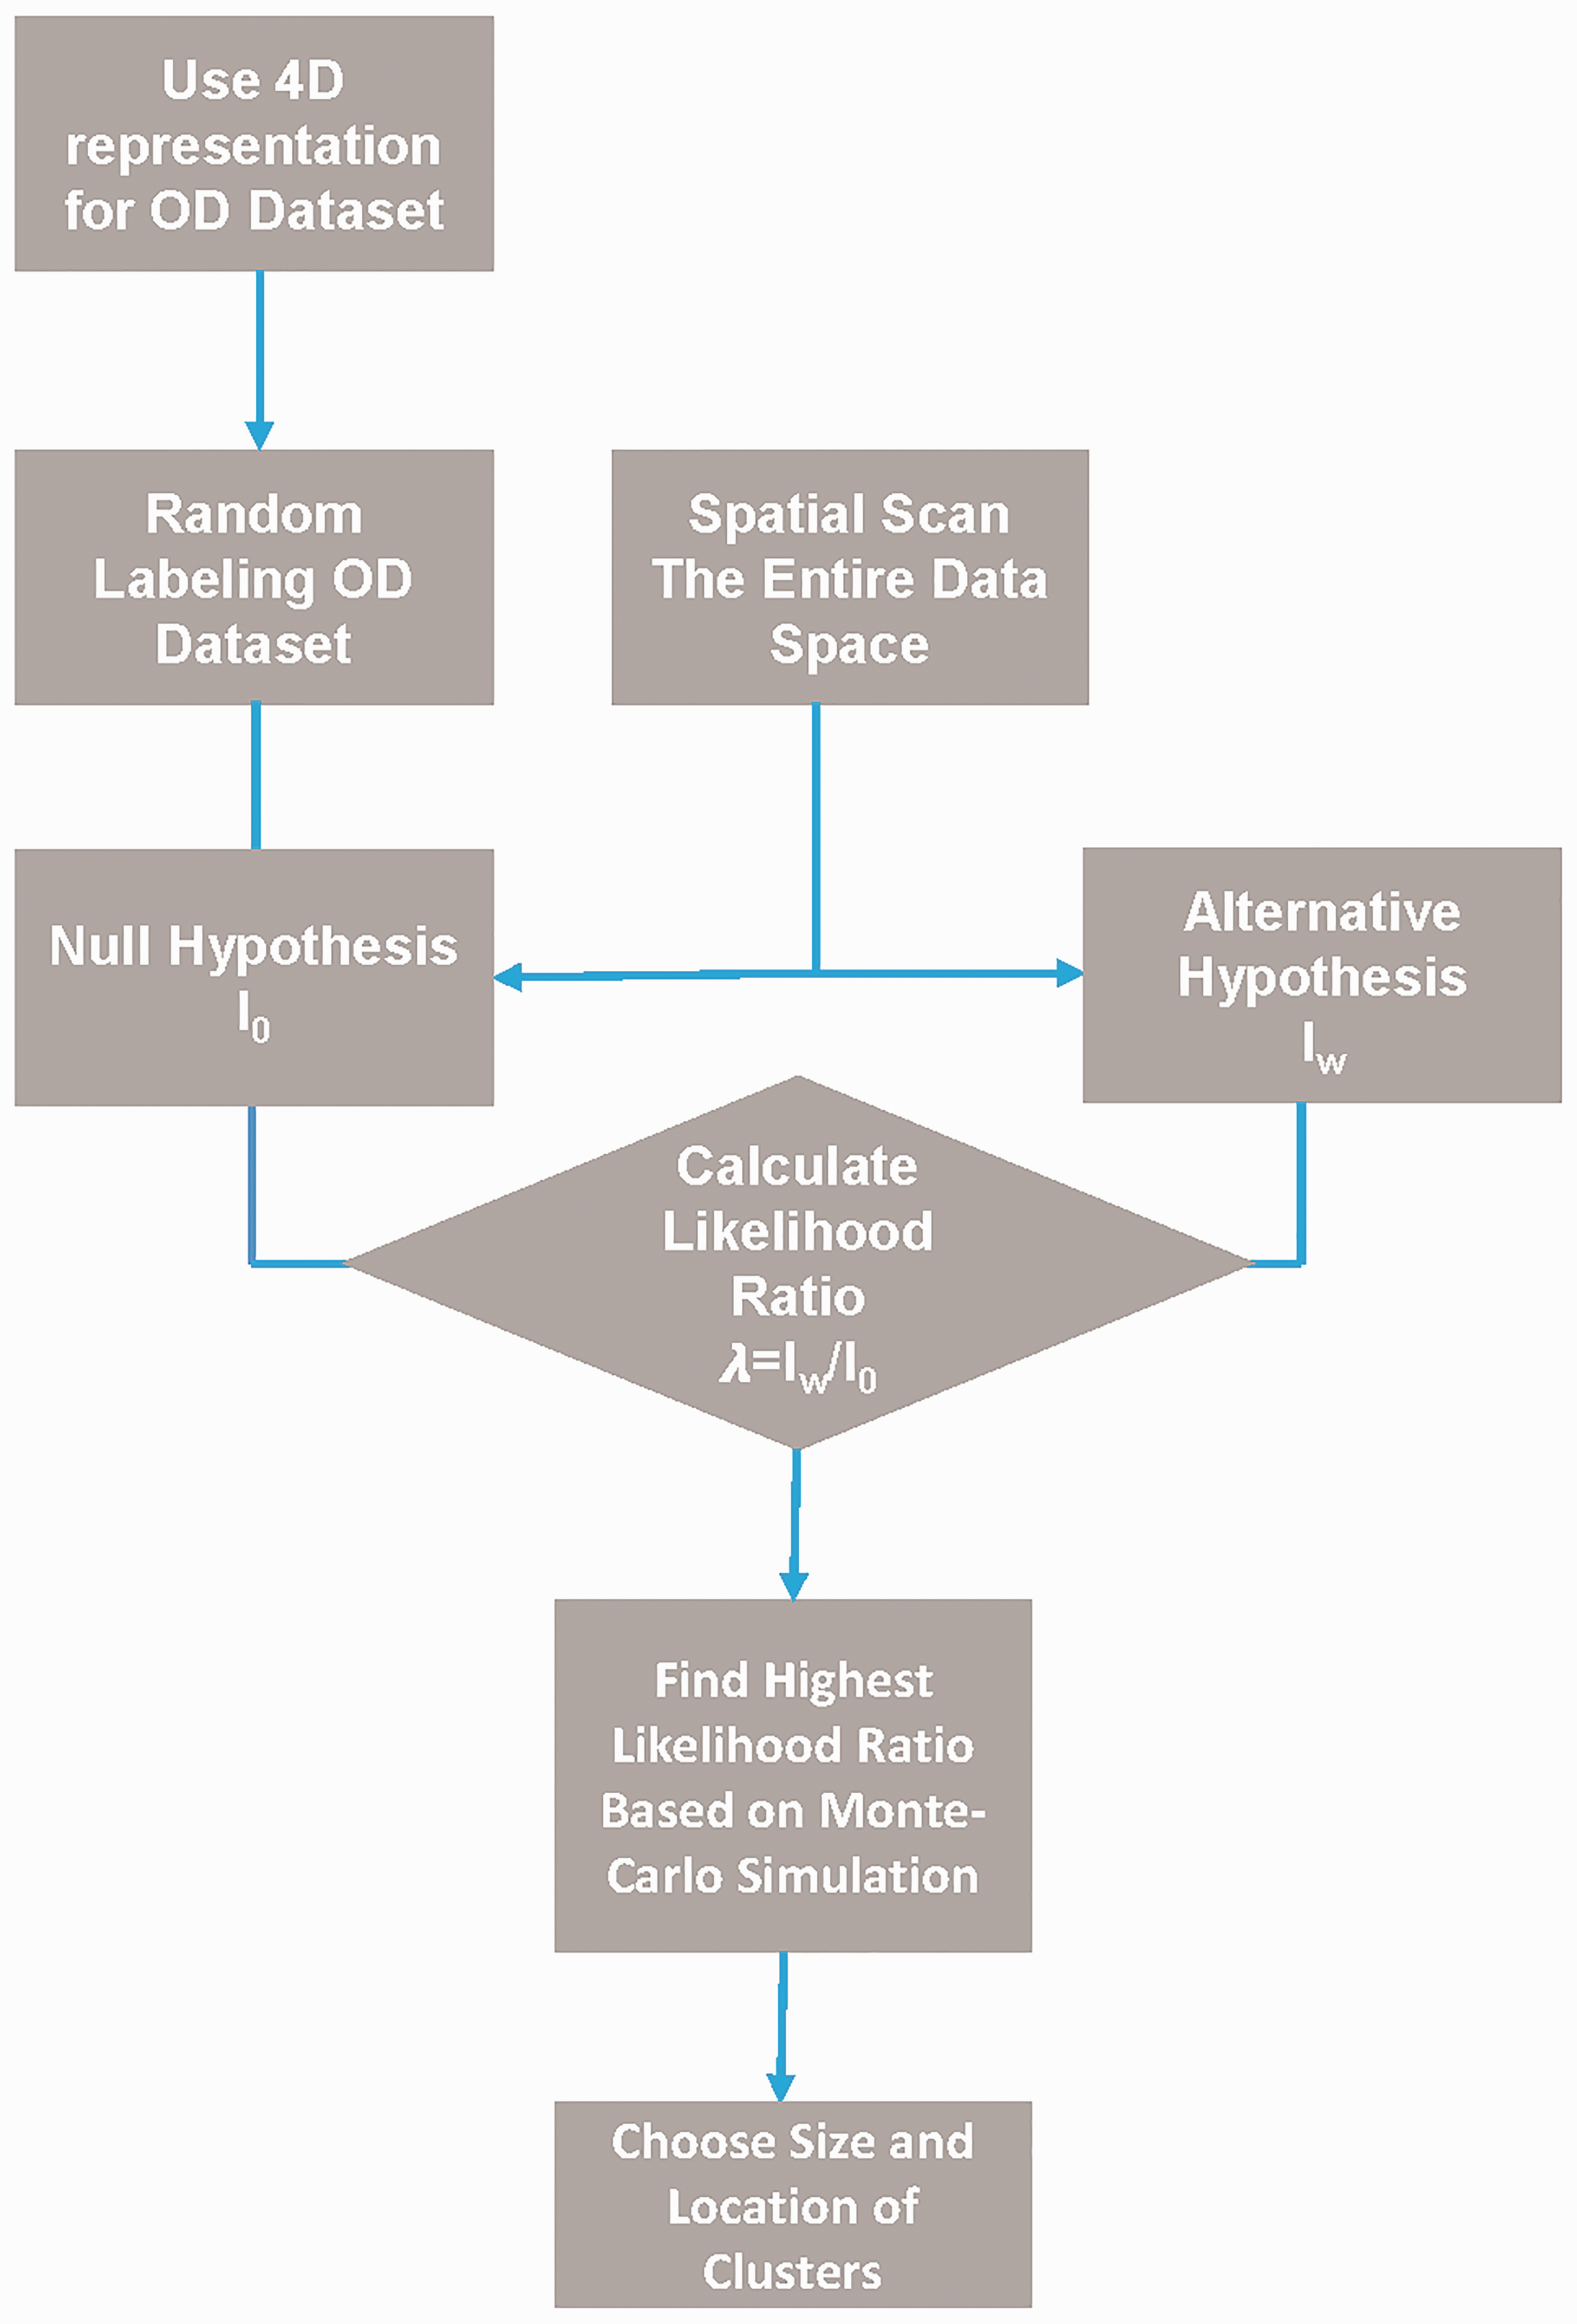
The flow of an MDSS process for MDSS applications in the case of Chicago residential mobility. OD: origination–destination.
Some key parameters for MDSS in this study include incremental interval
Results
Od movement type results
The Chicago region might be viewed as three concentric rings with the CBD as the center, second ring as the suburban extent, and third ring as the peri-urban or urban fringe. In the CBD, residential mobility is very diverse, and “flight” and “gentrification” usually occur in roughly the same places. Because of this, a pattern is not assigned using the spatial scan technique. In the Chicago region, the second ring includes first tier suburban areas—Blue Island, Oak Lawn, Cicero, Oak Park, Rosemount, Skokie, and Evanston, for example. These places have relatively large numbers of residents that move with typically obvious “flight” or “gentrification” identities. Our MDSS approach is most successful in identifying mobility patterns in these places. The third ring—the exurban fringe—is less densely populated and therefore has relatively little residential movement. In this zone, the MDSS does not recognize significant mobility patterns.
Figure 3 displays our “places” classification results using the MDSS spatial scan technique in the region. Our findings show that the south and west parts of Chicago feature the majority of low-income gentrification in Oak Park (west) and Hyde Park (south) and Hyde Park (south) by medium-income movers and Cicero (southwest) by high income. High- and medium-income flight is seen in Norridge (northwest) and the tip of Skokie (north). It is likely that the decline of the city’s manufacturing economy might play a role in this flight pattern. Rosemount and the O’Hare International Airport area (northwest) show a significant influx in medium- and high-income households that replace households from the lower income spectrum. These patterns might be related to previous findings by Yang et al. (2019) and McMillen (2003) that the O’Hare Airport region is an important employment growth hub and housing in this area is highly desirable for higher income households.

The places classification results using the MDSS spatial scan technique in the seven-county region of Chicago.
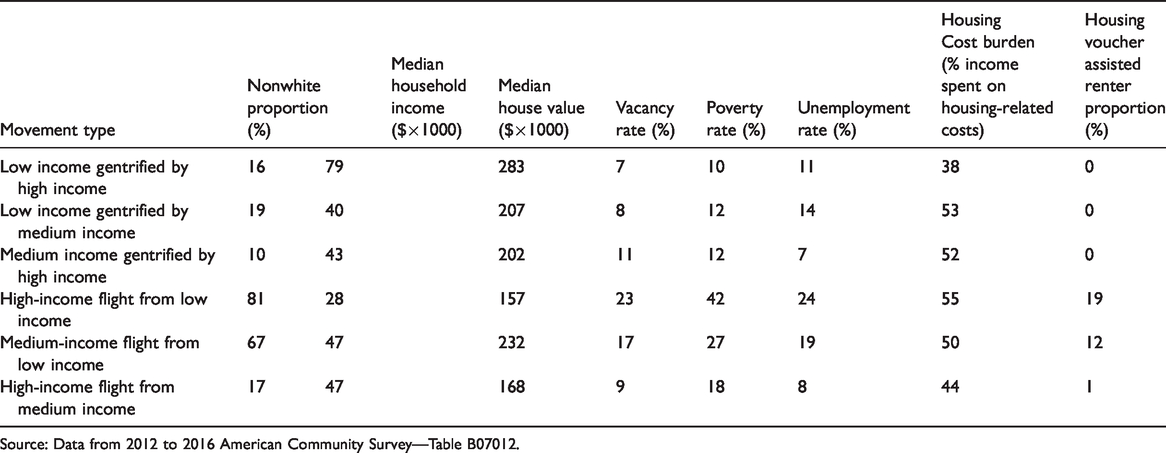
One important observation is that although previous mobility policies have helped mitigate concentrated poverty in the CBD, neighborhoods with better socioeconomic conditions are more likely to gentrify with higher income households replacing low-income households. This type of movement is perpetuating the increasing divide between low- and high-income households. In Table 1, the category “low income gentrified by high income” shows the highest median household income, median house value, and the lowest vacancy rate, poverty rate, and housing cost burden. In comparison, neighborhoods with worse socioeconomic conditions tend to experience flights of high and medium households. The category “high-income flight from low-income” (Table 1) shows the lowest median house values, and the highest vacancy rate, poverty rate, housing cost burden, and unemployment rates. Table 1 further shows that “housing voucher assisted renter proportion” is higher in the high- and medium-income flight neighborhoods from low-income households’ inflow. This finding implies that low-income movement-triggered flights are associated with the existence of the assisted housing voucher program. Our results reveal some insights into the poverty decentralization campaign in Chicago (Chaskin et al., 2012). Some of the movement of low-income households may be the result of state-initiated programs aimed at mitigating concentrated poverty. On the other hand, if the movement exacerbates the exodus of medium- and high-income households, it can compromise goals of creating socioeconomically diverse neighborhoods (Chaskin et al., 2012).
Average socioeconomic statistics for different movement origin–destination (OD) types.
Discussion
Proposal for a PSS-assisted planning process: Residential mobility planning support system (RMPSS)
In this part, we propose the construction of a PSS interface based on the mobility big data and our analytics as a means of democratizing the MDSS methodology for informing movement decisions for low-income households—both by enabling them for more informed decisions and empowering them in collective policy-deliberation practices (such as public planning meetings) to argue for more equitable policy decisions. One central tenant of abating the cycle of poverty for low-income households is to help them move away from neighborhoods of concentrated poverty with assisted mobility programs of multiple levels of governance (McClure, 2006, 2008). To overcome limitations of assisted mobility programs in decentralizing poverty and potential difficulties for disadvantaged groups in accessing technology, PSSs have been found to be a useful way for policy-makers and planners to convene and facilitate public meetings and involve diverse stakeholders into participatory decision-making processes (Auerbach et al., 2018; Bailey et al., 2011; Pan and Deal, 2019).
We constructed a RMPSS to visualize the results of MDSS for Chicago and solicit feedback from local community members. One objective is to test data science and urban informatics techniques. The development of the RMPSS involves three key components: a cloud-based database, a replicable data model framework that translates data into meaningful outcomes for participation, and a front-end design that visualizes the model results for easy access (Figure 4). The interactive visual interface gives users easy access to model information and provides a forum for feedback and local knowledge input. It intends to bridge the gap between users and back-end models; helping extend stakeholder perception, especially for those without professional knowledge (Pelzer et al., 2013). A survey instrument is used to collect comments and as an information creator helping to provide feedback.

The RMPSS framework from backend (database) to server to frontend (model) and user.
Figure 5 displays the visualized planning support interface and feedback portal (RMPSS). Further user surveys and the link to the website are recorded in Supplemental material S2. The interface features visual elements, explanation, and other graphics to convey the complex spatial data science methods used. The goal is to improve both the understandability of the analytical results and their use in public planning and policy formation. The map API allows users to zoom in and out to check specific locations and results, mark important locations (e.g., home, work), and overlay other maps (e.g. crime, census) to further explore model results and interactions. A dropdown for selecting other locations is also included and this allows for the expansion of the approach to other cities.

The screenshot of the RMPSS visualized interface. RMPSS: residential mobility planning support system.
Policy implications
In this study, a model is used to translate large volumes of data into understandable and useful information for planning and policymaking. It is generally difficult for policy-makers and planners to find patterns or draw policy from the raw and tabular residential movement data, which has millions of entries. With the help of this model, the input raw data are processed via the model algorithm and users can easily obtain the visualized analytic results. In our approach, the raw data are made relevant for decision-making in three ways. First, it makes the data accessible by categorizing the OD of movement into understandable terms: gentrification and flight by the various income spectrums. Second, the OD model results are presented in a spatially explicit and highly visual format that can be easily evaluated by local users. It also complements previous research findings that characterize community statistics of the OD comparison of residential mobility (Chaskin et al., 2012; DeLuca et al., 2010; Keels, 2008). Third, the classification of movement destination types uses a resolution that goes beyond traditional administrative or census boundaries. Compared to previous studies of neighborhood mobility characteristics at the census tract level (Greenlee, 2019), our higher resolution scanning approach does identify different boundary patterns to clustering gentrification—flight types of mobility. Moreover, understanding the socioeconomics of the “outflow” and “inflow” of households at better spatial granularity can provide more accurate geolocation analytics and support location-targeted planning strategies, compared with the static and aggregated community-level characterizations (e.g. from census data). Our findings in Table 1 show the misalignment between socioeconomic characteristics of different mobility-type clusters to census tracts.
Previous studies of urban informatics focus on emerging big and open data sets to explaining the urban condition (Foth et al., 2009; Liu et al., 2015; Thakuriah et al., 2017). This study expands the idea to include urban “informatics”—the linkage of these data, to models, user-interfaces, and users (Bilandzic and Venable, 2011). The RMPSS takes advantage of big and spatially explicit data and makes use of advances in open-source computing technology by creating a replicable “model to interface process” through a fast-prototyping exercise of the whole system. We suggest that the urban informatics-based approach is not only useful in a research setting, but it is also important and integral to a data infrastructure with spatially explicit smart city frameworks. It can promote a socio-technical transition toward a new participatory design and planning paradigm.
An important limitation of this study is that we have not yet addressed several issues regarding advocating disadvantaged groups. First, identification of disadvantaged groups is important as a preliminary step for provision of information services. There are other studies that have focused on identification of disadvantaged groups in Chicago (Heller, 2014). Thus, there is a need to use expert knowledge, as well as consulting local knowledge, to identify disadvantaged groups in the locale. Furthermore, continuous local expertise consultation overcomes an identified issue of using statistical model for planning support—the inability to cope with ontological uncertainty (defined as surprises in the form of currently unknown future events—Derbyshire, 2019). To address this issue, it is necessary to use continued criticism from local expertise regarding the statistical model results and make corresponding updates.
Second, there is a need to better expose the technologies to disadvantaged groups, as it is a common issue that disadvantaged groups have less accessibility to and literacy of technologies (Wong et al., 2015). One potential solution to this issue is to apply PSSs in a policy-level rather than individual-level setting, by using the ability of PSSs to convene public stakeholder deliberations and actively involve disadvantaged groups (Jones, 2011; Klosterman, 1995; Yu et al., 2018). The third issue is related to the second issue as disadvantaged groups have limited access to the technology; thus, a web-based feedback solicitation system may not reflect the unbiased opinions from these groups. To address this issue, we confer that the identification of the community in question would help further forms of investigation. The potential approaches include participant observations that interact with targeted groups in everyday life as a means of collecting information from diverse groups (previously applied by sociologists such as Merton, 1945 and Jorgensen, 2015). The feedback solicitation mechanisms should help assess the usefulness and understandability of the interface and potential bottlenecks to use for disadvantaged groups (Vonk and Geertman, 2008; Vonk et al., 2005). Moreover, planners and modelers should be very careful in using the information. It should be limited to the stakeholder deliberation of policy-making processes with a special focus on empowering and informing positions of disadvantaged groups. A publication of the information with equal access to all—though seemingly an “equal” move—is likely to be exploited by, for example, real estate personnel working for the upper class to devise strategies in perpetuating inequity.
Another potential limitation relates to the question about whether income level as the only proxy for opportunity is biased or inadequate, although it is obvious that income correlates with other indicators such as educational attainment and crime rates. Furthermore, the system should be tailored to support for different housing types (single-family houses versus multifamily houses), different price ranges, and different neighborhoods (mixed housing types and prices, or homogenous housing units). These features are found to be related to the residential segregation issue and related findings would contribute to place-based policymaking by providing insights about how different housing features contribute to segregation (Owens, 2019).
Conclusions
Two of the major components of urban informatics are demonstrated in this study: applying spatial data science to analyze extremely large, voluminous, and diverse data sources (“big data”) to understand the science of cities; and proposing the theoretical construct of visualized and interactive interfaces to communicate the information in understandable and useful ways to the public to both push information and solicit feedback.
An important practical contribution of urban informatics is to engage the information in planning processes so that these processes become more sustainable, equitable, and democratic. Although this paper has yet to show the engagement of the RMPSS information in a planning process, we can put forward several ways it might influence a community planning and policy-making process. First, the information provided by the MDSS approach and the RMPSS supports “place-based” policymaking and planning discussions. In total, the approach identifies 17 places with significant residential mobility issues (gentrification to flight). They are not confined by traditional census block group boundaries, so users can zoom in or out using the Google Maps API to see the exact delineation of these boundaries. Understanding the identity of places and their role in mobility decisions over the past 10 years can empower and validate certain voices in planning and policy-making processes. Second, we find significant displacement of low-income households in places with urban redevelopment and fast employment sub-center growth, while significant flight of higher income households in places with a declining economic base. Inevitably, these patterns will increase class differences over time, further polarizing class distinction and heighten conflict. Thus, it is especially important to make these analyses available to disadvantaged groups (in this study as identified by low-income households) through public participation stages in plan-making, in order to advocate the interests of these groups in planning processes. Third, RMPSS enables a coupling and linking of the MDSS to other spatially explicit models such as land use change or stormwater models that would enable a richer and more nuanced look at the implications of the MDSS movement models.
A next step in this study is to collect empirical evidence on the usefulness and effectiveness of the system and interface in helping disadvantaged groups through planning processes. Empirical evidence collection will require acceptance of the policy-making sector for the system’s application, public meeting convening, and subsequent data collection/analysis. Finally, the usage of InfoUSA data needs further validation to assess any biases, and other data, such as microdata at the Federal Statistical Data Center or tax assessor data maintained by local governments, should be used along with InfoUSA data to complement the shortcomings of each data set.
Supplemental Material
sj-pdf-1-epb-10.1177_2399808320924437 - Supplemental material for An urban informatics approach to understanding residential mobility in Metro Chicago
Supplemental material, sj-pdf-1-epb-10.1177_2399808320924437 for An urban informatics approach to understanding residential mobility in Metro Chicago by Haozhi Pan, Si Chen, Yizhao Gao, Brian Deal and Jinfang Liu in EPB: Urban Analytics and City Science
Supplemental Material
sj-pdf-2-epb-10.1177_2399808320924437 - Supplemental material for An urban informatics approach to understanding residential mobility in Metro Chicago
Supplemental material, sj-pdf-2-epb-10.1177_2399808320924437 for An urban informatics approach to understanding residential mobility in Metro Chicago by Haozhi Pan, Si Chen, Yizhao Gao, Brian Deal and Jinfang Liu in EPB: Urban Analytics and City Science
Footnotes
Declaration of conflicting interests
The author(s) declared no potential conflicts of interest with respect to the research, authorship, and/or publication of this article.
Funding
The author(s) received no financial support for the research, authorship, and/or publication of this article.
Supplemental material
Supplemental material for this article is available online.
References
Supplementary Material
Please find the following supplemental material available below.
For Open Access articles published under a Creative Commons License, all supplemental material carries the same license as the article it is associated with.
For non-Open Access articles published, all supplemental material carries a non-exclusive license, and permission requests for re-use of supplemental material or any part of supplemental material shall be sent directly to the copyright owner as specified in the copyright notice associated with the article.