
Abstract
The inequalities that mark global society have been deepening worldwide. They materialize in cities, putting pressure on public transport systems for spatial and temporal supply, at the same time as mobility itself generates multifaceted inequalities. From empirical evidence of four socially and spatially distinct Brazilian cities — São Paulo, Rio de Janeiro, Curitiba, and Fortaleza — we explore how differences in scale, geography, class, and race are related to spatial segregation, leading to different levels of access to jobs by public transport in the global peripheral context. These juxtaposed and combined inequalities create highly unfair and strongly cumulative effects on some social groups, contributing to the reproduction of inequality. Based on public and open data and combining methodologies of spatial analysis to enhance comparability and reproducibility, we explore different areal units, time thresholds, and metrics in order to examine transport inequalities in different urban contexts and refine our results. Upper classes have higher accessibility than lower classes, whites have higher accessibility than blacks, and large cities are more unequal than smaller ones. However, racial inequalities combine and overlap with class and city inequalities, changing these dichotomic notions when multiple dimensions are considered. The groups that polarize social hierarchy also polarize the urban space, since the white upper class and the black lower class are more segregated, but the way segregation interacts with accessibility is not straightforward and varies according to the socio-spatial structure.
Introduction
In the analysis of the socio-spatial structure of cities, even contrasting approaches recognize the centrality of transport systems in relation to land use and occupations, and vice-versa. Classical models from urban economics that emphasize the role of markets in urbanization focus on the impact of transportation on the spatial organization of production, supply, and land prices (Fujita et al., 1999). Critical urban theories emphasize the political and social character of each location in the city, permeated by conflicts between actors over access to urban goods and services (Préteceille, 2000). In both cases, transport systems are considered capable of restructuring workplaces, housing, markets, and consumption, associating space and time (Harvey, 2001). The spatial distribution of individuals and activities presupposes displacements via transportation systems. In turn, transport infrastructure produces differential locational advantages and disadvantages that modify how social groups are distributed in space (Hansen, 1959).
Social inequalities materialize in the urban environment and are redefined by it, assuming different spatial forms through contextualized mechanisms. In the developing world, where consumer goods and services such as sanitation, health, and education are not universalized, access to basic services becomes central to socio-spatial inequalities (Marques, 2019), as well as to residential segregation, reducing the poor population’s access to opportunities.
Despite the growing number of studies linking social and accessibility inequalities theoretically (Martens, 2012; Schwanen et al., 2015) and empirically (Currie, 2010; Nieuwenhuis et al., 2019), income, and more rarely race, are generally studied separately or taken as sole definers of social inequalities, reducing their complexity. Few studies focus on multiple dimensions of social and spatial structures (Bullard and Johnson, 1997; Sanchez and Brenman, 2017).
On race, Karner and Niemeier (2013) and Golub et al. (2013) highlight the lack of racially focused analyses of equity, resulting in limited transport plans. Farber et al. (2015) have shown different patterns of interaction between races, while Tammaru et al. (2016) found an increasing segregation of immigrants over time. Although the aforementioned studies stress the need for research on the link between transport, minorities, and low-income individuals, they make no reference to accessibility. On the economic dimension, a small number of studies include other elements besides income to identify gaps between accessibility and socially disadvantaged neighborhoods, such as age, unemployment (Fransen et al., 2015), and schooling (Currie, 2010).
Although largely concentrated in core countries, some studies on Uruguay (Hernandez, 2018), Colombia (Delmelle and Casas, 2012; Guzman et al., 2017), and Brazil (Pereira, 2019; Slovic et al., 2019) discuss transport-related inequalities from the peripheral countries’ perspective. Most of these works, however, focus on single cities. Looking at multiple Brazilian cities, Boisjoly et al. (2020) study access to jobs and public transport networks considering only income, while Pereira et al. (2019) provide a broader analysis of accessibility in terms of jobs, healthcare facilities, and schools, considering both income and race.Our aim in this paper is to delve deeper into these discussions, exploring better methods for generating comparability and enhancing our understanding of how inequalities in accessibility connect to inequalities in scales, geographies, social structures, and segregation.
In view of the profound social and urban inequalities observed in global peripheral contexts, therefore, more than presenting a juxtaposition of case studies, the proposed comparison sets out to address socio-spatial inequalities related to public transport. We use clustering techniques, spatial microsimulation, satellite imagery, and dasymetric mapping to refine our comparative socio-spatial analysis through multiple areal and temporal units, taking as empirical evidence four major Brazilian metropolises.
The paper is organized as follows. After this introduction, in the “Urban socio-spatial inequalities and public transportation” section, we discuss how social and spatial inequalities relate to the access to opportunities via public transport. The “Urban data and methods” section summarizes the methodology and datasets used in the study. Results concerning interactions between segregation and accessibility are presented in the “Socio-spatial and accessibility inequalities” section. Finally, the “Conclusions” section summarises the results and draws conclusions from the analysis.
Urban socio-spatial inequalities and public transportation
Inequalities relate to social and spatial differentiations between individuals and social groups. Rather than being the product of random distribution, however, they derive from social processes that systematically place some individuals in more favorable conditions than others (Young, 2001), resulting in the accumulation of advantages or disadvantages in economic, political, and cultural spheres (Seth and Santos, 2018). The internal dynamics of societies themselves reproduce both positions and dispositions, contributing to the formation and perpetuation of structures of social inequality (Bourdieu, 1989). Finally, land markets, housing policies, and state regulations add spatial dimensions to these systems of stratification, connecting spatial and social inequalities and giving rise to patterns of segregation (Arbaci, 2019).
Accessibility associates transport systems to land use, indicating the extent to which these enable individuals or groups to reach opportunities and activities (Geurs and Van-Wee, 2004). Several studies have linked a lack of accessibility and lengthy and/or unreliable daily commutes to difficulties in obtaining access to formal labor markets, creating disadvantages for the poor (Ong and Houston, 2002). This has a particular effect on gender (Matas et al., 2010), given the larger burden of domestic work faced by women, and on ethnic and racial minorities (Hellerstein et al., 2008).
Spatial segregation of the poor and low accessibility thus tend to increase job precariousness and labor insecurity, reducing family income and contributing to the persistence of spaces of poverty (Sanchez, 2002). The increased accessibility provided by urban policies, such as transit infrastructures or by the spatial redistribution of households and activities, not only has the potential to reduce inequalities but may also reduce unemployment and improve household income (Jin and Paulsen, 2018). Moreover, shortened travel times can minimize the disutility experienced by people during commutes and allow them to use this time more productively or creatively (Mackie et al., 2001).
In contrast, poor accessibility by public transport among segregated upper classes produces different outcomes. Due to greater power resources to influence the production of urban infrastructure and larger monetary resources to access real estate markets (Pinçon-Charlot and Pinçon, 1989), elites can segregate themselves with the services and goods of most interest to them, creating a monopoly over opportunities, in parallel with Tilly’s (1998) work on social networks. Thus, the effect of segregation on access to opportunities has different meanings for different social groups.
In this context, a growing range of studies have applied accessibility metrics to measure the relationship between transport and social inequality (Lucas, 2012). Some of the remaining challenges concern how to compare different social and urban contexts and how to identify priority groups targeted by public policies. Despite the attractiveness of a 30-minute city, as discussed in North America, Europe, and Australia (Wu and Levinson, 2019), a large number of people in peripheral countries have very low cumulative accessibility, even in a 90- or 120-minute commute. This reflects the larger size of Asian, African, and Latin-American cities, but also historic processes of socio-economic growth, urbanization, and the stage of transport structure development. Thus, a single time threshold fails to capture inequalities or fit every urban context. Nor does the average commute time, or the 60-minute threshold widely adopted in the literature and in transportation plans (Palmateer and Levinson, 2017). This paper aims to further this effort by providing methodological and substantive contributions. First, it introduces a methodological framework for comparative analysis of social, racial, and spatial inequalities. Second, it advances discussions on transport-related inequalities, revealing complex patterns of interactions between accessibility and segregation.
Urban data and methods
These socio-spatial interactions will be described by the spatial correlations between accessibility, segregation, and lower-class population, who are more dependable on public transport. The proposed methods are described below. Moreover, please see a graphical abstract of our methodology (Figure S1).
Metropolitan regions redefinition
In spite of state-level definitions of metropolitan regions, there is no unified national criterion for them (Firkowski, 2012), resulting in heterogeneity across the country. To enhance comparability, we redefined the metropolitan cities based on aspects of contiguity, density, urbanization, and integration. We consider as part of the metropolitan region those municipalities with a contiguous urban area or with more than 60 inhabitants per square kilometer, 70% of workers employed in non-agricultural occupations, and at least 10% of the population commuting daily to work or study in the main city. These parameters were applied in accordance with the literature (Branco et al., 2013; Ingram, 2014).As a result, the redefined metropolitan region of São Paulo dropped from 39 to 36 municipalities, Rio from 22 to 17, Curitiba from 29 to 13, and Fortaleza from 19 to 8.
Socio-economic data and travel times
Demographic, social, and economic data came from the 2010 demographic census, conducted by the Brazilian Institute of Geography and Statistics, while the location of formal jobs was taken from the Annual Social Information Report, issued by the Ministry of Economics and geocoded using GoogleEarthPro.
Transit itineraries included walking, waiting, transfer, and in-vehicle travel times and were computed using the OpenTripPlanner platform for a typical weekday in 2019 and a peak time journey beginning at 7 am. Road networks were obtained from OpenStreetMap and transit data in the general transit feed specification (GTFS) format from local transit agencies. A major limitation of this research is that GTFS data are not available for most Brazilian cities, including municipalities in our four selected metropolitan regions. Therefore, while socio-spatial structure is analyzed through a metropolitan lens, segregation and accessibility are measured and discussed at the main city level. Despite this limitation, we decided to maintain the presentation of social classes and segregation indices at the level of the metropolises in order to give the reader a broader view of their urban structures.
Social and racial classes
Many studies of urban inequalities consider income as a descriptor of social structure due to its direct and intuitive character. The problem is that income substantially diminishes our precision since many elements that stratify societies are not reducible to income, such as degrees of labor market protection, work skills, education and autonomy in the work process, as well as symbolic and cultural features — not to mention the fact that economic cycles and crises produce effects on income, masquerading analyses with conjunctural dynamics. To avoid this problem, social stratification studies have developed methods to classify individuals and social groups empirically into social classes. In our case, we used census sample data from 2010 to classify workers according to a classification that departs from EGP classes, a scheme originally proposed by Erikson et al. (1979) and later adapted to the labor markets of many countries, including Brazil (Erikson and Goldthorpe, 1993; Scalon, 2013). We then regrouped the eight classes of urban workers into three groups by means of a hierarchical cluster analysis, considering income and years of schooling. The following original classes were grouped together: (1) employers and owners with higher- and lower-rank professionals; (2) technicians and supervisors of manual work with higher- and lower-rank routine non-manual workers; and (3) skilled, semi-skilled, and unskilled manual workers. We removed three agricultural classes that represented less than 1% of the populations of the studied cities. Additionally, the three groups of occupations were divided into two racial groups: (1) white (including Asian) and (2) black (including self-declared black, mixed race, and indigenous). The racial information available in the Brazilian census is self-declared skin color, expressing racial identities far more than ancestry (Petruccelli and Saboia, 2013).
This classification poses an additional challenge as the occupation variable is unavailable at the level of the census tract, only the weighting area—different scales of the Brazilian census. The census tract is a more disaggregated territorial unit, designed to consider the operational capacity for data collection. The weighting area corresponds to a larger area in which a longer questionnaire is applied to a household sample. To identify the racial and social composition at smaller scales, we applied the iterative proportional fitting method of spatial microsimulation (Lovelace and Dumont, 2016) based on income and race controls. Using this methodology, individual data containing race, income, and occupation information available at the weighting area level were disaggregated to census tracts, which contained the number of people by race and income only. In simple terms, we assume that, according to the pattern observed in the census sample, census tracts with a higher presence of white people and higher income groups have a higher probability of concentrating white upper-class groups, and so on.
Spatial grid
The analysis of spatially related phenomena is often biased by definition of the size and shape of spatial units. This effect is known as the modifiable areal unit problem (MAUP) and was proven to impact accessibility metrics (Pereira et al., 2019). To check the robustness of our results, therefore, we adopted regular hexagonal grids (Shoman et al., 2018) measuring 500, 1000, 2500, and 5000 meters. Using satellite imagery (Souza et al., 2020), we first corrected the census data to correspond to areas of urban occupation and then redistributed the data to the regular grid using dasymetric mapping.
Spatial segregation
Spatial segregation is measured at the metropolitan level by diversity and isolation indices, representing two of its primary conceptual dimensions (Barros and Feitosa, 2018; Harris and Owen, 2018). At the metropolitan level, the spatial isolation index indicates the potential contact between people belonging to the same group. To capture local facets of segregation and compare them with accessibility, we use the local diversity measure, which evaluates the distribution of groups considering the population at the city level (Feitosa et al., 2005).
Accessibility to formal jobs
Accessibility to formal jobs was calculated through the two-step floating catchment area (2SFCA) method, which takes into account the number of opportunities and the people competing for them (Luo and Wang, 2003). The main limitations of this method are the non-differentiation between activities accessible at times close to the defined limit and the impossibility of establishing a unique optimal threshold suited to different cities. These limitations relate to the modifiable temporal unit problem, which, similarly to MAUP, states that temporal cuts can bias space–time and transport-related analyses (Cöltekin et al., 2011; Pereira, 2019). These were partially tackled through the adoption of multiple time thresholds to evaluate job accessibility by public transport (30, 45, 60, 90, and 120
Spatial correlation
To analyze the spatial correlation first between accessibility and the lower-class population and then between accessibility and segregation, we used global bivariate Moran’s I scatter plots and their local disaggregation represented by LISA maps (Anselin et al., 2006). Consequently, we study the degree to which accessibility in a specific location is correlated with segregation in its neighboring cells. The same interpretation is valid between accessibility and the lower-class population. The stronger this correlation, the higher the absolute value of Moran’s I.
São Paulo, Rio de Janeiro, Curitiba, and Fortaleza
Brazil is one of the largest industrialized countries in the world and notorious for its inequalities. Despite the magnitude of its metropolitan regions and urban disparities, substantial transportation systems were developed across the country, sparser but no different in nature to those found in the North studied by the literature. The study of Brazilian cities can thus offer empirical insights for a better understanding of the relationship between transit structures and social vulnerabilities. We focus on four major metropolises: São Paulo, Rio de Janeiro, Curitiba, and Fortaleza, intentionally choosing cities with different scales and distinct social and transport contexts. Their main characteristics are described below.
São Paulo is the largest urban agglomeration in South America with 19.6 million inhabitants and an urban density of 6320 inhabitants per square kilometer. It is also the continent’s largest economic and financial center, having a socially unequal urban space (Marques, 2017).
Rio de Janeiro constitutes the second largest metropolitan region in the country with 11.3 million inhabitants and 4910 inhabitants per square kilometer. Much of its territory is made up of a rugged and vegetated topography, which impacts its urban occupation (Préteceille and Cardoso, 2008) and accessibility levels (Pereira et al., 2019).
Curitiba’s metropolitan region contains three million people and is also less dense with 2730 inhabitants per square kilometer. It has been identified as a positive example of urban and transport planning. However, this model-city image is set against inequalities in urban occupation and infrastructure (Garcia, 1997).
Positioned in the poorest region of the country, the northeast, Fortaleza is one of the densest cities in Brazil, with 3.3 million people and 4400 inhabitants per square kilometer. Studies have highlighted its recent economic and urban growth, accompanied by increasing housing precariousness (Garmany, 2011).
Our cases include the largest and richest Brazilian cities, São Paulo and Rio de Janeiro, but also highly unequal in terms of income. In fact, Gini coefficients for São Paulo, Rio de Janeiro, and Fortaleza are very similar, ranging between 0.62 and 0.63. However, income levels are much lower in Fortaleza (U$170), while São Paulo and Rio have average incomes of U$280 and U$250, respectively. Curitiba has a slightly higher average income, U$285, and lower inequality (Gini of 0.53).
Therefore, while São Paulo, Rio de Janeiro, and Curitiba are all richer, the latter is less unequal. Fortaleza is both poorer and unequal. On the other hand, both São Paulo and Rio de Janeiro are much larger and denser, while Curitiba is smaller and sparser, and Fortaleza is smaller but presents medium density.
Socio-spatial and accessibility inequalities
Since different mechanisms contribute to urban segregation, this form of socio-spatial inequality is not unique to a particular economic, social, and political system, but assumes different patterns according to the society that forms it (Maloutas, 2008). In Brazilian cities, segregation is highly correlated with class and race (França, 2016), which constitute one focal point of the present study.
In general, social categories are similar across the cities, especially between São Paulo and Rio Janeiro, as discussed in previous studies (Marques et al., 2008; Préteceille and Cardoso, 2008). Curitiba has the highest proportion of employed workers, partly related to lower informality in work, which is lower in the south of the country (IBGE, 2010).
Nonetheless, there are substantial differences in terms of racial composition, primarily associated with Brazil’s colonial history. The northeast and southeast regions had export-oriented sugar economies based on large rural properties and slave labor. This contrasted with the southern region, characterized by greater agricultural diversification and a specific policy of attracting migrant European workers, combined with the eugenicist goal of whitening the population from the late 19th to early 20th centuries (Seyferth, 2002). Moreover, the relative denial of African heritages, as well as the ideology of racial miscegenation (Telles, 2004), contributes to underestimation of the country’s black population. As a result, the respective proportions of white-black populations are 61–39% in São Paulo, 46–54% in Rio de Janeiro, 76–24% in Curitiba, and 35–65% in Fortaleza.
In all cases, however, the proportion of black people is inversely correlated to social class. In Fortaleza, where black residents form the majority of the population, they represent 48% of the upper class, 62% of the middle class, and 72% of the lower class. The same trend is present in the other cities, although at lower levels. Moreover, the earned income gaps between white and black inhabitants provide eloquent evidence of racial inequalities, being on average 17% in the lower class, 33% in the middle class, and 93% in the upper class (Figure S2).
In comparative terms, São Paulo and Curitiba are the most segregated cities, presenting the highest dissimilarity indices — 0.252 and 0.247 — in contrast to Fortaleza, the least segregated city, with 0.187, and Rio de Janeiro with 0.233. The dissimilarity rate decreases when spatial unit size is increased but maintains the same pattern among metropolitan regions for each unit (Krupka, 2007; Sarkar, 2019).
The groups at the two extremes of the social structure — white upper class and black lower class — are not only more segregated, but they also inhabit opposite spaces, probably interacting less with each other. In cities with less black people like Curitiba and São Paulo, the white lower classes tend to be comparatively more segregated. Conversely, black upper classes, middle classes, and white lower classes are more spatially distributed in all cities (Figure S4).
Figure 1 maps the distribution of the white upper class and black lower class, which together polarize the social structure (the distribution of other groups is shown in Figures S5, S6, S7, and S8). While the upper class inhabits the wealthiest areas of the cities — the southwest region of São Paulo, the coastlines of Rio and Fortaleza, and surrounding downtown areas of Curitiba — manual workers primarily occupy distant urban fringes, closer to non-urbanized areas. This reflects the center–periphery model widely adopted throughout the country. Segregation is associated with urban sprawl, an expression of the dispute for the built environment and differential land values (Rolnik, 2019), with the voluntary separation of the rich as the defining element (Villaça, 1998).
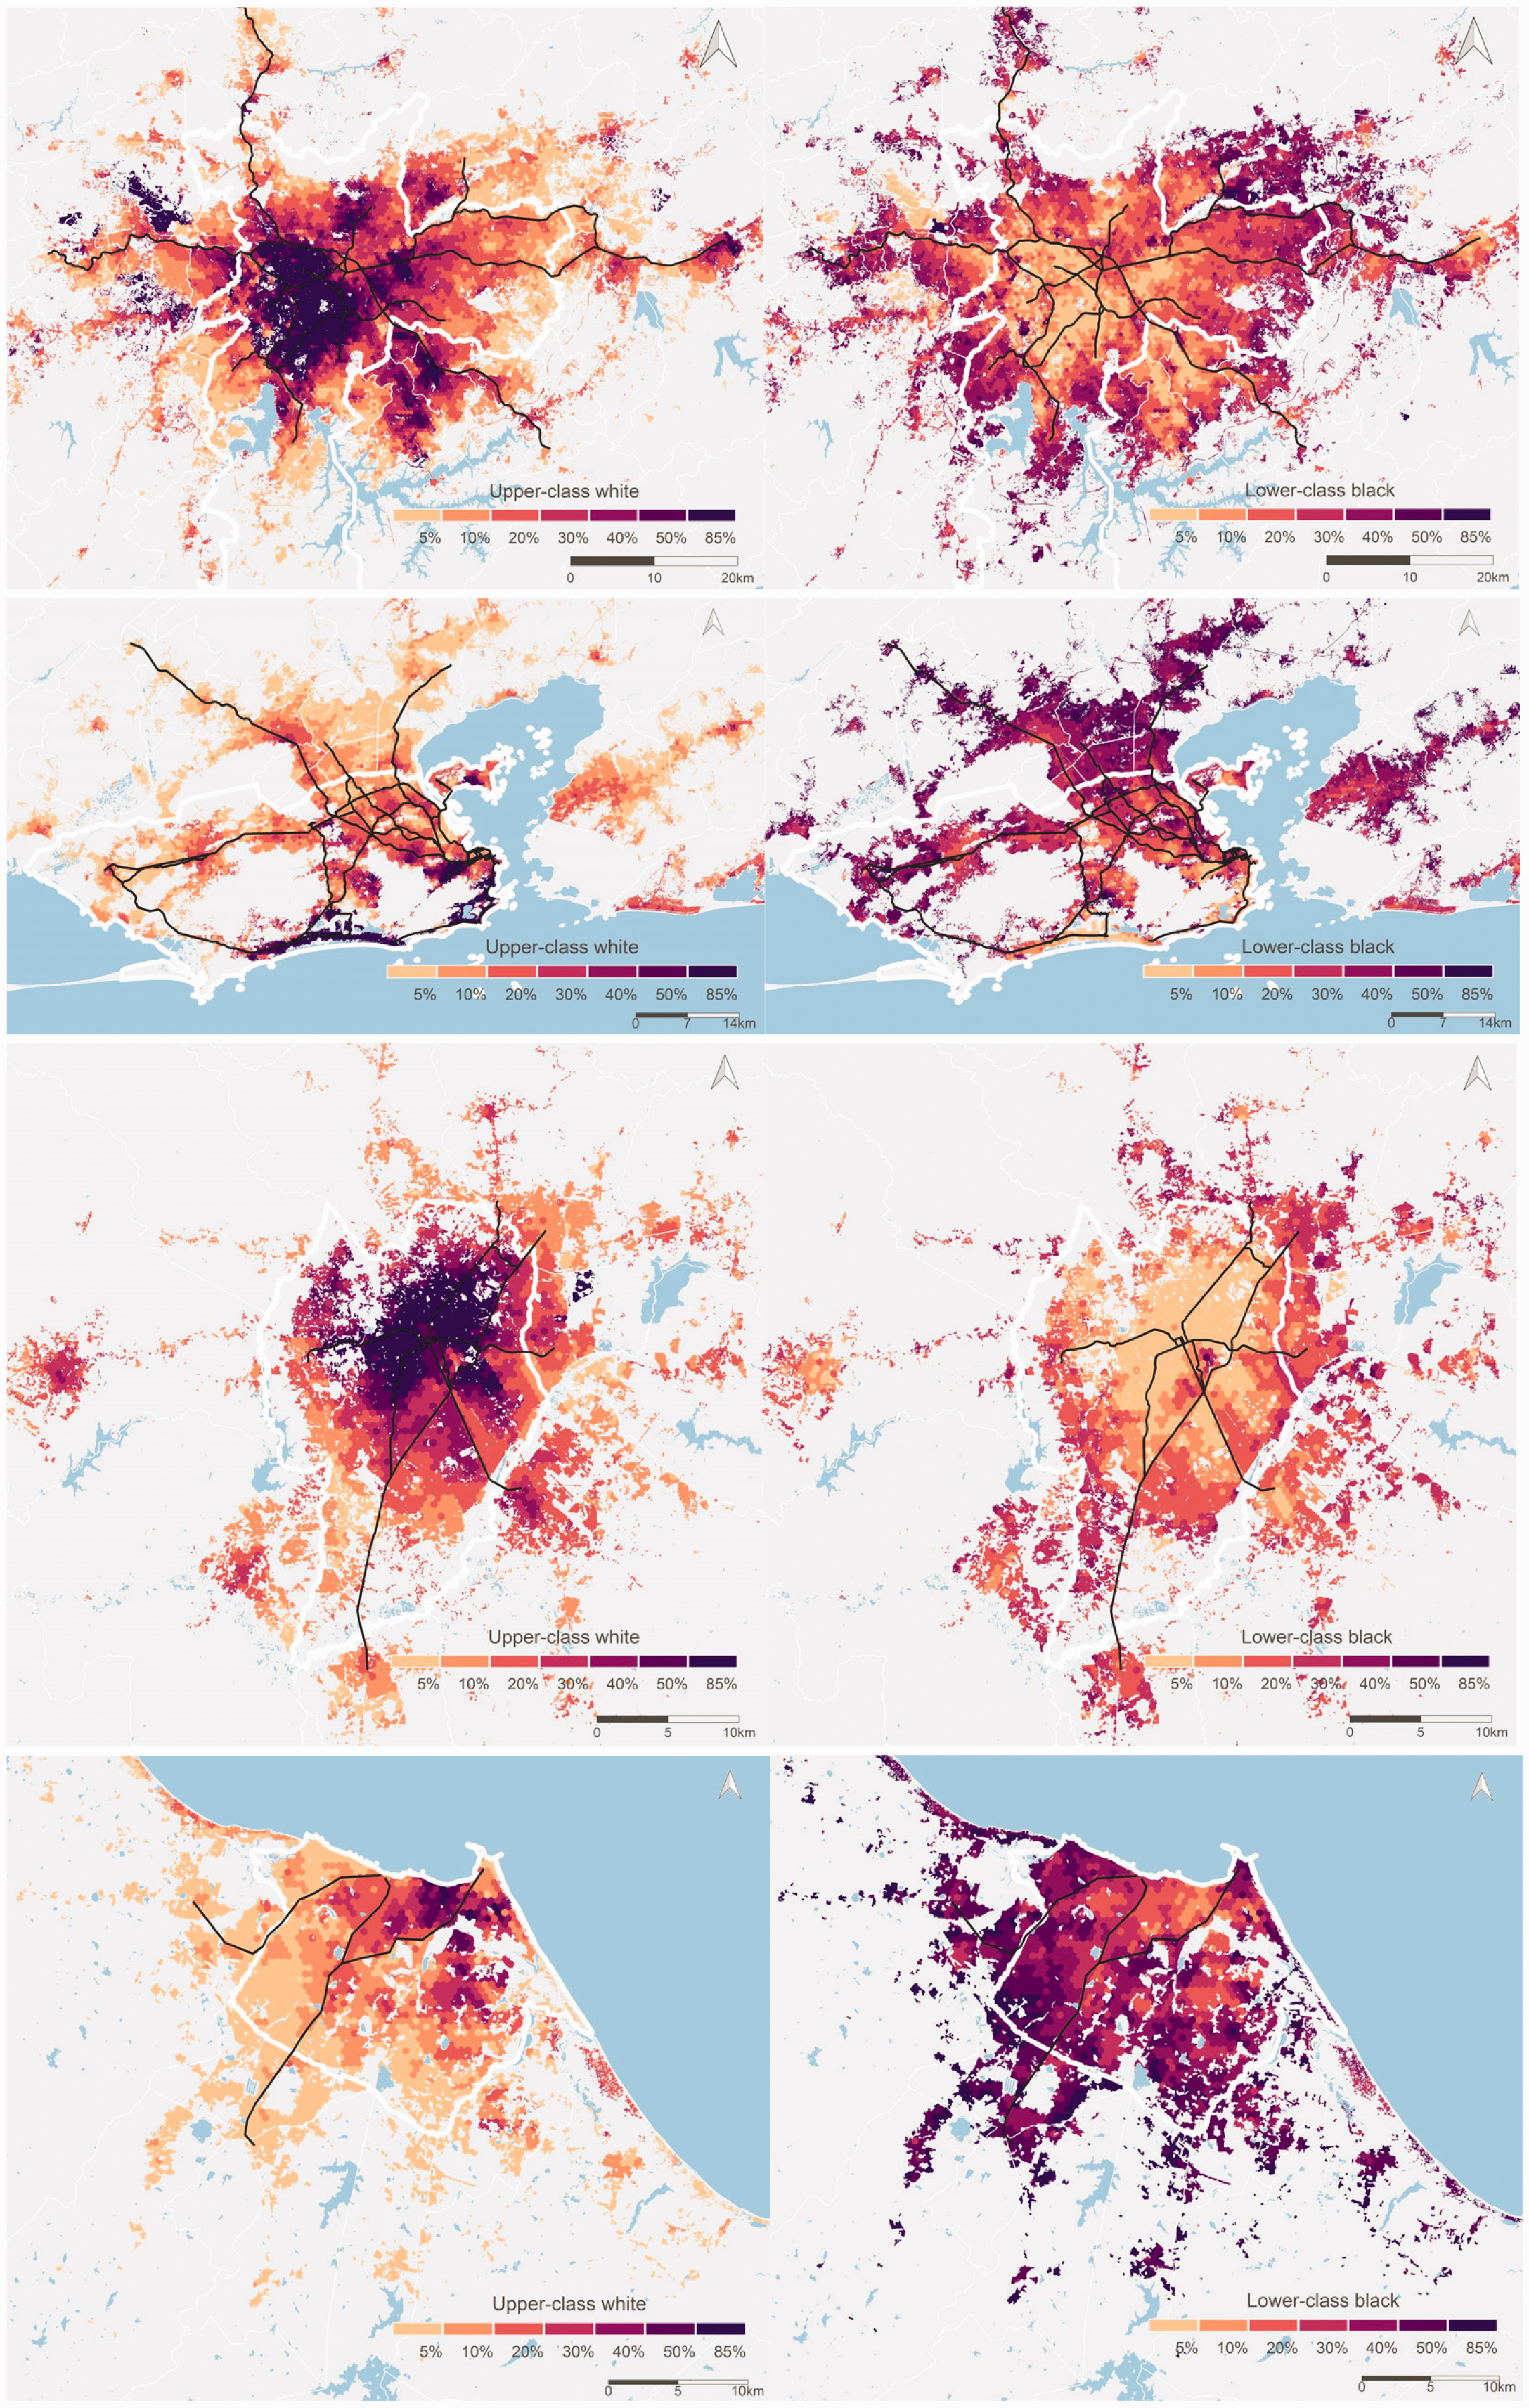
Spatial distribution of the white upper class and black lower class in São Paulo, Rio de Janeiro, Curitiba and Fortaleza.
Metropolitan spaces are far more complex and heterogeneous than just center–periphery, however. Auto-segregation of elites happens in city centers, but also in gated condominiums (Caldeira, 2001). This is particularly true in São Paulo, where upper classes occupy spaces beyond the metropolis itself, mainly in the west and in the ABC region, a traditional industrial zone in the southeast. Among the lower classes, by contrast, the white population lives closer to other groups while black residents live mostly in precarious settlements. In fact, most of the central spots where black manual workers are concentrated in Figure 1 correspond to the biggest slums in all cities.
Similar spatial patterns can be seen in Figure 2, considering accessibility at a 45-minute threshold. This threshold represents the peak of median accessibility difference among groups, indicating higher inequalities. In all cities, central areas present higher accessibility than peripheral regions, given that jobs and transit lines are spatially concentrated in the urban core. These areas with greater levels of accessibility spread out through the city, following expansion vectors near to high and medium capacity transit lines. The most vulnerable areas are those largely populated by manual workers, more dependent on public transport (Figure S9). Small spots of lower-class concentration with high accessibility can be found in historical urban centers or surrounding areas.
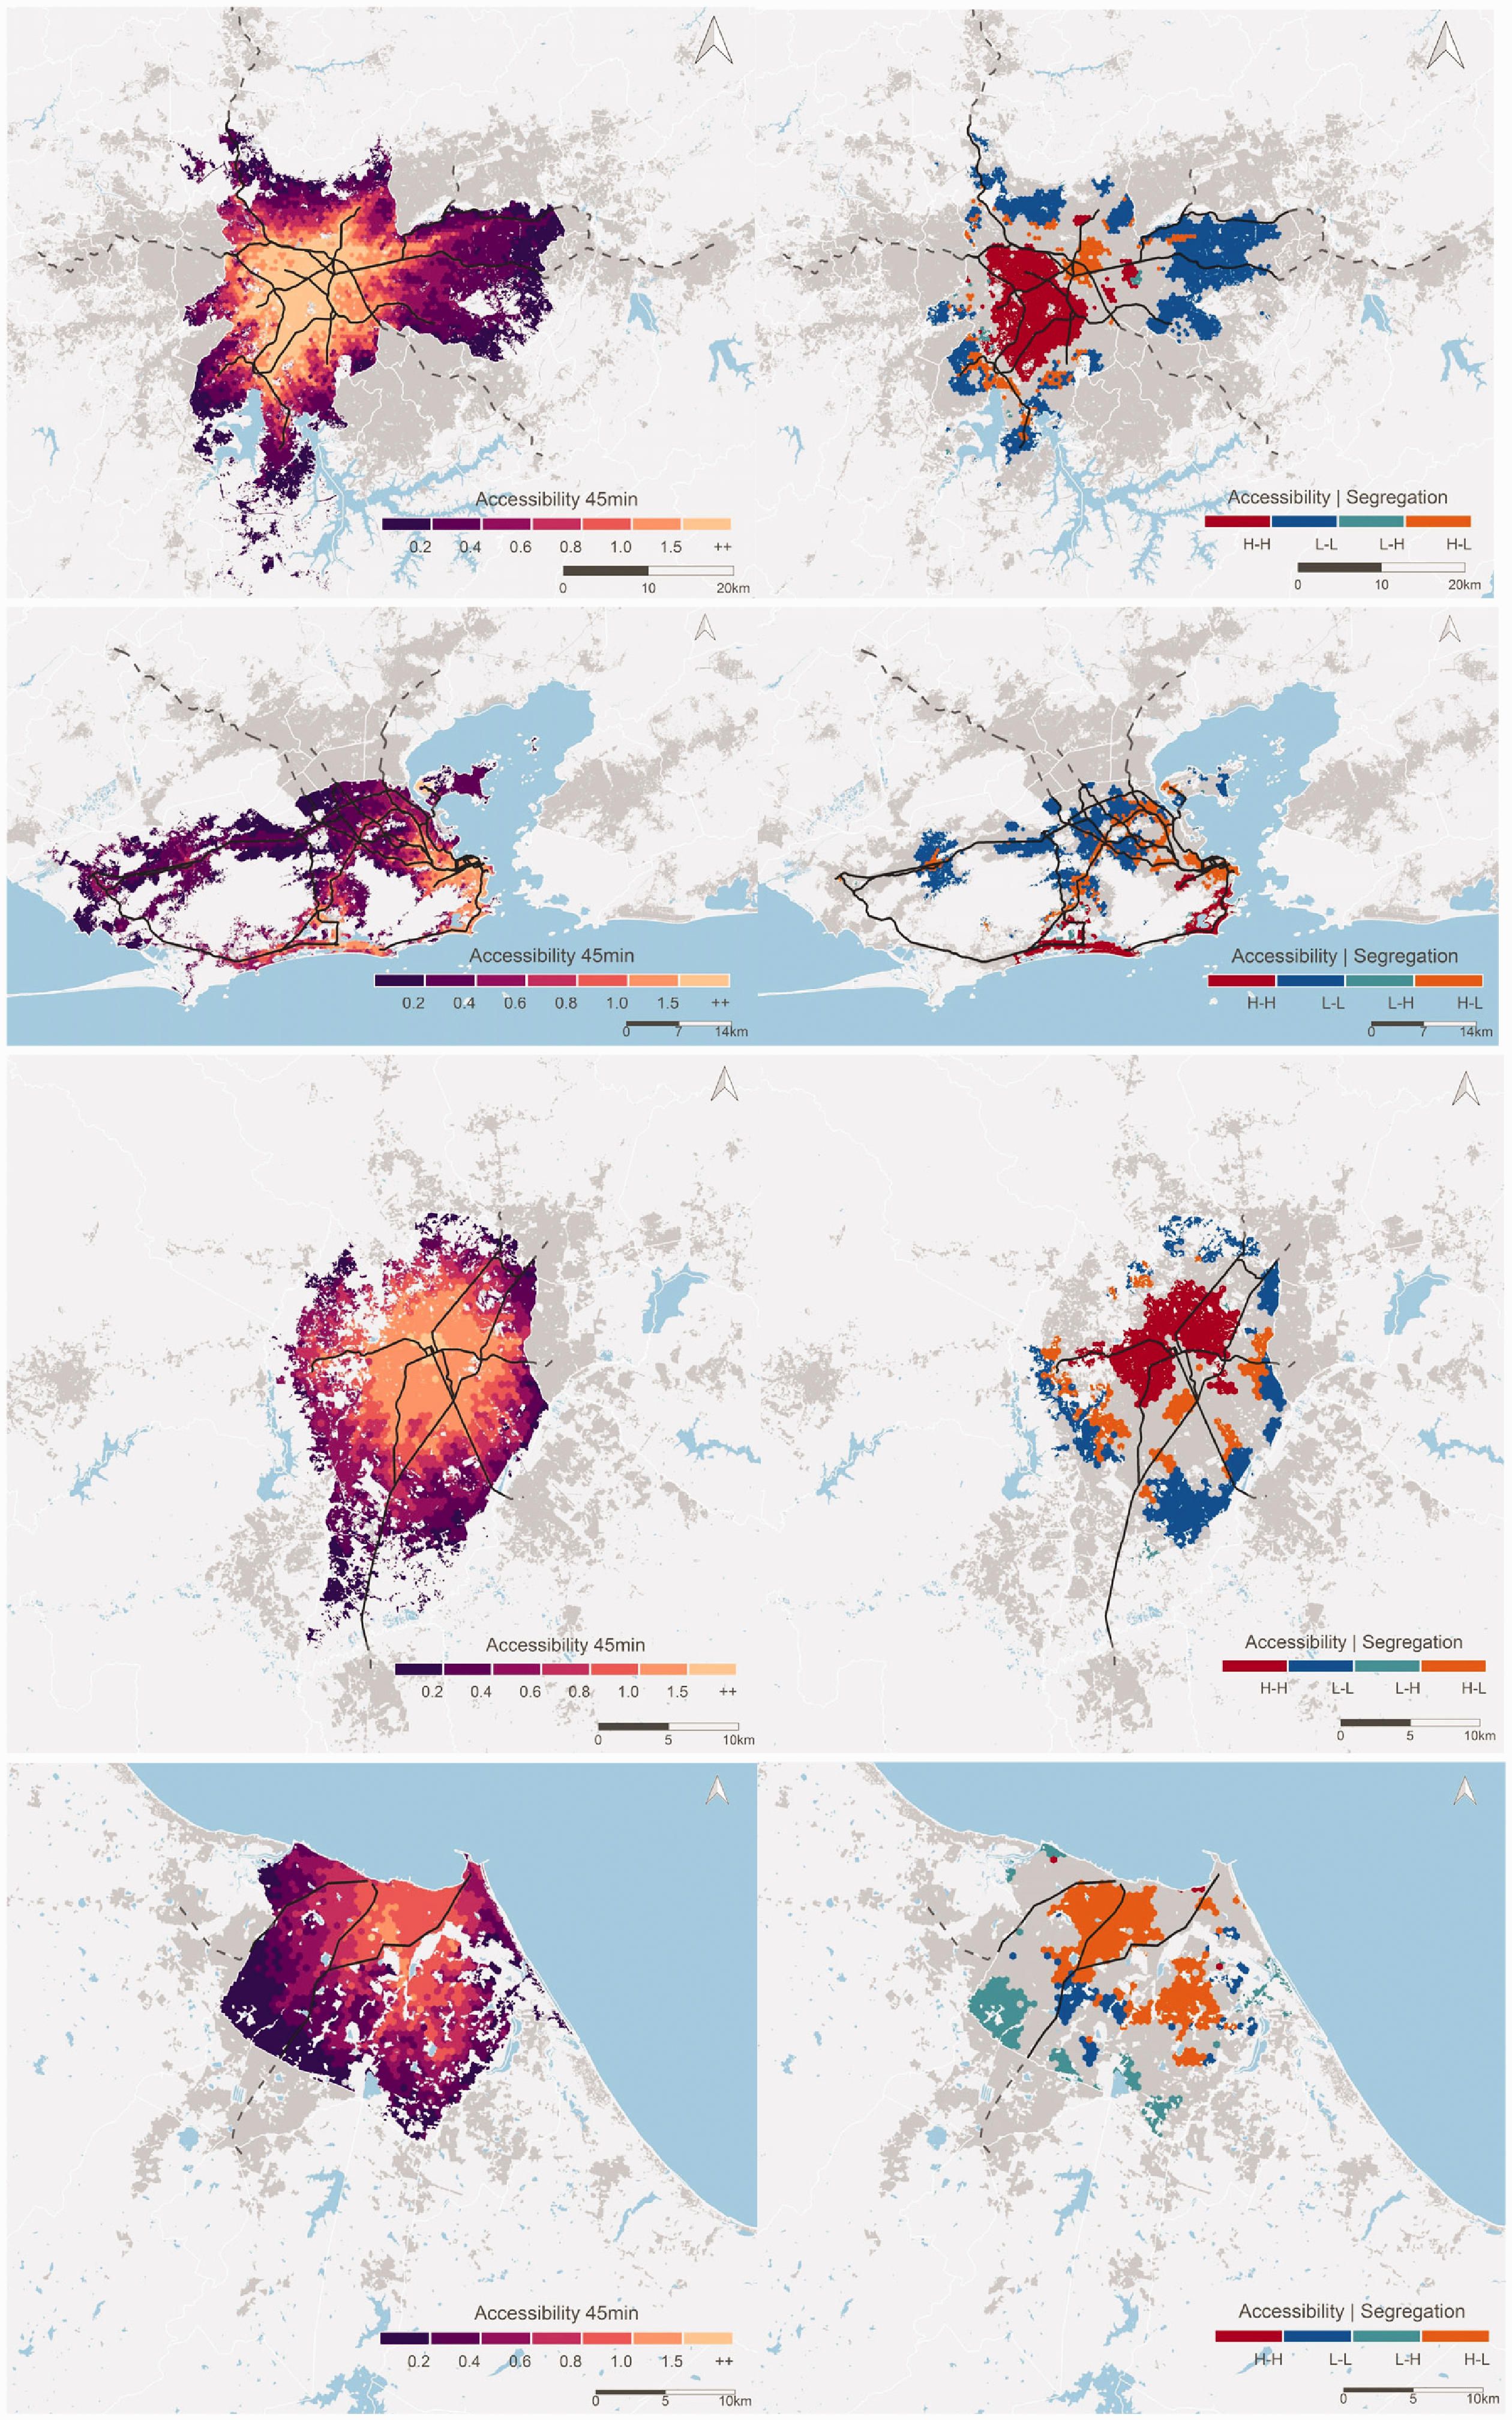
Job accessibility by transit within 45 minutes and LISA map of accessibility and segregation in São Paulo, Rio de Janeiro, Curitiba, and Fortaleza.
Evidently, given their differences in size and stage of socio-economic development, job accessibility in the four cities differs in absolute and relative terms. São Paulo has more than four million formal jobs, compared to two million in Rio de Janeiro, 700,000 in Curitiba, and 600,000 in Fortaleza. Due to its higher population and number of jobs, São Paulo is the city with the highest percentage of workers living at the extremes: around 15% have the highest accessibility levels and more than 20% of the population have the lowest. This pattern is followed by Rio de Janeiro, but with less people with high accessibility, just 4%. More employment opportunities, accessible jobs, and greater competition at the top of the social pyramid contribute to higher wages. The opposite happens at the bottom, where competition tends to decrease wages and widen disparities between rich and poor (Figure S3).
This difference relates to city sizes, differently to what was argued by Krupka (2007) in relation solely to segregation, but also to geographical aspects of urban and transport structures. Rio de Janeiro has half the population of São Paulo and is 20% smaller in area, but due to the location of the city center on the coast, topographical discontinuities, and mountain ranges, the network distance between the central region and the populated outer edges of the city is more than double (65
Socio-spatial inequalities and segregation are associated with different levels of spatial and temporal supply of public transport, restricting interactions between social groups. Figure 2 also shows the spatial correlation between accessibility and segregation. The LISA maps on the right show the location of clusters of high–low accessibility and segregation. Moran’s I scatter plots show the strength and direction of this correlation (Figure S11).
In São Paulo (Moran 0.512) and Curitiba (Moran 0.456), the auto-segregation of elites is prominent and represents higher access to opportunities in the urban space. By contrast, in Fortaleza (Moran −0.464), the involuntary segregation of the poor represents a much smaller accessibility. In all cases, however, the relation between these two dimensions is far from straightforward and the city of Rio de Janeiro (Moran 0.113) is a good example of this phenomenon. Since segregation is related to the spatial concentration of social groups (Barros and Feitosa, 2018), very often, when the political and financial power of elites combines with the desire for particular services, segregation of the upper classes means higher access to opportunities (Pinçon-Charlot and Pinçon, 1989). However, it may also create highly segregated neighborhoods in distant parts of the city (Caldeira, 2001).
In the opposite scenario, the spatial concentration of poverty significantly affects living conditions and social and spatial mobility by imposing difficulties and barriers to accessing jobs, income, education, cultural repertoire (Marques, 2017) and political empowerment (Ribeiro and Santos, 2003). In other words, besides physical distance, there are other obstacles to the access of social groups to opportunities in the urban space, and the multiple patterns across cities indicate that the interaction between accessibility and segregation changes according to social, spatial, and transport structures, themselves related to historical processes of land use and occupation.
A comparable analysis can be achieved with the use of median accessibility levels for each social group, as shown in Figure 3 (different time thresholds in Figure S10). Dots and lines correspond to accessibility for 500-meter cells and values for other grid sizes fall within the error bars.
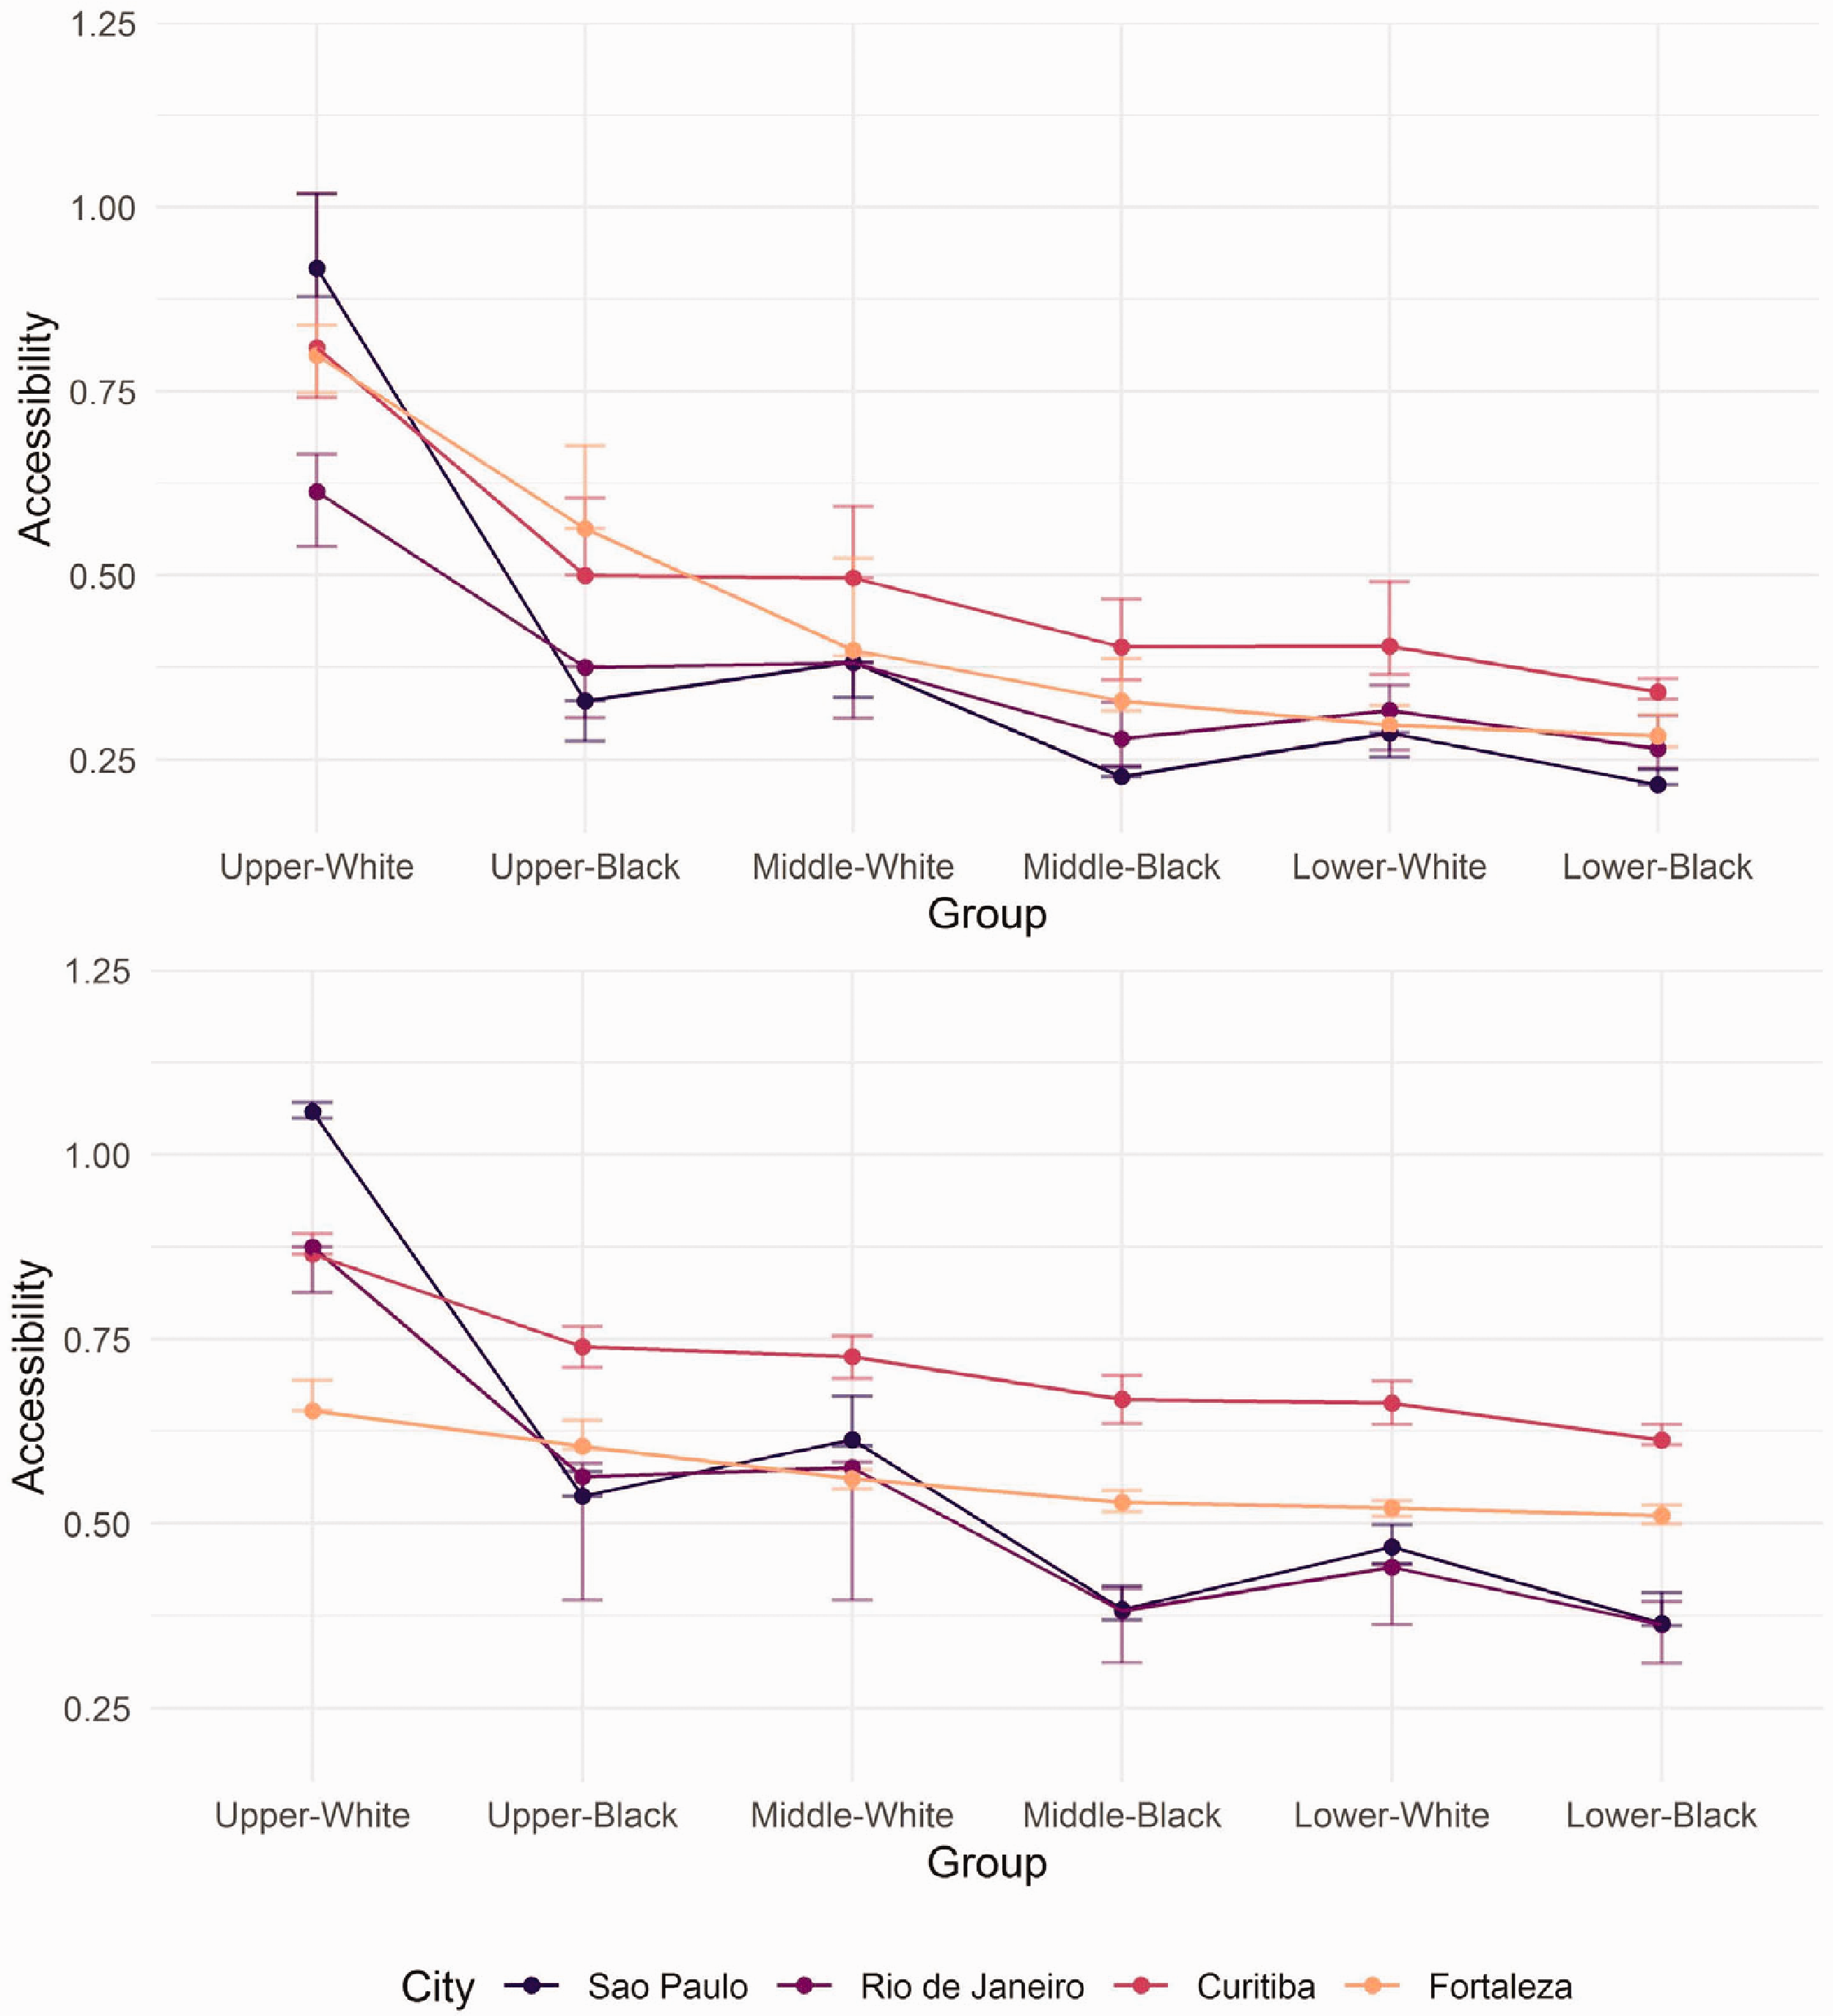
Median job accessibility levels within 30 (top) and 60 (bottom) minutes by public transport.
First, the upper class has greater accessibility to formal jobs than the middle class, who have better accessibility levels than the lower class. There is thus a correlation between social structure and access to opportunities. However, this structure changes when we also consider race. Black upper-class people have accessibility levels more similar to (and sometimes lower than) those presented by the white middle class than those presented by the white upper class. This pattern is consistent among all three social classes and all four cities. In the two biggest cities, the difference between races is even sharper. This suggests that racial inequalities combine and overlap with class and city inequalities.
In general, accessibility levels in Curitiba are higher than in Fortaleza. Nonetheless, in terms of access to jobs, white upper classes are very similar, but the black upper classes are considerably better off in Fortaleza, since they are more numerous and better located. Comparing the two biggest cities, accessibility in Rio and São Paulo is quite similar with the latter slightly lower.
However, although the smaller cities tend to have higher accessibility levels than the larger ones, this is not always true. Being a white upper-class worker in a large city means having relatively higher access to opportunities than in any smaller city. The opposite occurs if you are a black lower-class worker, for whom distances between home and work in big cities tend to be larger and transit systems worse. In other words, since economic activities are clustered near wealthier households, the best possible scenario is to be an upper-class worker in a large city and the worst scenario is to be a manual worker also in a large city, due to the longer commuting times. Inequalities in urban occupation and transit accessibility among social classes are big enough to accentuate or diminish influences from city size and geographical barriers.
Finally, changes in areal units, though significant, did not produce substantive changes in segregation or job accessibility inequalities among groups. Although median values of accessibility and segregation vary in changing spatial units, the structure of inequality among groups and cities remains constant. This finding suggests that socio-spatial and transport-related inequalities are largely structured at a macro-level, associated with segregation and the spatial concentration of employment and infrastructure. Micro-level heterogeneity is particularly present in Rio de Janeiro, indicated by the spatial distribution of social groups and reinforced by the greater distance between median values of accessibility and segregation for different hexagon sizes.
Conclusions
This article presents compelling evidence that inequalities in terms of class, race, and geographies are related to segregation patterns and accessibility to public transport. Groups at the extremes of the social structure live in highly segregated spaces and have contrasting levels of access to opportunities. Race adds another layer, since the black population not only receives lower wages, but they also have systematically worse physical access to jobs than white people from the same social class. This applies more strongly to elites than the lower classes, for whom racial differences in segregation are smaller.
Such inequalities vary in the studied cities, constituting heterogeneous and complex socio-spatial structures. In larger cities, commuting times needed for individuals to cross urban space are longer and inequalities in accessibility are higher. In addition, geographical aspects and spatial discontinuities impact urban occupation and pose barriers and difficulties to travel. Indeed, regional inequalities change how social and racial inequalities manifest in the urban space. Cities with larger proportions of black residents tend to be more integrated and less unequal. Nevertheless, even where the black population comprises a majority, white residents are still better located and enjoy higher levels of accessibility.
In addition, segregation and accessibility interact in different ways, related to a variety of social and spatial elements. Upper classes are not always more segregated than other groups, while the spatial separation of upper classes does not always translate as better access to jobs via public transport, since other advantages may drive occupation, including the desire for exclusivity, natural landscapes, and other urban amenities.
Therefore, this study highlights the multiple and interactive dimensions of inequality that structure societies and cities. The effect of race in accessibility is not constant across social classes, nor are the gains and losses of belonging to a particular social group in different cities, as looking at these variables separately might suggest.
Lastly, there remain limitations to this study. Given the unavailability of data on the informal economy, it has considered only accessibility to formal jobs. The problem is relevant even if the location of formal and informal jobs is highly correlated (Pereira, 2019) and, more importantly, informal jobs are usually more insecure and lower paid, offering different assets to workers. However, in-depth research still needs to be undertaken to properly account for these differences. Moreover, we have demonstrated the relationship between class, race, and city inequalities in distinct Brazilian metropolises. Further comparative studies between cities from different global contexts may show how and whether this pattern persists across countries and continents, and how it interacts with different local contexts, segregation structures, and transportation systems.
Supplemental Material
sj-pdf-1-epb-10.1177_2399808320958426 - Supplemental material for Cumulative (and self-reinforcing) spatial inequalities: Interactions between accessibility and segregation in four Brazilian metropolises
Supplemental material, sj-pdf-1-epb-10.1177_2399808320958426 for Cumulative (and self-reinforcing) spatial inequalities: Interactions between accessibility and segregation in four Brazilian metropolises by Tainá A Bittencourt, Mariana Giannotti and Eduardo Marques in Environment and Planning B: Urban Analytics and City Science
Footnotes
Declaration of conflicting interests
The author(s) declared no potential conflicts of interest with respect to the research, authorship, and/or publication of this article.
Funding
The author(s) disclosed receipt of the following financial support for the research, authorship, and/or publication of this article: This study was financed in part by the Coordination for the Improvement of Higher Education Personnel – CAPES (Finance Code: 001), the Brazilian National Council for Scientific and Technological Development – CNPq (Grant Number: CNPq 310908/2017-5), and by São Paulo Research Foundation – FAPESP (Grant number: 13/07616-7).
Supplemental Material
Supplemental material for this article is available online.
References
Supplementary Material
Please find the following supplemental material available below.
For Open Access articles published under a Creative Commons License, all supplemental material carries the same license as the article it is associated with.
For non-Open Access articles published, all supplemental material carries a non-exclusive license, and permission requests for re-use of supplemental material or any part of supplemental material shall be sent directly to the copyright owner as specified in the copyright notice associated with the article.