
Abstract
Improving perceptions of service quality is a promising planning strategy for increasing the attractiveness and retaining the ridership of public transport systems. The widespread use of social media presents an opportunity to investigate the performance of transport services from the customer’s perspective. This study proposes a framework for integrating quantitative and qualitative analyses to investigate the perceptions of transport services by mining data from social media. We utilise Sina Weibo data related to the Shenzhen metro system to illustrate a text mining process categorised by semantic, spatial and temporal information. On the semantic front, in addition to identifying service attributes and sentiment polarity consistent with previous literature, we find attributes specific to the Chinese context. We also identify clear temporal variations among different service attributes by visualising the number of corresponding microblogs across varying time scales such as hours, days and weekdays. The spatial variations reveal five main clusters around central business districts and transport hubs, which produce the highest density of reports about crowdedness, waiting times, reliability and frequency. However, microblogs that report on perceptions of safety and personnel behaviour present a different spatial pattern. This research offers insights into the ways in which we can use social media data to identify key service areas for immediate improvement and to monitor and manage metro systems more effectively over the long term.
Introduction
Excessive car use creates urban challenges (e.g. greenhouse gas emissions, severe traffic congestion and road safety problems). Shifting from private vehicles to public transport is an efficient solution. Higher service quality affects customer satisfaction with public transport and ultimately increases positive behaviour intentions, such as willingness to repurchase and recommend the service (Cronin et al., 2000; Lai and Chen, 2011). Therefore, transport stakeholders must identify the most important service quality attributes (SQAs) to satisfy customers. However, the evaluation of service quality has long focused on effectiveness and efficiency measures such as cost, capacity, frequency, vehicle miles travelled and expense. Subsequently, many researchers have argued that SQAs should be grounded in the consumer’s perspective. That is, the service should be designed and performed in a way that accommodates the levels of service required by customers (Beirão and Cabral, 2007; Das and Pandit, 2013; Eboli and Mazzulla, 2011; He and Thøgersen, 2017; Tao et al., 2019).
Traditionally, service quality can be evaluated by users’ perceptions, which are collated using evaluations of individual service attributes and combined to constitute an overall judgement (Cunningham et al., 2000). Users’ perceptions of transit services are generally obtained from stated importance/preference surveys or customer satisfaction surveys. Methodologically, various measurement approaches have been applied to identify which SQAs are important for the passenger’s overall satisfaction such as structural equation modelling (Eboli and Mazzulla, 2007; Lai and Chen, 2011), factor analyses (Fellesson and Friman, 2012; Tyrinopoulos and Antoniou, 2008) and discrete choice models (Dell’Olio et al., 2010; Eboli and Mazzulla, 2010). Several SQAs have been identified as determinants characterising customer satisfaction, such as on-board cleanliness, comfort, personnel behaviours/attitudes, safety, service frequency, on-board information, waiting conditions, fares and punctuality (Table A1 in the Supplemental Material).
However, traditional approaches have certain limitations. First, the collection process is usually costly, time-consuming and can be surprisingly inaccurate (Flyvbjerg et al., 2005). Second, customer surveys are predetermined by scholars and, thus, fail to comprehensively cover all user- or context-specific SQAs (Shin, 2019). Third, some studies have found that the importance attached to perceived transit services depends significantly on the spatial context (Diab and El-Geneidy, 2012; Eboli et al., 2018; Hernandez et al., 2016) and temporal scales (Cats et al., 2015; Nkurunziza et al., 2012). Whilst prior studies using cross-sectional research design are limited to a certain time window and space (e.g. stations and lines), they are not able to continuously capture the highly dynamic nature of traveller’s subjective evaluations regarding both spatial and temporal dimensions.
The use of big data to advance service quality research has gained popularity in numerous transport studies, and this has been used to supplement traditional surveys (Rashidi et al., 2017; Wang et al., 2018). User-generated content (UGC) from social media can be viewed as a ‘human sensor’ technology enriched with spatial, temporal and textual information, a potentially valuable source of information regarding the physical environment and social phenomena (Goodchild, 2007). While UGC has gradually gained attention in public transport research, it has yet to reach its full potential (Gal-Tzur et al., 2014; Grant-Muller et al., 2014). Most studies focusing on mining public opinion from UGC have recorded broad emotional responses (e.g. ‘positive’ or ‘negative’) regarding transit service or particular incidents (e.g. Collins et al., 2013; Haghighi et al., 2018; Schweitzer, 2014). To the best of our knowledge, very limited research has specifically used data mining techniques to analyse transit SQAs and their spatial and temporal dynamics (e.g. Shin, 2019).
This study extends the use of UGC in public transport research by mining transit-related microblogs and measuring spatial and temporal patterns of identified service dimensions. Building on an individual-level UGC dataset retrieved from the Chinese social media platform Sina Weibo, we aim to provide insights on the current performance of the transport system, to provide an account of public opinion of the performance, and indicate locations and times that might be prioritised for improvement. Two research questions are proposed:
Do the data on identified transit SQAs obtained by mining social media differ from what is found in the current literature? Are users more sensitive to certain SQAs at particular times and in particular places?
Social media data on public transport
Social media has significantly transformed the way travel information is disseminated and exchanged (Kaplan and Haenlein, 2010). Transportation researchers have used UCG to analyse social media feeds with different purposes (e.g. travel demands and behaviour modelling and incident detection and management).
Among the few studies that analyse social media transportation data, many focus on sentiment and semantic analyses to capture public opinions/feelings (e.g. Schweitzer, 2014). Collins et al. (2013) used sentiment analysis to analyse real-time transit rider satisfaction of performance factors in Chicago. They found that some irregular events were identified, where negative sentiments were the majority. Luong and Houston (2015) applied sentiment analysis and topic modelling techniques to study Twitter data regarding public opinions of light rail transit services in Los Angeles and found differentiated insights from comments, criticisms and shared information. However, some scholars challenged the sentiment analysis methods for its inability to identify sarcasm/irony in the text (Grant-Muller et al., 2014). For instance, Casas and Delmelle (2017) pointed out that this broad sense of ‘positive’ or ‘negative’ could not provide a concrete understanding of users’ opinions on the transit system. Accordingly, they conducted a two-step content analysis to extract information related to transit quality factors by examining Twitter feeds. The analysis revealed that passengers’ primary concerns in Cali, Colombia were safety, system infrastructure and behaviour issues. These studies provided methodological references for our study of using social media data to reveal perceived public transit quality in the context of Chinese cities.
The contribution of this study is twofold. First, social media mining in service evaluation is a relatively new field that can be beneficial to public agencies seeking to influence individual perceptions about public services such as transit. Most traditional studies investigated customer’s perceptions based on predefined service quality surveys and thus fail to capture certain context specific SQAs. This study is the first to investigate the performance of metro systems in the Chinese context by mining social media data, providing a useful methodological framework and empirical reference for understanding SQAs from the customer’s perspective. Our research methodology framework is cost-effective, time-efficient and generalisable and can be easily applied in other Chinese cities or regions. Second, this study highlights the framework’s feasibility, and its results have policy implications in urban management. Continuously tracking customer perceptions and sentiments towards the metro service in spatial and temporal dimensions can help transport planners and policymakers develop strategic plans to improve the service quality and ease passenger concerns.
Method
Our main source of social media data in this study is Weibo, also known as Chinese Twitter. Weibo is the major Chinese social media platform where users can obtain, post, and exchange information. By December 2018, Weibo had 462 million active users per month, more than 200 million of whom use Weibo daily (Weibo Data Centre, 2019). Its users comprise mainly young people: 89% of active users are aged between 18 and 40 years old. The users’ gender is more balanced: 57% are male versus 43% female.
The methodological framework is presented in Figure 1. The process and analysis of Weibo microblogs involved three dimensions: semantic, temporal and spatial. The semantic front is comprised of basic text processing and SQA categorisation using a two-step content analysis. The temporal dynamics include the visualisation of time series data along with their sentiment polarity in different temporal scales, and the spatial dynamics analyse the spatial patterns of SQAs by applying the Kernel density estimation (KDE) method. This framework utilised data mining techniques, content analysis and the spatial and visualisation capabilities of GIS. This integration should help transport planners improve SQAs and provide spatial and temporal intervention strategies.
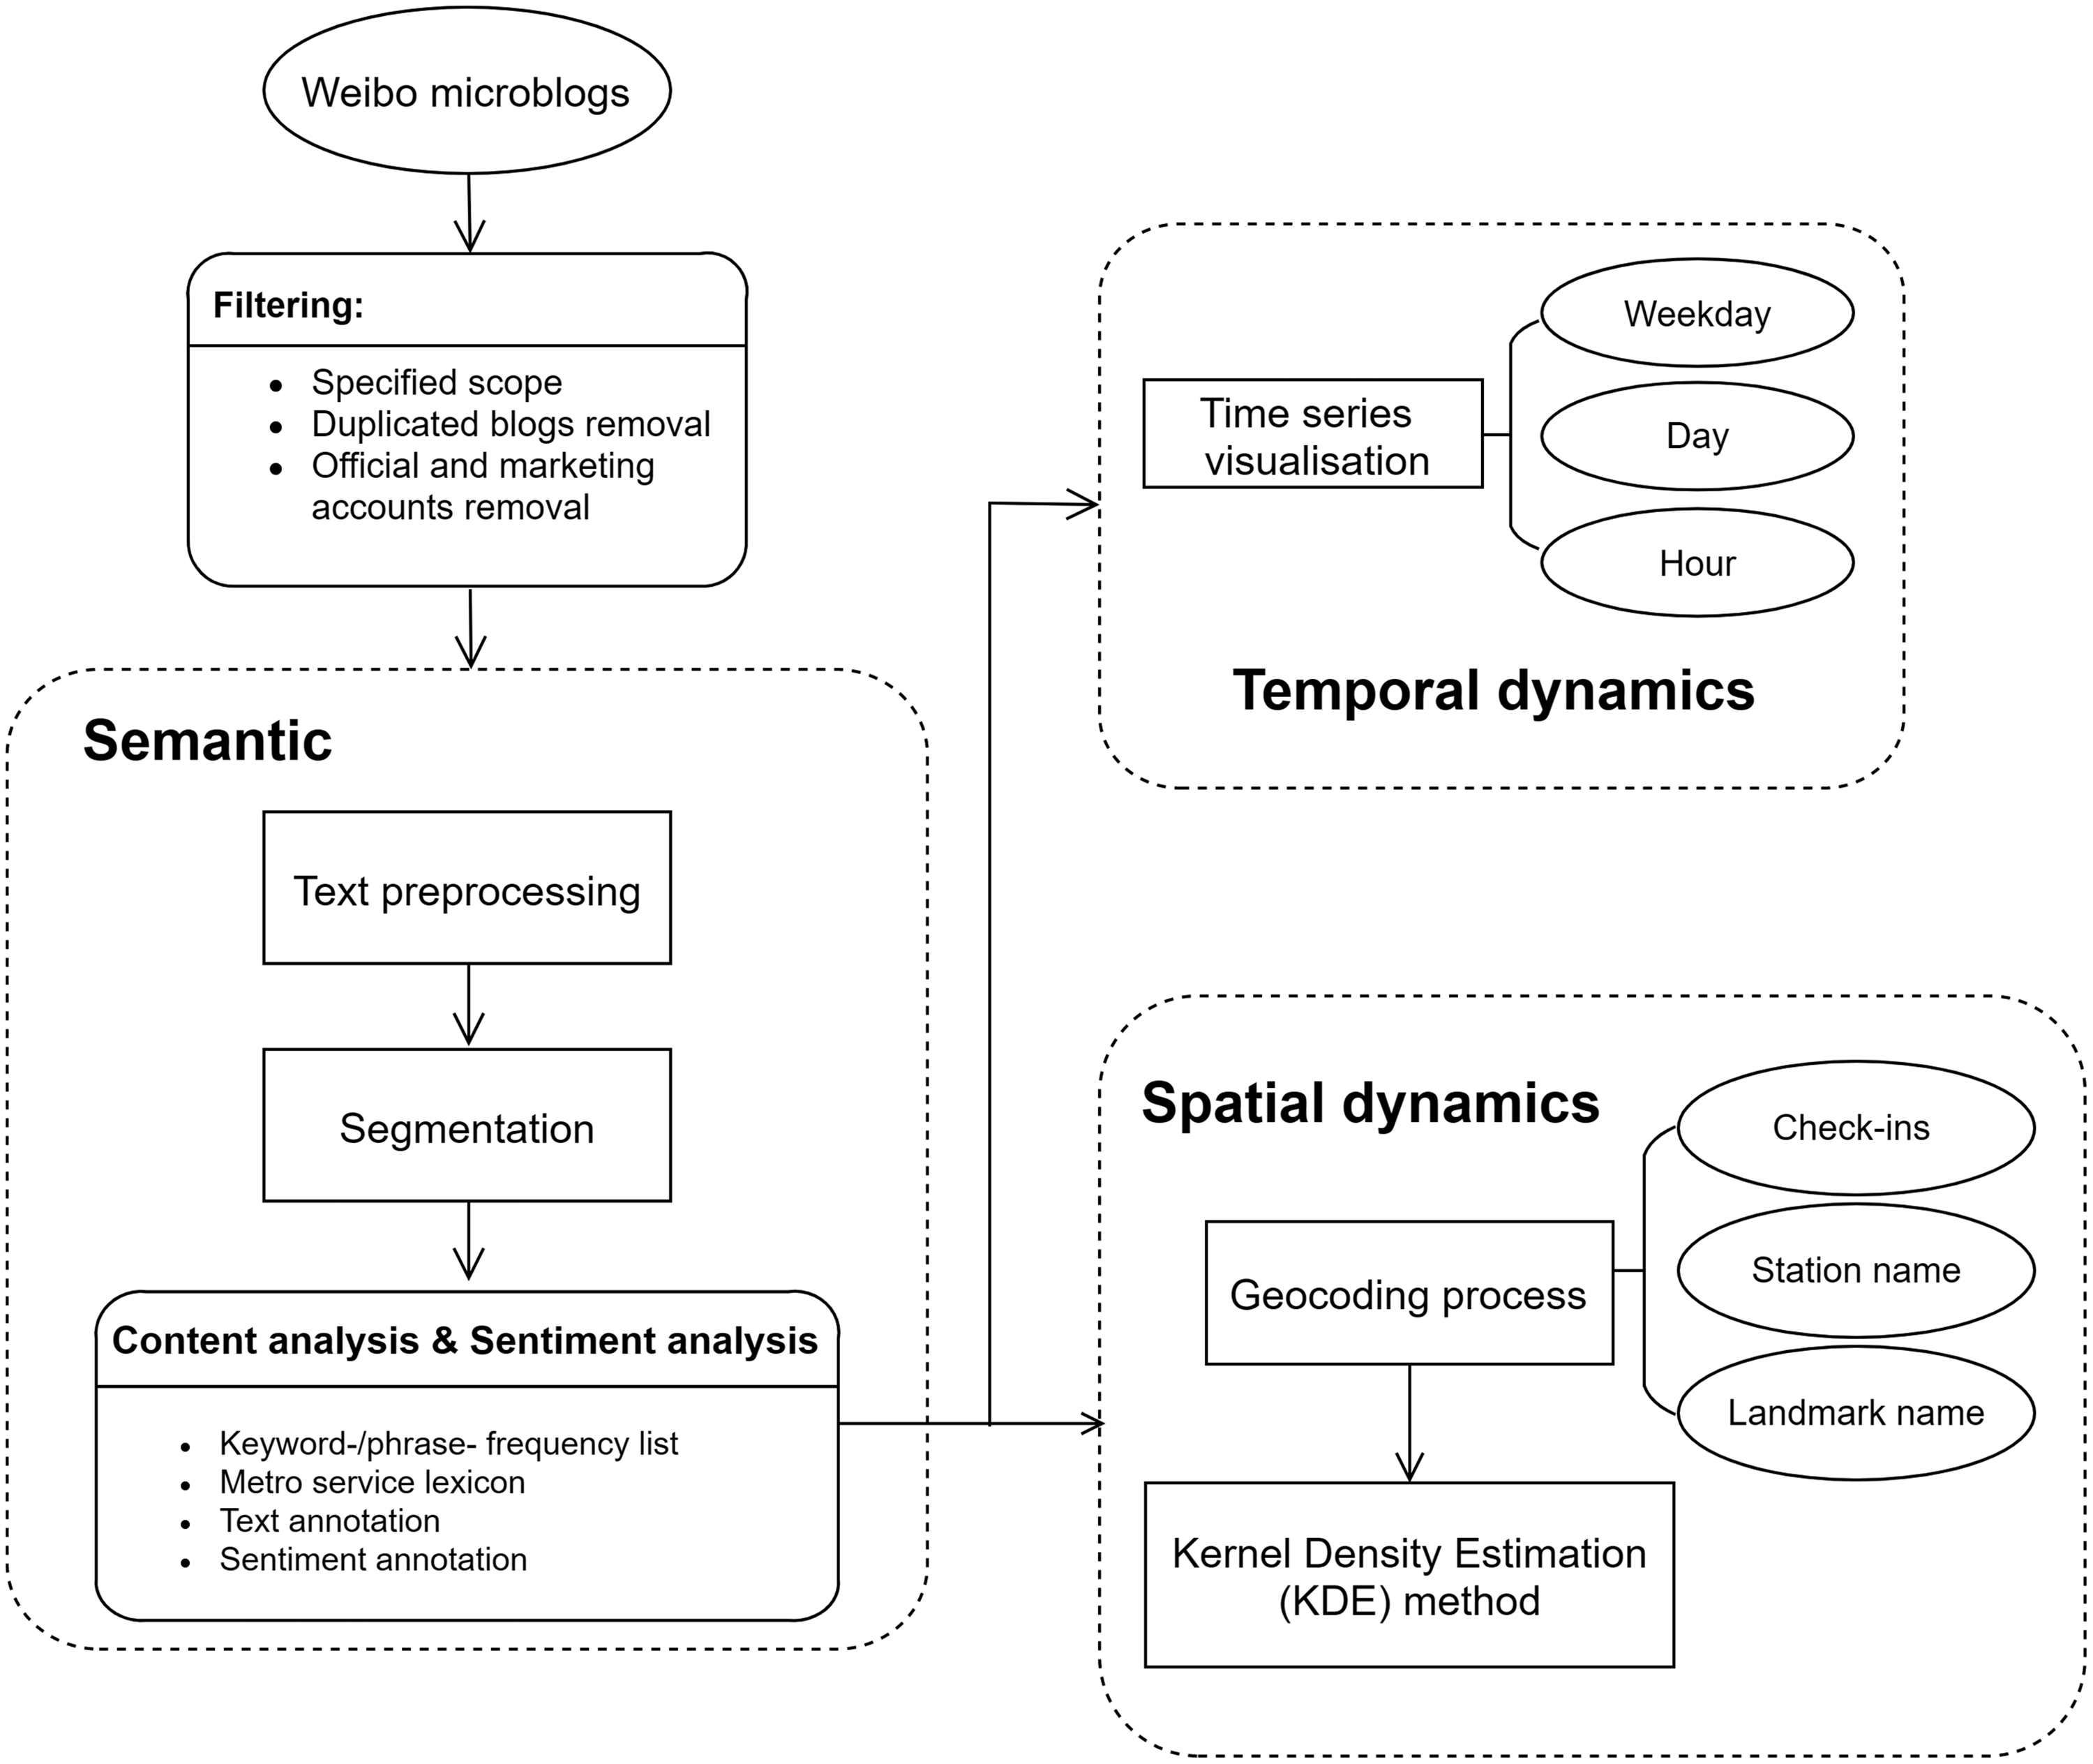
Methodological framework.
Data collection and pre-processing
Weibo microblogs were retrieved using Python scripts for Web crawling with the assistance of the ‘advanced search’ function embedded in Weibo. This function allows users to filter the microblogs through keyword searching (i.e. ‘metro’ 地铁) and limit the search area where the users posted (i.e. Shenzhen) during a specific time slot. The function allows us to choose ‘original’ microblogs so that we can exclude reposted microblogs and posts from authority and media accounts. Each microblog provides information such as the blogger’s nickname, text information, time, the client device (e.g. iPhone), comments, likes and shares.
Several text mining techniques were used on the microblog data to structure and categorise the information. Microblogs contain noise: numerous words and symbols such as slang, pictures, weblinks, hashtags and various marketing and sales advertisements unrelated to the metro. These redundant elements raise difficulties when conducting text segmentation and extracting useful information. Thus, the text pre-processing followed four steps: (1) data cleaning (e.g. deleting identical messages); (2) filtering out web links, animation, hashtags, symbols and pictures; (3) converting traditional Chinese to simplified Chinese and (4) removing official or marketing microblogs. Cleaning the dataset from unrelated microblogs involved three steps: (1) filtering the most active accounts (those who post metro-related blogs daily); (2) filtering out irrelevant microblogs with keywords such as ‘rent’ and ‘sublease’ and (3) manually coding marketing accounts by randomly selecting a 2,000-microblog sample and then filtering all datasets based on the coded marketing account dataset.
Text segmentation was conducted using a common Chinese segmentation module Jieba (https://github.com/fxsjy/jieba) in R to transform the text information into text features (‘bag-of-words’). The Jieba segmentation algorithm is probability language modelling, and uses a prefix dictionary to achieve efficient word graph scanning, and build a directed acyclic graph (DAG) to record every possible word combination. Jieba calculates the probability of every word combination in DAG based on the dictionary and finds the path with the largest probability. Additionally, users can add a customised dictionary (e.g. specific transit-related words, such as the alternative name of Line 1 ‘Luobao line’) to improve the performance of segmentation. This also implies the main limitation of Jieba: words that were not included in the dictionary may not be identified effectively.
Content and sentiment analyses
This study measures travellers’ perceptions of service quality as a combination of the importance of certain SQAs and the sentiments attached to them. The importance of SQAs is approximated by the frequency with which a service quality is mentioned in the microblogs – an SQA is important to a passenger when it is mentioned often in the microblog. Content analysis facilitates the systematic coding and analysis of unstructured spoken, written and audio-visual content (Berelson, 1952). It is used to identify and classify words, phrases, or other meaningful matter such as images, sounds, or even numerical records in terms of their structure and semantics. This qualitative approach has been adopted in previous works (e.g. Casas and Delmelle (2017) for Twitter; Shin (2019) for Yelp) to extract key service attributes from social media. However, they mainly hand-coded text into certain categories, which is impossible with large datasets and inapplicable for research using a big data analytical approach. Following the framework proposed by Einspänner et al. (2014), this study conducted a two-step semi-automatic content analysis based on the text features segmented in the previous stage.
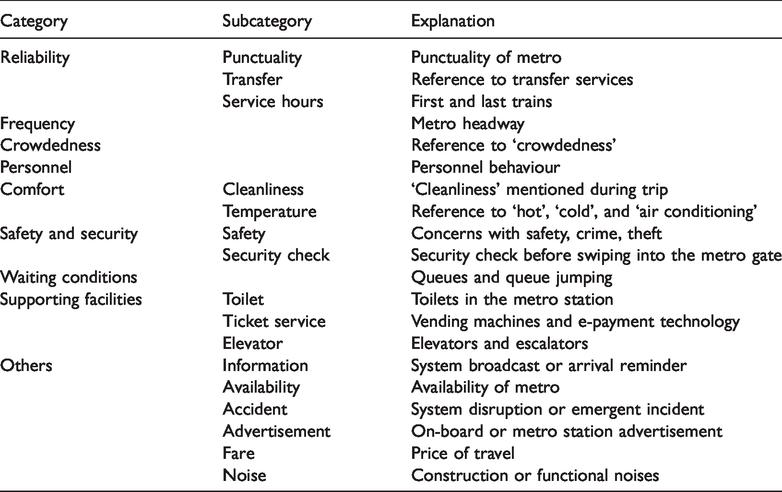
The first stage comprised basic analytic functions such as word-/phrase-frequency analyses and keyword-in-context lists. Figure A1 in the Supplemental Material illustrates an example of how we extract microblogs related to metro services, where we identified four keywords: crowdedness, frequency, information and waiting condition. The (word-) frequency list illustrates the most common words and their corresponding counts, helping coders grasp the overall characteristics of service factors. After frequency counts and basic descriptive visualisation, the second stage involved an in-depth analysis, labelling each item from word-frequency lists into predefined service categories. A task-specific transport lexicon was necessary to identify messages containing transport terminology (Gal-Tzur et al., 2014; Grant-Muller et al., 2014). We created a lexicon based on our practical understanding of our datasets and on three recent studies: a review (Van Lierop et al., 2018) that summarised public transport service factors, mainly in developed countries; a review (Das and Pandit, 2013) that summarised factors in developing countries; and an empirical study (Casas and Delmelle, 2017) that extracted SQAs from tweets. Before annotating the text, the datasets were read repeatedly by two domain experts before they went through the entire keyword-frequency corpus and labelled each identified keyword/phrase with the appropriate service category. The two coders worked independently and reviewed original blogs when they encountered an uncertain keyword/phrase until they reached an intercoder agreement. Table 1 illustrates the service terms in our lexicon with corresponding explanations. The lexicon was developed in an iterative and cyclic process, and the labelling process allowed a microblog to belong to more than one category.
Service quality attributes extracted from Weibo data.
Sentiment analysis is an opinion mining tool used to systematically extract and analyse user’s opinions, sentiments, evaluations and emotions from the texts they posted towards products, services, events and topics (Liu, 2012). We applied the classic linguistic-based sentiment analysis, which numerous studies have used to investigate public responses to transit services (e.g. Collins et al., 2013; Mogaji and Erkan, 2019; Schweitzer, 2014), to analyse the polarity of travellers’ evaluations of metro services based on two Chinese open source sentiment dictionaries – HowNet (Dong and Dong, 2003) and NTUSD (National Taiwan University Semantic Dictionary) (Lun-Wei et al., 2006). These dictionaries include comprehensive coverage of Chinese positive- and negative-opinionated words (see Liu and Li, 2002; Tan et al., 2008). We calculated the emotional orientation of each microblog by counting the positive/negative words. A positive/negative sign was assigned to a microblog with a polarity larger/smaller than 0, and neutral was assigned when the polarity equalled 0.

Temporal and spatial analyses
Although lacking prior knowledge of the temporal dynamics of SQAs in social media data, we believed that microblog time series would contain rich information about metro users’ opinions: periodicity reveals the regularity of public interest focused on a certain service attribute, while peaks often represented unforeseen disruptions that briefly boosted public interest. To discover the temporal dynamics of travellers’ perceptions of SQAs, we aggregated our microblog time series into different windows (scales): hours, days and weekdays. In addition, travellers’ satisfaction with each SQA are also visualised under each time scale.
To explore the spatial dynamics of perceived SQAs, we geocoded the microblogs retrieved from Weibo labelled with spatial footprints. First, we filtered the geo-tagged microblogs by a keyword list comprising three types of spatial footprints: (1) detailed check-in information, (2) metro station names and (3) mentions of Shenzhen landmarks. After filtering, the Baidu map API was used to geocode those blogs. Finally, after projection transformation, these microblogs were imported to ArcGIS for a spatial analysis.
A spatial analysis of point events, known as point pattern analysis, has been widely examined by spatial scientists. A variety of methods have been developed for detecting ‘hot spots’ or representing the ‘heat map’ of point events. KDE is one of the most popular methods for analysing properties of a point event distribution (Silverman, 1986), which involves placing a symmetrical surface over each point, evaluating the distance from the point to a reference location based on a mathematical function, and summing the value for all the surfaces for that reference location. The function is given as follows
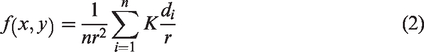
In our study, high-density service report points were areas that are more sensitive to certain metro services, and thus, must be prioritised to improve service performance. The spatial pattern of perceived SQAs were visualised on a 100 m2 resolution grid using the KDE tool in ArcGIS.
Study context and data
We studied Shenzhen in the Guangdong Province of China (Figure A2 in the Supplemental Material), which has a total population of 12,528,300 (2017 census). It has 10 districts, including eight administrative districts (Luohu, Futian, Nanshan, Yantian, Bao’an, Longgang, Longhua and Pingshan), and two new districts (Guangming and Dapeng). Luohu and Futian are urban and accessible to Hong Kong, Luohu is the old financial and business centre, and Futian is the new urban centre. Nanshan, located northwest of Deep Bay, serves as a technology and education hub comprising various high-tech industries.
At the end of 2017, Shenzhen Metro comprised eight lines and 168 stations (Statistics Bureau of Shenzhen Municipality, 2017). Line 4 is operated by MTR Corporation (Shenzhen), a subsidiary of MTR Corporation (Hong Kong), and the other seven lines by Shenzhen Metro Group (a state-owned enterprise).
We collected six months of data from 1 July to 31 Dec 2018, including a total of 74,973 microblogs with the keyword ‘metro’ (in Chinese ‘地铁’). After text pre-processing, 41,760 microblogs remained for further analysis.
A significant positive relationship (r = 0.73, p < 0.05) was found between the frequency of microblogs and metro ridership (in millions) of seven Shenzhen metro lines (Shenzhen Metro Group, 2018) in July 2018 (Figure A3 in the Supplemental Material), which (to a certain extent) validates the data quality.
Results
Content and sentiment analyses
It took two weeks for two coders to complete the content analysis. Table 2 illustrates the descriptive service statistics, including the count of microblogs in each subcategory, their ratio to the whole dataset and sentiment detail (neutral terms are not displayed in Table 2) for each service attribute. In total, 30.39% out of 41,760 microblogs contain public opinions regarding Shenzhen metro SQAs. Common service attributes, which have also been found to be important in prior studies, and context-specific attributes were identified in this study.
Descriptive statistics of categorised service quality attributes.
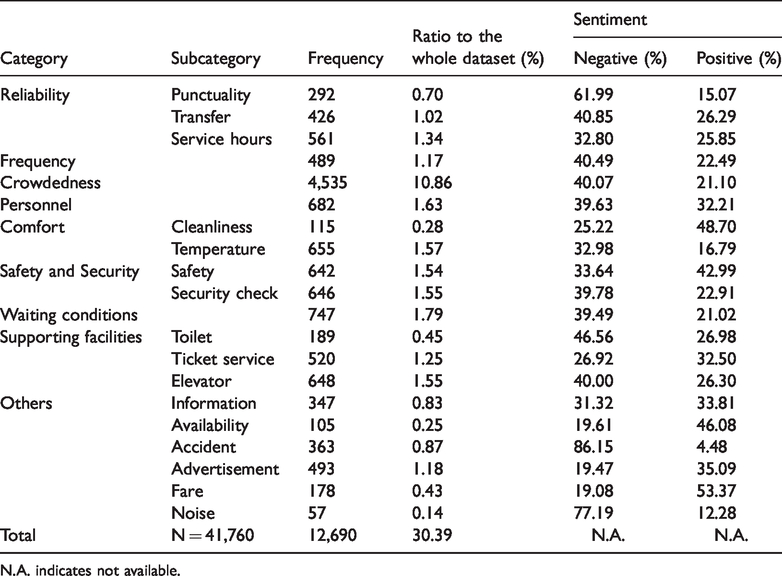
N.A. indicates not available.
Crowdedness (10.86%) predominated the dataset and was nearly one-third of the SQAs, and most complaints referred to the emotional experience of on-board crowdedness. As Supp Examples 1 and 2 in the Supplemental Material illustrate, travellers come into close physical proximity with each other. Interpersonal distance collapses into intimate distance, usually reserved for lovers, parents, children and close friends. This intrusion elevates physiological stress and generates discomfort, anger or anxiety. Reliability (3.06%), waiting conditions (1.79%) and personnel behaviour (1.63%) were the next three most commonly recorded SQAs. Additionally, comfort (1.85%) appears important for metro users. Most of the microblogs in this category discuss on-board temperature (1.57%), while a small proportion address in-vehicle cleanliness (0.28%).
Our study revealed some China-specific issues. In prior studies, safety and security were primarily related to the traveller’s sense of safety when taking public transport. In our case study, safety is divided into a general concern about on-board and off-board safety and concerns about security checks. Several security checkpoints equipped with x-ray machines are located inside each station. These machines screen travellers’ bags before they enter the metro, and those without a bag are exempt. Supp Example 3 in the Supplemental Material presents a representative suspicious view regarding the necessity of this policy. Further, security checks often cause long waiting times. In our study, the words ‘security check’ and ‘queue’ coincided 80 times, representing 12.4% of microblogs in this category. To make matters worse, the crowd stuck in front of the checkpoint aggravates congestion inside the station, further affecting traveller satisfaction. Therefore, most of the microblogs labelled in the security check category present a negative sentiment.
Another context-specific service rarely discussed in the literature is ticket service (1.25%). Nearly 76% of the discussions in this category involved emerging payment technologies, including the metro app and QR code embedded in WeChat (China’s most popular instant messenger). This e-payment service was introduced to the Shenzhen metro system in May 2018. Supp Example 4 in the Supplemental Material provides an example of how the new payment service facilitates users’ travelling experiences. This new service helps validate upward and downward comparison theories (Wills, 1981). That is, customers compare their travel experience with other cities, and a downward comparison (in this case, users compared Shenzhen to other cities with worse ticket services) feeds into ‘comparison happiness’ (Abou-Zeid and Ben-Akiva, 2011) and, consequently, overall satisfaction. Subsequently, improved technology may attract individuals who rarely use the metro.
The sentiment analysis also revealed customer satisfaction levels with certain SQAs. Most SQAs are mainly associated with negative feelings, which echoes prior studies which suggested that users tend to express more negative sentiment on social networking sites (El-Diraby et al., 2019; Schweizer, 2014). As revealed in our study, Shenzhen metro users are particularly dissatisfied with accidents (86.15% negative), noise (77.19% negative) and punctuality (61.99% negative). These findings are consistent with the fact that people usually express complaints when accident, noise and delay occur. Our results also show that people do not express negative sentiment only; our sentiment analysis revealed positive sentiment as well along certain SQAs. Three service attributes that received the most positive comments were fare (53.37% positive vs. 19.08% negative), cleanliness (48.70% positive vs. 25.22% negative) and availability (46.08% positive vs. 19.61% negative).
Temporal dynamics
The first stage of temporal analysis explores microblogs’ temporal distribution, examining the overall distribution of metro-related microblogs per day (Figure 2). As widely addressed in the literature, social media data has the potential to assist with event identification and transit disruption management. Three specific 2018 events were identified in this study:
Peak 1: Tuesday, 24 July, Line 5 disruption occurs during morning rush hour. Peak 2: Tuesday, 9 October, Line 3 disruption occurs during morning rush hour. Valley 1: Sunday, 16 September, no metro service all day due to Typhoon Mangkhut.
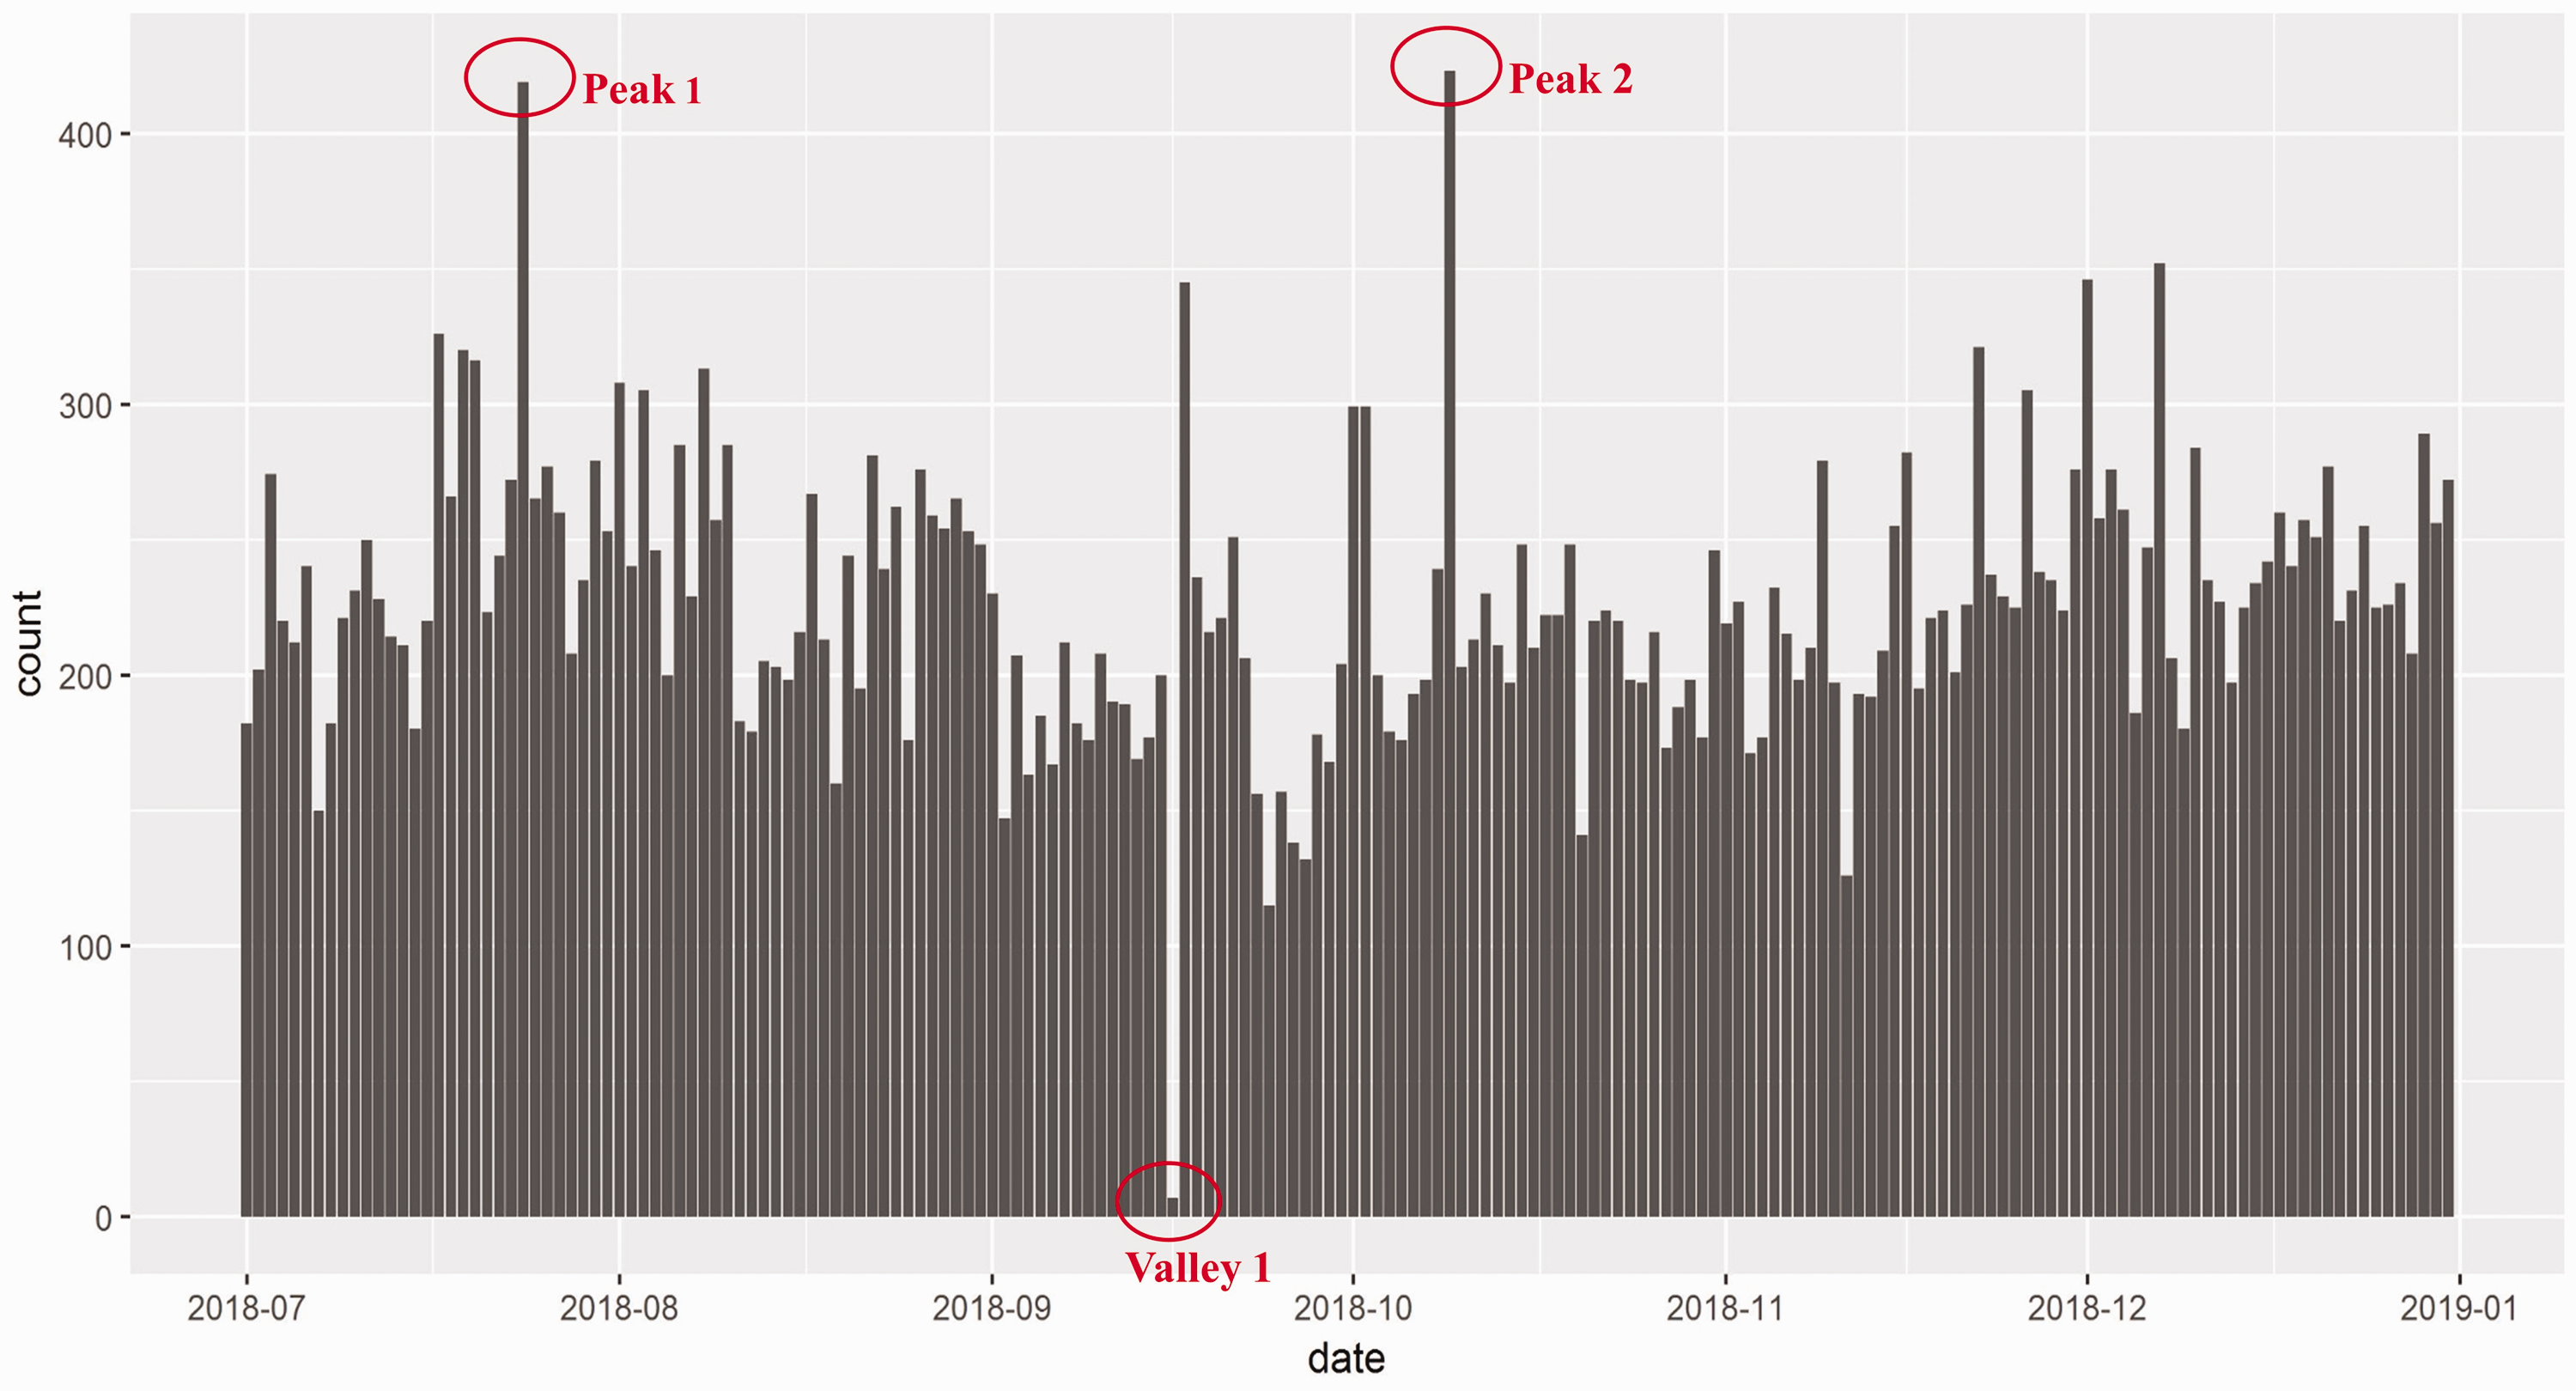
Daily posts of microblogs from Weibo.
Figure 3, a more detailed time window, illustrates the temporal distribution of microblog mentions of SQAs along with their sentiment polarity (separated by weekday and hour). To capture the temporal trend or regularity of people’s perceptions of SQAs during the day and the week, peaks were regarded as outliers in our study. Therefore, we illustrated the temporal trend of different service categories, excluding microblogs belonging to the three abovementioned peak days.
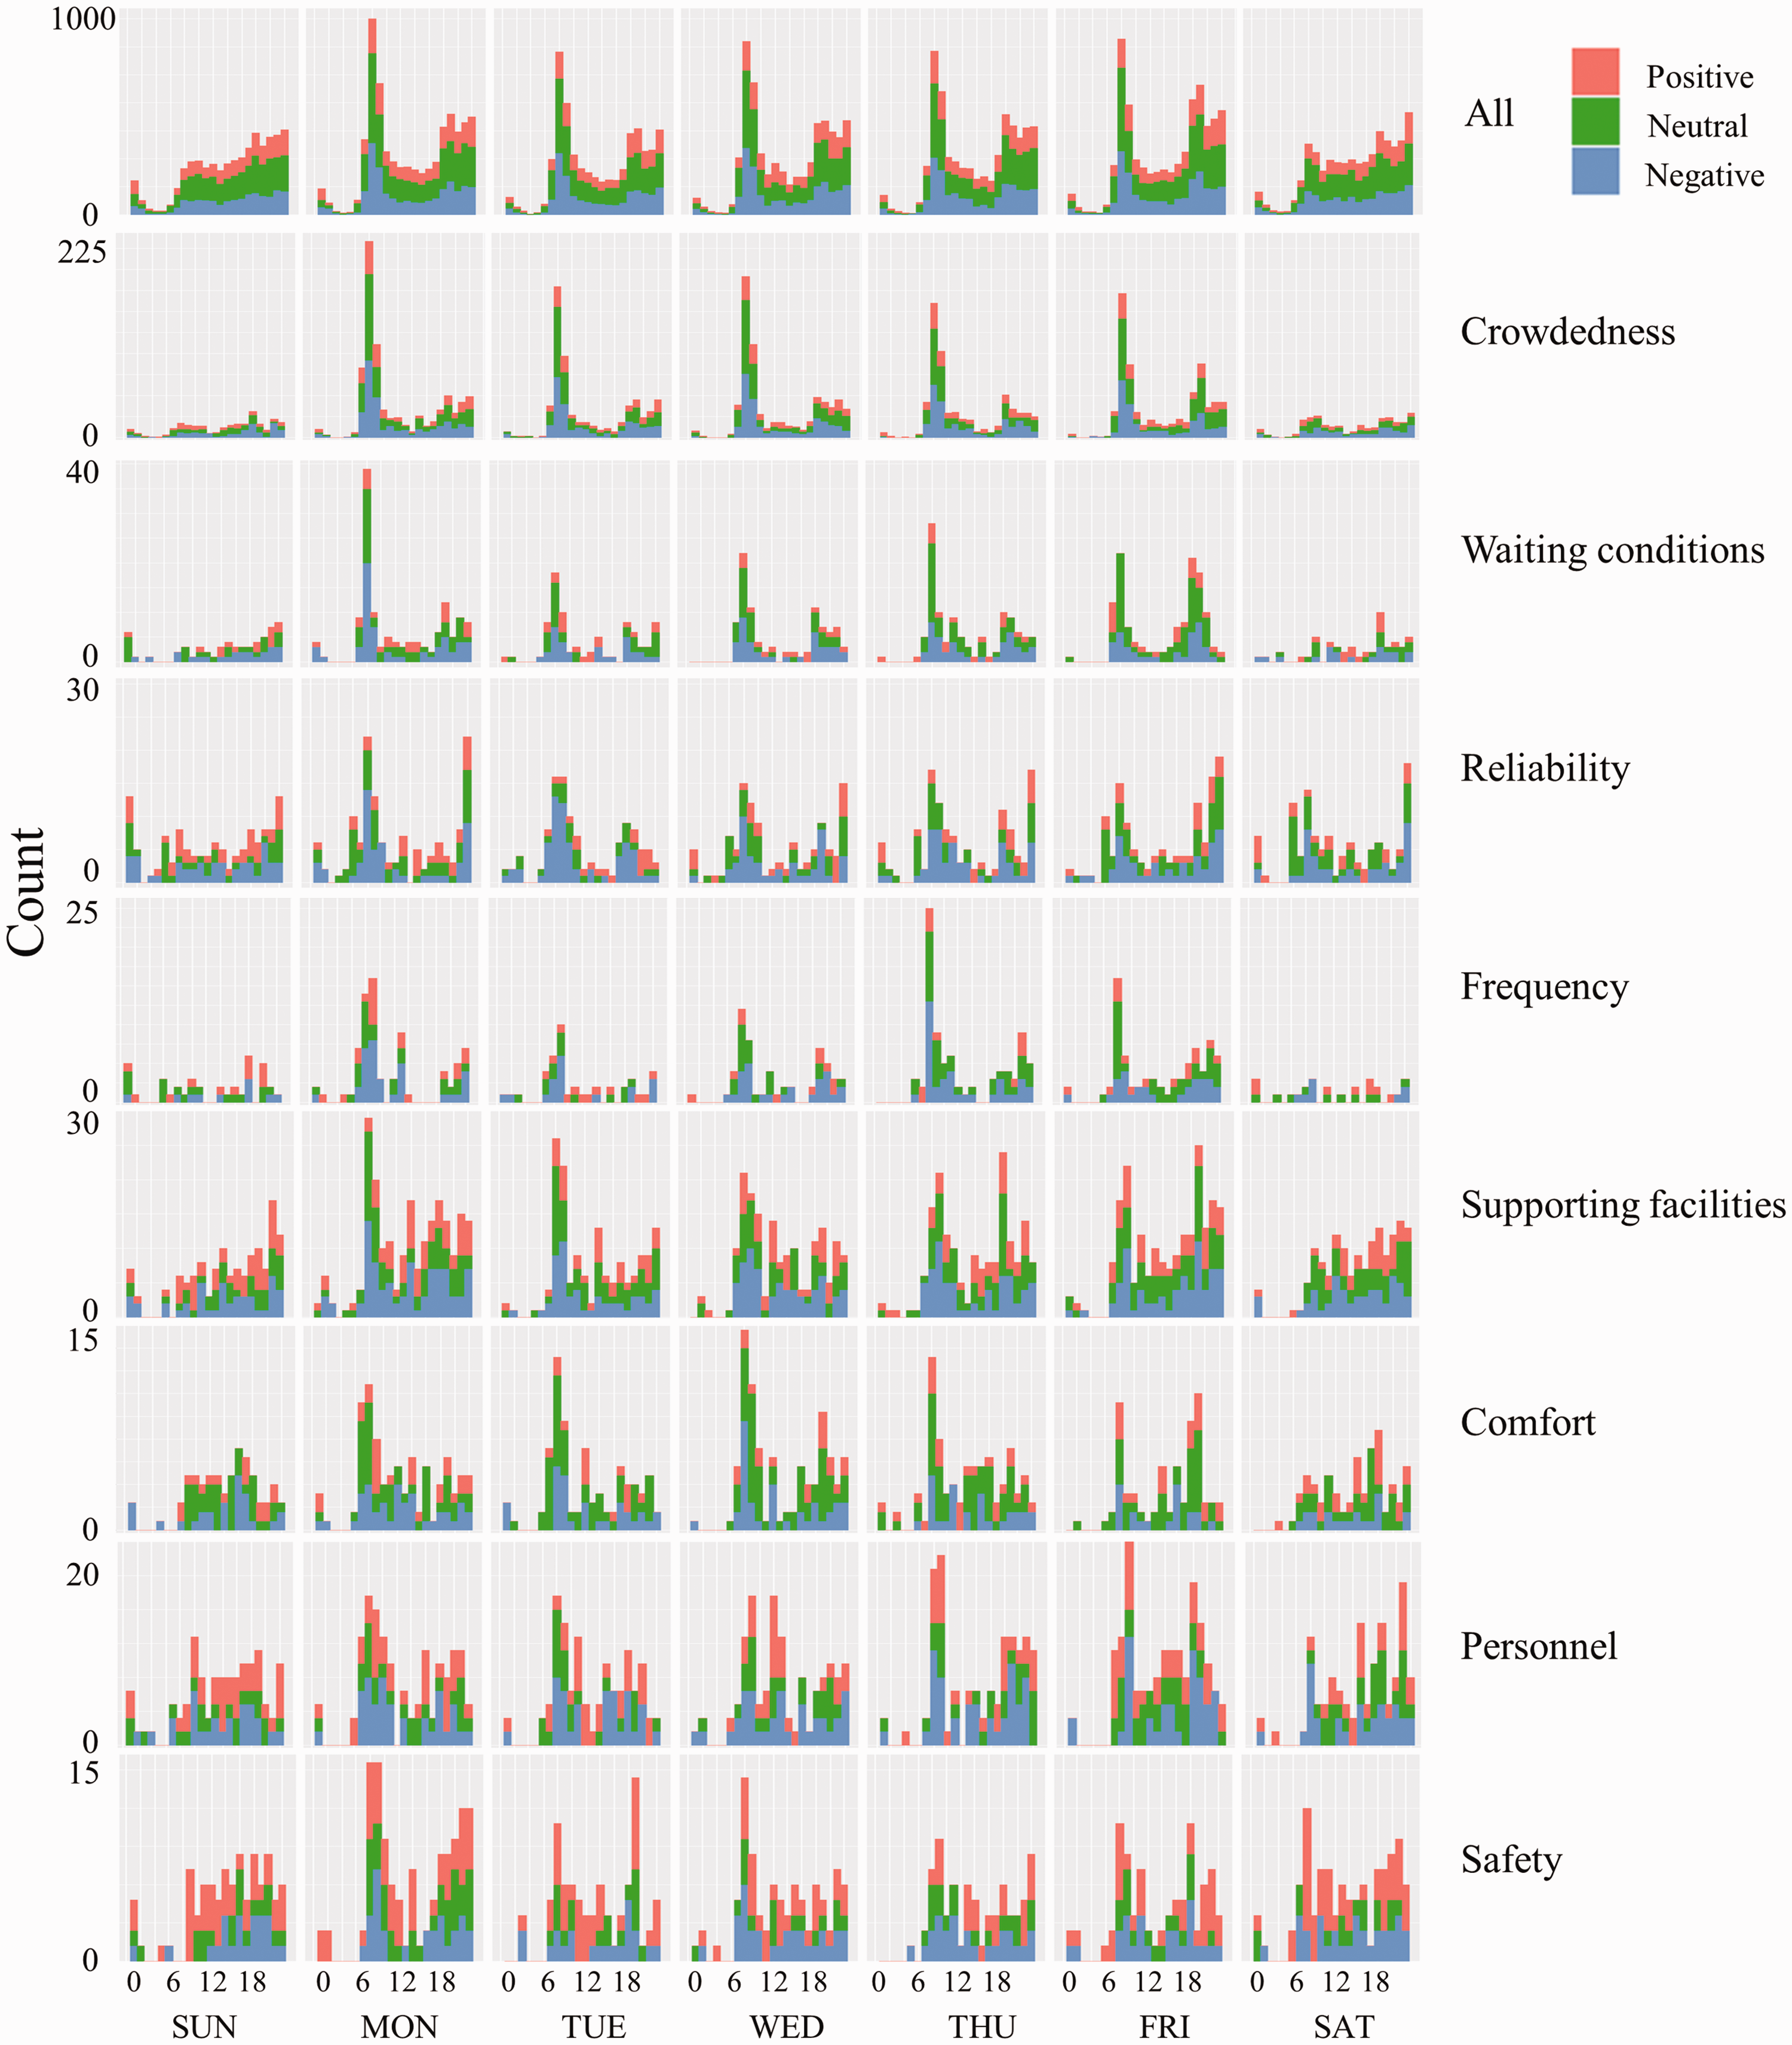
Temporal variations of service quality attributes of a metro system.
First, regarding the overall distribution of the dataset, there is significant variation between weekdays and weekends as a result of work commuters. The negative, neutral and positive sentiments follow similar temporal patterns. Two peaks were identified during morning and evening peak hours on weekdays, as opposed to weekends. Unlike common two-peak travel patterns, there is still a considerable number of microblogs at night (20:00–00:00), which may be due to working overtime. Overtime is common, as Shenzhen is experiencing strong economic development and widespread labour shortages (Li et al., 2012). People usually return home by metro at night, when they may have free time to blog.
A consistent temporal distribution of service events over weekdays and hours is observed for crowdedness, waiting conditions, reliability and frequency. Additionally, they largely determine perceptions of travel time and the environment. The intra-week variation is clear: weekends are very quiet. Concerning the variations at different times of day, despite the peak found at late night for reliability (which is due to concerns over the provision hours), the figures demonstrate a consistent trend of a large singular peak with chiefly negative sentiments during morning rush hour on weekdays, especially on Mondays. This could be explained by the fact that people tend to place more importance on travel time and travel environment during their commute to avoid being late for work. Time pressure makes them more sensitive to the regularity of the metro, measured by frequency, punctuality and waiting time.
While the morning peak time is expected during weekdays, little variation or trend is found across hours or weekdays regarding the frequency and sentiment expression for supporting facilities, sense of comfort and personnel behaviour. For example, besides the morning peak, other peaks regarding personnel behaviour occurred during evening peak hours on Friday, noon on Wednesday and throughout Monday afternoon. This may be due to the complexity of people’s travel habits. That is, people may talk about those services when they use them (e.g. elevators), feel uncomfortable or ask personnel for help. Their satisfaction levels towards these services are also volatile. Thus, the temporal distribution of this group of perceived SQAs is more random.
Finally, people’s perceived safety was distinct from other service attributes in the daily time series. Here, we only focused on the subcategory of ‘safety’, and excluded security check (in Chinese ‘安检’) as they are not related to perceived safety, as discussed above. It is notable that people are highly concerned about safety at night despite the highest peak being over morning peak hours. However, travellers’ main safety concerns are different at the two peaks. People tend to report on-vehicle problems (infrastructure or others’ behaviour) that may harm them during the daytime (Supp Examples 5a and 5b in the Supplemental Material), while they pay more attention to the environment surrounding the metro station when entering/leaving at night (Supp Example 6 in the Supplemental Material). In addition, the temporal rhythm of negative sentiments related to safety is rather evenly distributed across the day, which indicates that the metro is perceived as a relatively safe transportation mode even during nighttime in Shenzhen.
Spatial dynamics
A total of 8769 microblogs with spatial footprints were identified. Table A2 in the Supplemental Material illustrates the frequency of geocoded service categories and their ratio relative to the corresponding service categories of the whole dataset.
There are clear spatial variations regarding perceived SQAs. As Figure 4 illustrates, the five main spatial clusters (annotated on the crowdedness map) are as follows: (1) Futian Central Business District (CBD), (2) Luohu old CBD, (3) Qianhai-Houhai CBD in Nanshan district, (4) Shenzhen North Railway Station and (5) Shenzhen East Railway Station.
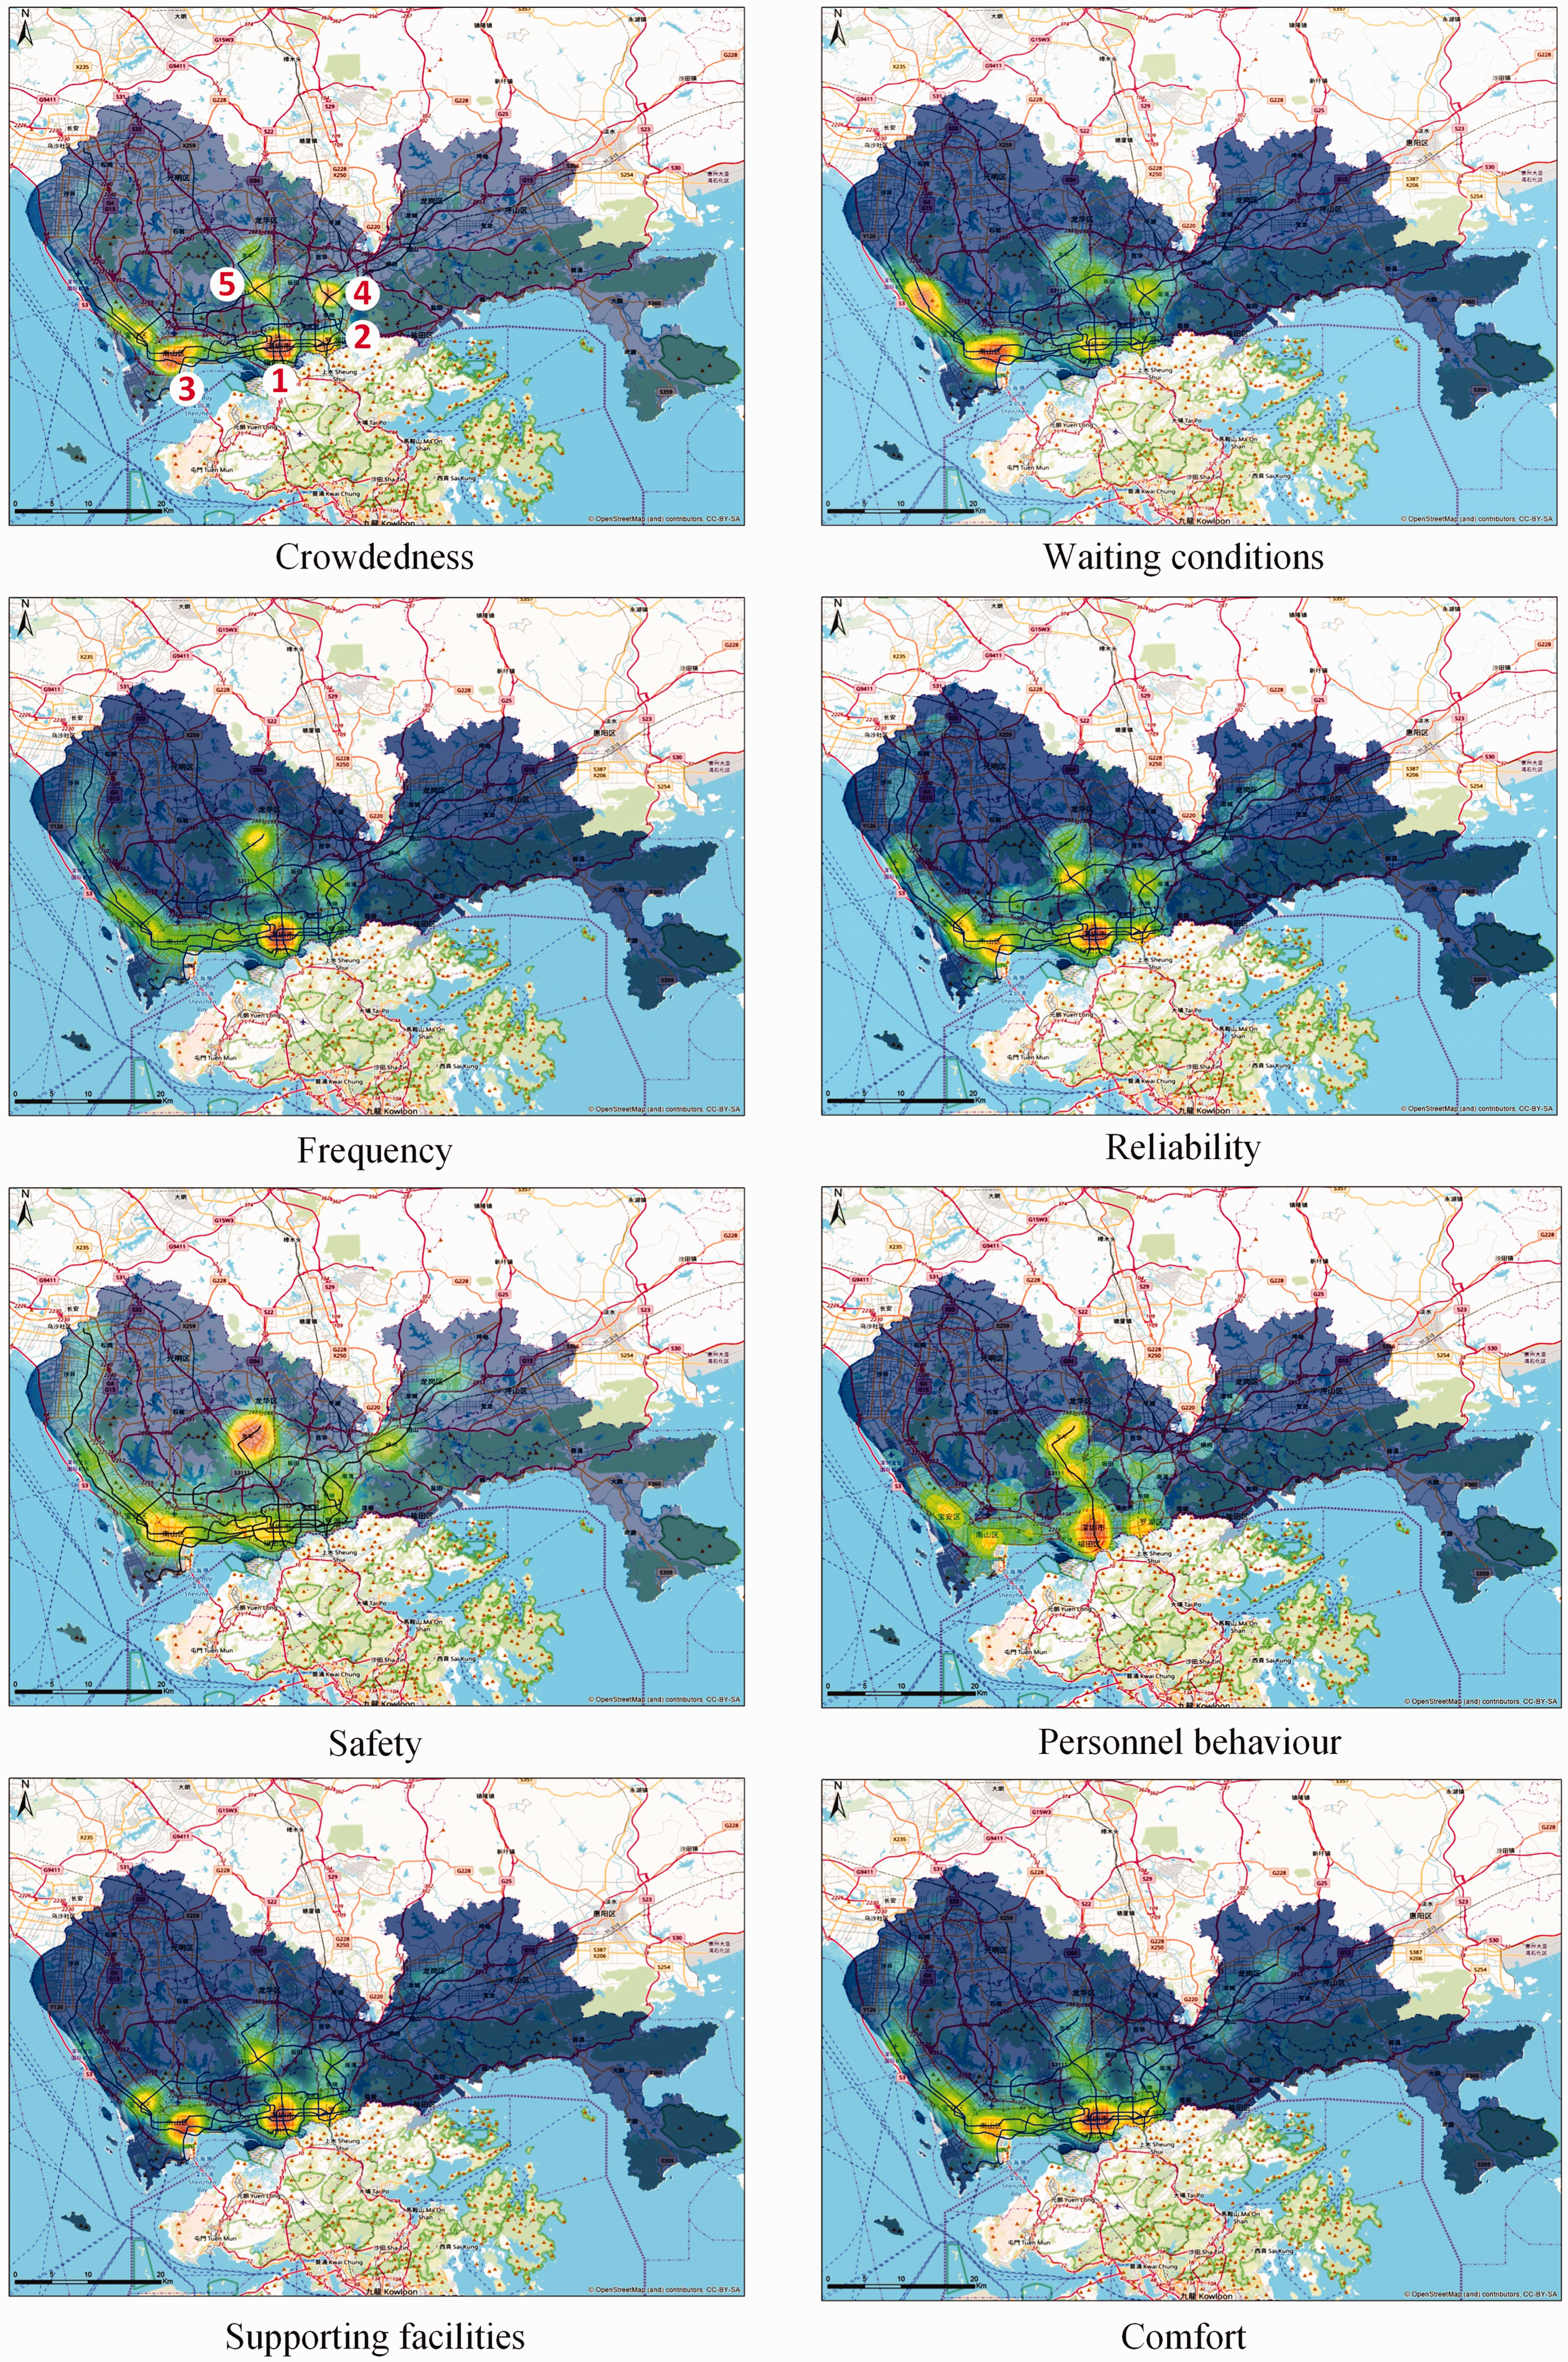
Spatial distribution of perceived service quality attributes of a metro system.
These five areas are identified as microblog post clusters because they are all located in areas where there is heavy traffic. The land use functions around the stations (Futian and Luohu CBD areas) or the main function of the station itself (railway station or commuter hub) contribute to this process. Perceptions of crowdedness, waiting conditions, frequency and reliability are mainly distributed around these five clusters. Travellers’ perceptions of supporting facilities and comfort are concentrated in the three CBD clusters. This may be due to a large group of commuters who transfer around these three CBDs on workdays.
Our study identified interesting findings for the spatial dynamics of perceived service events. First, the spatial dynamics of personnel behaviour (Figure 3): although the temporal distribution of personnel behaviour illustrates low periodical trend or regularity, some patterns were found in the spatial map. There is a cluster along Line 4, which is operated by MTR Corporation Hong Kong, whereas other lines are operated by Shenzhen Metro Group. In total, 44% (109) of personnel behaviour reporting points were located along Line 4, within which 48.6% microblogs express positive opinions (e.g. appreciating personnel assistance). However, for the remaining lines, there are 56% (137) of microblogs related to personnel behaviour but only 22.6% of them are associated with positive sentiments. This finding may support Mogaji and Erkan (2019), whose results suggest clear variations in SQAs across different train groups playing a critical role in customers’ experiences. Personnel behaviour significantly contributes to the public image of metro groups. A representative example (Supp Example 7 in the Supplemental Material) is the complementary word of mouth regarding personnel from line 4, which may indicate that the Shenzhen Metro Group should learn from the practices of Line 4 personnel.
Perceptions of safety also have a distinct spatial pattern. Aside from two CBD clusters (Qianhai-Houhai and Futian), a distinct cluster is located around Qinghu station at the end of Line 4. This may be due to people transferring to other transport there or walking to/from home. They may emphasise safety issues when transferring. Subway stations, as one kind of transport node, are often called ‘crime generators’ and ‘crime attractors,’ as they are places of social convergence and more prone to crime (Ceccato, 2014; Smith and Cornish, 2006). This also explains fears about unsafe environments around stations at night found in the temporal distribution. Urban patterns also affect people’s perceptions of safety: in CBD areas, people may feel safer at stations compared with remote areas. Some remote areas along the metro lines have higher safety concerns compared to the spatial distribution of other services.
Sample representativeness and interpretation of results
Although social media data have attracted increasing attention, one major criticism is sampling bias. Disadvantaged groups, such as older people and teenagers, may be neglected. To address this issue, we examined whether there is a significant difference in the perception of metro services between younger and older users from 1000 random users’ age information in our Weibo dataset. In total, 484 had valid age information, and we then applied the content analysis again to analyse the difference between the age groups. The summary statistics (see Table A3 in the Supplemental Materials) demonstrate that social media data are biased towards younger users. Only 2.9% (N = 14) of sampled users were aged above 40, even slightly lower than 5% released by Weibo in 2018. Besides the similar focus of crowdedness, reliability, waiting conditions and personnel behaviour, people over 40 tend to report on safety and supporting facilities, while none mentioned frequency and comfort. These results suggest that the collected social media data may underestimate/overestimate the importance of certain service attributes. Further studies with larger data samples along with more diverse demographic profiles are necessary to examine this issue of representativeness in-depth.
Conclusion
Social media data have gained increasing attention in transport studies, recognising the strategic importance of information flow in long-term transport planning and short-term tactical system management (Grant-Muller et al., 2014). Despite their potential, social media data have not yet been fully explored when investigating the spatial-temporal dynamics of SQA perceptions. Although our study is largely exploratory, we believe that detailed scrutiny of UGC is an essential prerequisite to a more relevant and deeper understanding of public perceptions of metro services.
This study’s main objective is to develop a methodological framework for structuring SQAs and analysing their spatial and temporal dynamics. The framework comprises three major components: (1) semi-automated content and sentiment analyses; (2) temporal visualisation of different SQAs and (3) a spatial estimation heat map visualising clusters of SQAs. This framework is especially helpful for cities without prior knowledge of context-specific SQAs. The findings in this study could be used as a reference for understanding SQAs from the customer’s perspective in other Chinese cities. Future comparative studies could develop a more comprehensive analysis of Chinese metro services.
Our research questions yielded two key findings. First, the content and sentiment analysis results for metro service categorisation in Shenzhen revealed supporting evidence and unique attributes compared to previous studies. Consistent with previous research, SQAs such as waiting conditions, comfort, reliability and metro frequency were found to be important (Das and Pandit, 2013; Dell’Olio et al., 2010). In contrast, some context-specific attributes were found: (1) most prior studies in developed countries have found that most critical SQAs are related to personnel behaviour, safety, reliability and comfort (Mouwen, 2015; Van Lierop et al., 2018), while this study found crowdedness to be the most critical issue; (2) some unique, China-specific attributes, such as security checks and emerging e-payment technologies were also identified in this study. These unique attributes may incentivise potential travellers by enhancing their comparative happiness. Our sentiment analysis results indicate that people do not always express negative sentiments on social media platforms. Although various negative sentiments were frequently expressed (e.g. reliability, crowdedness, frequency, waiting conditions and safety), certain SQAs received more favourable feedback (e.g. fare, cleanness and availability).
Second, substantial variations were found in the temporal and spatial dynamics of perceptions of SQAs: (1) Commuting to work has a huge effect on perceptions of metro services, which is reflected in spatial and temporal patterns. Morning and evening peaks were identified in the temporal distribution of microblog posts, and travellers are more sensitive to crowdedness (reflected by the dominant negative sentiments) during morning peak hours than during evening peak hours. (2) Urban settings affect perceptions of SQAs. At a macro-scale, the spatial clusters of identified service factors are mainly distributed around commercial activity areas (e.g. CBDs and transport hubs). At a micro-scale, station environments significantly affect perceptions of safety, especially on weekend nights. (3) Different operators can affect spatial perceptions of service quality, demonstrated by a line-shape cluster of more positive perceptions of personnel behaviour along Line 4 (operated by the MTR Hong Kong Corporation) compared to other lines.
Our study illustrates how transport stakeholders and policymakers can utilise social media to efficiently categorise SQAs, detecting incidents/disruptions and identifying SQAs that are particularly relevant/important during certain periods and/or in specific locations. This can prepare transport operators for spatial-temporal strategic interventions and encourage them to allocate resources more efficiently to improve the transport systems’ performance to better align with customer expectations.
Our study has a number of limitations, which can be potential avenues for future research. First, this study proves that social-media text mining is inherently imperfect because of its lack of representativeness. Research has revealed that after controlling for demographics, no statistical difference was found between social media users and non-users when predicting political attitudes (e.g. Mellon and Prosser, 2017). This may suggest that in future studies, social media could reflect public opinion more precisely if the demographic characteristics are controlled for. Second, using ‘metro’ as a keyword may not include all relevant metro-related trips if travellers did not mention it in their posts. Accordingly, we believe traditional surveys and social media can complement each other, as the former remains necessary to correct sample bias. Third, social media text is often ungrammatical, unstructured and mixed with much redundant and irrelevant information, which is why some SQAs could not be successfully identified. For example, we could not identify travel time because keywords such as ‘minutes’ or ‘hours’ could refer to other activities such as work, shopping, reading or socialising. In the future, more advanced techniques should be developed to improve the precision of service classification.
Supplemental Material
sj-pdf-1-epb-10.1177_2399808320974693 - Supplemental material for Using data mining to explore the spatial and temporal dynamics of perceptions of metro services in China: The case of Shenzhen
Supplemental material, sj-pdf-1-epb-10.1177_2399808320974693 for Using data mining to explore the spatial and temporal dynamics of perceptions of metro services in China: The case of Shenzhen by Shuli Luo and Sylvia Y He in EPB: Urban Analytics and City Science
Footnotes
Acknowledgements
We would like to thank the anonymous reviewers for their constructive comments and suggestions. We thank Yepeng Yao for his assistance in data processing.
Declaration of conflicting interests
The author(s) declared no potential conflicts of interest with respect to the research, authorship, and/or publication of this article.
Funding
The author(s) disclosed receipt of the following financial support for the research, authorship, and/or publication of this article: This research is supported by a Direct Grant (#SS18321) awarded by the Research Committee of the Chinese University of Hong Kong.
Supplemental material
Supplemental material for this article is available online.
References
Supplementary Material
Please find the following supplemental material available below.
For Open Access articles published under a Creative Commons License, all supplemental material carries the same license as the article it is associated with.
For non-Open Access articles published, all supplemental material carries a non-exclusive license, and permission requests for re-use of supplemental material or any part of supplemental material shall be sent directly to the copyright owner as specified in the copyright notice associated with the article.