



Abstract
Public space is characterised by visible spaces and featured by observable activities, forming the atmosphere that humans can perceive, interpret, and experience. This article conceptualises urban space as a set of viewsheds connecting functions visually which can be represented as functional visibility graphs – the graphs with mutual-visibility edges between space and function nodes. It begins with an introduction of three basic measures: visual function size, entropy, and mean angular depth step, then proposes advanced measures: namely visual function connectivity, function visibility, and visible function closeness, showing spatial narratives along paths, visual centrality in place, and functional regions for continuous areas, respectively. This framework is enabled by social media check-in data that records people’s engagements across function nodes tagged by them. An application in a real example in Tianjin City is shown. The novelty of using social media check-ins as a delegation of actual function usage is demonstrated for modelling urban movement with improved precision. By tracing the shifting performance of the functional visibility graphs for the same spatial layout, this study outlines how such analysis can be conducted for uncovering short-term transformation of the visual landscape, contributing to the fine-scale, high-resolution implementations of land use policies from a real human-focused perspective, with the socially sensed data.
Introduction
Modern urban design was criticised for its naive descriptions of cities with simple hierarchies, respective geometric forms, separation of parts, etc., which broke the complex links between urban spatial forms and socioeconomic performance (Alexander, 1965/1996). To fix this connection, one essential challenge of urban design research is to understand how people’s movement reacts to the change of the built environment, thereby reshaping urban vitality (Hillier, 2007). Studies of spatial configuration demonstrated that people’s flows follow the easiness of visual interactions through urban spaces revealing the contribution that urban forms make to agglomeration (Hillier and Iida, 2005). Configurational studies, however, simplified the distributional effect of attractors that gain viewers’ attention, failing to account for comprehensive movement patterns which link amenities at different sites to one another (Ratti, 2004). Urban function – the eyecatchers that are visually interconnected through the spatial grid are required to be quantified as an indispensable part of the spatial configuration which enables a more in-depth understanding of the interrelationship between urban design and social life.
Visibility is a crucial concept in assessing fine-scale architectural landscapes. As one type of visual accessibility, it exhibits the distributed potentials of face-to-face encounters, as well as links the built morphologies with the aggregate travel patterns and other socioeconomic distributions. The development of this idea can be traced back to the period when the concept of ‘isovist’ (Tandy, 1967) or ‘viewshed’ (Amidon and Elsner, 1968; Lynch, 1976) was introduced. Isovist/viewshed captures the ‘visible volume’ from places and by which it builds the linkage between a place and people’s behaviour in it, including how people potentially perceive and use it (Benedikt, 1979). These visible volumes across places provide a scope to unfold the relationship between architectural forms and aggregated behaviours, the visual structures of spatial narratives, retail development, the occurrence of burglaries, etc. This methodology was further developed as a standard routine operation on many GIS platforms, called viewshed analysis (Burrough, 1986) with digital elevation models, cell grids, or triangular irregular networks representing the geographical landscape, which has been widely used in location recommendation for facilities (e.g., Goodchild and Lee, 1989; Senaratne et al., 2013), path-selection (e.g., Stucky, 1998; Van Leusen, 1999), mapping the exposure to harmed activities (e.g., Falconer et al., 2013; Pearson et al., 2014), etc.
The analysis of urban visibility patterns relies on local morphological properties of the isovist for every location, including, size, perimeter, compactness, etc., or its network properties such as clustering coefficient or degree, to represent the visually-perceivable narratives from place to place (e.g., Batty, 2001; Benedikt and Burnham, 1985; Fisher, 1995; Lake et al., 1998). Isovist analysis was linked to the partition of continuous spaces and further associated with space syntax theory, in which topological and geometrical properties of the interrelated isovists are defined instead of their Euclidean topographies (Hillier, 1996; Hillier and Hanson, 1984; Peponis et al., 1997, 1998). Given this, isovist analysis was upgraded to a new form called visibility graph analysis (VGA) (De Floriani et al., 1994), where isovists and their interconnections are framed as nodes and edges in a first-order graph, respectively, and the connectivity attributes of such a graph turned to be the new focus (O’Sullivan and Turner, 2001; Turner, 2001a; Turner and Penn, 2002; Turner et al., 2001). Despite the novelty of existing visibility analyses, they are still limited to addressing the spatial parts of the spatial configuration by neglecting the essential roles of other urban attractors embedded in the same spatial fabric. Natapov et al. (2016) and Natapov and Fisher-Gewirtzman (2016) echoed the necessity of building a more integrated visibility graph (VG) with both street sections and their place functions and further highlighted that pedestrian navigation choices are destination-oriented and influenced by the visibility of urban activities.
Recently, the volunteered, geo-referenced datasets regarding how people perceive and use space and functions emerge continuously on finer space and time resolutions with a larger coverage, e.g., social media check-ins, cell phone data, smart card data, travelling trajectories, etc. (Batty, 2014; Kitchin, 2014). These datasets have been used to address various urban issues, e.g., the detection of urban regions (e.g., Yuan et al., 2012); activity recognition (e.g., Kwapisz et al., 2011); awareness of emergencies (e.g., Yin et al., 2015); identification of commuting patterns (e.g., Long et al., 2016), etc. Although it was argued that these big data might suffer some problems such as biased sampling, context-related uncertainty, absence of proper theoretical propositions, data scarcity, etc. (Boyd and Crawford, 2012), their capability of addressing socioeconomic issues, modelling geographical accessibility with cognitive factors was confirmed empirically (Shelton et al., 2015; Shen and Karimi, 2016). It is demonstrated that the emerging socially-sensed datasets, complementary to the conventional, are now providing a fine-scaled, effective scope of individual’s contemporary social activities from space to space enabling new analytical tools for various urban concerns.
The purpose of this article is to develop a framework of methods addressing the interrelated visual characteristics between one location and another that are delivered by the spatial fabric and function places, simultaneously. Based on the functional visibility graph (FVG), numerous measures of functional visibility across scales are proposed to capture people’s perceptions of the built environment. The remainder of this paper is structured as follows. The next section defines functional visibility. This is followed by a section that introduces the measures, study area and data for an empirical study of Tianjin. Then the results of calibration, validation, and potential applications and their interpretations are reported. Finally, conclusions and points to future steps are drawn.
Conceptualisation of FVG
Isovist areas are normally computed via solving the VG of the architectural environment. The method abstracts urban form as a regular tessellation for constructing VGs with vertices and edges representing the vantage points of space and the visual connections (Batty, 2001; Turner et al., 2001). It enables capturing the network properties of VGs more comprehensively with various friction measures, e.g., Euclidean distance, topological steps, angular change, travelling time, etc. The problem of measuring visibility is, therefore, translated to a question of quantifying the graph connectivity. In a toy model shown in Figure 1(a), a VG is constructed by removing invalid edges from the fully interconnected VG, and the isovist of one location can be defined as the area covered by the nodes linking directly to it with visibility edges. It is easy to add a new layer of attractor network to make a refined VG with both form and function information. Within this layer, an activity location is represented as a node, and the inter-visual relationships between space and function nodes are defined as edges. This modified VG is called functional visibility graph, where there are two sorts of nodes – space nodes (the central points of spatial cells) and function nodes (the activity locations), and the edges showing the inter-visibility between them. Formally, a VG can be defined as a graph,

Visibility connections for a space location (a), for one function location (b), and for two function locations (c) in a first-order visibility graph with a gradient fill showing visibility cost – angular mean step depth levels from low (blue) to high (red).
By solving FVG via searching the connected space nodes, we can compute an isovist for any function location(s). The isovist for multiple functions, for instance, can be computed as the overlapped area of the isovists for individual attractors. By continuing to do this until all functions are traversed, we can have the average visibility cost from every place to all destinations, a global view on visual accessibility. In a T-shape model, the distribution of mean visibility steps to spaces highlights the corners that are visually accessible than other places, particularly those located around the boundary of the T-shape obstacle (Figure 1(a)). In the models with one and two functional locations (Figure 1(b) and (c)), the mean visibility steps to functions via the rebuilt FVGs pick the right corners as the visibility cores to recognise urban activities. In a comparison between the visibility results from VG and from FVG, we can easily witness how urban functional landscape ‘stretches’ the visualscape. This ‘visual shallowness’ to attractive destinations reckons the effect of function distributions on people’s perceptions, which is essential for evaluating land-use allocations in the spatial context where they will be implemented.
The method: Measuring FVG
Towards a point-path-plane understanding of functional visibility landscape
The framework of functional visibility graph analysis (FVGA) is shown in Figure 2. In the first step, the required information is collected. The spatial layouts document the built form, while the points-of-interest (POIs) record the urban function patterns. Apart from the conventional dataset of building usage, the POI data used is with substantial facts of people’s engagement intensity recorded as their check-ins in social media. In the second step, an FVG is created with space and function nodes that are mutually visible and interlinked by visibility edges. Two parameters are required at this stage to identify the resolution and scale focused for the subsequent analyses, including cell size, the width of square cells covering the study area, for defining analysis resolution, and radius referring to the distance constraint, e.g., the metric distance or topo-geometric step depth, for defining analysis scale.
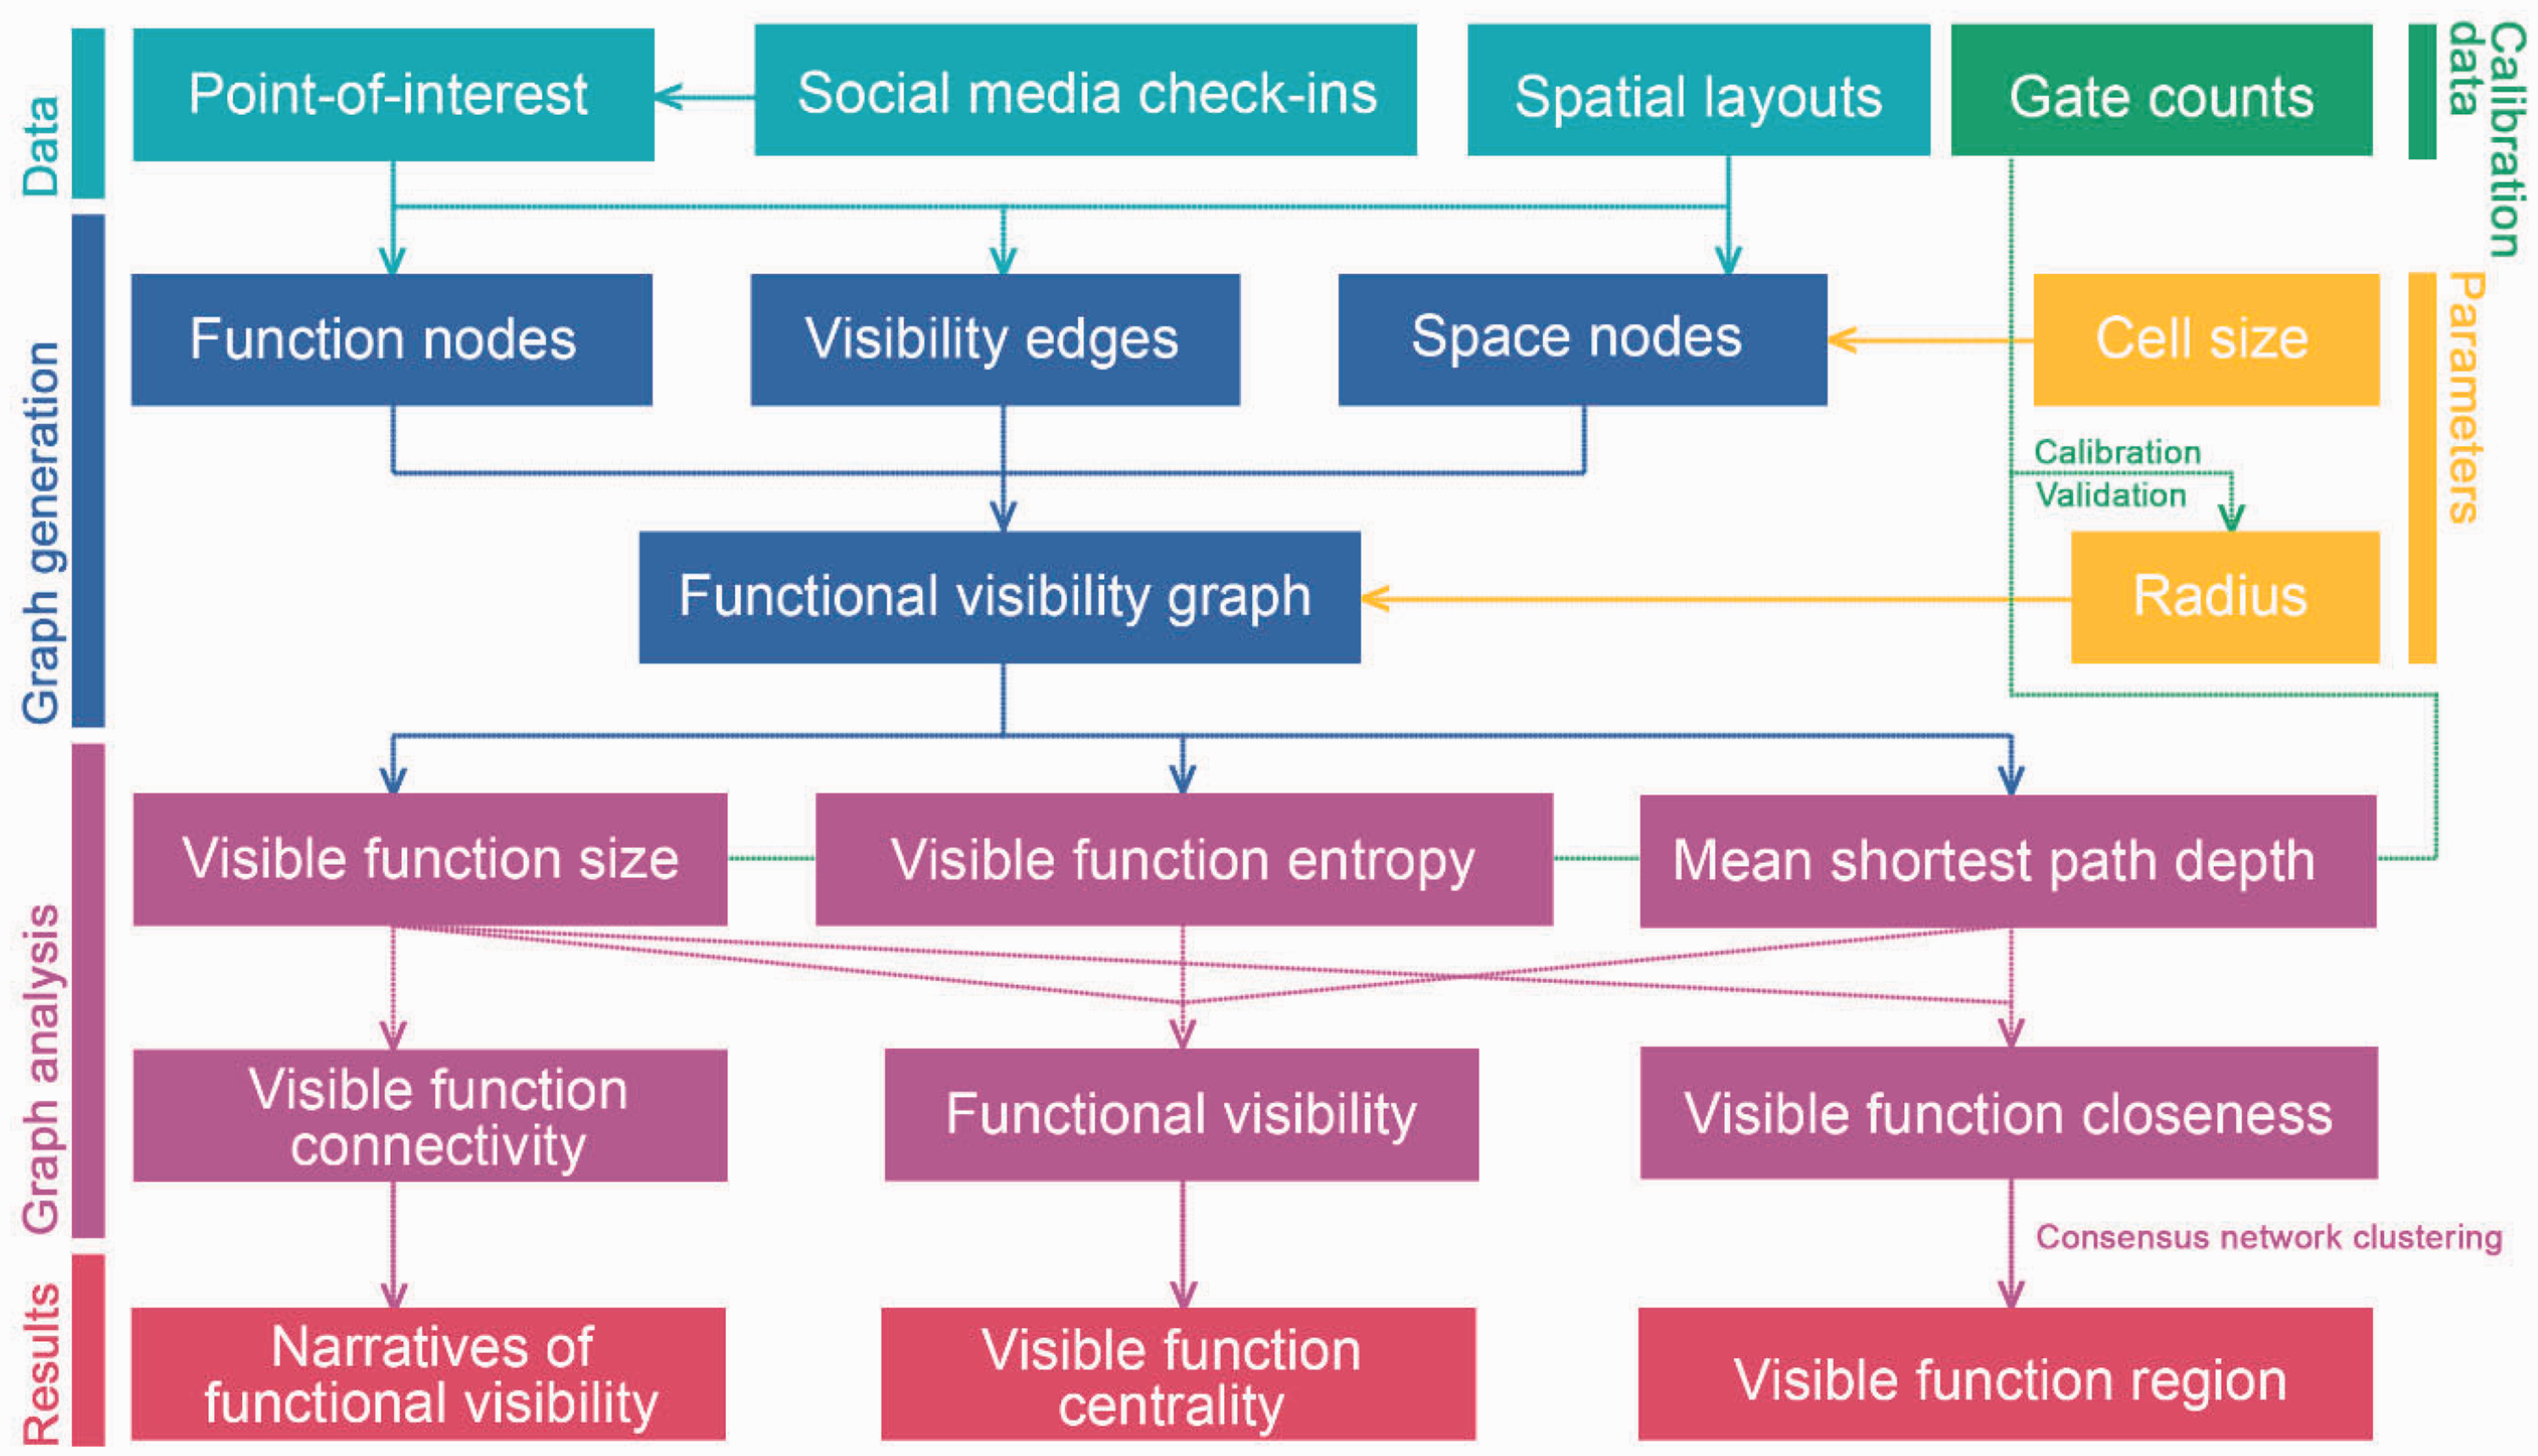
Research design for function visibility graph analysis.
In an FVG, the topo-geometric connection properties are assigned at every space node so that a scale-related analysis can be conducted. Angular change is used as the cognitive cost along the shortest visible path followed the work conducted by Turner (2003). Based on the settings of cell size and radius, the VG is solved with a series of basic measures, including visible function size, function entropy, and mean shortest path depth, revealing three aspects of function agglomeration: density, diversity, and cognitive distance decay effect, respectively. Interactions among these three basic dimensions are further documented in several composite measures that enable the explorations on the narrative of visibility along the travelling paths, on the visible function centrality patterns showing locational potentials, and on the visible function regions with different visibility characteristics. These examinations uncover essential elements of city image (Lynch, 1976): paths, nodes/landmarks, districts with boundaries, which are tightly bonded to the way how people perceive places and are widely adopted in urban design processes to show the structures of planning. The crucial paths normally interlink nodes and landmarks, shaping the centres shared by several districts. These composite measures quantify the city image that was hardly quantifiable before and the locational advantages with visual accessibility, demonstrating its potential of being a design support tool for fine-scale spatial interventions.
Analysing FVG
Three basic measures
Visible function size – Density measure: Visible function size of a space vertex i is the weighted amount of the function nodes j in the set of vertices,

Visible function entropy – Diversity measure: Visible function entropy of a space vertex i equals the normalised entropy implied by the compositions of visible function size to different urban activities in type k with a cumulative edge length less than


Mean shortest angular path depth – Cognitive distance measure: Mean shortest path depth,

Accordingly, a specification of this measure for a type function k can be defined as

Interplays between basic measures
Visible function connectivity – Immediate visibility: Apart from the connectivity in VGA (Turner, 2001b) as the number of visual links incident upon a space node, visible function connectivity for a space node i, equivalents the weighted number of visibility edges connecting to it from function nodes. It can be directly obtained from the adjacency matrices of FVGs. From a mathematical view, it can also be represented as the visual function size at zero angular step depth

Functional visibility – Integrated visible centrality: Functional visibility index (

In this gravity-like form, an inverse distance decay function is adopted with an exponential parameter,
Visible function closeness – Visibility to a type of function: The closeness centrality is usually defined as the reciprocal of the mean distance to every node within the whole network without any fixed radius. This visible function closeness is very close to this definition, but the only difference is that the visual function size is used as a weight to control the size variation of reachable nodes when a radius is employed. This measure here is specified for a type of function k, which equals to the visible function size,

Visible function region – Visibility community: Functional regions here are defined as the areas maintaining more similar visual functions inside the boundaries than that outside them. Detecting their boundaries provides a scope to understand the emergence of neighbourhoods with respect to spatial exposure to various human activities. To avoid the absence of the optimised number of clusters in classic clustering analysis methods, we employ the consensus network clustering method (Lancichinetti and Fortunato, 2012) which first reduces multi-layers networks to a consensus network and then applies community detection methods with Monte-Carlo tests to generate robust partitions with an optimal number of clusters. The input is a complex network with the VGs specified for K types of functions, and the output is the membership for each space. This process is entirely data-driven and parameter-free. The specific community detection method we used is the Louvain method (Blondel et al., 2008) due to its computational effectiveness and robustness. As a type of unsupervised clustering method, the detected, exploratory partition results are validated by the statistic showing the goodness of partition - the modularity score of the consensus network. The larger the modularity score is, the more significant the visible function regions are.
The material: Study area and data
Study area
A central area sized with a 1 km×1 km geographical window is selected for the case study in this research. It is located in the city centre of Tianjin, where urban functions are agglomerated and projected along with the spatial grids (Figure 3). Tianjin is the third-largest city in China with respect to the population size according to the census data. The selected area covers the place where the well-known pedestrian shopping avenue in Tianjin, Binjiang Road, is located, and the preserved historic districts with a sophisticated system of urban public space, the colonial areas in the modern urbanisation process are also covered. This area is highly urbanised with distinct spatial characteristics featured by many urban elements (e.g., round square, streets, alleys, etc.), which provides a scene for testing our hypothesis that the clustering of urban activities is another layer of the visible content beyond the built form, and it is influential for the collective urban movement patterns.

A 1 km by 1 km area within central Tianjin (a); check-ined POIs dataset within the proposed study area (b); map of gate counts (c).
Data
The data source adopted in this work includes social media check-in data with geographical references assigned to POIs, the detail shapefiles representing the architectural environment, and the gate count results that are spatially joined to the places where the survey was conducted. The check-in and POI data were gathered from Weibo, the biggest social media platform in China. As volunteered geographic information, it keeps the advantages of the data volume, coverage, positioning precision, and update frequency. This research employs check-ined POIs are urban function nodes geographically referenced to urban form and uses the number of check-ins for each POI (
Results
Validation and calibration
Visibility or visual accessibility is typically validated by its good correlations with observed movement patterns since urban geometry mediates and impedes people’s way-finding behaviours (Hillier and Iida, 2005). This study trials the correlative relationships between the proposed measures and gate count data. The results of the univariate analysis are documented in Table 1, where most of the FVGA measures are statically significant factors to describe the movement distribution, and they outweigh the classic VGA measures. The function visibility index achieves the highest predictability on movement distribution yielding that the interactions among three basic measures assumed in equation (7) are sound for flow estimation. This trend is most significant when the radius is fixed around 300 metres and at which function visibility can describe 75% variation of human flows. This radius, therefore, is calibrated as the optimised radius for estimating footfall patterns and related urban distributions.
Regression results by regressing observe human’s movement against various families of visibility measures.
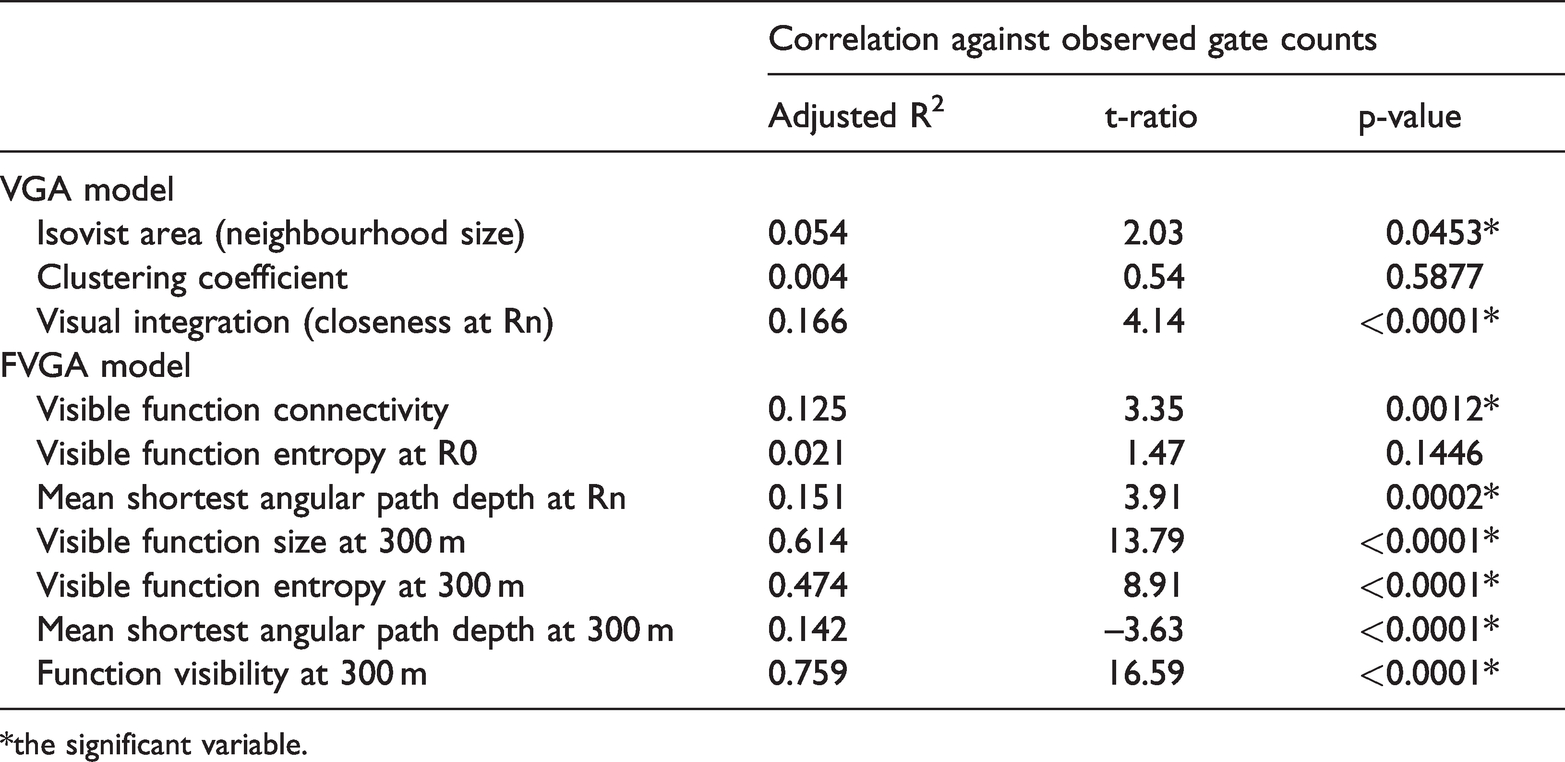
*the significant variable.
To corroborate the independent contribution that each measure makes, a series of OLS models is conducted. Models 1 and 2 are distinctive for using FVGA variables without or with check-ins information, while model 3 uses both. Table 2 shows that the measures in the FVGA model at the pedestrian scale, 300 metres, are all statistically significant, whereas the measures at the zero angular-change radius (R0) and infinite radius (Rn), that are reported to be significant factors in the univariate analysis, turn to be non-significant. People are more likely to gather at the places with higher density and diversity of the functional visibility information. The mean shortest angular path depth is a positive variable due to the dispersion of footfalls. The measures with the weights from check-in records outperform the ones without them as significant variables, proving the adequacy of using social media check-in data as function attractiveness. These remarks demonstrate the effectiveness of the proposed measures and the suitability of the required data for modelling flow aggregation and people’s perceptions.
Exploratory OLS analysis between human movement and individual measures for the function visibility graph analysis.

*the significant variable.
Results of exploratory applications
Narrative of functional visibility – Analysing the visually functional routes
Isovist analysis was initially delivered to record a rush of visual information – a sudden dilation of people’s view, and exposure posed along a path (Benedikt, 1979). It was demonstrated that such a sequence of morphological signature is associated with actual changing perceptions of walking the path (Batty, 2001; Dalton and Dalton, 2001). This enables the assessment of the spatial experience delivered synchronically along any essential routes that might be designed subjectively. Beyond the conventional isovist analysis, visible function connectivity quantifies how the functions are seen immediately in space, which shapes another layer of ‘rhythm’ from one location to another. An interesting path through the study area is mapped in Figure 4, which shows a variety of spatial experiences ranging from streets to squares with complex visions of various accomplishments within public spaces. This shifting experience along such a length can be logged by outlining the change of visibility profiles from the beginning to the end. This application is of potentials for evaluating the performance of a sequence of places as a chain that facilitates a fascinating tour as expected or not.

Shifting visibility information along a walk: (right-above) traditional VGA metrics (CC: clustering coefficient; HH: closeness at R1; NS: neighbourhood size); (right-bottom) functional visibility measures (FV: functional visibility at R0; VFC: visible function connectivity; VFE: visible functional entropy at R0; MAD: mean shortest angular path depth at R1).
Though visibility information fluctuates dramatically at the major junctions, the inconsistency between the spatial and functional visibility measures exists along the walk. The spatial visibility documents the waves of spaciousness from narrow streets to a central square and then back to long streets. The central square is the visual centre with the richest visible space information of the size, compactness, and centrality of isovist areas, indicated by the neighbourhood size, clustering coefficient and closeness measures. This square, however, seems to lack activeness with respect to the visible function information demonstrated by lower levels of functional visibility measures. It breaks this sleeted bustling walk where all other segments can provide more visibility to activities than it. These segments can be characterised by the average scores of functional visibility measures as well as their compositions. For instance, segment a–b is more density-oriented, indicated by larger values of visible function size than segment e–f which is more diversity-oriented, recorded by higher levels of visible functional entropy. By tracing these changes of configurational information encountered, designers can assess the visually perceived accessibility along import routes in the legacies and then modify the spatial and functional layouts to support their tentative ideas precisely. In this example, the visibility to activities in the central square can be enhanced by reallocating more attractors to shape a more continuously-active walk.
Visible function centrality – Uncovering the visually functional centres
Figure 5 maps the distributions of various measures at the absolute radii and calibrated pedestrian radius. At the radius with no angular change, the main streets in this area are highlighted by different visibility information. Binjiang Road manifests with high levels of visible function connectivity, whist Heping, Chifeng, and Yingkou Road are featured by high levels of visible function entropy. The intersections between these main roads, incorporating the density and diversity of visibility information, are captured as the space with higher levels of immediate functional visibility than other places. By contrast, the geometrical centre of this area is scored highly with respect to the global functional visibility measure. At the 300 metres – a pedestrian distance threshold, Binjiang Road and its interlocking streets are the most visible places exposed to activities, with high scores of visual function size and entropy but low values of mean shortest angular path depth. These results yield the multi-scale nature of the visibility landscape and the potential of these measures as a series of visual centrality to estimate urban flows and other movement-related urban performance.

Functional visibility graph analysis: (a) Visible function connectivity; (b) Visible function entropy at R0; (c) Functional visibility at R0; (d) Functional visibility at Rn; (e) Visible function size at 300 m; (b) Visible function entropy at 300 m; (c) Mean shortest angular path depth at 300 m; (d) Function visibility at 300 m.
Visible function regions – Sensing the visually functional neighbourhoods
The results of the visible function regions (at 300 m) are shown in Figure 6. Seven clusters are detected. Clusters 1 and 7 are the business areas dominated by retail and recreation activities, while they can be easily distinguished by the clustering of hotels and catering activities. Cluster 3 is also an active area characterised by the transport nodes, parks, cultural sites, and hospitals that are more visually perceivable than other places. Cluster 4 is less active than cluster 3 indicated by lower levels of functional visibility closeness, though it can be featured by the clustering of similar activities as cluster 3. Clusters 5 and 6 are both highlighted by the higher visibility to education than that to others, but the former can be further captured as its visual exposure to transport-related services, and the latter can be featured by its visual connectivity to hospitals and public service providers. This partition is validated statistically by a maximised modularity score (0.73), and the boundaries of these function regions are consistent to people’s perceptions, e.g., cluster 6 covers the areas where the entrance of Yaohua high school is opened; and a city bus terminal is located in cluster 4 and is visually exposed to cluster 3.

Detected visible functional regionals in terms of the visual function closeness to different active functions in 2014 (modularity score of the consensus network is 0.73) (a); detected visible functional regionals for different active function in 2010 (modularity score of the consensus network is 0.65) (b).
The shift of function visibility landscape
Urban function distribution shifts more frequently than urban form, thereby reshaping visibility landscape endlessly. This research compares the change delivered by the shifting urban functions beyond the static urban form within four years – a shorter period than that when a usual urban design is implemented, but a longer period than that when check-in behaviours are recorded. The time resolution should be properly selected for tracing an apparent change of activity distributions but for avoiding data scarcity. With time-stamped check-in data, this application enables high-frequency assessments of urban designs after they are implemented, shedding lights on any subsequent design modifications.
It is recognised that the function visibility scores for the study area grow from 2010 to 2014 with increased visible function size and entropy and decreased angular step depth (Table S1 in the Supplementary Material). This showcases a trend that functional visibility information was enriched due to the agglomeration of urban functions when the spatial form is static. The clustering of urban functions maximises their inter-connectivity by reducing the visual cost between them. This is also demonstrated by the result of function visibility in 2010 and the cumulative probability curves of the proposed measures (Figure S2 in the Supplementary Material).
The shift functional regions across two sections in 2010 and 2014 are mapped respectively in Figure 6(a) and Figure 6(b). The statistical significance of functional regions in 2010 is 0.65, and the number of detected communities is 5, both smaller than that in 2014, revealing the consolidation and subdivision processes of functional regions. All the clusters correspond roughly with the ones four years later except cluster 1 that differentiates into three clusters in 2014 (clusters 2, 4, and 6) due to the relocation of urban functions.
Discussion
This paper introduces a framework to analyse the FVG for quantifying the visibility to various activities based on the spatial and functional configuration sensed by voluntarily-tagged POIs and check-ins. The outputs of this research validate the effectiveness of the proposed metrics. The improved performance of the models with these factors on describing the actual urban movement indicates the importance of urban functions in shaping our visual landscape which in turn reshapes travelling patterns. The contribution of the tagged POIs and check-ins is confirmed by the advancement of model fittings with the variables with weighting elements beyond those without weights or with other conventional measures. By calibrating the optimal radius at 300 metres, the proposed method provides a multi-dimensional understanding of the interplays between form and function with respect to visibility landscape: a point-based perspective capturing different spatial centralities; a route-based scope showing the shift of function visibility along the path as the changing spatial narratives, an area-based scope showing the sense of space based on the typologies of function mixture perceived by people. The diachronic analysis of the functional visual graph for the same research area shows that the change of functional visibility landscape might be more dynamic than the urban space is, showing a more ‘updated’ view of the visual environment that is enabled by the new data environment.
There is still much potential for further developing this model. The framework proposed could be adopted and updated in a finer time resolution which is increasingly enabled by other higher-frequency data without the data scarcity problem that social media data might suffer when the time resolution is too small. One solution for this might be to combine cell phone data with social media datasets. Furthermore, calibrations of the optimal radius are required for addressing different urban issues. If the radius calibrated in this work is generic for other areas, it could be further tested with more cases. For future efforts, many could be done, but not limited to, relating these function visibility measures to other aspects of socioeconomic performance, predicting the visual preference across population groups, or assessing or remedying the visualscape delivered by the proposed spatial interventions.
Supplemental Material
sj-pdf-1-epb-10.1177_23998083211001840 - Supplemental material for Functional visibility graph analysis: Quantifying visuofunctional space with social media check-in data
Supplemental material, sj-pdf-1-epb-10.1177_23998083211001840 for Functional visibility graph analysis: Quantifying visuofunctional space with social media check-in data by Yao Shen and Zhiqiang Wu in Environment and Planning B: Urban Analytics and City Science
Footnotes
Author’s note
Yao Shen is also affiliated with Key Laboratory of Ecology and Enery-saving Study of Dense Habitat, Minstry of Education, PR China.
Declaration of conflicting interests
The author(s) declared no potential conflicts of interest with respect to the research, authorship, and/or publication of this article.
Funding
The author(s) disclosed receipt of the following financial support for the research, authorship,and/or publication of this article: This work was supported by the National Key Research and Development Program of China (2020YFB2103901), National Natural Science Foundation of China (51908413) and Pujiang Talent Project (19PJC106).
Supplemental material
Supplemental material for this article is available online.
Biographical notes
References
Supplementary Material
Please find the following supplemental material available below.
For Open Access articles published under a Creative Commons License, all supplemental material carries the same license as the article it is associated with.
For non-Open Access articles published, all supplemental material carries a non-exclusive license, and permission requests for re-use of supplemental material or any part of supplemental material shall be sent directly to the copyright owner as specified in the copyright notice associated with the article.
