
Abstract
Dynamic vision refers to a person’s visual perception of the environment when the person is in motion. Pedestrians naturally have dynamic visual experiences, the aesthetic qualities of which may modify their walking and seeing behaviors. Despite the subject’s significant design relevance, dynamic visual research has shown limited theoretical and methodological progress since the 1960s. Inspired by recent development in 3D visibility research, this paper proposes a Real-Time Dynamic Visual Evaluation (RtDVE) protocol that simulates and evaluates pedestrians’ dynamic visual experiences in designed environments. The protocol utilizes Downtown Explorer, a 3D game developed to allow research participants to simulate free-roaming walks by controlling a pedestrian avatar. The game synchronously collects graphic and numerical data about the avatar’s first-person sequential views. The RtDVE protocol prescribes computational procedures to convert collected data into diagrammatic charts illustrating view-to-view transitions within the avatar’s Field of View. The protocol also introduces Dynamic Visual Variance Index, a composite quantitative index synthesizing multiple numerical data to facilitate comparisons of dynamic visual experiences across various simulated walks. Through a two-stage empirical study, the paper reveals the RtDVE protocol’s conception and demonstrates its effectiveness. The study applied the RtDVE protocol to investigate simulated dynamic visual experiences about different architectural massing schemes. The descriptive analysis outcomes facilitated the exploratory evaluation of these design schemes’ implications on pedestrians’ dynamic vision. Given its strengths in operability and research quality, the RtDVE protocol can promote evidence-based, user-centered design practices incorporating dynamic visual evaluation. Future RtDVE studies may adopt evolved real-time 3D simulation technologies and more sophisticated research designs to examine the complex ecological interplay between the objective and subjective factors in dynamic vision.
Keywords
Introduction
Dynamic vision refers to a person’s visual perception of the environment when the person is in motion. Pedestrians naturally have dynamic visual experiences, the aesthetic qualities of which may modify their walking and seeing behaviors. Architectural and planning researchers have long discoursed upon the phenomena that some well-designed urban environments give rise to intriguing and pleasant dynamic visual experiences. Despite the subject’s conspicuous design relevance, existing design research literature offers few practical methods for assessing a designed space’s potential affordance of dynamic vision, let alone incorporating dynamic visual evaluation in the design process.
Early research on dynamic vision in urban settings dates back to the 1960s when Cullen published The Concise Townscape (1961) and Appleyard et al. published The View from the Road (1964). These two groundbreaking research works attempted to integrate studies of humans’ movement in the city, environmental cognition, and aesthetic evaluations. Acknowledging the complexity and holism of dynamic visual experiences, Cullen and Appleyard shared some theoretical assumptions. First, dynamic visual forms a person can perceive are reciprocally influenced by the person’s intentional moving, looking, and seeing behaviors. Second, researchers should collect data about first-person, sequential views to analyze dynamic vision, which encompasses salient human, spatial, and temporal dimensions. Moreover, visual sequences’ compositional traits, such as contrast, continuity, rhythm, and development, have significant aesthetic implications. These fundamental stances have remained influential, inspiring many environmental researchers and designers (see Bacon, 1967; Banerjee and Loukaitou-Sideris, 2011; Watson et al., 2003).
Nevertheless, empirical research studies on dynamic vision have remained insufficient. The influence of dynamic visual research on design practice is negligible despite a revival of interest in urban visual environments (see Harvey et al., 2017; Simpson, 2018; Simpson et al., 2018). Several methodological challenges seem to account for the stagnation. In general, there is a cross-disciplinary deficiency in effective research models for gathering, processing, and interpreting visual data (Prosser, 1998). Specifically, collecting massive data characterizing naturally occurring sequential views continues to pose a daunting task for researchers.
This paper proposes a simulation-based data collection and analysis protocol that takes advantage of 3D real-time game technologies to evaluate pedestrians’ dynamic visual experiences. The protocol utilizes Downtown Explorer, a 3D game developed as the data collection tool. In the game, participants can control a pedestrian avatar to simulate walks while the game synchronously collects graphic and numerical data about the avatar’s first-person sequential views. Capable of visualizing and quantifying view-to-view transitions within a free-roaming pedestrian’s Field of View (FOV), the protocol can advance dynamic visual research and expand its utilization in the professional practice of architecture and urban design.
Research background
Visibility research
Decades of academic research upon humans’ visual perception have spawned various theoretical and practical strategies for analyzing static or dynamic visual forms. Those concerning visibility are the most prominent in architecture, landscape architecture, and urban planning. Investigating the environment through “the perspective of the (able-sighted) occupant” (Turner, 2003: 657), visibility research is related to dynamic visual research. The dominant conceptual frameworks on visibility fall into two major strands: isovist/viewshed analysis and morphological analysis.
An isovist or a viewshed refers to an area in a spatial environment directly visible from a specific location (Lynch, 1976; Tandy, 1967). One can identify a set of isovists for any space by drawing straight Lines of Sight (LOS) emitting from discrete viewpoints and tracing their intersections with spatial boundaries (Benedikt, 1979). The idea of isovists inspired a novel and unique approach to map spaces. Quantitative isovist properties, for example, volume, area, and perimeter, further enabled researchers to quantify designed spaces in terms of visibility (Batty, 2001; Benedikt, 1979; Ostwald and Dawes, 2019). For scrutinizing relationships between isovists of different locations, architectural researchers introduced composite measures, including isovist fields, isovist graphs, and visual depth (Fisher, 1995, 1996; Llobera, 1996). Likewise, landscape architectural researchers studied single or sets of viewsheds for rational classification of landscapes, adopting abstract visual quality concepts termed as prominence or enclosure (Fisher, 1995, 1996; Llobera, 1996).
Researchers of architectural and urban morphology also have developed concepts, models, and methods for analyzing visibility. These morphological analyses draw links between physical spaces and perceived visual forms, translating building elements into morphological components, for example, corridors, districts, and paths (Krüger, 1979; March and Steadman, 1971; Thiel, 1961). Space Syntax axial lines provide a graphic representation of the urban environment using networks of intersecting straight street segments that trace over the most extended LOS (Hillier, 2007; Hillier and Hanson, 1984). Other morphological analysis topics include e-partition and s-partition that measure the changing amount of vertical faces visible from different viewpoints (Peponis et al., 1997).
Most early visibility research studied 2D plan graph data only (see Lu et al., 2019; Turner et al., 2001). Also, quantitative mapping and rationalization of physical spaces overshadowed the relations between visibility properties and user experiences in these studies, making their findings less pertinent in practice. The following research endeavors have trended toward engaging the visibility of 3D spatial environments (e.g. Fisher-Gewirtzman et al., 2013; Koltsova et al., 2013; Lonergan and Hedley, 2016) and integrating qualitative data to quantitative visibility analysis (e.g. Fisher-Gewirtzman, 2014, 2018a; Ratti, 2002). Researchers have embraced computational algorithms and 3D technologies in recent years, increasingly using GIS layers of multi-variable 3D physical conditions as data sources (Jiang and Claramunt, 2002; Yang et al., 2007). Computer-aided methods have been vital for two specific research directions: 3D LOS visibility analysis (e.g. Fisher-Gewirtzman, 2014, 2017) and agent-based systems to simulate and model the visual process of inhabitation (e.g. Turner and Penn, 2002). The former conducted systematic 3D visual depth analysis by tracing LOS at each viewpoint toward different categories of environmental elements; the latter experimented on robotic agents programmed with behavioral model rules that consider a space’s visibility properties.
Dynamic visual research
Empirical research precedents of empirical dynamic vision since Cullen and Appleyard have been inadequate and limited by analog data collection and analysis methods. For example, Appleyard and Craik simulated dynamic vision in the Environmental Simulation Laboratory of the University of California at Berkeley with model-scopes, mini-sized motion picture cameras, and realistic scale models (Appleyard and Craik, 1974; Bosselmann, 1984, 1993). Cullen attempted a similar analog simulation of dynamic vision (Russell, 1992). These simulation methods are expensive and logistically demanding.
For dynamic visual researchers, some visibility research methods are inspirational. Fisher-Gewirtzman’s 3D visibility analysis based on LOS (2014) exemplified a computational approach that gathers visual depth data and generates heatmap style depth views about digital 3D models of urban environments with architectural details. She then developed a Dynamic Visual Analysis model that simulates and predicts 3D LOS visibility for humans moving along given paths in a city (Fisher-Gewirtzman, 2017, 2019; Fisher-Gewirtzman and Bruchi, 2018). Some of her explorations echoed the LOS method for 3D visibility analysis proposed by Liu et al. (2010) and shed light on the development of more effective approaches for researching dynamic vision.
While promising, the methodological migration needs to overcome some considerable hurdles. First, as a holistic phenomenon characterized by dynamically linked subjective and objective aspects (Appleyard et al., 1964), dynamic vision needs to be measured in as natural conditions as possible. An optimal empirical study should have real human participants to carry out independent walking and looking around behaviors to collect data. Yet, contemporary visibility research does not emphasize natural observation conditions. Second, dynamic visual research favors a synchronous collection of research data. One should measure diverse variables, including time, location, orientation, visibility, and visual contents, to assess dynamic visual experiences. Collecting these data in real time would be advantageous for accurately coordinating them along a timeline, aiding the descriptive analysis of transient, ever-changing sequential views. Visibility research, however, has yet to provide any precedent that employed synchronous data collection methods.
Real-rime 3D game technologies
Thanks to the remarkable expansion of the video game market and the consequent exponential development in 3D technologies (Stewart, 2019), real-time 3D games have made tremendous progress in graphic quality and performance. In the past decade, significant technological milestones, such as Global Illumination, Physically Based Rendering, and Real-Time Raytracing, have redefined 3D graphics with substantially improved lighting and materiality fidelity. Meanwhile, 3D graphic hardware acceleration technologies have become more affordable and prevalent (Moammer, 2016). Mainstream gaming computers can render interactive, photorealistic digital environments at a frame frequency of over 60 per second while processing massive data in the background. Capitalizing on game technologies, architectural and urban researchers could implement real-time data collection for dynamic visual research through 3D simulation.
Methods
Downtown Explorer
Downtown Explorer 1 is a 3D game for simulating dynamic visual experiences and collecting relevant data in real time. Developed by the author in Unreal Engine (release 4.25.4), Downtown Explorer can run on any Windows platform with a graphic processor unit that supports Microsoft DirectX 11. Users can control a pedestrian avatar to roam within a fully visualized 3D urban environment during the gameplay. 2 The graphic user interface of Downtown Explorer provides a Pause Menu (Figure 1) for users to toggle visual depth data overlay, set the graphic style for depth view mode, set up data collection parameters, and adjust the time of day. The menu also allows runtime import of 3D digital models in standard FBX format for loading design forms.
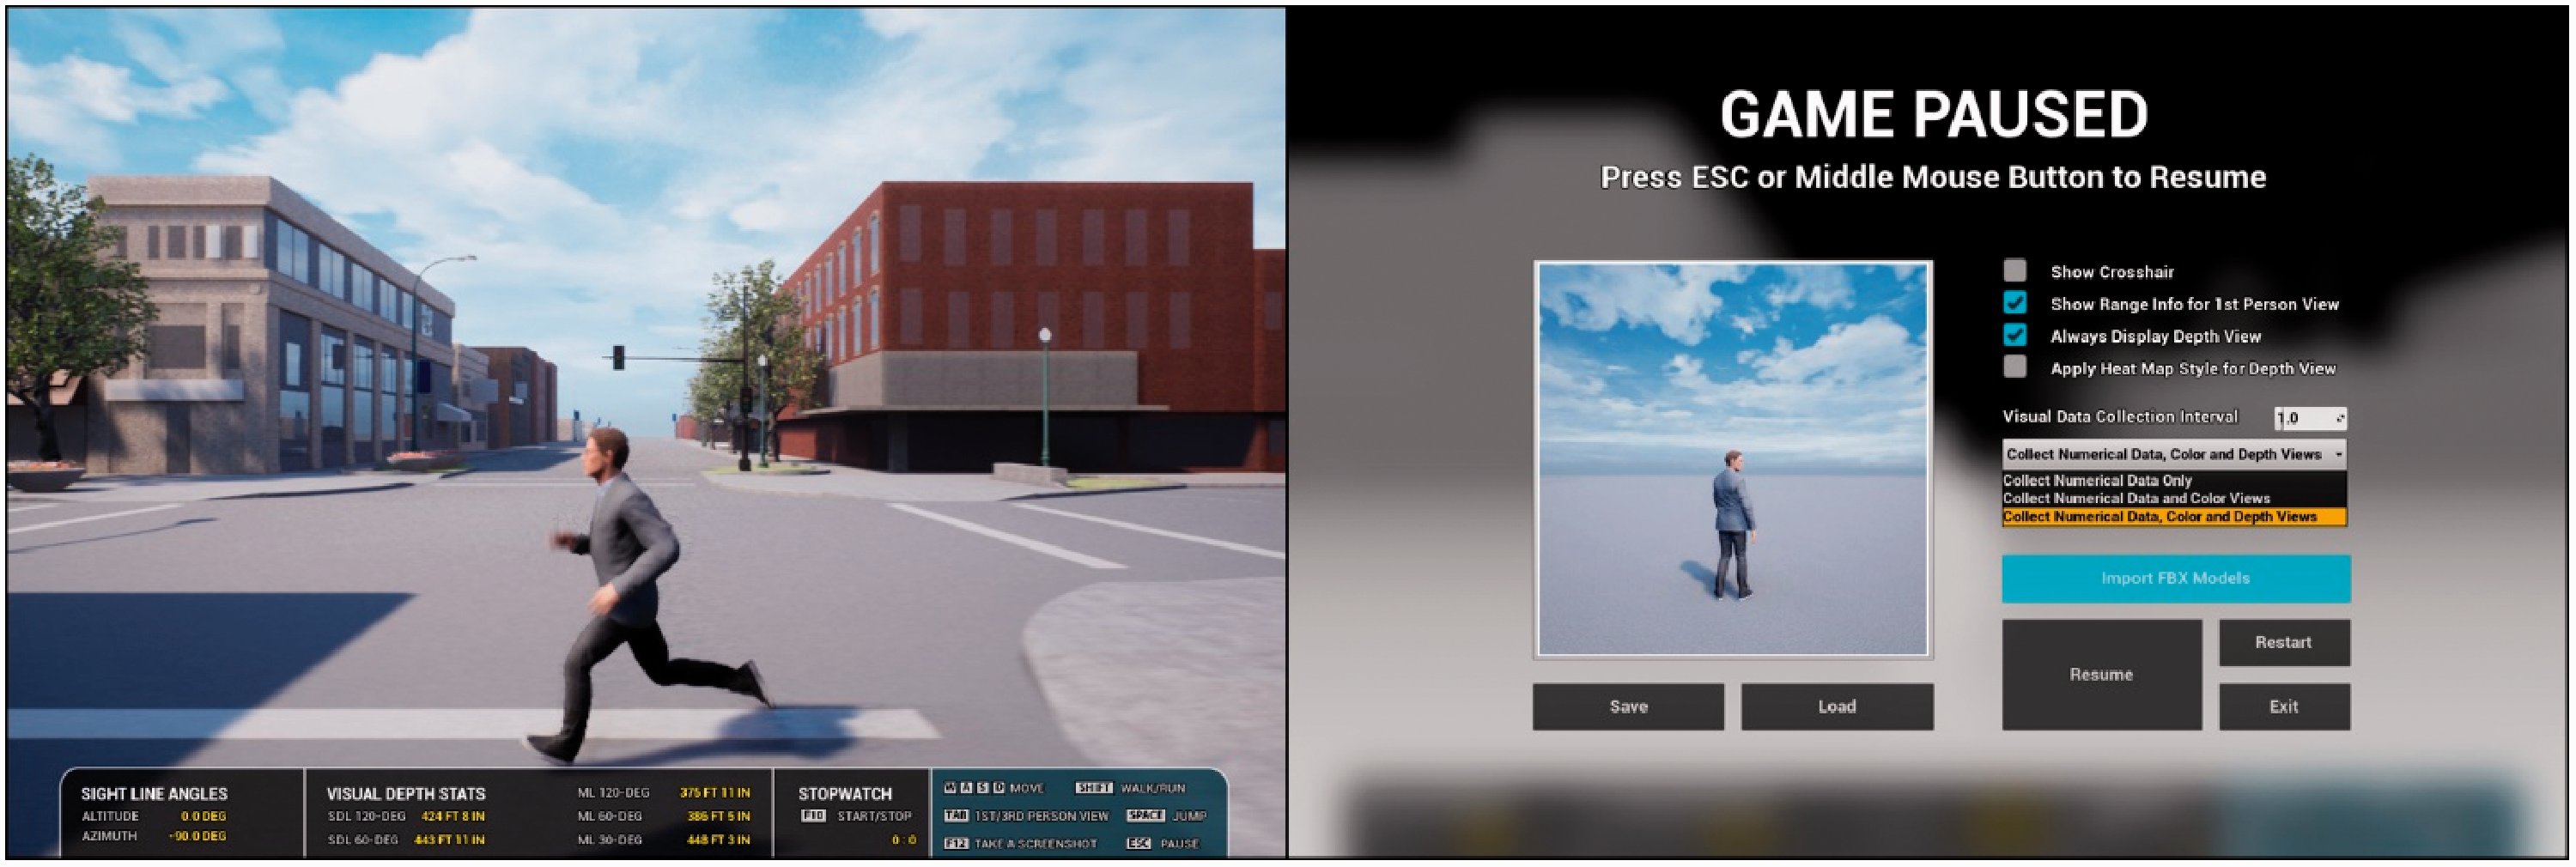
The graphic user interface (GUI) of Downtown Explorer and its Pause Menu (author).
During its real-time dynamic vision simulation, Downtown Explorer captures first-person sequential color views or depth views (Figure S1 in the Supplemental Material) and saves them as PNG files. Concurrently, the game records miscellaneous quantitative variable data and export them to an Excel file. These variables include the avatar’s location, viewing orientation, and LOS length measured between the avatar’s “eye point” location and the solid object in the surrounding 3D environment that blocks the sightline. The latest release of Downtown Explorer collects 13 LOS data at different angles to the central axis of the avatar’s FOV. These LOS correspond to 13 target points located on the first-person view’s picture plane: one at the exact central point of the view and the remaining 12 spread out on three concentric circles that reflect the 30-degree, the 60-degree, and the 120-degree visual cones (Figure S2 in the Supplemental Material). All these visual cones indicate critical human eyesight limits, according to existing research on human vision. 3 Together these LOS frame a contingent visible volume, or a spatial assembly of environmental elements visible to the avatar in a particular sequential view. The game collects visual depth data based on these LOS to directly measure changing visible volumes.
Real-Time Dynamic Visual Evaluation
Downtown Explorer is an all-in-one 3D simulation platform for efficiently collecting a multitude of real-time data measuring simulated dynamic vision. Utilizing Downtown Explorer, the author proposes a research protocol for Real-Time Dynamic Visual Evaluation (RtDVE) that synthesizes data collection, descriptive data analysis, and exploratory data analysis. This RtDVE protocol enables researchers or designers to evaluate designed spaces regarding their affordance of dynamic visual experiences.
As the protocol prescribes, RtDVE begins with recruiting research participants who simulate free-roaming walks in the game to generate real-time dynamic visual data about designed environments in evaluation. For descriptive data analysis, the protocol introduces standardized, computational procedures to manage, distill, and transform numerical and graphic data, yielding quantitative measurements and diagrammatic charts. These outputs delineate view-to-view adaptations in visible volumes and hence unveil dramatic changes in sequential views. The protocol also defines Dynamic Visual Variance Index (DVVI), a composite indicator that merges several quantitative measurements. For exploratory data analysis, the protocol suggests comparing descriptive analysis outcomes across simulated walks, such that researchers or designers can assess designed spaces’ dynamic visual implications. The comparison and evaluation may focus on DVVI data or engage other descriptive analysis outputs depending on specific scenarios. The following text presents a two-stage empirical study that showcased details of the RtDVE protocol and demonstrated its effectiveness. Containing an exploratory pilot stage and a subsequent experiment stage, the study was based at Watertown, South Dakota.
Pilot study
Process
A pilot case study led to the formation of the RtDVE protocol in search of simulation-based dynamic visual data collection and analysis methods. As an inductive inquiry, the pilot study was modeled after a paradigmatic case study research design (Miles and Huberman, 1994; Stake, 2005; Yin, 2003). The basic unit of analysis or the case was defined as “a meaningful sequence of visible volumes stemming from a real-time walk in Downtown Explorer.” The pilot study evaluated three alternate massing design proposals for an urban redevelopment project in downtown Watertown, South Dakota (Figure S3 in the Supplemental Material). As the only research participant, an undergraduate architecture student simulated a one-block walk for each massing scheme. Following a recommended route, all walks started from a parking stall on Broadway Street and ended somewhere past the project site on Kemp Avenue. In the meantime, Downtown Explorer collected graphic and numerical data sampled at a time interval of two seconds. The participant also screen recorded these simulated walks. He then reviewed all video recordings together with the author and recalled the most impressive visual moments when views dramatically changed and aroused interest or surprise. Data collected in varied formats cumulated to three separate cases.
Seeking a descriptive analysis strategy that could articulate complex dynamic visual phenomena, the author tried to condense massive raw data through data transformation, compiling, and visualization. The initial step was to calculate six inferential measurements using the collected numerical data about sampled sequential views: ML: Mean visual depth, which is the average length of all 13 LOS in each sequential view. SDL-60: Standard deviation in the lengths of 9 LOS within the central 60-degree visual cone. SDL-120: Standard deviation in all 13 LOS lengths within the full 120-degree visual cone. ΔML: Mean visual depth change, calculated as the average of absolute differences in all 13 LOS lengths between two consecutive views. ΔO: Mean viewing orientation change, calculated as the average of absolute differences in altitudes and azimuths between two consecutive views. ΔSDL: Mean change of standard deviation in LOS lengths, calculated as the average of absolute differences in SDL-60 and SDL-120 between two consecutive views; the definition of ΔSDL gives more weight to the LOS data within the central 60-degree visual cone.
All these measurements highlight fundamental dynamic visual characteristics. ML, SDL-60, and SDL-120 profile visible volumes for all sequential views showing how far, in general, the pedestrian avatar can have unblocked views into the environment and how visual depths vary within different visual cones. Their values revealed the way “the body” is related to “the environment” that constitutes “a sense of position” (Cullen, 2003: 3) and to define “successions of space, motion,” and “orientation” (Appleyard et al., 1964: 17). ΔML, ΔO, and ΔSDL disclose how visual depths transit from one sequential view into another, helping study “the existing view and the emerging view” (Cullen, 1961: 9) that may feature aesthetic merits such as “contrasts, well-joined transitions, and a moving balance “(Appleyard et al., 1964: 18) or “a constant play of variation on the basic theme” (Lynch and Hack, 1984: 81).
Next, the author produced planar and sectional visible volume diagrams that visualized changing viewing orientations and visual depths 4 (Figure S4 in the Supplemental Material) through a Grasshopper script 5 running in Rhinoceros 7. Graphic data of color views were batch processed in Photoshop to lower saturation values in areas outside of the central 60-degree visual cone in accordance with the real-world human color perception capacity.
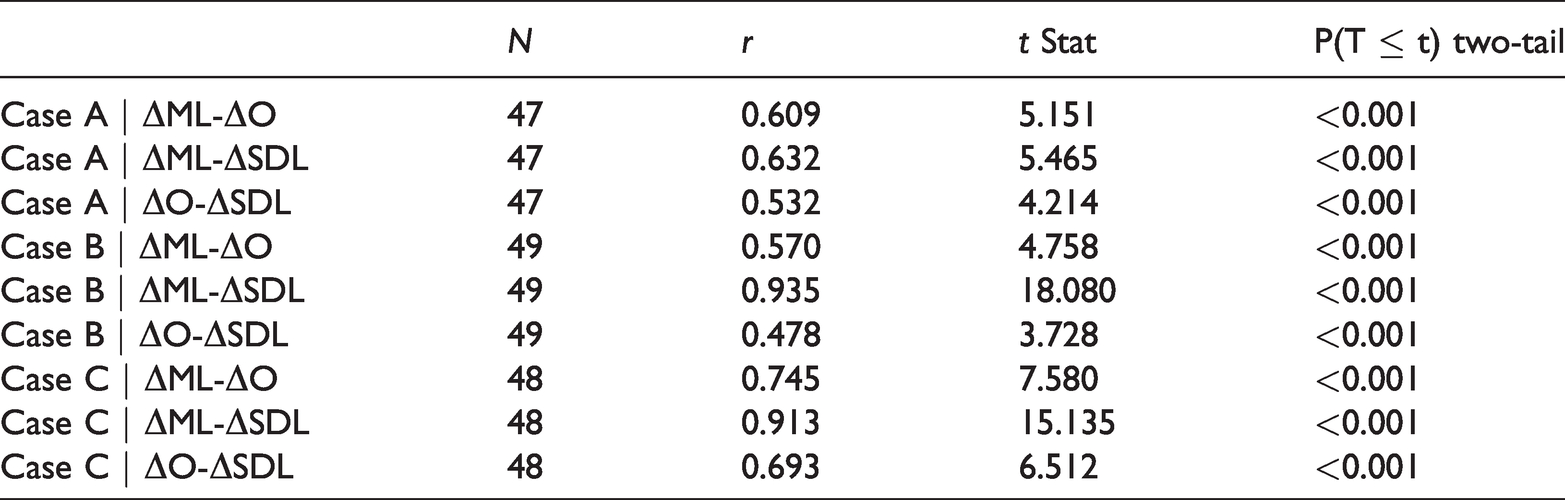
Further data compilation and visualization steps led to timeline-based charts and the definition of the DVVI. Bringing together multiple analysis outputs, Visible Volume Variance Analysis Charts illustrated how visible volumes shift over time to uncover significant dramas in view-to-view changes, or “jerks or revelations” that may have “an impact on emotions” (Cullen, 1961: 9). Within each case, Visible Volume Variance Analysis Charts displayed a resonating pattern about how numerical and graphic data changed: spikes in ΔML, ΔSDL, or ΔO mostly echoed each other and coincided with marked variations in visible volume diagrams and color views. Paired t-test results confirmed that these measurements were significantly correlated with each other (Table 1). As reported by the research participant, impressive visual moments approximately confirmed the same pattern (Figure 2 and Figure S5, S6 in the Supplemental Material).
6
These observations inspired the author to propose DVVI, a composite indicator that combined ΔML, ΔSDL, or ΔO for predicting dramatic changes in visible volumes. The conceptualization of DVVI recognized two factors that profoundly characterized the visible volumes in constant transition: first, the view-to-view difference in visual depths as measured by adaptation in the mean and standard deviation of visual depths; second, the change in viewing orientation.
7
The product of these two factors hence defines DVVI quantitatively as the mathematical formula below shows.

Pearson correlation test results for measurements of ΔML, ΔSDL, and ΔO in Case A, B, and C (author).
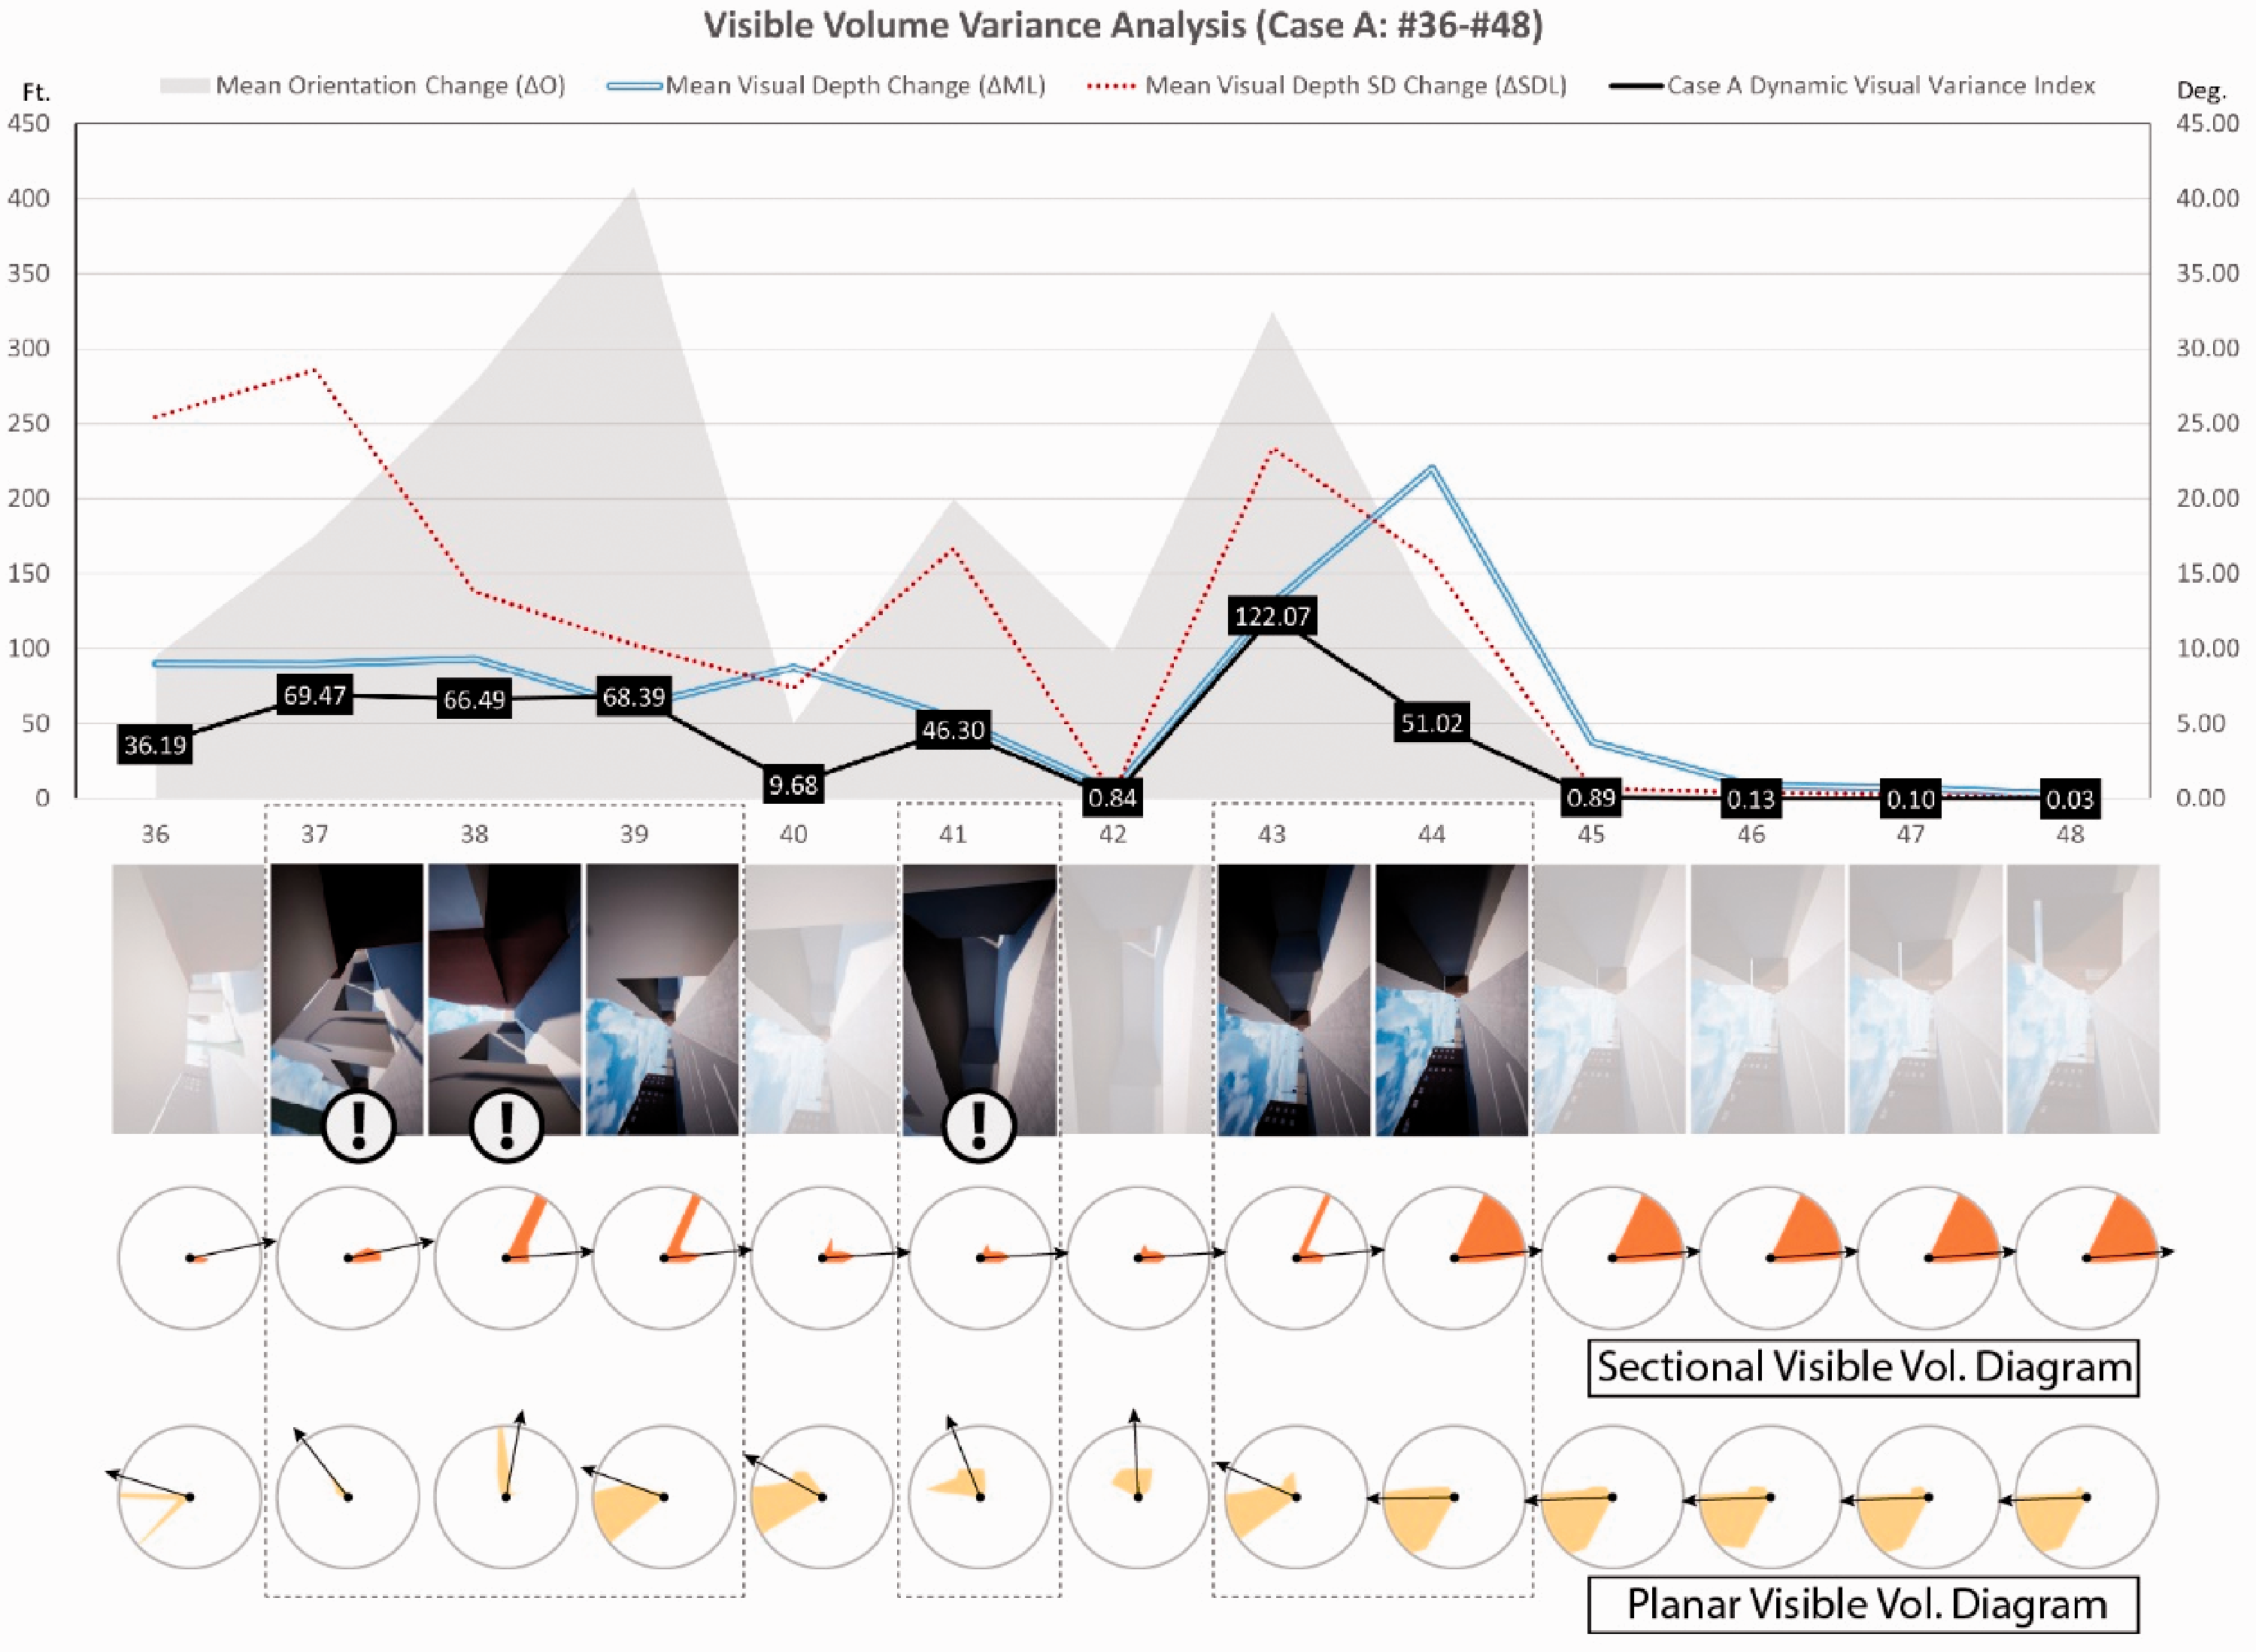
Visible Volume Variance Analysis Chart that compiles data from sequential views #36-#48 for the simulated walk regarding massing scheme A (author).
DVVI: Dynamic visual variance index
ΔML: Mean visual depth change (unit: feet)
ΔSDL: Mean change of standard deviation in LOS lengths (unit: feet)
ΔO: Mean viewing orientation change (unit: degrees)
PM: Constant parameter for modifying the range of DVVI values; for the pilot study PM=100
Results
The author reviewed descriptive analysis results for all three research cases, scrutinizing them within and across cases. Visible Volume Variance Analysis Charts depicted temporal-formal constructions of visual sequences and illuminated patterns of changing visible volumes. These charts could sponsor evidence-based discussions about aesthetic qualities such as contrast, rhythm, tempo, and timing (see Xu, 2019). DVVI encapsulated the dynamic visual characteristics elaborated by Visible Volume Variance Analysis Charts. Greater DVVI values corresponded to extraordinary changes in visible volumes. Overlaid DVVI dot plots (Figure S7 in the Supplemental Material) implied that massing schemes A and C made the research participant experience more frequent and intense contrasts in sequential views than scheme B did, affirming a cross-case comparison of Visible Volume Variance Analysis Charts.
Design experiment
Process
Following the pilot stage, the design study experiment stage involving multiple research participants was launched to further examine the effectiveness and usability of the RtDVE protocol. The experiment investigated if Visible Volume Variance Analysis Charts can elucidate how sequential views change across multiple groups of simulated walks. It also tested and corroborated a hypothesis that DVVI was a sensitive index that could reliably predict distinction in visible volumes. Designers could calculate and analyze DVVI data to implement rapid comparative studies when evaluating multiple design schemes.
The experiment engaged a massing design concept that evolved through three different forms (Original Design, Revision 01, and Revision 02) for a corner-site urban redevelopment project located in downtown Watertown, South Dakota (Figure S8 in the Supplemental Material). The author executed the experiment in two phases. The first phase evaluated Original Design and Revision 01. The main difference between the two schemes was an outdoor corridor cutting through the site in Revision 01. This revision manifested a spatial design recommendation called “looking out of enclosure” that Cullen believed to be conducive for favorable dynamic vision (1961: 33). The second phase of the experiment evaluated Revision 01 and Revision 02, which was created considering the dynamic visual evaluation results of Revision 01. Revision 02 adjusted the planar proportions of the outdoor corridor so that pedestrians on the sidewalk to the south of the site could not have a through visual access into the open street space around the corner (Figure S9 in the Supplemental Material).
As research participants, 30 undergraduate architecture students were randomly assigned to three participant groups of 10 to collect simulation data about Original Design, Revision 01, and Revision 02 using Downtown Explorer. Each participant controlled a pedestrian avatar to take a free walk between an on-street parking space on Kemp Avenue and a public parking lot on Maple Street, without wandering away from the street block of the site. Therefore, there were 10 different simulated walks for each design scheme in evaluation. A vast majority of participants evaluating Revision 01 and 02 chose to traverse the project site through the outdoor corridor space during the simulation (9 out of 10 for Revision 01 and 8 out of 10 for Revision 02) (Figure 3). Throughout the experiment, all participants completed their walks independently and free of peer influence. No one was informed of any other’s simulation output. All data were gathered through an updated Downtown Explorer release with an enhanced capability for calculating and recording inferential measurements of ML, SDL-60, and SDL-120 in real time. The time interval for data collection was one second. Applying the RtDVE protocol, the author produced descriptive analysis accounts in the forms of Visible Volume Variance Analysis Charts and DVVI data.
Routes of all simulated walks for Original Design, Revision 01, and Revision 02 (author).
Results
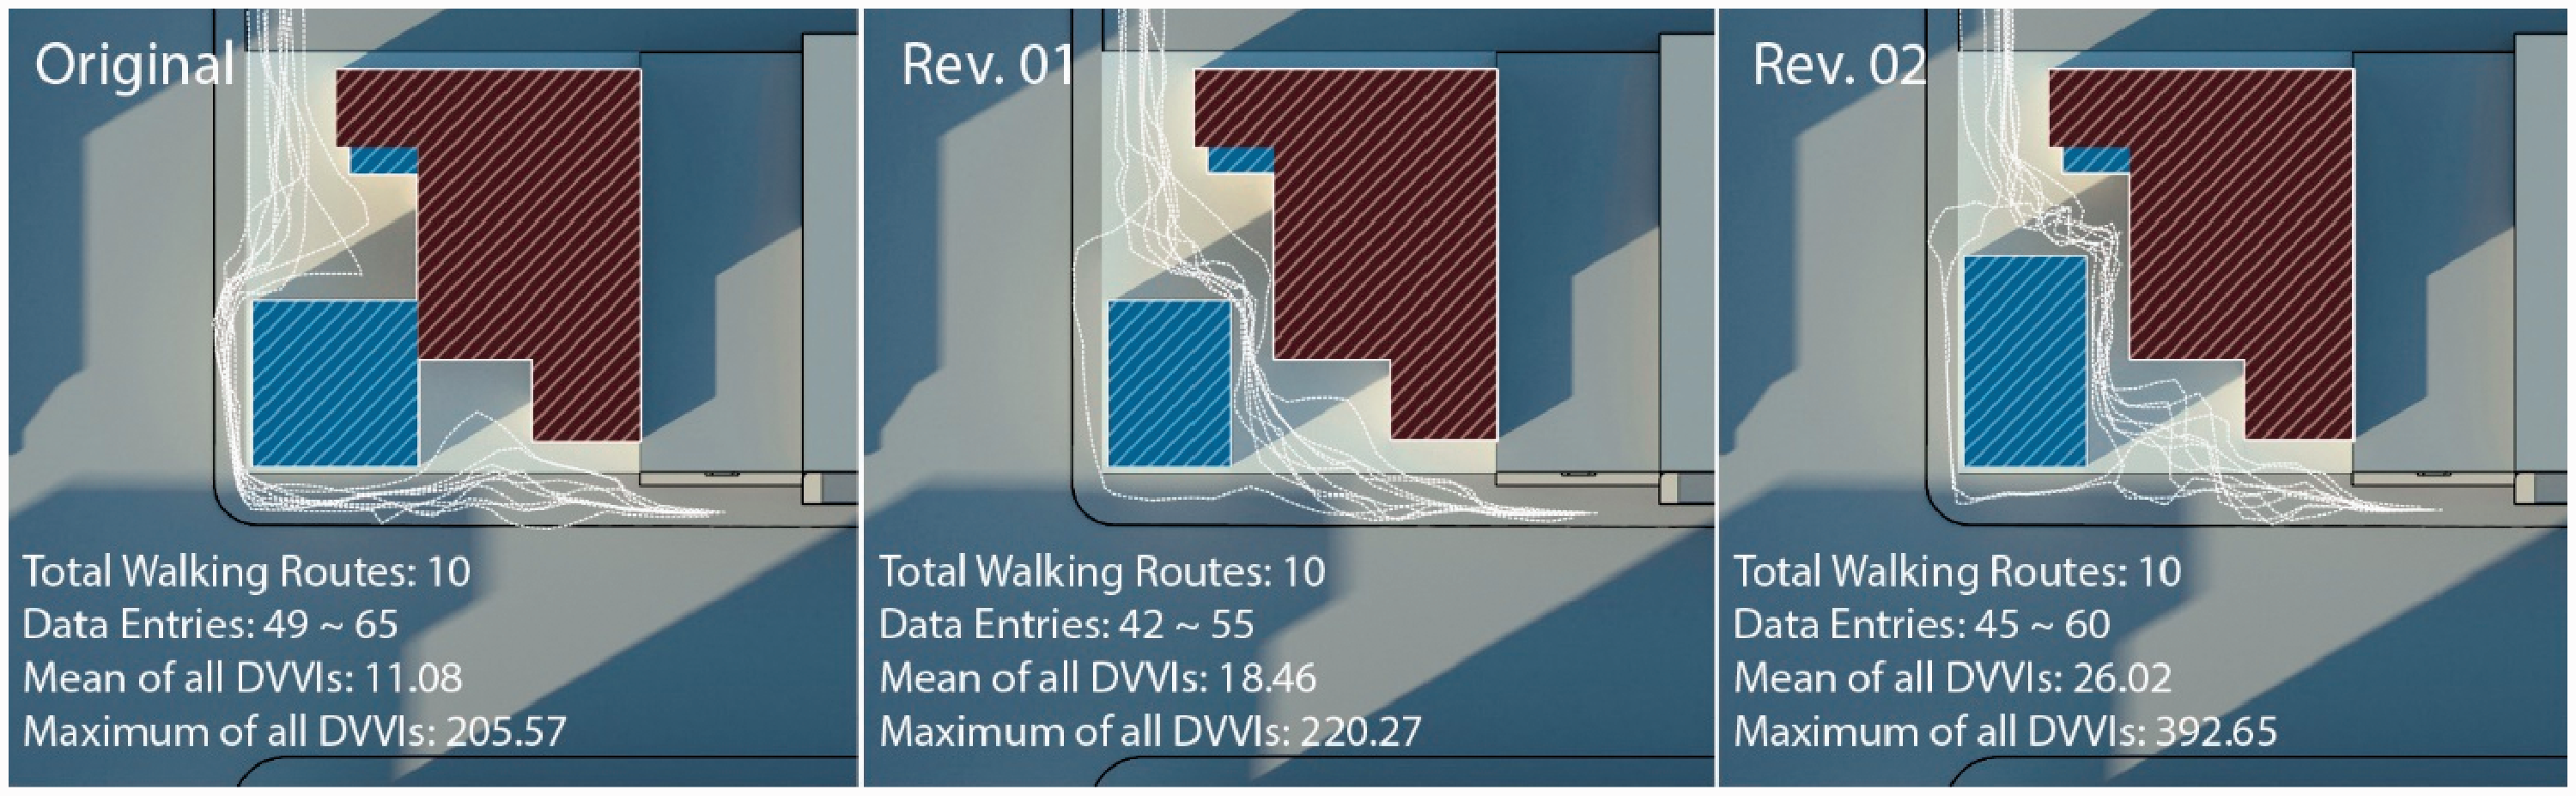
At the beginning of the experiment, the author compared Visible Volume Variance Analysis Charts generated for Original Design and Revision 01. Overlaid line graphs of ΔML, ΔSDL, or ΔO indicated that sequential views generated in the simulated walks regarding Revision 01 contained more intense fluctuations than those about Original Design (Figure S10 in the Supplemental Material), suggesting that Revision 01, which was inspired by Cullen’s urban design advice, could afford a greater rate of change in sequential views. Further examination divulged that visible volume diagrams were more likely to exhibit significant view-to-view adaptations, as evinced by drastic changes in both viewing orientations and visible volume shapes, for dynamic visual data concerning Revision 01 than for those about Original Design (Figure 4). A closer study of diverse walking routes and visible volume diagrams led to the proposal of Revision 02. It incorporated an elongated outdoor corridor without providing through visual access, which could arouse pedestrians’ curiosity when they approached the corridor. Their walks could hence become more exploratory and provoke dramatic changes in viewing orientations. The long corridor also introduced a few spatially and visually confining locations, further amplifying the contrast in visible volumes as pedestrians moved through it. Later in the experiment, a comparative study of Visible Volume Variance Analysis Charts confirmed that compared to Revision 01, the design scheme of Revision 02 did elicit more pronounced dynamic visual changes in simulated walks (Figure 4 and Figure S10 in the Supplemental Material). Alternatively speaking, pedestrians were more likely to experience swift and striking changes in visible volumes when encountering Revision 02 in a walking experience.
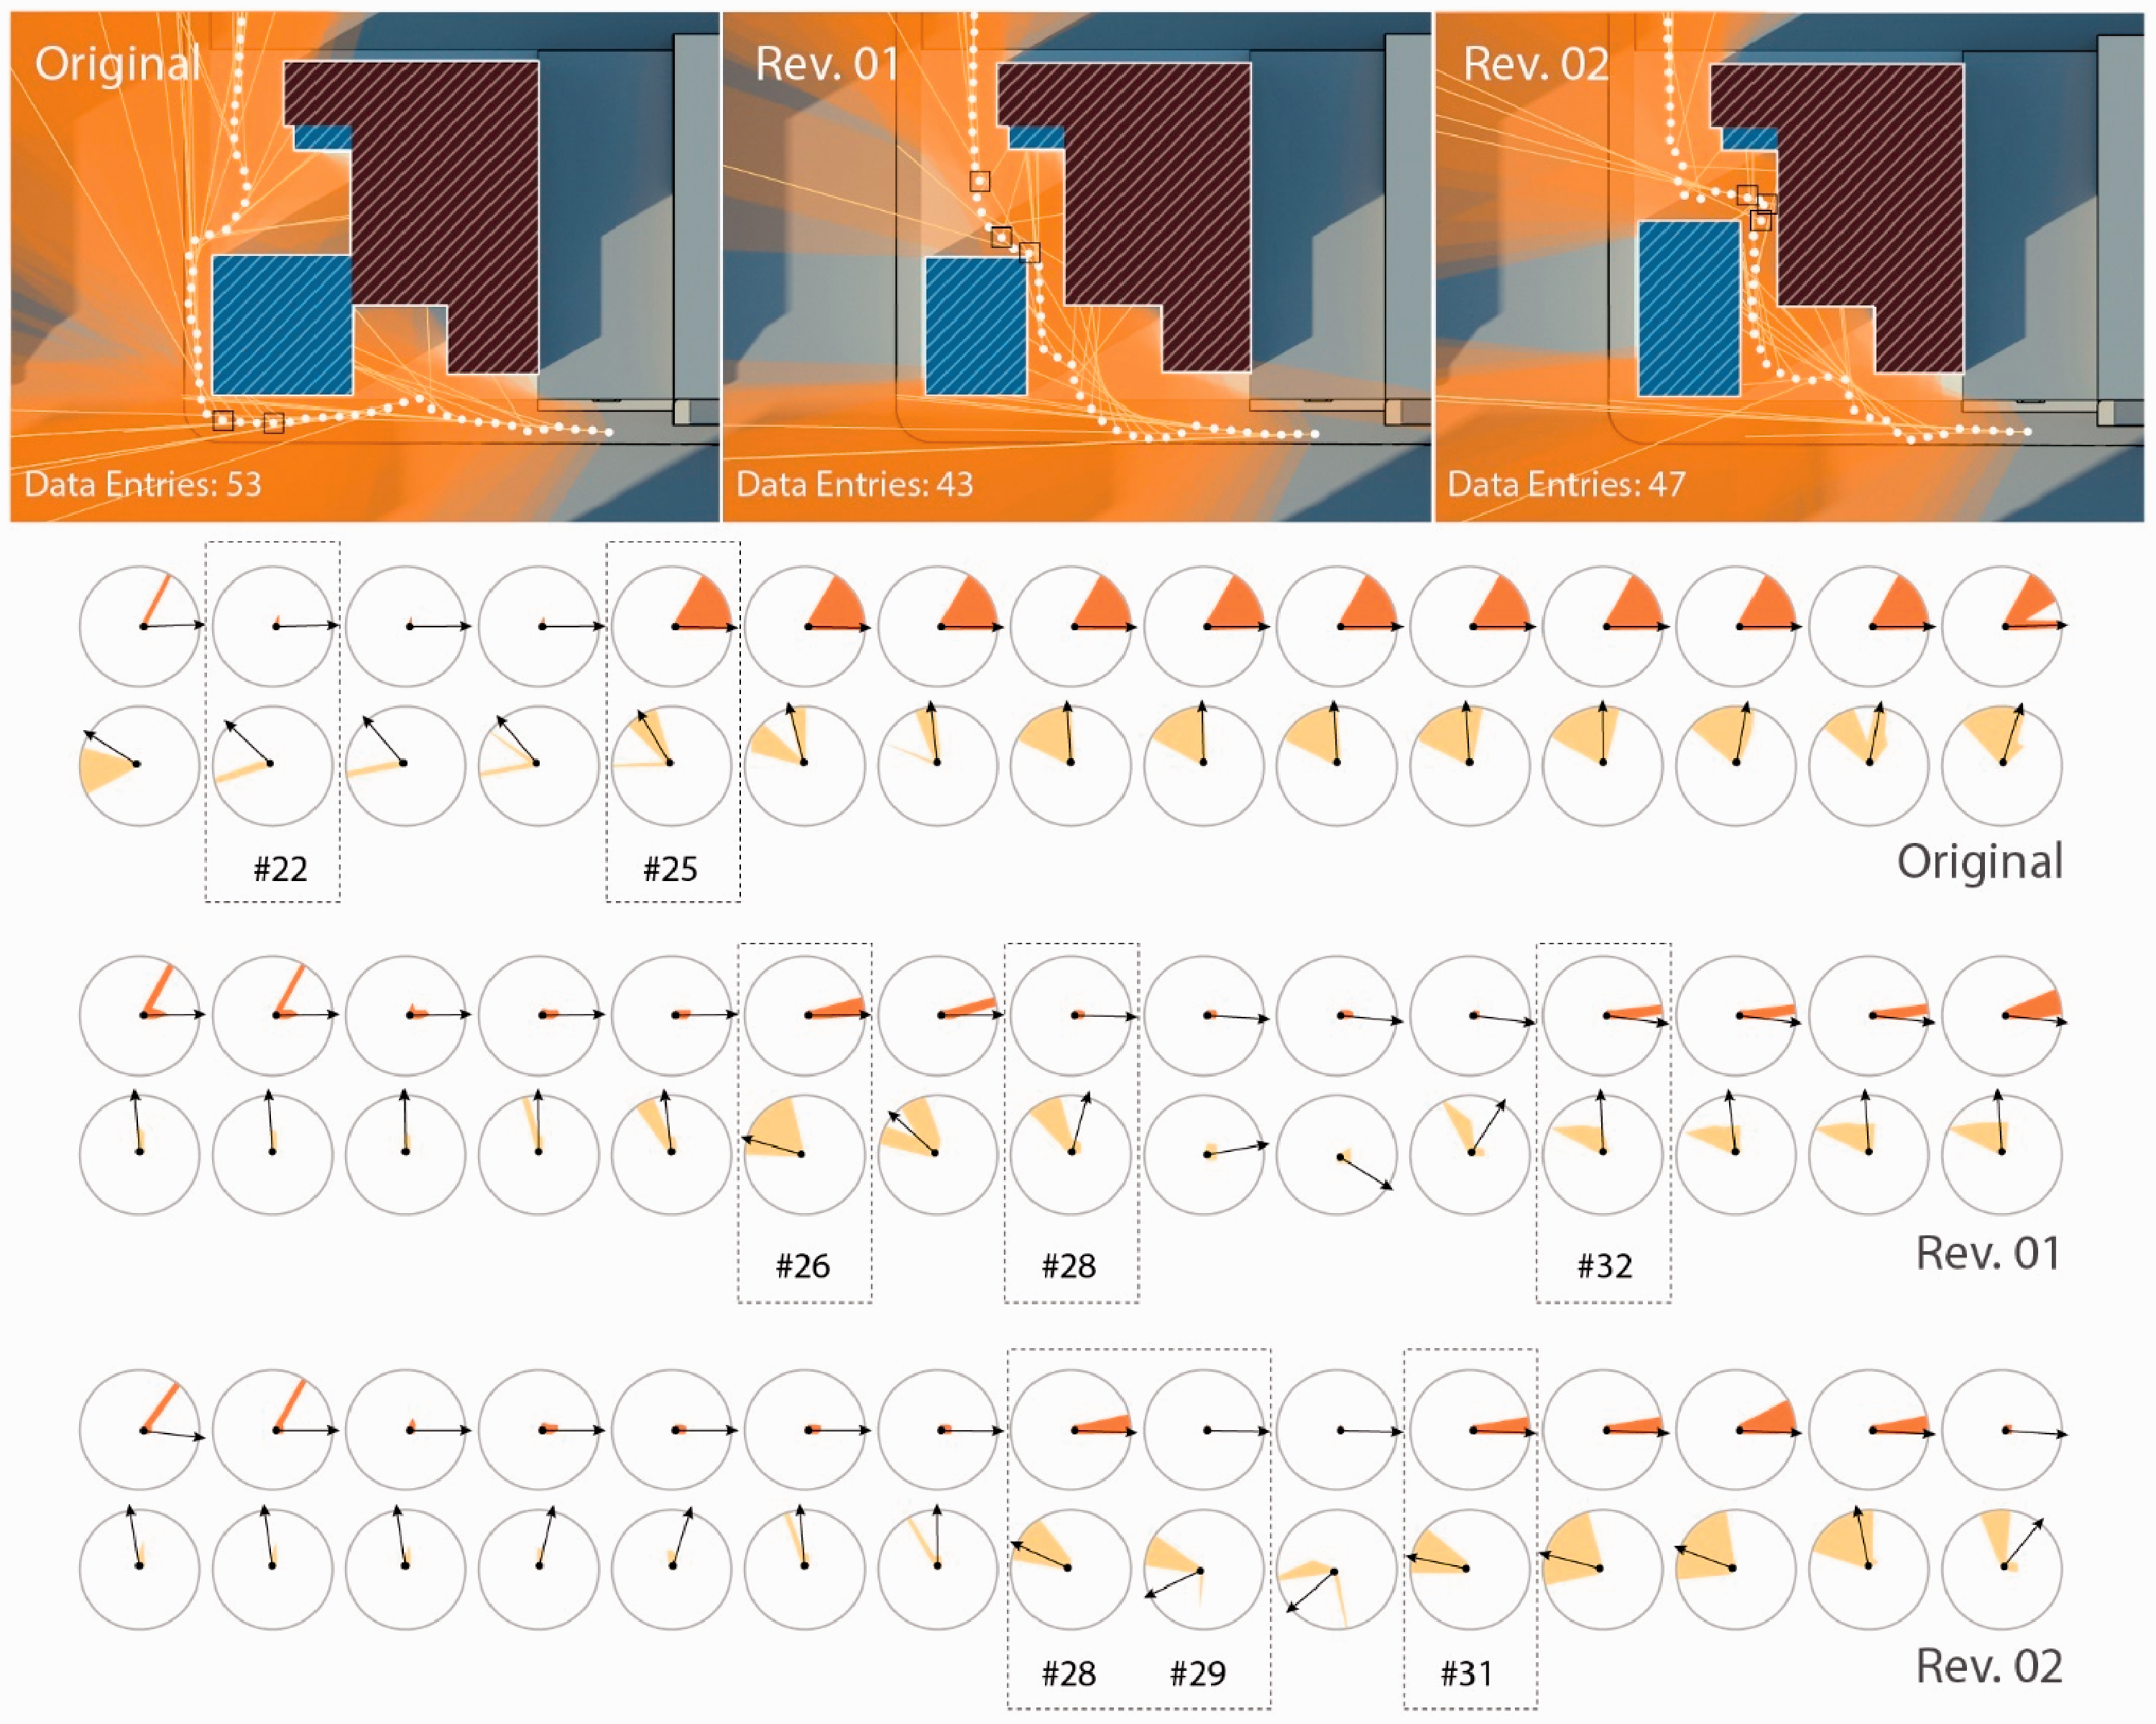
Site plans of three typical simulated walks regarding Original Design, Revision 01, and Revision 02 and a comparison of corresponding visible volume diagrams (author).
During the experiment, DVVI data about different simulated walks consistently exposed the distinction in Visible Volume Variance Analysis Charts. Overlaid DVVI dot plots presented a discernable pattern: from Original Design to Revision 01 and then to Revision 02, DVVI values appeared to be incrementally greater (Figure S11 in the Supplemental Material). Following F-tests and t-tests confirmed that means and maximums of DVVI values calculated for each simulated walk were significantly different across the evaluation groups of Original Design, Revision 01, and Revision 02 (Table 2). In agreement with the comparative analysis outcomes of Visible Volume Variance Analysis Charts, DVVI as a composite indicator summarizing ΔML, ΔSDL, or ΔO data revealed that the design schemes in evaluation had different dynamic visual implications.
F-test and t-test results for mean DVVI values and maximum DVVI values (author).
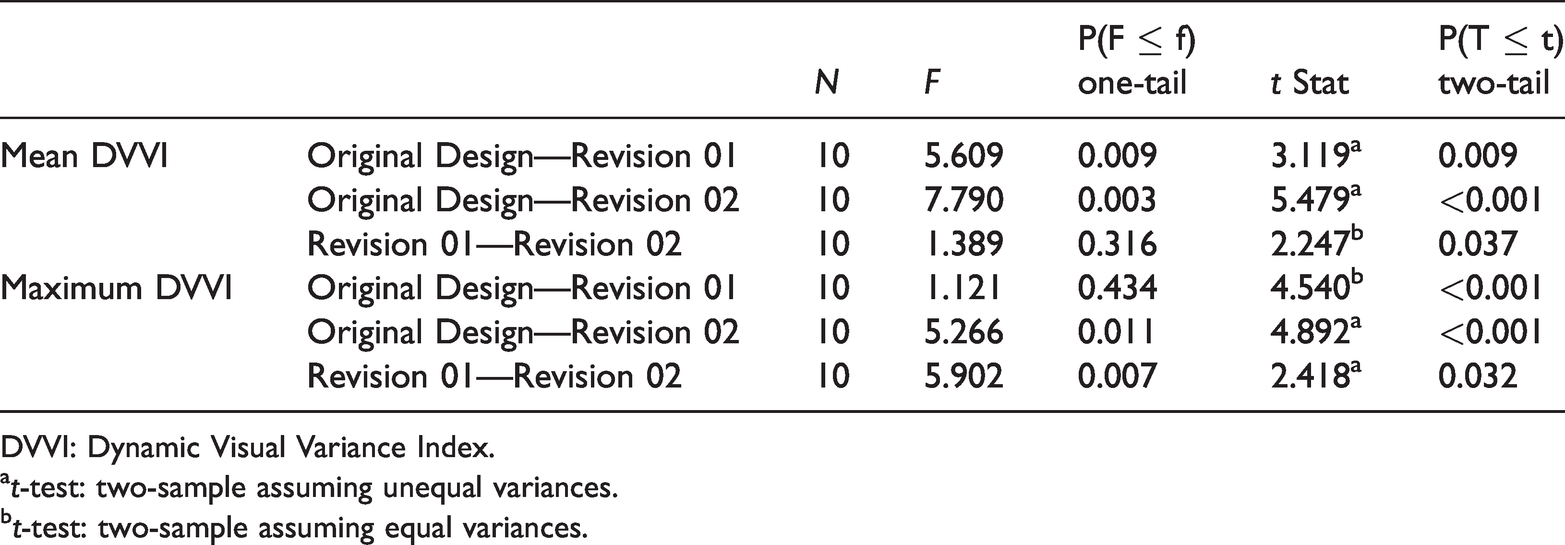
DVVI: Dynamic Visual Variance Index.
at-test: two-sample assuming unequal variances.
bt-test: two-sample assuming equal variances.
Discussion and conclusion
Practical and theoretical relevance
Leveraging on modern 3D game technologies, the RtDVE protocol represents a pioneering attempt to conduct real-time dynamic visual simulation and analysis. For environmental design researchers, the RtDVE protocol overcomes major methodological challenges. It offers many advantages, including high fidelity in simulation, efficient and reliable data collection, low logistic requirements, and flexibility in research utilization. The protocol’s standardized computational framework also improves overall research qualities by minimizing confounding subjective influences from researchers or participants (Bryman et al., 2008; Lincoln and Guba, 1985). For practicing architects or planners, the protocol offers a highly operable approach to fathom the complex temporal-spatial dynamics of visual forms perceived by pedestrians in the city. Applying the protocol requires minimal preparatory knowledge and skills for both investigators and participants. Therefore, RtDVE studies can effectively involve clients and end-users in the design process for assessing formal proposals from pedestrians’ point of view, which may promote an evaluation-in-design workflow that incorporates dynamic visual evaluation.
On a more theoretical level, the RtDVE protocol accommodates the complexity of humans’ dynamic visual relations with the environment and advocates a nonfragmental understanding. The protocol employs an immersive 3D game for simulation and data collection, emphasizing the ecological relationship between the designed environment and humans’ subjective agency whereby dynamic visual experiences arise. Existing visibility studies used predetermined walking routes (Fisher-Gewirtzman, 2018b; Fisher-Gewirtzman and Bruchi, 2018) or agent-based simulation methods (see Turner, 2003; Turner and Penn, 2002). The RtDVE protocol, on the other hand, foregrounds the dynamic “entanglement” between human subjectivity and objective environments: an autonomous pedestrian’s movement and viewing orientations result in a contingent cluster of visible environmental elements, which in turn affect the person’s walking and seeing behaviors.
Historically, many environmental researchers concerned with visual and spatial experiences acknowledged the ecological interplay between the objective and subjective factors, showing an evident influence of James Gibson’s ecological psychology (1966; Gibson, 1979). As Philip Thiel incisively illustrated, “Architecture may well be ‘frozen music’ like a phonograph record; but man is the pickup whose movement realizes the experience” (1961: 33).
This position has been endorsed by some visibility researchers who tried to “regard the environment as the provider of possibilities rather than as a place to be rationalized” (Turner and Penn, 2002: 473) and by supporters of user-centered design (e.g. Cupers, 2013; Hill, 1998, 2003). In a broader research landscape, there has been an ongoing theoretical migration away from conventional “subjectivist” or “objectivist” research frameworks in favor of holistic, situated understandings (see Case and Jawitz, 2004; Norman, 1993; Rappaport, 1998; Richardson et al., 2008; Schliemann, 1998). The RtDVE protocol is in alliance with these influential theoretical movements.
Future research directions
Kevin Lynch and his associates aspire to the “true city design” that deals “directly with the ongoing sensed environment of the city, in collaboration with the people who sense it” (Lynch et al., 1990: 254). However, researchers have been struggling to discover effective methods for describing and evaluating the spatial environment “from the point of view of individuals, as they perceive it, interact with it, and move through it” (Turner et al., 2001: 103). The RtDVE protocol embodies an endeavor toward such an aspiration. Cognizant of the protocol’s advantages and limitations, the author envisions several further improvements.
As a pivotal component of RtDVE, Downtown Explorer is crucial to simulate the ecological interactions between humans and the environment. It should possess a greater representational fidelity of the game world to optimize immersion and improve research participants’ sense of presence during gameplay. Defined as “the subjective experience of being in one place or environment, even when one is physically situated in another” (Witmer and Singer, 1998: 225), presence in 3D simulation can prompt research participants to carry out close-to-reality behaviors in response to digital environments, which would translate to more valid research data. In the game industry, immersion refers to the quality that would lead to the feeling of being there or presence (Lehrer, 2016). Considering Unreal Engine’s versatility, expandability, and fast assimilation of state-of-art 3D technologies, the author supposes coming releases of Downtown Explorer will integrate ray tracing photorealism, laser-scanned 3D assets, and stereo audio for acoustic simulation. Gaming platforms with more advanced image projection and a higher level of interactivity and control also deliver better immersion. The current desktop version of Downtown Explorer adopts a standard 16:9 Full High Definition display (1920 × 1080), which produces truncated FOV. Its use of keyboard-mouse input may incur abrupt or uncanny head and body movements in simulation. Ultrawide curved screen in Ultra High Definition or Cave Automatic Virtual Environment (see Girbacia et al., 2012) can alleviate the FOV truncation . For optimal immersion and presence, Downtown Explore should run on a Virtual Reality (VR) platform with a headset that can project stereoscopic views (e.g. Motamedi et al., 2017). The VR platform may include a treadmill for intuitive movement inputs that could induce research participants to exhibit more natural visual interactions with their immediate 3D environment.
The RtDVE protocol’s data collection and analysis procedures also expect future enhancements. Ideally, numerical data collection should include more LOS evenly distributed within the 120-degree visual cone, producing more comprehensive LOS data for calculating ΔML, ΔO, ΔSDL
With enhanced 3D simulation means and more effective dynamic visual data analysis techniques, the author expects more diverse RtDVE studies to unveil the obscure person-environment mutuality. Some empirical studies may control the subjective factors and focus on the effect of designed spaces; others may compare how different user groups respond to the same spatial design. There should also be a mixed-method research design that juxtaposes the quantification of view-to-view transitions and the qualitative interpretation about simulated walking experiences to establish a verifiable connection between dynamic vision and aesthetic perception. These future RtDVE studies will encourage evidence-based, user-centered design practices for inducing delightful dynamic visual experiences through the participation of end-users in the design process. This prospect will promote a decade-long venture of participatory design in Europa and America (Bell and Wakeford, 2008; Dell'Era and Landoni, 2014; Sanoff, 1978, 2000; Sanoff and Toker, 2003), which recognizes the creative role of users in the design process as Hill has clearly stated, The architect and user both produce architecture, the former by design, the latter by inhabitation. As architecture is designed and experienced, the user has as creative a role as the architect. (1998: 140)
Supplemental Material
sj-pdf-1-epb-10.1177_23998083211037348 - Supplemental material for Evaluating dynamic visual experience of designed environments: A real-time 3D simulation method utilizing game technologies
Supplemental material, sj-pdf-1-epb-10.1177_23998083211037348 for Evaluating dynamic visual experience of designed environments: A real-time 3D simulation method utilizing game technologies by Fang Xu in EPB: Urban Analytics and City Science
Footnotes
Acknowledgment
The author would like to thank Sarah Caron, the mayor of Watertown, South Dakota, for her support of the research.
Declaration of conflicting interests
The author(s) declared no potential conflicts of interest with respect to the research, authorship, and/or publication of this article.
Funding
The author(s) received no financial support for the research, authorship, and/or publication of this article.
Supplemental material
Supplemental material for this article is available online.
Notes
References
Supplementary Material
Please find the following supplemental material available below.
For Open Access articles published under a Creative Commons License, all supplemental material carries the same license as the article it is associated with.
For non-Open Access articles published, all supplemental material carries a non-exclusive license, and permission requests for re-use of supplemental material or any part of supplemental material shall be sent directly to the copyright owner as specified in the copyright notice associated with the article.