
Abstract
The significant advances made in interpreting satellite imagery to monitor urban expansion and informal settlements has made important contributions to urban studies and planning. This paper focuses on the under-examined dimensions of how improvements to classifications of urban areas are not only a technical challenge but lie at the society/technology nexus. We examine why three different research groups produced different urban land use classifications of Ho Chi Minh City, Vietnam from remote sensing images. We trace how a confluence of factors including how the technology intersects with field conditions, researcher assumptions and discretionary choices, and institutional norms and agendas shaped the differences in their results. The different spatial facts they produced raises the issue of adapting algorithms for not only technical accuracy but appropriate social use. In the case of detecting informal settlements, our study finds that groundtruthing through fieldwork or collaborative partnerships is needed to not systematically overlook vulnerable populations and misinform urban planning decisions.
Introduction
During our historic global urbanization period, cities are rapidly re-developing their land and expanding the extent of their periphery. City governments need data about the location of these developments and settlements in order to make policies and plans for safe, productive, and livable cities. The location of these land use conversions, the quality of their construction and infrastructure, and their accessibility to employment and public services have profound and often differentiated impact on the welfare of urban residents. However, local governments find it challenging to keep pace with proliferating land developments, particularly the irregular and undocumented ones that remain officially unrecognized (Bertaud, 2018; Carr-Hill, 2013; Lamson-Hall et al., 2019; Miller and Small, 2003). As a result, people in informal settlements, who are often living in more hazardous environments and in greatest need of public services, are systematically excluded from a “right to the city” even while their labor fuels its economy (LeFebvre, 1996 [1968]). The recognition of marginalized populations is key towards building a more just city. 1
Meanwhile, as technology has advanced rapidly in many realms including the urban, many have hoped that there could be a new “smart city” that could also be more democratic and inclusive by harnessing technology to produce a more efficient, capable, and politics-free urban governance. Big data and automation could potentially surmount the limitations of collecting administrative data manually, which is costly, quickly outdated, and usually do not adequately capture informal settlements. For decades, many urban researchers and policymakers have been developing the potential of using satellite imagery to assist with the information gap about new urban settlements since processing remotely sensed imagery can provide a consistent, reliable, and low-cost method for tracking urban expansion at a fine spatial resolution and with frequent updates (Friesen et al., 2018; Hofmann et al., 2015; Jochem et al., 2020; Kuffer et al., 2018; Schneider et al., 2005; Taubenböck et al., 2012; Verma et al., 2019).
However, what is conceptually a simple task—identifying the footprint of physical buildings—can be complex to implement as it involves socio-political as well as physical phenomenology. A recent example is the debate between two research teams with different definitions of “urban population” that produced dramatically different estimates of global urban population, with one group estimating 52% of the world population (Angel et al., 2018) while the other estimated 84% (Scruggs, 2018). Even not considering social constructions that satellites cannot detect such as jurisdictional boundaries, labor categories, etc., at the core of this debate are the differences in how we derive “urban” data from images of building materials, settlement patterns, and density levels. In operationalizing definitions and models, researchers must necessarily make tradeoffs between precision, generalizability, and realism in how to encode and analyze a phenomenon (Foo et al., 2015). Making good choices therefore requires the researcher to possess a robust theory about the salient contours of the phenomenon.
In social theory literatures, “urban” is not just a land use type but a distinct set of socio-political relationships which include dynamics such as entitlements to its public services, police enforcement, particular economic sector opportunities, and political representation that are associated with those who are officially in the city (Bourdieu, 2005; Castells, 1977; Harvey, 1972). Therefore, in the midst of global urbanization, Lefebvre’s “right to the city” has become a rallying cry by the marginalized to have access to the benefits of being urban (Fernandes, 2007; LeFebvre, 1992). These marginalized can include people who are physically present in the official city jurisdiction but remain unrecognized (Hull, 2008; Subbaraman et al., 2012). From this viewpoint, while urban space is not merely square meters of land area, this measurement is one of the key ways that bureaucracies encode and operationalize these entitlements and liabilities through land surveys of parcel boundaries of property ownership, land values for tax assessment, and land uses for city planning (Scott, 1998; Valverde, 2011). This defining of urban is where land use researchers using remote sensing technology to map urban expansion interface with social theories and critiques. The definitions and parameters they use to detect “urban” land use play a crucial part in determining who is included and served by urban governance (Carp, 2008).
In the realm of rapid urbanization data, a perennial blindspot has been the under-representation of informal settlements even though these urban migrants have been the major source of historic urban population growth. Due to difficulty defining informal settlements and collecting data about their residents, the usual sources of urban population data such as decennial censuses often lack information or undercount the size of these urban settlements (Hofmann et al., 2015). If they are not counted and mapped in bureaucracy, then they do not exist in the eyes of the state leading to many deleterious distributional consequences (Home, 2004; Scott, 1998; Subbaraman et al., 2012).
Furthermore, while deploying algorithms in urban research and governance holds great promise and new possibilities (Beck et al., 2020), there has been a troubling absence of critical reflexivity about our assumptions that we embed into our data streams and computer codes. These assumptions impact which people are detected and counted, which has recently invoked an emerging literature about algorithmic biases in various urban policy realms (racially biased criminal sentencing, information search, public health, and financial access) as we try to deploy new technologies to fill our information gaps (Eubanks, 2018; Israni, 2018; Noble, 2018; Pasquale, 2015). Distinct from the ethics literature about privacy and surveillance (Deibert et al., 2011; Leibold, 2020), the algorithmic bias literature warns that our technical procedures of data collection and processing can be carried out with insufficient knowledge about socio-political inequalities but are nevertheless rapidly generated and deployed with the potential to exacerbate existing inequalities, rather than generating a smart city (Benjamin, 2019; D’Ignazio and Klein, 2020; Kim, 2018; Kitchin, 2014; Kummitha et al., 2017; Shelton et al., 2015).
Our current turn to smart city technology is reminiscent of the postwar international development project hope that we could engineer our way out of the global poverty problem, which was subsequently followed by a major counter-movement towards participatory planning in order to overcome the disastrous mistaken assumptions of top-down governance (Carp, 2008; Finsterbusch and Van Wicklin, 1987; Glass, 1979). Accordingly, participatory grassroots mapping has been a counter movement to professionalized and distant mapping which has the potential benefits of correcting assumptions, contextualizing data to local realities, as well as increasing civic engagement. Participatory mapping projects have also been harnessing newer technologies to empower local communities to map themselves (Dennis, 2006; Elwood, 2006; Falco et al., 2019; Ghose and Elwood, 2003; Wridt, 2010).
However, these two literatures of top-down remote sensing data models and grassroots participatory field data projects have very little intersection. Clearly there could be advantages if we could find a way to integrate the advantages of both (Falco et al., 2019; Miller and Small, 2003). Remote sensing data can cover much larger land areas, provide a comprehensive system view of inter-relationships, and be more regularly updated whereas including the participation of marginalized populations could help improve data salience and quality and guard against disenfranchisement.
Then, a key question is how to integrate our newer technologies and grassroots society in the production of urban data so that the measures produced are inclusive and more accurate. Given the dearth of literature at the society technology nexus in the urban morphology scholarship, this paper aims to identify and discuss key points of professional discretion exercised when creating urban data about rapid urban expansion through remote-sensing images that could be improved with on-the-ground input.
The next section reviews the issues identified in the remote sensing literature about detecting urban expansion in the Global South. “
Using remote sensing imagery to track urban expansion
New technological approaches to generate better urban data and metrics have great potential and are supported by the international development institutions. The urbanization agenda framed by the United Nations Sustainable Development Goal 11, to “Make cities and human settlements inclusive, safe, resilient and sustainable” calls for monitoring Indicator 11.1.1, the “proportion of urban population living in slums, informal settlements or inadequate housing.”
Researchers have developed remote sensing imagery techniques to capture changes in urban land use and measure urban expansion, going back to the 1980s (Jensen and Toll, 1982; Li et al., 2017; Mas, 1999; Ridd and Liu, 1998; Schneider et al., 2005; Zhang et al., 2002; Kim et al., 2004). A number of methods and techniques have been developed to classify urban land uses using remote sensing imagery such as image differencing (Jensen and Toll, 1982; Ridd and Liu, 1998); image ratioing (Howarth and Boasson, 1983); image regression (Ridd and Liu, 1998); and principal component analysis (Li and Yeh, 1998) among others. In addition to overall urbanization, substantial research advances have been made to automate the detection of different urban land uses areas such as roads and open spaces, as well as data about the area, height, and density of built structures (Pesaresi et al., 2013).
Measures of urban expansions based on satellite imagery can be used for a variety of purposes, including planning where demand for urban infrastructure (roads, water, sanitation) and services (school, health systems, parks) should be prioritized. Providing measures of urban expansion is particularly important in countries in the Global South that are experiencing rapid urban population growth and where administrative surveys are often limited in frequency and accuracy. At the same time, producing accurate measures of urban expansion in the Global South using remote sensing imagery involves some distinct, known challenges, including accurately accounting for informal settlements (Barros Filho and Sobreira, 2005; Friesen et al., 2018; Graesser et al., 2012; Hofmann et al., 2008, 2015; Jochem et al., 2020; Kit et al., 2012; Miller and Small, 2003; Owen and Wong, 2013; Rhinane et al., 2011; Sethi et al., 2015; Taubenböck and Kraff, 2014; Thomson and Hardin, 2000). Hofman (2001) in an article categorizing land uses in Cape Town, South Africa discusses issues with misclassifications that require further ground-truthing or images of higher resolution, pointing out to informal settlements with irregular forms of urban development in particular.
The definition of informal settlements is multi-valent and remote sensing imagery cannot directly capture all of the five dimensions included in the UN’s official definition (Kohli et al, 2012; UN, 2010). For example, one dimension of informality is a legal one, based on the lack of land title and permitting rather than any physical conditions. Some low-quality construction settlements could possess security of tenure if there were a large-scale titling program, although this is unusual and with time titled homes may lead to better construction quality (Field, 2005). Conversely, while some settlements may have the physical signature of formal buildings with regular shapes and street patterns, they may have been built without permits or do not conform to building codes (Kim, 2004, Kim, 2008). As a result, studies detecting low construction quality are underestimating the share of the built environment with informal tenure. However, one could argue that low construction quality is highly correlated with insecure legal tenure, and so those that are detected have a high accuracy rate. As a result, the term “informality” is often used synonymously with a sub-standard physical building and living environment. This study follows this morphology-based definition of informal settlements, acknowledging its limits, because our focus is on ensuring that all low-quality construction settlements are included in measures of urban expansion.
Remote sensing researchers translate informality as a particular spatial pattern of settlements characterized by areas with small and highly dense dwellings occurring in irregular patterns rather than along the regular grids of communities with pre-planned roads. Early papers relied on relatively low-resolution pictures (30 m to 250 m) while more recent research takes advantage of high (5 to 10 m) and very high (.5 to 2.5 m) resolution images. Besides improvements in image quality, methods and techniques to classify urban land uses from remote sensing imagery have made substantial advances. Earlier studies used spectral analysis because informal buildings often use building materials with lower reflective values than materials such as asphalt and concrete. Another strategy is to deploy texture analysis of land areas to focus on detecting irregular residential spatial patterns. Taking advantage of the smaller pixel sizes of more recent satellite images, an object-based approach re-constitutes pixels into meaningful clusters and objects of urban phenomenon, such as roads and buildings. Many studies use a combination of these approaches to leverage the different kinds of information. Many studies report accuracy above 80%, meeting the threshold suggested by the International Expert Working Group on Slum Mapping (Sliuzas et al., 2008).
One observation from the review of the literature on identifying informal settlements using remote sensing imagery that merits emphasis is that researchers train algorithms on sites pre-determined as slums, utilizing the particular building typologies and patterns of a particular city (i.e. smaller red roofs in Rio, limited open space in Hyderabad, etc.). In other words, algorithms need to be adapted to detect informal construction practices in different contexts. Each model eventually works well for what it has been trained but this also means that the urban region must have large areas exhibiting such patterns for it to have high accuracy. Conversely, when informal shelters are situated in ways that deviate into more dispersed and varied patterns, the error rates increase. The need for large regular patterns of irregularity implies that larger cities with larger, homogeneous squatter settlements lend themselves well to satellite imagery detection. More isolated squatter households and smaller groupings will not be as well identified unless training information is available for all types. Friesen et al. (2018) estimate that more than 80% of settlements identified in eight different cities in Africa, South America and Asia are smaller than 0.1 square kilometer and that these smaller slums are often relatively more neglected than the larger, more central ones. Thus, the error rate increases when trying to apply the same technique across very different geographies in order to produce urbanization classifications across the globe.
While some studies rely solely on unsupervised classification in which an algorithm alone is used to interpret the pixels of a satellite image, most studies also use significant human supervision to further calibrate results because threshold values are not universal across geographies. While this is often done through human interpretation of imagery, another approach is to use fieldwork to groundtruth models. For example, to be able to detect informal settlements on the periphery of Ho Chi Minh City (HCMC), Vietnam (Kim et al., 2004) found that the spectral signature of informal dwellings made of plant materials could be similar to its undeveloped rural landscapes. However, within a band of lower spectral values, informal residences could still be detected because their patterns are more variegated than agriculture and natural environments. Therefore, by applying a high pass filter that enhanced edges and determining thresholds for high texture based on groundtruthing, the team found an accuracy of 95%.
Alternatively, Kohli et al. (2016) offer one of the few examples in the literature of incorporating public participation into remote sensing image interpretation. Working with a local NGO in Pune, India, to develop an appropriate classification algorithm, they found promising directions for identifying informal settlement using textural features but they also found only a 60% agreement between the classification provided by the NGO and that from the slum classification based on imagery. In other words, there was a wide gap between how researchers and residents conceived of informality and its spatial patterns.
Their finding as well as the large differences in results between urban expansion scholars mentioned at the outset of this article point to an under explored research agenda: how can our technical models better translate on-the-ground field knowledge into parameters of data characteristics. To further elucidate key discretionary points in this translational geospatial data process, we take advantage of the serendipitous occurrence of three different university-based research groups who interpreted satellite imagery of HCMC during the same time period but produced systematically different results.
Materials and methods: Comparing three urban land use classifications of HCMC
The World Bank’s (2015) report “East Asia’s Changing Urban Landscape: Measuring a decade of spatial growth” signaled the growing prominence of remote sensing data in international development policy circles and the move to provide open access to such data. In order to encourage more researchers to work in this area, the World Bank publicly released satellite imagery and sponsored competitions to use this data. It also commissioned researchers at the University of Madison, Wisconsin to analyze the images of five cities, including HCMC (World Bank, 2015). Meanwhile, researchers at New York University independently interpreted satellite imagery of 120 cities, including HCMC, to create a global atlas of urbanization (Angel et al., 2005). Concurrently, Kim et al. (2004) also commissioned and interpreted satellite imagery of HCMC of the 2000–2001 period.
This study leverages this fortuitous coincidence of three university-based research groups separately using similar satellite imagery of the same place and time period to produce land urbanization data for international development policy discussion, by studying the differences in their interpretations and to analyze the reasons for the difference. In other words, this paper aims to focus on the under-developed issues around how we translate computationally processed imagery into social phenomenon data. To get at this society-technology nexus, we obtained the results of all three research groups urbanizations interpretations of HCMC during 2000–2001, standardized the study area boundary, and adapted each study’s urban classification definitions to make them comparable. We next identified where the classifications were similar and different, traced the reasons for the differences in results to the data and methodological strategies each group deployed, and then discuss why each group made their different choices. We also analyze how the differences in detections might have important social welfare and policy implications by focusing on how each study mapped informal settlements.
HCMC is one of Asia’s rapidly growing cities with a population that grew by over 3.5 million people between 1990 and 2010 (Kim et al., 2004; World Bank, 2015). Like many Global South cities, lower income residents often resort to self-construction to house themselves in areas that are located close enough to access the urban economy but often lack access to urban infrastructure and services. A common problem is that informal settlements are often located in precarious places prone to flooding or displacement and so for urban planning and management, it is particularly important to know the extent and location of informal settlements.
We re-processed the final results of the three studies to distinguish not only where they identified urban land use, but whether they captured informal constructions in their measures of urban expansion (see Supplementary Material: Data and Methods for further details). For the purpose of our analysis, “informal” is defined as constructions of lower quality materials with a specific digital signature that can be identified using remote sensing technology and a mixed thresholding and texture approach (Kim et al., 2004). It is possible for some high-quality construction buildings to have informal tenure status, and as a result, we are underestimating the share of the built-up area that is informal. Nonetheless, we posit that the low construction quality buildings captured with this approach unambiguously constitutes informal urbanism of both building quality and legal tenure status.
Figure 1 shows the formal and informal urban expansion areas for 2001, relative to 1994, based on the Kim et al. (2004) method. As can be seen, the expansion of urbanization, which is a conversion from rural to urban land use, has been large and rapid. Much of the formal construction expanded to the northeast as well as along roads of the southern perimeter of the city and around the airport to the northwest of the city. Coded in yellow, extensive informal construction has occurred mostly in the periphery of the city and in a granular pattern of isolated small dwellings. The figure also reveals that if informal settlements are taken into account, the urban area covers a much wider area than previously considered. We calculate in Table 1 that while roughly 22% of the study area is urban by 2001, 12% of the total urban areas is of informal construction. As discussed in the literature review, it is in these less dense areas of the urban periphery where it is challenging to detect informal settlements. But not doing so would result in a significant undercount of settlements and populations which would be detrimental to effective urban policy and policymaking.
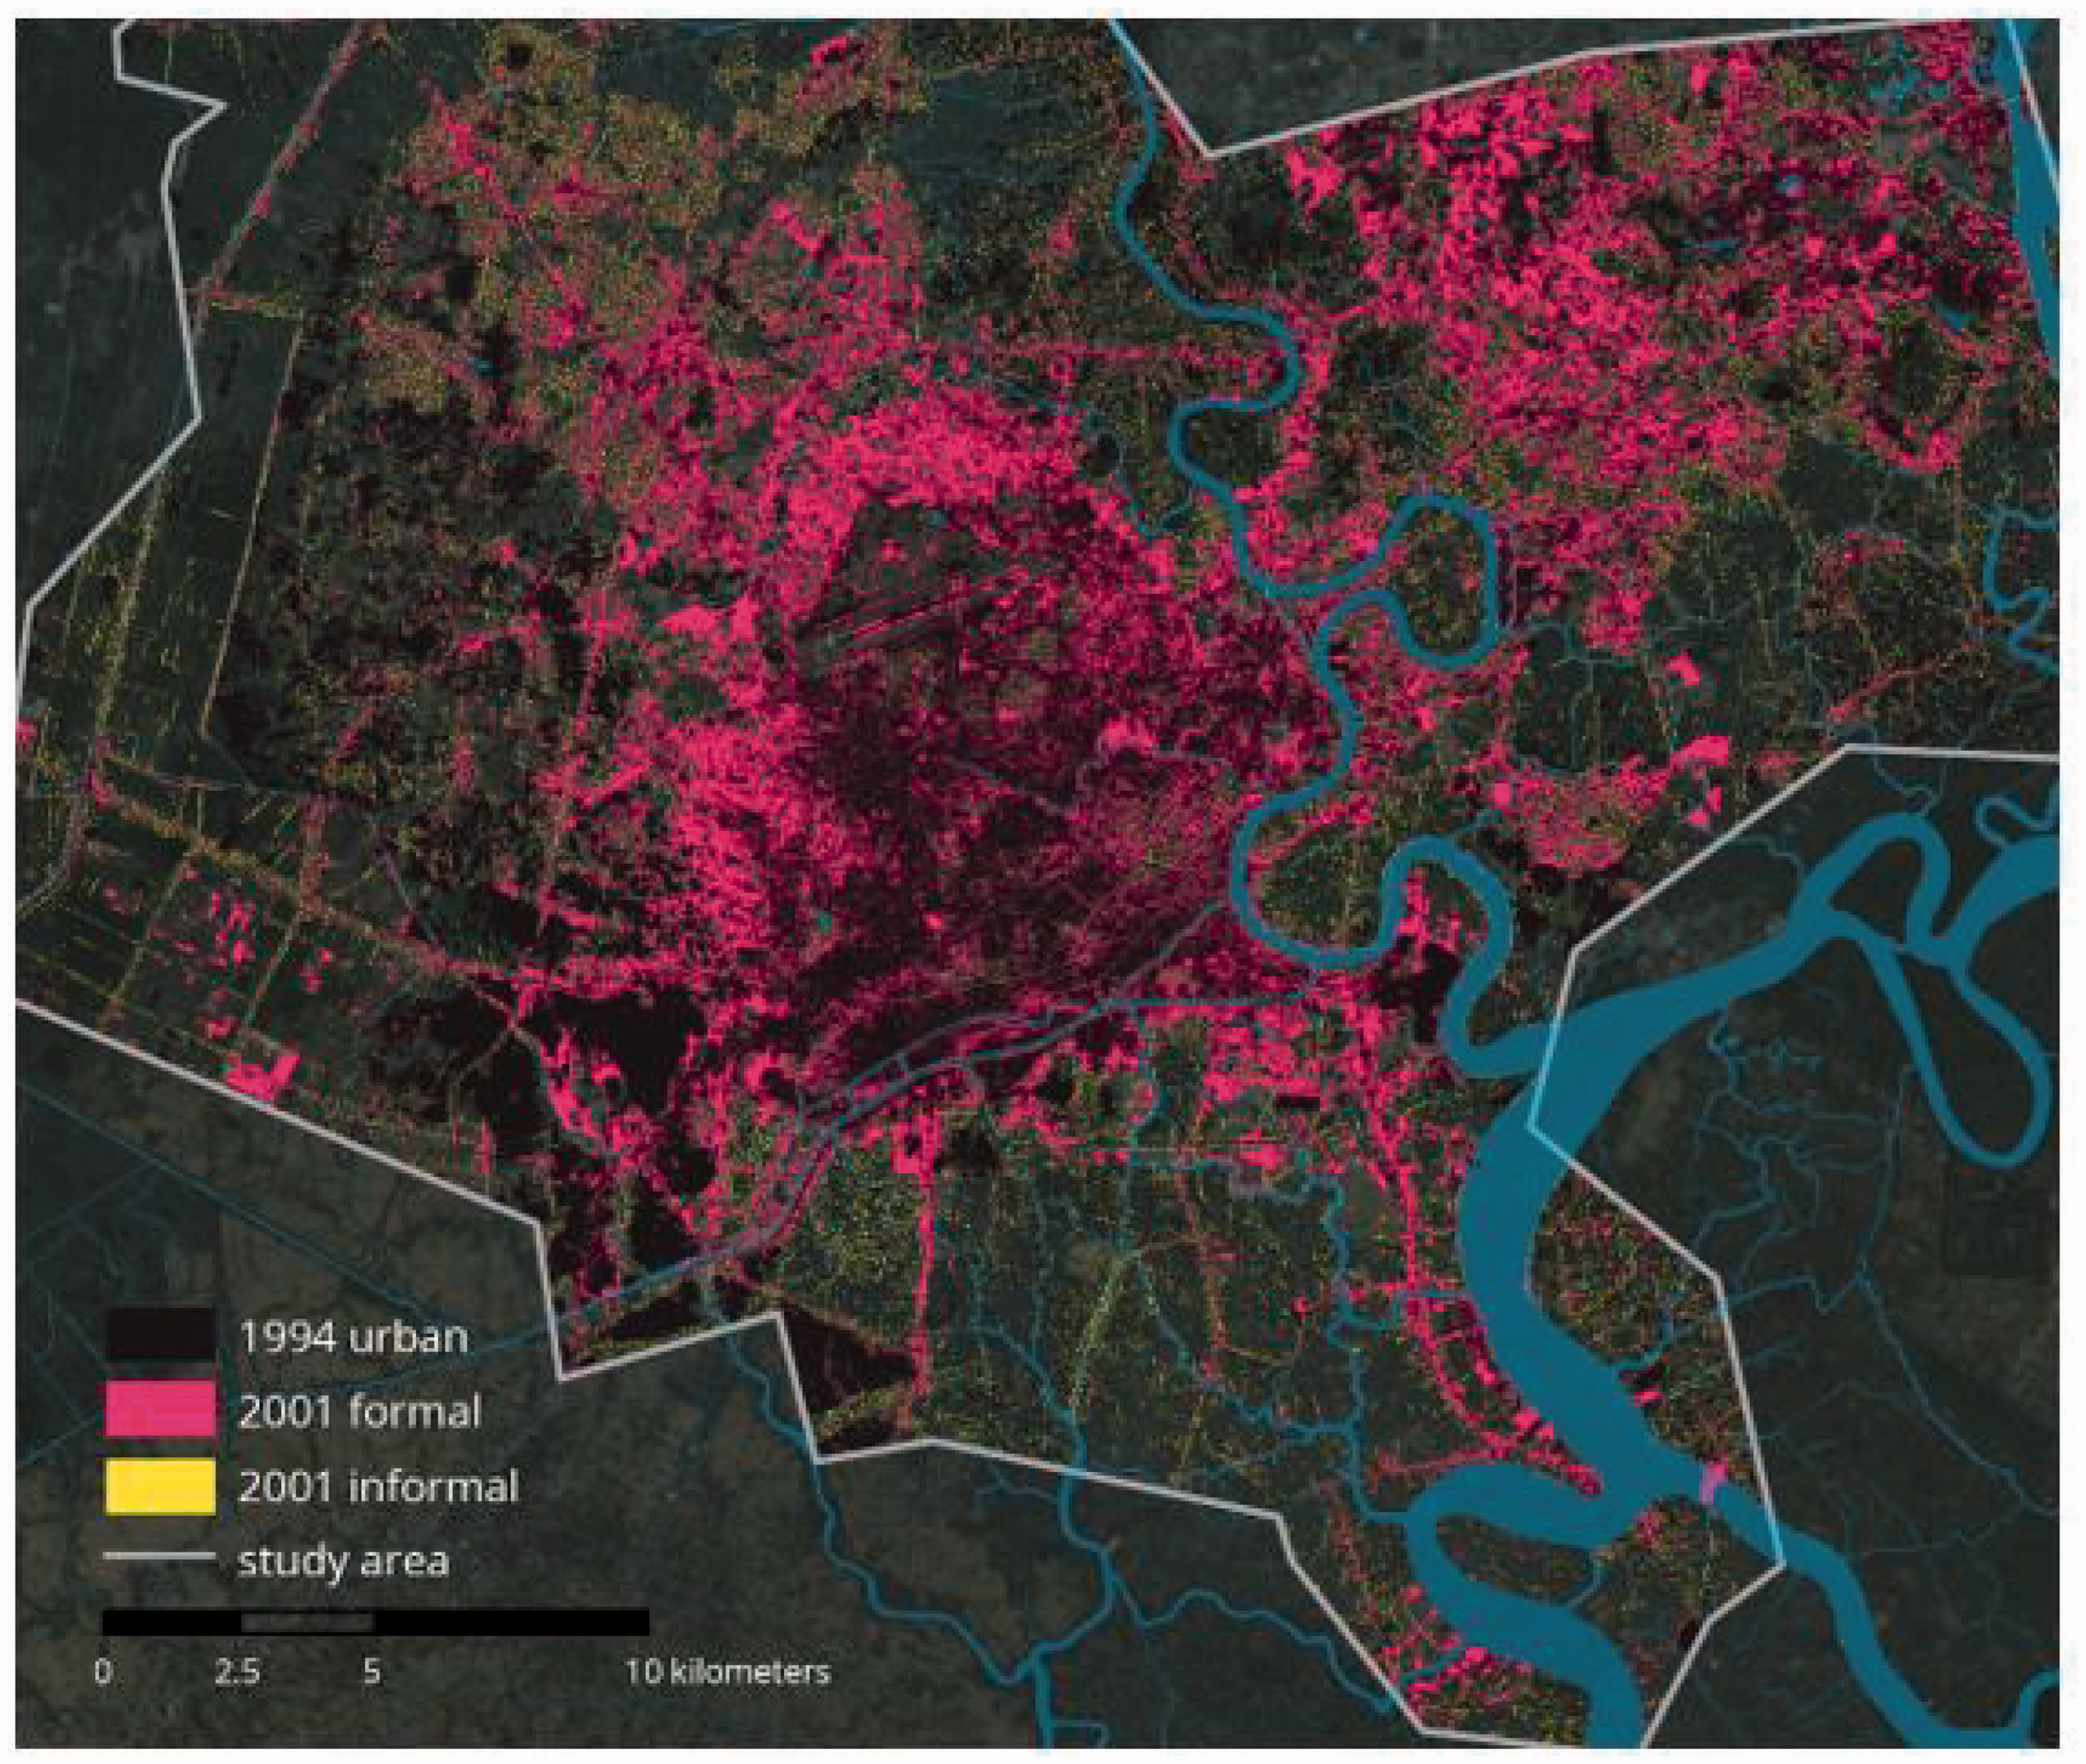
Formal and informal urban land use in Ho Chi Minh City, Vietnam, January 2001.
A comparison of urban land use classifications of Ho Chi Minh City, 2000–2001 by three different studies.

Table 1 and Figure 2 compare the classification results of the three studies of HCMC. As reported in Table 1, the three studies defined land use categories differently. The World Bank study has the most elaborate categories that not only identify a variety of land uses but also categories of densities and urban fabric. One might infer that their category of “discontinuous” patterns could be constituted by a high percentage of unplanned and informal development. In contrast, our study distinguishes between formal and informal land uses by the lower quality of construction materials used. Angel et al. provide the simplest classifications: “urban” and “non-urban.” To compare these studies, we first simplify Kim et al. (2004)’s and the World Bank’s various classifications of urban land use into a single urban category. This make it possible to visualize what each study counts as urban and not urban (Figure 2).
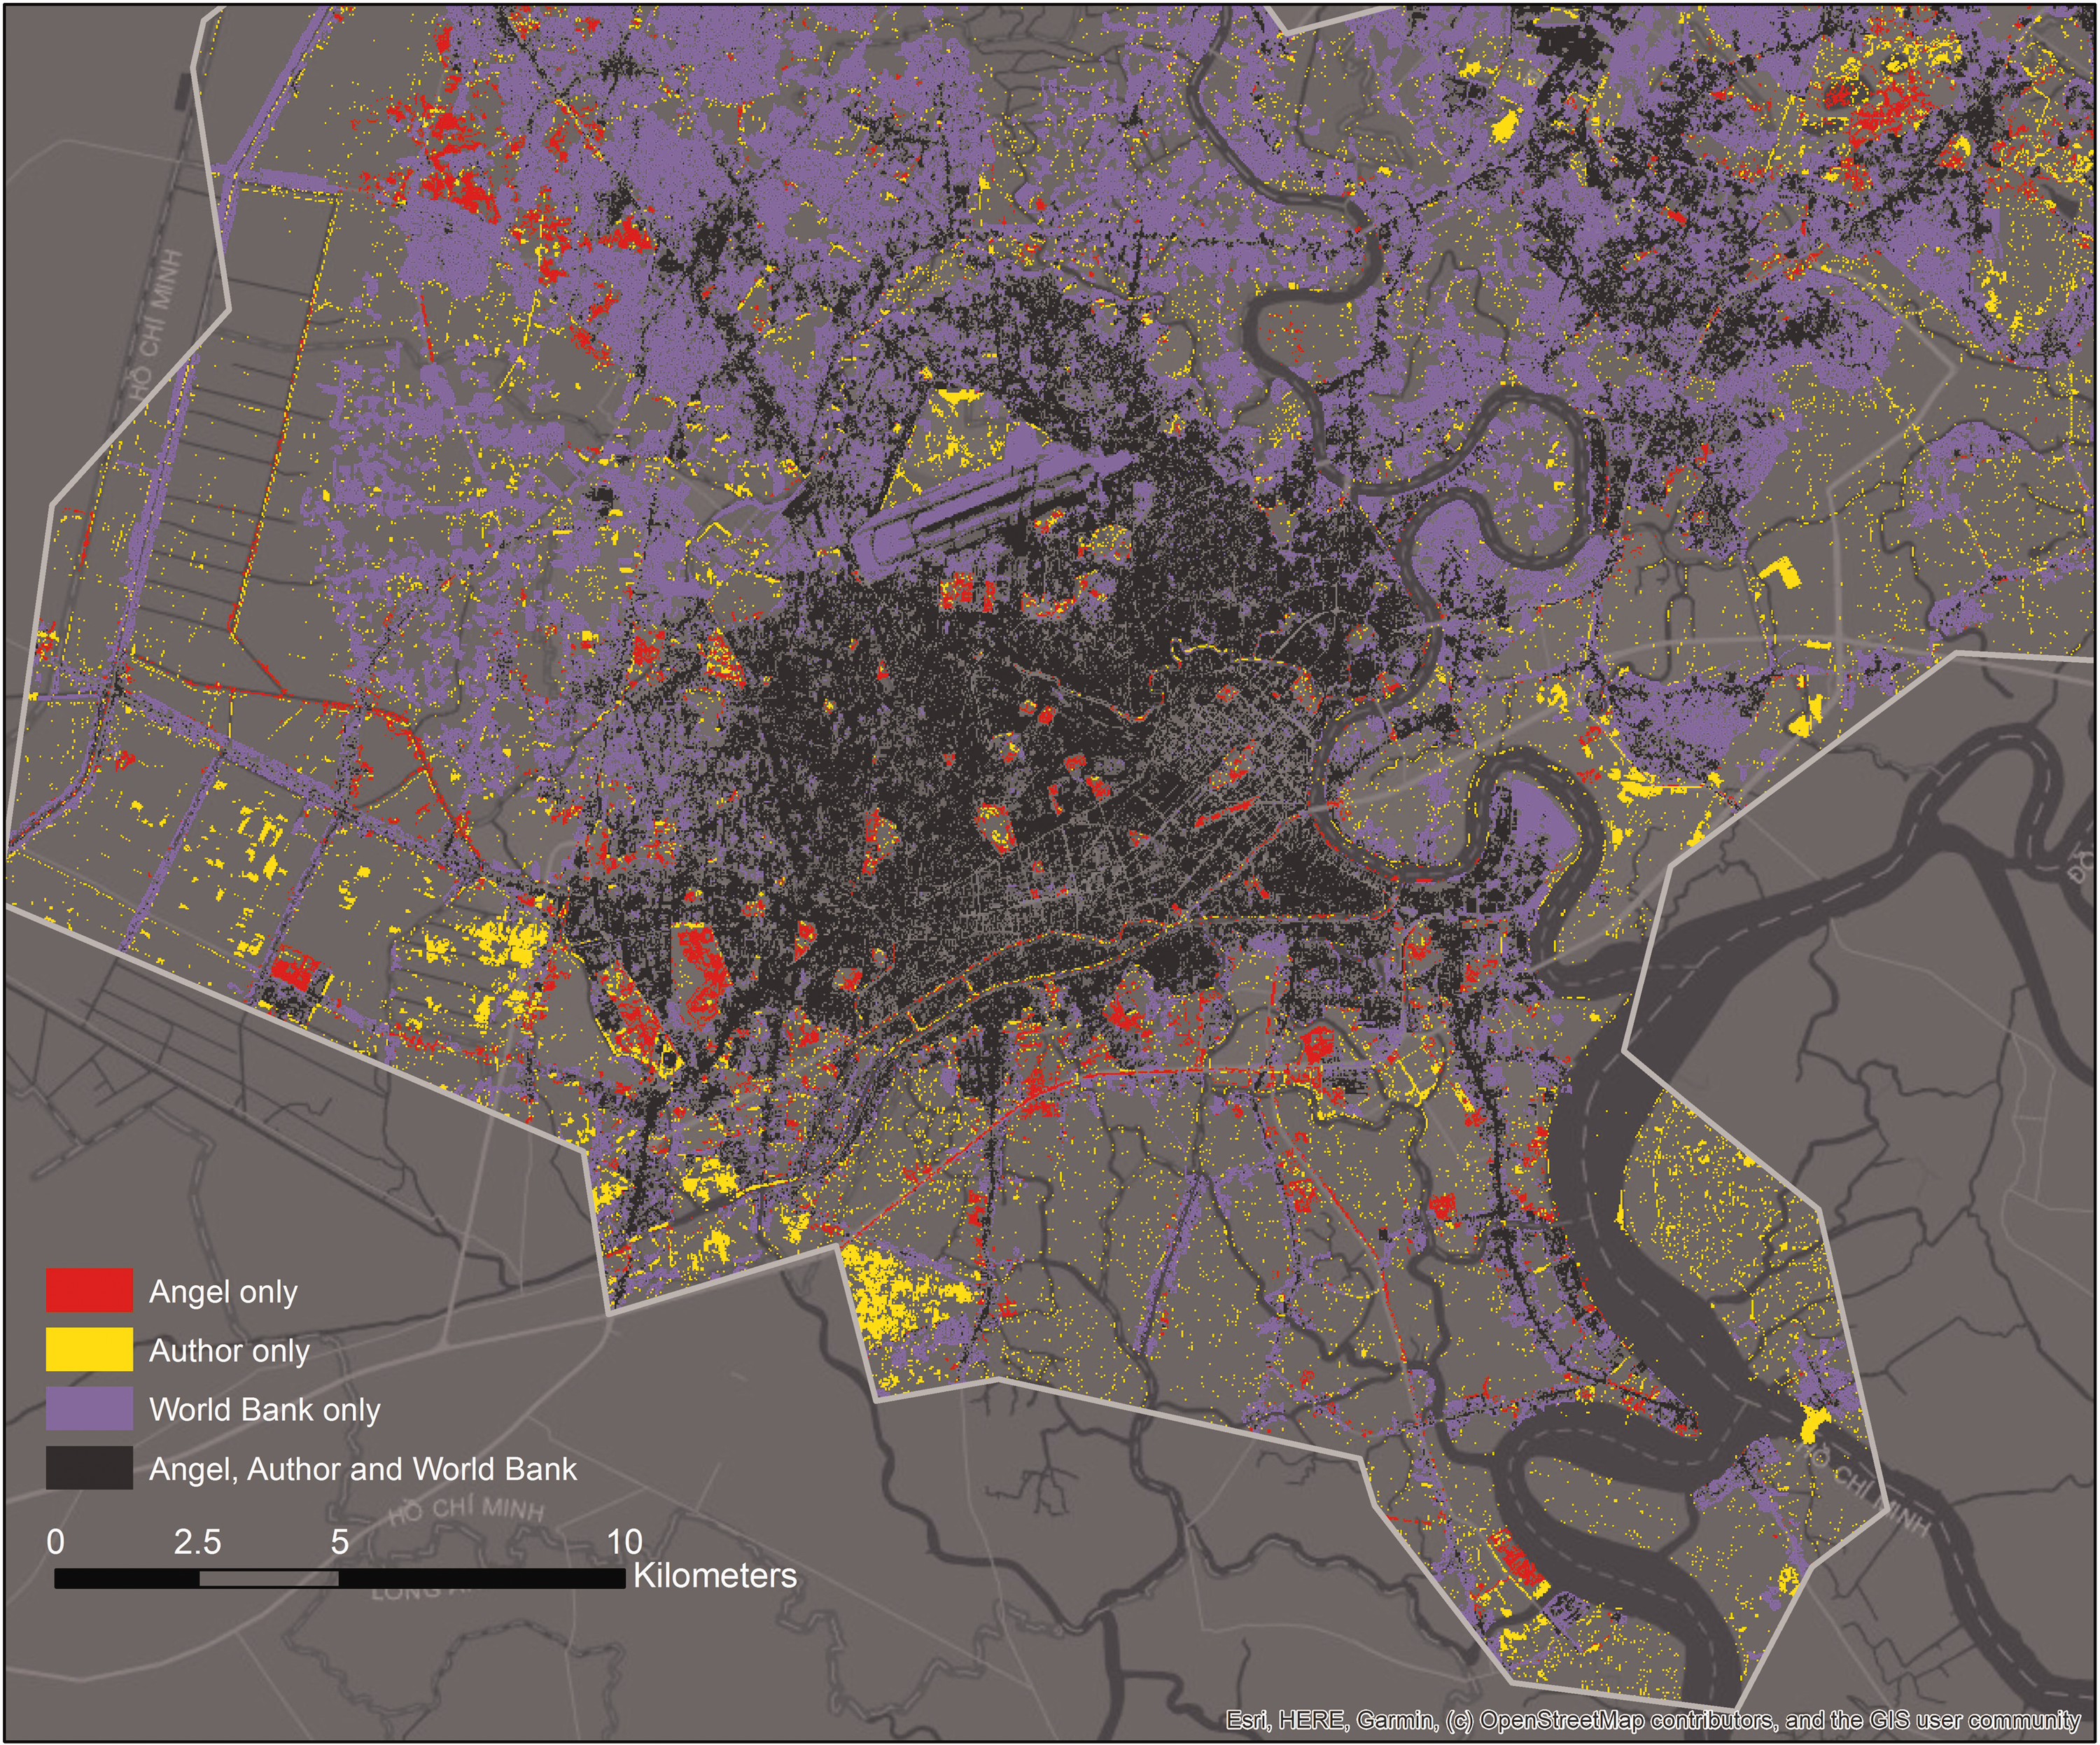
A comparison of urban land use classification maps for Ho Chi Minh City 2000–2001 by three different studies. Data
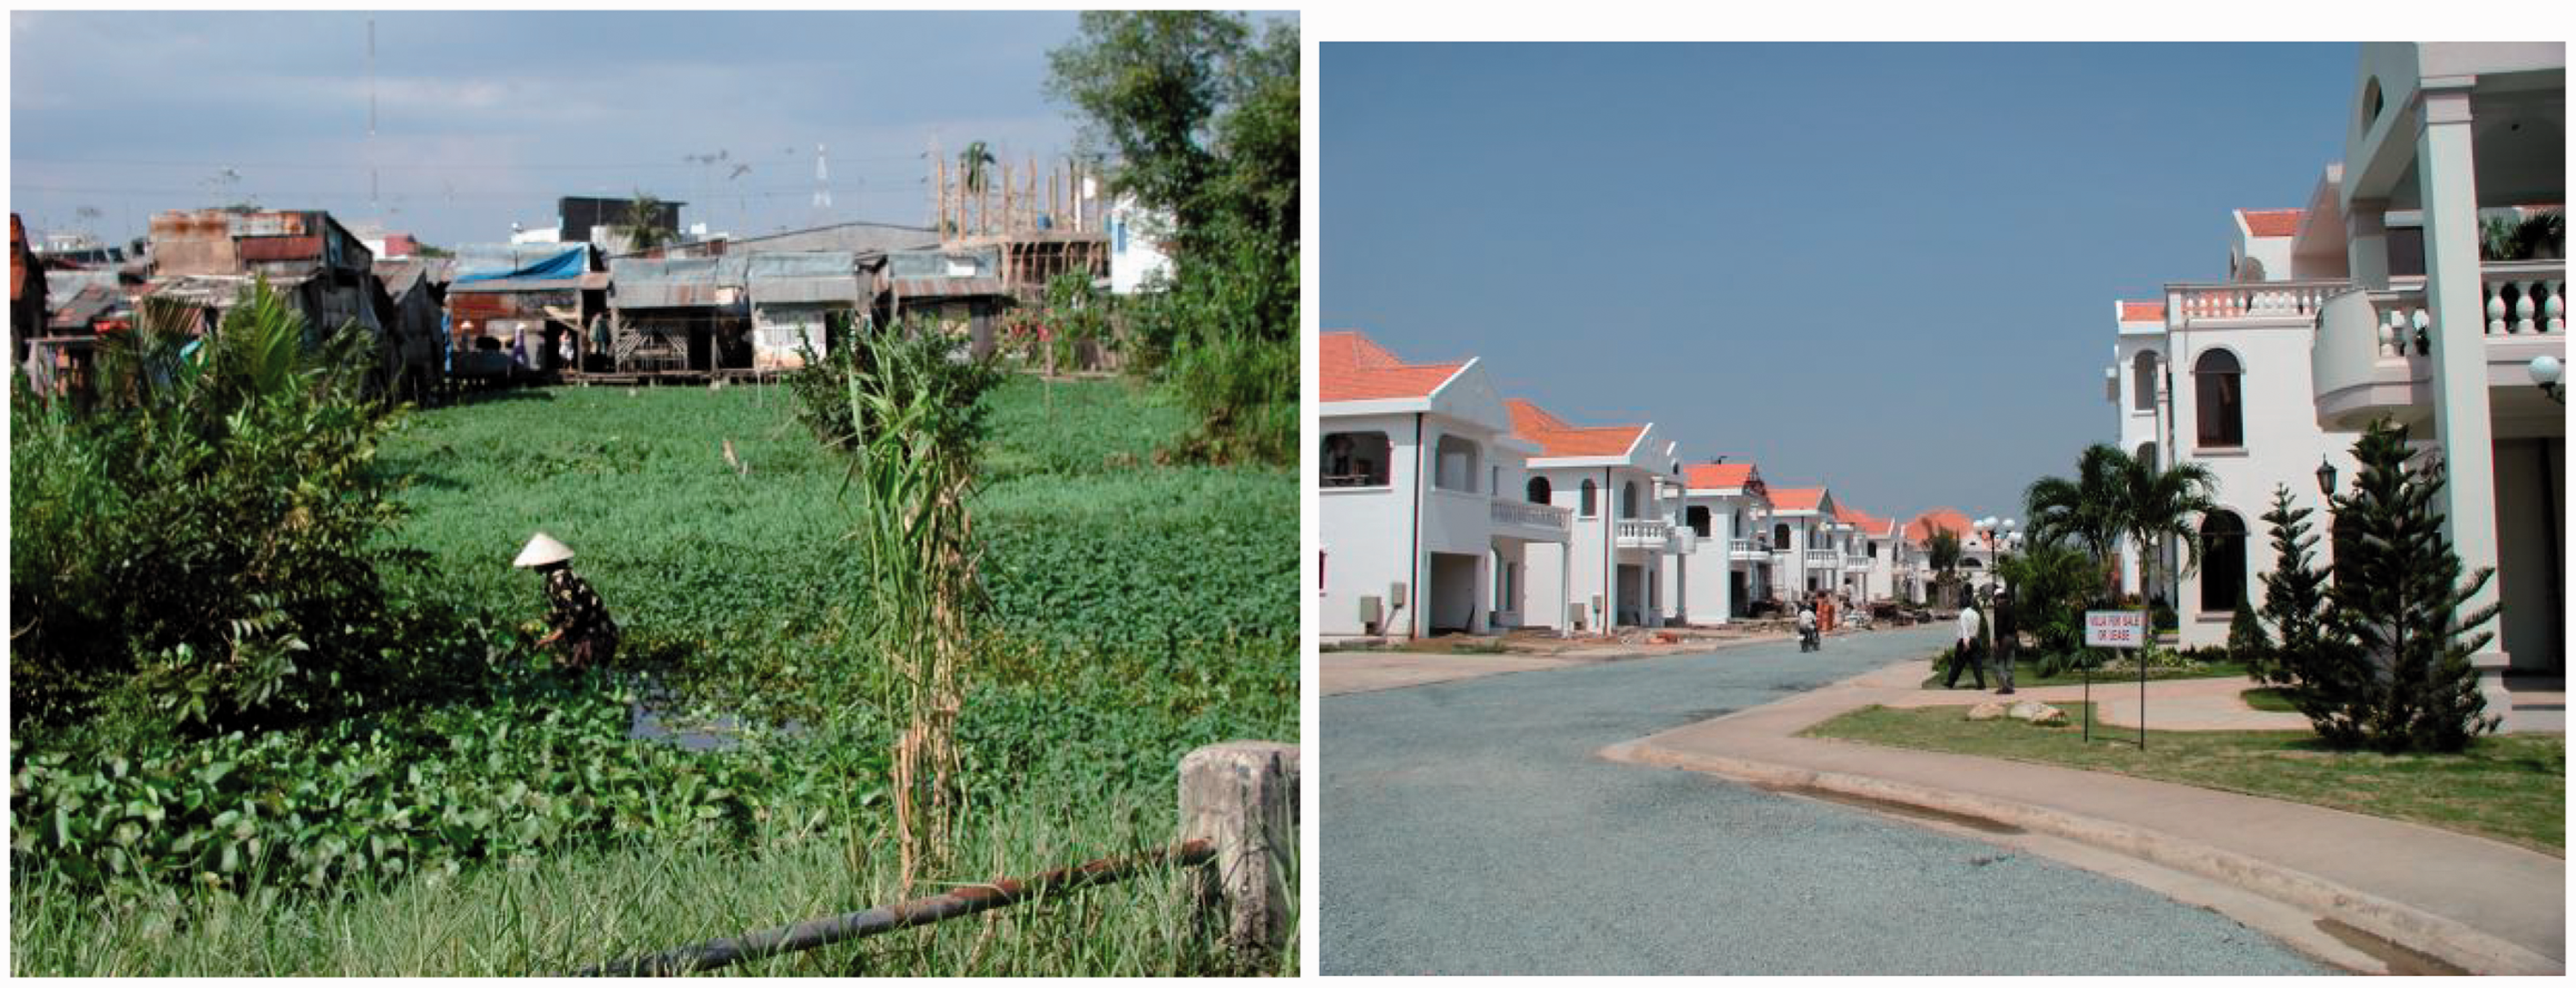
Images of urban develpment on the periphery of Ho Chi Minh City, 2000. 3a. Informal settlements on the southern fringe in District 7.3b. Formal settlements in the northern fringe, District Gò Vấp.
Comparing the areas classified as urban by the three studies, we find overlap as well as differences. Coded in black are the areas that all three studies agreed were urban: the urban core is unambiguous. But, in the periphery each of the three studies also identified urban areas that the other two studies did not: these are colored in yellow (Kim et al., 2004), lavender (World Bank, 2015), and red (Angel et al., 2005). 2 Overall the World Bank identifies much more urban area than the other two studies: 301 square kilometers or 34% of the study area is classified as urban and another 60 square kilometers or 7% are classified as “Industrial, Commercial and Transport Units”, as compared to 207 square kilometers or 23% for Angel et al. and 191 square kilometers or 22% for Kim et al. (2004).
Many of Kim et al. ’s unique areas are granular areas of isolated dwellings on the southern periphery whereas the other two tend to pick up larger clusters. The differences can primarily be attributed to differences in choices and procedures, pointing to the importance of understanding the processes used to generate this data, discussed in the next section.
Results and policy implications
Drivers of the differences in classifying urban expansion
Analyzing why the studies produced different results reveals how society, institutions, and technology interact in the production of data. Developing algorithms to automate the detection of urbanization still requires important subjective choices implicitly informed by one’s understanding and assumptions about the phenomenon.
For example, one choice that varied between the three groups is the resolution quality of the satellite imagery. Major advances in satellite image resolution have increased to the current commercially available 0.5 m pixels. This increasingly available Very High Resolution (VHR) imagery at submeter resolution has enabled the development of cluster-based categorization based on object extraction algorithms (Antos et al., 2016; Sethi, 2015; Vatsavai, 2014; Verma, 2019) that requires significantly more computing capability. One drawback with very high-resolution images is that historical images are limited because of the recent technological advances whereas 10 m imagery has been archived since the 1980s and is therefore able to track urban expansion over the rapid expansion decades. Also, while smaller objects can be detected with higher resolution images, they can also introduce new errors when trying to stitch together many pixels into larger objects such as houses.
Angel et al. used 30 m resolution imagery to classify urban and non-urban areas, while both the World Bank and Kim et al. used 10 m resolution imagery which roughly matches a typical residential building’s footprint width in the Vietnamese context. Still, Angel et al. found similar amounts of urbanized land area as [author reference 5] using 30 m resolution imagery, which is less costly. Furthermore, they were able to conduct urbanization analysis of over 120 cities, with some lab-based, human supervised calibration to adjust the interpretation.
However, there is a tradeoff with the coarser image resolution. Figure S2 in the Supplementary Material provides a heuristic diagram of how one house could be constituted in a satellite image using 30 m pixels versus nine 10 m pixels. The grey box symbolizes an individual house in a peri-urban area. Since Angel et al.’s images’ pixels represent a larger land area, they are more susceptible to missing small houses of low-quality materials built in discontinuous patterns, because the pixel might still not cross the spectral threshold they have set for urban land use. These are exactly the type of settlements that [author reference 5] trained their algorithm to detect shown in yellow in Figure 1. In other words, the relationship of the size of the phenomenon of interest and the pixel size of the imagery interact, such that it is one factor determining whether observations of data are created or remain invisible.
Another example of human choices interacting with technology in the creation of data involves how the three studies defined the phenomenon differently. Figure S3 is a heuristic diagram to discuss how with the same 10 m pixel imagery the World Bank and [author reference 5] utilized classification systems with different scale units. The [author reference 5]’s study identified individual buildings as urban units if there was a change from natural vegetation to human construction. In the diagram, these are shown as the grey rectangular houses, which are typically 10 m in width. The World Bank commissioned researchers at the University of Wisconsin Madison with expertise in the urban sprawl patterns of North America who rather than identifying urban objects such as houses used a classification scheme of urban fabric, categorizing density patterns in larger spatial units, indicated by the border of the entire box.
As in other American urban sprawl studies, the variation of pixels within this particular box is classified as low-density urban land, identifying a much larger swath of land as an urban spatial unit in Figure 2 (shown in lavender). This difference in how to define the spatial unit is rooted in the commissioning institutions’ and researchers’ interests and routines. In the international development arena, experts are often called to deploy their usual methodology in diverse places with limited opportunities for adjustments.
Whether classifying larger areas of land density patterns or individual objects such as houses is more appropriate depends upon the purpose of the data. With [author reference 5]’s more disaggregated data of individual houses it is possible to further generate location variables such as the house’s distance to roads and rivers that could be useful for urban planning. However, if one is more interested in how much agricultural land area is being taken over by urban development, the Wisconsin study would be an appropriate spatial unit. In essence, the research groups have made different decisions about how much of the land area around a house should be included as part of the urbanization phenomenon. With this choice, they are also implicitly making choices about whether they need to know the specific location of houses. However, in the global urbanization policy discourse, these studies would lead to very different numbers reported as urban land use conversions.
Third, another fundamental reason for the systematic differences between the three studies emanates from whether and how the researchers incorporated groundtruthing and field knowledge. While a computer algorithm is used to differentiate between formal and informal land areas, most studies also usually require significant amounts of human supervised calibration to establish thresholds and filter size based on chosen testing sites and to conduct post classification review. Even the first choice of defining a study areas already bounds the urban phenomenon. Selection of training sites must assume these represent the full range of urban settlement patterns across the study site. Therefore, the quality of the training data is critical. As discussed in the literature review, community participation and collaboration with local institutions is one possible but rarely used approach in remote sensing interpretation. Another approach could also involve the groundtruthing of data by the researchers themselves conducting fieldwork.
The investment of time, labor, and funding into groundtruthing involves tradeoffs between knowing the particularities of each place better versus the number of places being studied. The other two studies utilized human supervised calibration by researchers working in labs, without being able to field test their work but then being able to more rapidly process more study sites. Meanwhile, with a limited focus to just one metropolis, [author reference 5] was able to spend significant fieldwork time in Vietnam and visit informal settlements on the urban periphery of HCMC. Confirming that the low-brightness pixels were indeed new houses, [author reference 5]’s team adapted their algorithm to include this type of informal urbanization. Their results recovered 12% more newly urbanized land area defined by the parameters determined through field survey than would have been discerned using conventional methods. Furthermore, this texture analysis would not be possible using 30 m resolution imagery such as the Landsat data used by Angel et al. as the size of those pixels would not catch dispersed individual houses. Approaches that use a pure thresholding approach without taking into account differences in texture for informal construction are likely to miss the buildings that can be identified through the high-pass filter texture approach developed by [author reference 5].
Policy implications
The confluence of choices in image quality, data definitions, and groundtruthing resulted in three very different maps of the HCMC’s urban periphery. One lesson from this case is that rather than one objective reality to visualize into data maps, the researchers’ own interests and backgrounds shape the data created through choices about data quality, phenomenon definitions, and analysis methods which ultimately impact the creation of spatial facts, and who is made visible and invisible. We need to take care to communicate these choices and the possible biases so that readers and users of our spatial data do not misuse them. Our three study cases might all be mapping urban expansion but they are not actually doing the same thing. [author reference 5]’s research was framed by international development policy’s interest in improving sub-standard housing and with a focus on Vietnam in particular and so took special care to identify every informal house. This interest matched the choice to use 10 m resolution imagery and to invest in fieldwork time to groundtruth these images. Angel et al.’s study was part of a larger project creating an atlas of urban expansion in over 120 cities around the world. This research group sought to establish global urban indicators in order to offer a global view of how quickly regions of the world are urbanizing. The World Bank’s commissioned study was intended to show what was possible with satellite imagery and to encourage more research into this area. The audience of the latter two research groups were global development institutions and so limited tailoring their spatial analysis to lab-based human interpretation whereas [author reference 5] was more focused on the one city and detecting every household.
Interestingly, despite their global comparative research agendas, Angel et al.’s and the World Bank’s results vary greatly from each other because of their differences in definition of urbanization as buildings versus land use patterns. On the other hand, despite the difference in image quality, the overall urbanization rates were similar between [author reference 5] and Angel even though Angel was able to use less costly, lower resolution images and to produce many more interpretations with limited human supervision. But, there was a systematic difference between the kinds and locations of urban patterns they detected on the periphery with [author reference 5] capturing more of the dispersed residences and Angel classifying larger clusters.
In order to explore the possible policy implications of these systematic differences, we analyzed whether informal land uses in HCMC were located in physically vulnerable areas given concerns about climate change in low-lying HCMC. Table S1 in the Supplementary Material section summarizes the share of formal and informal urban areas that fall within a 250 m buffer around the waterways shown in Figure 1. 3 We find that while 26% of formal construction falls within 250 m of a waterway, 52% of informal construction fall within that buffer zone that is potentially more exposed to risks of flooding. While it is common for informal settlers to locate in less desirable places because their presence is less likely to be contested, their being undocumented also makes them more challenging to incorporate into disaster and resilience planning.
Next, we performed a similar buffer around arterial roads, valued for their accessibility to jobs and urban services and the potential for supporting commercial activities. A larger share of formal construction is located within 250 m of major roads (53%) but there is also a substantial share of informal construction that falls within the 250 m buffer around major roads (30%) consistent with informal construction taking place in locations with access to the rest of the city. However, these informal developments are at risk of displacement by formal urban development because of the high land market value of locations with transportation access.
Overall, informal settlements in HCMC are more likely to be located in areas that might be at risk for flooding and also near roads that can provide access to jobs but put them at risk for eventual resettlement. Missing such data observations make some of the most marginalized residents largely invisible in the planning process and would limit the planning capacity of cities.
Conclusions
Using remote sensing imagery to detect patterns of informal development has great potential. Developing policy-useful and parsimonious approaches for classifying urban land uses is an important research agenda to help policymakers and urban planners. This paper identified tradeoffs to consider in generating urbanization data from satellite imagery by comparatively analyzing the results of three different studies that employed different methods and metrics. While the studies agreed about the unambiguous urban core, we found substantial differences in interpreting urban informality on the urban periphery. As Figure 2 displays, if a city were to just use one study’s classification, there would be systematic differences in its understanding of where its population resides. With the World Bank map, there would be more focus on the north whereas the [author reference 5] study would incorporate smaller settlements, particularly in the south.
As summarized in Supplementary Table 3, all three approaches have their strength and weaknesses. Angel et al. provide a consistent measure of urban land covers for over 120 cities in a way that allows to assess change over a long time period but is limited by lower resolution. The World Bank allows to compare change in five cities with detailed land use categorizations, but provides limited documentation. Neither identify informal settlements. The approach developed by one of the authors of this paper has the benefit of being able to capture disperses informal settlements and to have been groundtruthed but that approach requires substantial human investment.
These strengths and weaknesses need to be considered by researchers and policy makers producing and consuming such analysis. In particular, we argue the importance of adopting an equity lens to ensure marginalized population are not systematically underrepresented in the measures produced. While there will always be some error, systematically missing informal settlements has important equity implications. We found that in the case of HCMC, informal settlements in the periphery were particularly likely to be missed by two of the three methods. We also found that more informal construction happens in the periphery and in geologically vulnerable areas as well as in prime areas for redevelopment. If our algorithms miss the presence of residents in these areas, the missing data could lead policymakers to underestimate the number of vulnerable residents in risky locations and impede the appropriate planning of future infrastructure development, climate change flood adaptation, resettlement needs, and public transportation.
Our study emphasizes the importance of customizing automated interpretations to the local context and for the policy purpose. While a city does not typically have three different research teams providing alternative data, this serendipitous situation allows us to learn about how city leaders might manage the veracity and implications of satellite imagery interpretation for governance purposes. Our study suggests that they should discuss field verification and how the models were adapted to the local context through choices such as pixel sizes, spatial units, and thresholds. To do this, researchers would have to possess enough knowledge about both how informality and other forms of disenfranchisement are manifest in the built environment of a particular socio-economic and political context and how they might be made detectable with the imagery and research design. This translational work could happen through technologists collaborating with local experts and community representatives as well as from researchers conducting fieldwork but in either case requires groundtruthing to verify what is being mapped. Overall, in addition to tradeoffs between accuracy and coverage, it is important to match the methods of generating urbanization data to the specific policy and urban planning purpose for which the data will be used, otherwise we run the danger of misinforming urban planning decisions.
Supplemental Material
sj-pdf-1-epb-10.1177_2399808321998708 - Supplemental material for Algorithmic justice and groundtruthing the remote mapping of informal settlements: The example of Ho Chi Minh City’s periphery
Supplemental material, sj-pdf-1-epb-10.1177_2399808321998708 for Algorithmic justice and groundtruthing the remote mapping of informal settlements: The example of Ho Chi Minh City’s periphery by Arthur Acolin and Annette M Kim in EPB: Urban Analytics and City Science
Footnotes
Acknowledgements
The authors thank Dr. Seraphim Alvanides for his comments as the editor and three anonymous reviewers for their helpful feedback. The authors also thank participants at the World Bank 2017 Land and Poverty Conference for discussion of an earlier version of this article.
Declaration of conflicting interests
The author(s) declared no potential conflicts of interest with respect to the research, authorship, and/or publication of this article.
Funding
The author(s) disclosed receipt of the following financial support for the research, authorship, and/or publication of this article:Annette Kim thanks the USC Sol Price School of Public Policy and USC SLAB for research funding support.
Supplemental material
Supplemental material for this article is available online.
Notes
References
Supplementary Material
Please find the following supplemental material available below.
For Open Access articles published under a Creative Commons License, all supplemental material carries the same license as the article it is associated with.
For non-Open Access articles published, all supplemental material carries a non-exclusive license, and permission requests for re-use of supplemental material or any part of supplemental material shall be sent directly to the copyright owner as specified in the copyright notice associated with the article.