
Abstract
Industrial agglomeration is a concentration phenomenon of economic activities in cities. In recent years, the geographic and functional structures of industries are constantly changing due to global industrialization and regional urbanization. Thus far, a scarcity of research has investigated spatial-functional organizations of sectoral industries in urbanized megaregions. By using points of interest (POIs) data collected in the Guangdong-Hong Kong-Macao Greater Bay Area (GBA), this paper seeks to portray the spatial extent of industrial agglomerations and to label their functional characteristics. A kernel density function is first applied to measure the spatial extent of industrial agglomerations. Next, we explore the industrial functions by implementing a semantic-based information retrieval to label the functional characteristics of industrial agglomerations via words that are tokenized from POI registered names. The empirical results suggest that the concentrations of industrial activities are strongly heterogeneous across different economic sectors, revealing that agglomerations across the GBA can provide a variety types of industrial products and services. Concerning manufacturing industries, the present analysis further confirms the existence of both specialization and diversification agglomerations along with far distinct spatial characteristics. This research supplements empirical evidence and provides novel insights into the geographical and functional organizations of economic activities regarding one of the largest urban megaregions in the world. The implications that are related to megaregional economic collaboration and development are discussed.
Keywords
Introduction
Industrial agglomeration is a prevalent phenomenon in economic geography and has gained widespread attention in studying concentrated industrial activities in cities. To date, the majority of the knowledge from existing literature has been built upon the agglomeration economies in developed countries (Funderburg and Boarnet, 2008; Van der Panne, 2004). These studies investigate the empirical evidence of agglomeration economies by estimating the economic metrics retrieved from aggregate-level and establishment-level socioeconomic data (Beaudry and Schiffauerova, 2009). Using examples like Silicon Valley for the innovative industries or London for financial services, the scope of agglomeration activities has been enriched in both manufacturing and service industries (Angel, 1991). Apart from developed circumstances, diverse industrial activities in developing regions have exhibited a transformation in economic structure and have gradually attracted research interest from scholars in economic geography (Gezici et al., 2017).
Agglomeration measurement has long been seen as a major research topic in studying the role of economic activities. Relevant literature has figured out that the measurement of industrial agglomerations can be divided into two parts, namely, the spatial aspect and functional aspect (O’Donoghue and Gleave, 2004). Spatial aspect reveals geographic patterns and the concentration degree of economic activities, while functional aspect claims that industrial agglomerations consist of economic activities that are interconnected by commonalities and complementarities (Vogiatzoglou and Tsekeris, 2013). Focusing on the latter one, Strange (2008) illustrated the input sharing in specialized manufacturing industries and knowledge exchange among firms from diversified industries. To distinguish functional characteristics, two classical paradigms of agglomeration economies are proposed, which are diversification and specialization economies. Diversification proposed by Jacobs, 2016 highlights that industrial agglomerations often have a close relationship with the diversity of industries in a larger metropolitan area. In contrast, specialization is strongly associated with the concentration of particular industries or productions (Marshall, 1890). Experimental findings have mostly reported the collective functional disparity between specialization and diversification effects using regional statistical data, such as industrial value, patterns and employment data (Guillain and Le Gallo, 2010). However, these data sources are provided at an aggregated geographical level, implying that discrete-space approaches can be challenged to explore the functional difference from a fine-grained spatial perspective. In such cases, there is still a need for delineating the local spatial patterns of industrial activities between two different agglomeration economies.
Against the backdrop of global urbanization, industrial agglomerations have spread to a larger spatial extent and thus formed megaregions, which are populated areas providing abundant services and resources. Researchers have argued that such megaregions with flourishing industries progressively perform as the main engine of the global and domestic economies, such as the San Francisco Bay Area in the United States and the Tokaido (Tokyo–Osaka) corridor in Japan (Angel, 1991; Hui et al., 2018). Meanwhile, flourishing industrial activities in megaregions also generate returns helping mould a highly integrated multi-centre structure and increase population inflow from other areas (Walker and Schafran, 2015). In this connection, our knowledge regarding the spatial-functional organizations of industrial agglomerations as to the context of megaregion remains poorly understood. To fill this research gap, this study takes the Greater Bay Area (GBA) as the study area and seeks to answer the following two research questions: (1) What are the spatial and functional characteristics of industrial agglomerations of economic sectors in the GBA? (2) Given the industrial agglomerations identified in the GBA, how do the diversification and specialization economies associate with their geographic patterns?
The present study tends to understand the role of industrial agglomeration by linking the spatial concentration of industrial activities with their functional characteristics in a megaregional context. Through the usage of points of interest (POIs) collected in the Guangdong-Hong Kong-Macao Greater Bay Area, we propose a data-driven framework to identify and describe industrial agglomerations. First, a kernel density function is applied to measure the spatial extent of industrial agglomerations. In this regard, spatial distributions of sectoral industrial activities are independent of administrative restrictions and respectively displayed to demonstrate the spatial heterogeneity across various economic sectors. Next, we explore the industrial functions by deriving their thematic characteristics. A semantic-based information retrieval is implemented to label the functional characteristics of industrial agglomerations via words that are tokenized from POI registered names. Finally, we take manufacturing industries as an explanatory case and investigate dissimilarities between specialization and diversification effects in terms of their local geographic patterns. The empirical findings suggest that geographical concentration and functional characteristics tend to largely differ among various economic sectors. Ultimately, the present research offers an alternative and unique perspective to learn how economic activities spatially distribute and functionally work in a continuous geographical space, contributing to the knowledge of industrial agglomeration in megaregions. Explicit practical implications and policy recommendations are discussed in subsequent sections.
Literature review
It is recognized that the key rationale for spatially delimiting the agglomerations is to measure the concentration degree of industrial activities. Previous studies have made efforts to develop metrics for representing the concentration degree of industrial activities via discrete-space methods (Gezici et al., 2017; Krugman, 1991). The locational Gini coefficient is introduced by Krugman (1991) and has been used for evaluating the concentration of specialized employment or patents within a local industrial market. Malmberg (1996) employed this metric to depict the geographic distribution of industries in the United States, reporting the concentration of localized industrial systems at state level. Another spatial concentration measurement is location quotient (LQ), which is proposed by Glaeser et al. (1992) and has gained a widespread popularity in measuring industrial activities and frequently cited by subsequent research. The LQ gauges the ratio between the local and national percentage of employment data, given a specific industrial sector. Using the employment data in Turkey, Gezici et al. (2017) introduced a LQ-based analysis to understand the mechanism of the manufacturing clusters and discover the areas that are more specialized in high-tech sectors. Apart from the methodologies applied in discrete-space, another vein of research has mainly focused on distance-based strategies that regard the locality as a continuous geographical space. For instance, the Ripley’s K function can reveal the clustering results by depicting a distance function against the reference function of the null hypothesis, while the Q statistic is able to present the co-location association regarding multiple types of entities (Liu et al., 2021; Scholl and Brenner, 2016). However, using the above-mentioned methods can be restricted, in which Ripley’s K function is subject to local socioeconomic determinants and the results from Q statistic may be complicated to interpret.
There are two types of agglomeration externalities to describe the functional mechanisms inside industrial agglomerations, which are categorized as Marshall specialization and Jacobs diversification (Beaudry and Schiffauerova, 2009; Faggio et al., 2017; Jacobs, 2016; Marshall, 1890). Early studies have sought to understand and summarize the distinct characteristics exhibited by these two kinds of agglomeration economies. The Marshall model illustrates a spatial agglomeration of specialized economic activities and identifies three external forces why firms are situated in close proximity: input sharing, labour market pooling and knowledge spillovers (Marshall, 1890). Holmes (1999) provided direct evidence that more concentrated agglomeration may have a greater value of purchased input intensity, which is applicable to the U.S. manufacturing sector. By considering the influence of human resources, Andini et al. (2013) investigated the relationship between specialized agglomerations and labour markets in Italy. On the contrary, Jacobs externalities highlight that the diversification of firm types in larger-scale metropolises may contribute to a concentration of various industries, which are primarily correlated with the innovative economics (Jacobs, 2016). Harrison et al. (1996) examined almost 1000 manufacturing establishments across the United States and highlighted that a more diverse industrial agglomeration is conducive to the communication of skills. More, Combes (2000) explained that the impact of Jacobs diversity differs in manufacturing and service sectors, by investigating the employment growth of 341 local areas in France. In general, these studies regard the geographic location as aspatial units that seem to be spatially unrelated (Guillain and Le Gallo, 2010).
In recent years, spatial big data has been readily demonstrated as a potential data source, with a high capacity in providing large-scale spatial evidence continuously and accurately (Elwood et al., 2012; Goodchild, 2007). Point of interest (POI) is a type of spatial big data with high precision and wide coverage on human activities. This kind of data can represent geographic objects with their spatial and aspatial attributes, containing name, address, category and coordinate. Goodchild (2007) suggested that POI is a reasonable option for landscape research in opening up additional, complementary perspectives. Besides, traditional datasets for agglomeration measurement like the household survey or regional economic statistical data are collected from a labour-intensive and time-consuming process. By contrast, the spatial and semantic attributes of POIs can be efficient proxies for the measurement of agglomerations, reflecting the level of spatial concentration and identifying functional characteristics.
Methodology
Study area and dataset
The Guangdong-Hong Kong-Macao Greater Bay Area (GBA) is one of the largest megacity regions in China. It covers an area of 56,000 km2 and has a population of approximately 71 million people in 2018. GBA comprises 11 cities: two Special Administrative Regions of Hong Kong and Macao and nine municipalities from mainland China, as shown in Figure 1. In terms of economy, the total GDP is 1642.5 billion and GDP per capita is 23,342 in the U.S. dollar, taking up more than 13% of the country’s economic volume (Hui et al., 2018). Combined together, GBA has been considered as a potential research region to capture economic and geography scholars’ sights. The location and layout of the Guangdong-Hong Kong-Macao Greater Bay Area (GBA).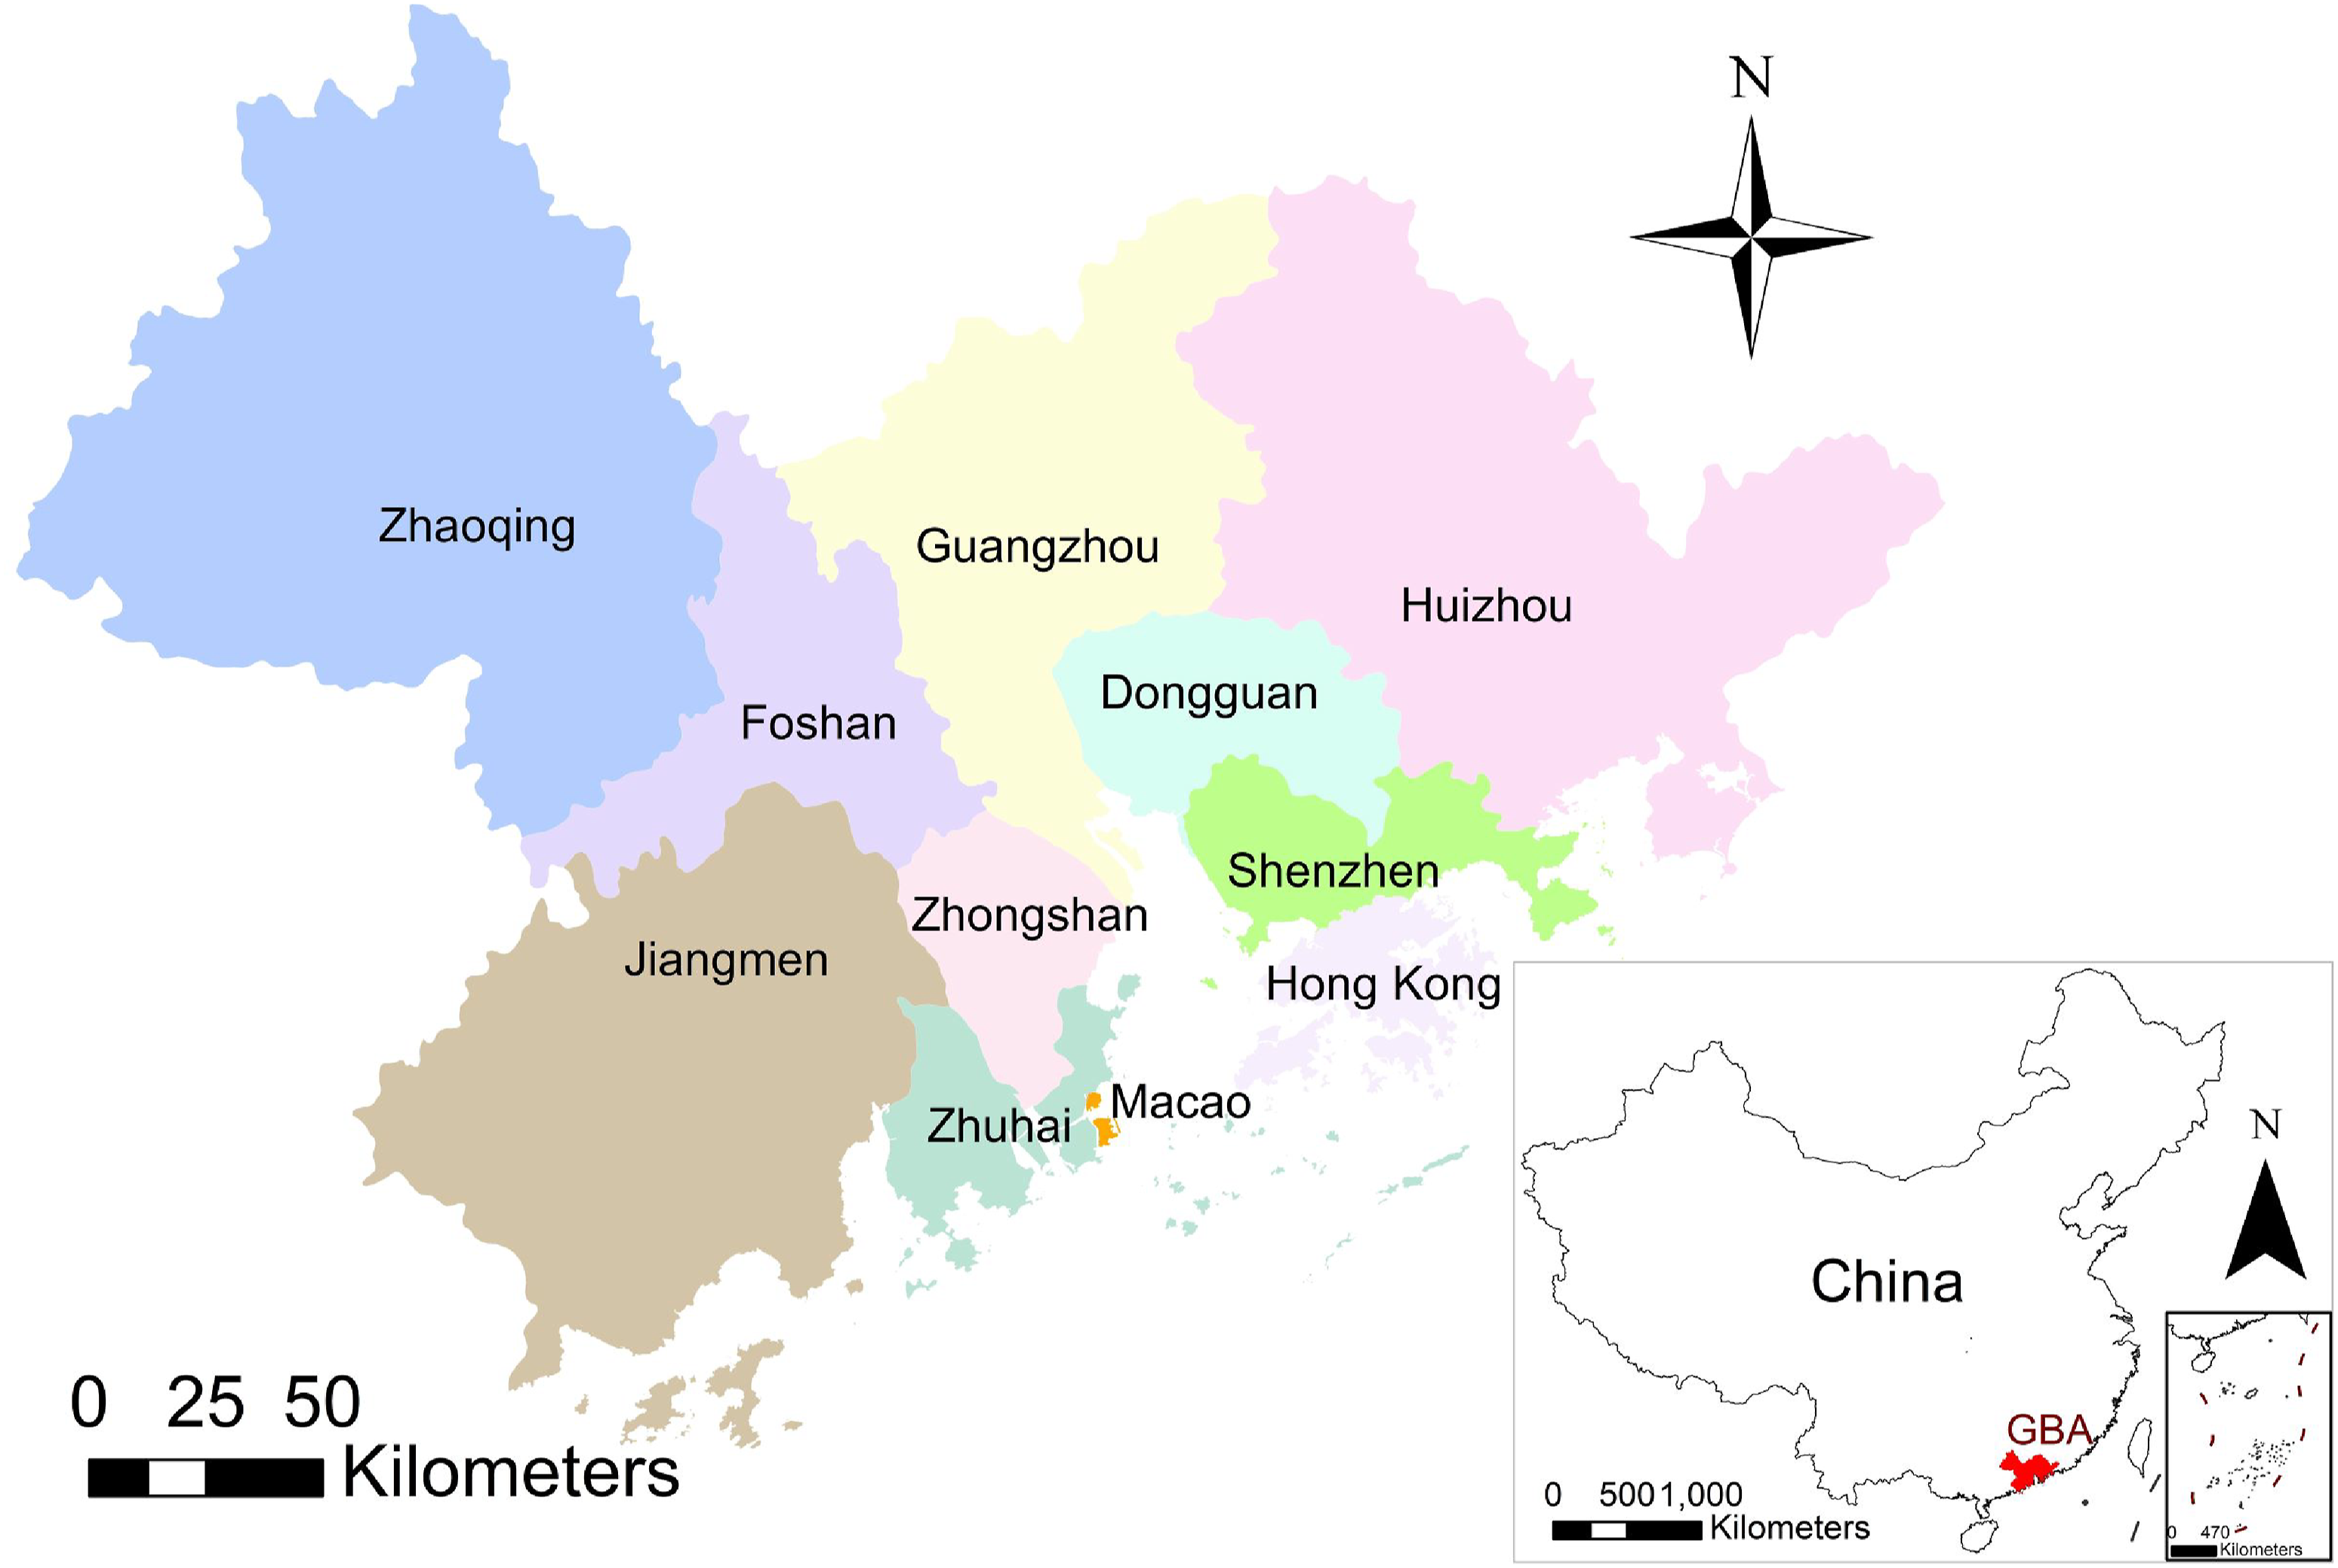
People usually visit various POIs for different activities, suggesting that POIs can provide valuable information on economic activities for describing the spatial and functional characteristics of agglomerations. In this study, we extract more than 220,000 POIs in the GBA from AutoNavi, a leading provider of location-based services in China. These POIs are categorized as industrial and commercial entities and can be used for describing diverse economic activities. As widely accepted by mainstream economics theories, post-industries have been always broken down into four sectors: primary, secondary, tertiary and quaternary (Ritzer and Stepnisky, 2017). These four sectoral industries have different focal points, respectively, on getting raw material, manufacturing, providing services and innovative industries (Kenessey, 1987). To extract the POIs associated with their corresponding sectors, three levels of categories defined by the map provider are used to classify sectoral industries. The first and second-level categories are applied to extract corresponding sectoral industries (e.g. Machinery & Electronics in secondary sector), while the third-level category containing specific branding information and characteristics of companies are then used for robustness check by implementing keyword search and sampling strategies. Accordingly, we divide all POI records into four sectoral industries, as presented in Supplemental Table S1 from the Supplementary Material.
Identification of industrial agglomerations
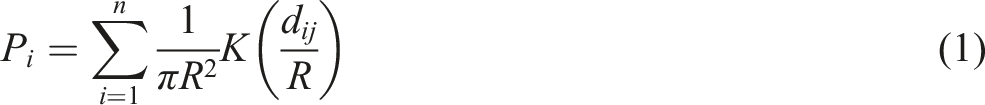
Kernel density estimation (KDE) has been widely applied to evaluate the distribution of arbitrary point events and hotspot areas without depending on any areal unit. Planar KDE with quartic function is applied to create the spatial distribution of the POI density in this study. The equation of KDE is expressed as
Scholars have suggested that the bandwidth is a critical parameter in applying KDE that can significantly affect the density surface (Sheather and Jones, 1991). As reported by previous studies investigating similar spatial coverage, three bandwidth parameters are often considered in the present case, for 2000, 3000 and 4000 m (Deng et al., 2019). Supplemental Figure S1 shown in the Supplementary Material displays the density surface with different bandwidths by using manufacturing industries in the Foshan-Guangzhou-Dongguan region as a demonstration. In view of 2000 and 3000 m search bandwidths, numbers of shattered small-scale hotspots are identified. However, such hotspots with relatively small scales are not adequate to represent industrial agglomerations, making it difficult to indicate spatial patterns. As for the results of 4000 m, isolated hotspots are continuously integrated with their neighbours. Evidently, the density pattern becomes smoother and continuously fuses compared to other smaller bandwidths. Given the purpose for delineating regional agglomerations, 4000 m is an appropriate choice for further analysis.
The kernel density is seen as a proxy containing a positive relationship with the concentration of industrial activities. To determine the concentration degree, standard deviation is recommended that can efficiently distinguish and highlight the concentrated areas from other general regions (Chainey et al., 2002). Two standard deviations are set to be the threshold value of industrial concentrations, given the kernel density surfaces generated from various sectoral industries, as illustrated in Supplemental Figure S2.
Notably, identified concentrations cannot directly indicate industrial agglomerations, due to the inflating effect of POIs aggregated in small-scale places. For instance, several factories inside an industrial building may pile up a high kernel density but cannot be regarded as an agglomeration. As suggested by current literature, the gross employment density of an urban centre should account for at least 1% of the overall employment (Huang et al., 2017; Muñiz et al., 2008). By referring to these analogous cases, a relative-threshold method is introduced for detecting agglomerations in this case study. However, given the intrinsic nature of industrial activities, threshold ratios for some specific sectors may vary. For example, agricultural farms and industrial plants may have larger land coverage than other sectors, thus displaying a lower concentration degree. Hence, as for primary and secondary sectors, ratios ranging from 0.4% to 1% are considered. By comparing the total number of identified agglomerations and combining local knowledge, ratios applied in this study for each economic sector are 0.4%, 0.5%, 1% and 1%, separately.
An industrial agglomeration is denoted as a geographic concentration that satisfies two conditions. Demonstratively, we assume that industrial agglomerations are not only with a density value greater than two standard deviations but also with the gross number of POI greater or equal than a specified ratio of the total amount. The equations are displayed as follows


Correspondingly,
Semantic labelling for industrial functions
Text mining is an information retrieval in the domain of natural language processing (NLP) for converting text data into high-quality, interpretable and easy-to-understand knowledge. An effective term-weighting scheme in NLP is Vectorized Term Frequency and Inverse Document Frequency (TF-IDF). This technique is based on unsupervised learning and has been pervasively implemented in the applications of semantic exploration in understanding urban areas (Berger et al., 2000; Liu et al., 2020). TF-IDF transforms the text content of a document into a bag of words with weighted terms that are calculated for each word and compared with the rest of the corpus. Given a certain corpus that is a document collection
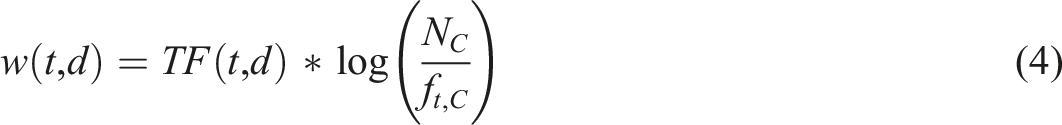
Here,
In this study, a POI registered name is able to be tokenized into several words that imply some specific industrial functions. An industrial agglomeration and all agglomerations in the GBA are regarded, respectively, as a test document and the entire corpus. Therefore, through the TF-IDF model, the most distinguishable semantics of functional characteristics are detected for each agglomeration. For illustration, an urban agglomeration in a metropolitan area may have a large number of printing factories serving the local publishing and press industries. As such, it is reasonable to infer that the keyword printing is more frequent and thus significant than other industrial functions.
Analytical results
Spatial organization of industrial agglomerations
In this section, spatial extents of industrial agglomerations are presented and discussed for each sector. By comparing different economic sectors in Figure 2, we observe a significant spatial heterogeneity that reveals sectoral industrial concentration patterns. As in the case of the primary sector in Figure 2(a), two large-scale centres in western GBA are unveiled. Surprisingly, an agglomeration with a smaller extent is detected in northern Hong Kong, in which these agricultural activities are mainly located in rural areas of New Territories. Regarding the secondary sector mainly constituted by manufacturing industries, Figure 2(b) highlights that agglomerations are distributed in the central and south-eastern GBA, shown as a dual-centre structure. Interestingly, the largest agglomeration across the administrative boundary between Guangzhou and Foshan can be implied as a cross-regional industrial collaboration. With respect to the second centre in Shenzhen, it is evident to find that industrial concentrated areas are evenly scattered, except the southeast coast that is a famous tourist attraction with beaches. Plus, a limited number of concentration areas scatter in the hinterland areas of the Pearl River estuary. As for the tertiary sectoral activities, compared to the former, a significantly different pattern is indicated in Figure 2(c). Most of the agglomerations have appeared in conventional downtown areas of cities in GBA, surrounding the administrative and economic urban centres. Guangzhou, Shenzhen and Hong Kong contain more than one tertiary agglomeration and play substantial roles in the prosperity of the tertiary sector in GBA. The findings are largely self-explanatory, providing alternative proofs on the appearance of the polycentric structure in these megacities. Finally, Figure 2(d) shows the distribution of agglomerations of the quaternary sector, which is noted to be remarkably crowded in the city of Shenzhen. This result may be explained by the substantial workforce from innovative fields and investments attracted by encouragement policies provided by the Shenzhen municipal government. Oppositely, the remaining areas, especially the hinterland cities of the GBA, are shown as containing an extremely low level of quaternary economics. The distribution suggests that high-tech and knowledge-oriented industries tend to spatially cluster around central cities of GBA, which are quite distinct from the secondary industrial agglomerations. Together, the present findings confirm that sectoral industries have exhibited significantly different geographic configurations. The spatial distribution of different industrial agglomerations in the GBA: (a) primary sector; (b) secondary sector; (c) tertiary sector and (d) quaternary sector.
Functional characteristics of identified agglomerations
The functional characteristics extracted from identified agglomerations for each economic sector are, respectively, manifested in this section. Given a specific sector, various agglomerations’ industrial functions suggest that relatively integrated industrial and supply chains have been established in the GBA for miscellaneous products and services. As indicated in Figure 3, four agglomerations reveal distinct semantic features with specialized agriculture productions and services. Agglomerations 1 and 2 in Zhongshan and across the Guangzhou-Foshan boundary suggest a functional characteristic of horticulture. Specifically, horticulture is a subcategory of farming that has been developed to make use of a huge demand for decorative gardening products, particularly in urbanized areas with a high-density population (Pribadi and Pauleit, 2015). Compared to agglomeration 1 with general products of horticulture, interestingly, we discover that agglomeration 2 provides more nuanced and exclusive products and functions. For instance, Pachira Aquatica, a tropical tree, is often viewed as the so-called money tree in Cantonese culture representing good luck for earning more money. In this respect, local people usually plant it as a common indoor decorative plant in regions of Southern China. Agglomeration 4 in north Hong Kong exhibits far dissimilar characteristics. This region perhaps provides high-quality organic foods and local tourism experience, with specific terms such as experience and organic. Plus, agglomeration 3 seems to be a general agriculture region with conventional farming productions. The results of the primary sector imply that functional characteristics from the agglomerations vary considerably in their products and services. Functional characteristics shown by agglomerations from the primary sector.
Focusing on the secondary sector, a high degree of specialization effects is confirmed in the peripheral GBA, as found in Supplemental Figure S3. It is observed that productions and manufacturing activities towards particular industrial chain systems are reported in these word clouds, suggesting specialized manufacturing preferences. For instance, bathroom accessories and footwear products are revealed in peripheral agglomerations 1 and 5, respectively, which are mostly associated with low-tech industries. In contrast, regarding agglomerations 6, 7 and 8 located in central GBA, diversified production structures are displayed with keywords on mostly unrelated industrial functions. Such patterns provide solid evidence for the existence of diversification economies. Taking the agglomeration 8 in Hong Kong as an illustration, different industrial productions like food, plastic, offset printing and toy are simultaneously exhibited within an industrial space. Combined together, the findings from secondary industries report that specialized and diversified economies are both observed in GBA and have close associations with their geographic locations.
Supplemental Figure S4 in the Supplementary Material delivers the functional characteristics regarding the tertiary sector that is mainly formed by business and commercial services. The most interesting finding is that Hong Kong, one of the world-class financial and commercial centres, suggests a significantly abundant functional characteristic. The keywords shown from agglomeration 5 are largely related to the financial and commercial service. As for agglomerations 2 and 4 in Guangzhou and Shenzhen, semantic discrepancies are revealed between these two megacities. The former discloses a strong function upon the storage and the exhibition of products, for instance, the Canton Fair annually held in Guangzhou. By contrast, our results demonstrate that Shenzhen pays more attention to international trade and E-commerce businesses, taking the locational advantage as bordering Hong Kong to the south. Collectively, the thematic characteristics displayed by agglomerations are mostly self-evident, implying that export and re-export businesses are dominant and of great importance in GBA.
The results of the quaternary sector are shown and discussed in Supplemental Figure S5. Despite that agglomerations largely present similar semantic implications with a particular emphasis on high-tech manufacturing processes, distinctive features can be discovered. Shenzhen indicates a superior position in innovative industries, by showing information and communications technology (ICT) functional characteristics. This can be ascribed to the greater number of localized firms that specialize in various ICT services and digital products. Another finding is that high-tech industries have also shown some different functional trends in other cities. We verify that agglomerations 3 and 4 in Guangzhou and Huizhou, respectively, provide some unique high-tech content, for instance, the pharmaceutical and aerospace-related industries. The semantic content from the quaternary sector suggests that high-tech and knowledge-oriented functions may largely relate to the local manufacturing productions.
Spatial-functional patterns of secondary agglomeration economies
In this section, a deeper insight is provided to explore the consequential evidence of specialization and diversification economies upon the regional industrial performance. Considering manufacturing-oriented policies have been persistently implemented in GBA for a long term, agglomeration economies based on the secondary sector are further investigated to understand the local spatial dissimilarities between different agglomeration economies.
Figure 4 displays the functional characteristics from industrial agglomerations that contain specialized manufacturing activities. Interestingly, we observe that these productions are mostly associated with low-tech industries, such as, footwear, leather, clothing and bathroom hardware. The semantic results demonstrate that for each agglomeration, the bulk of keywords is closely related to particular manufacturing productions. For example, leather production is regarded as the predominant industry as to the agglomeration 4 located in northern Guangzhou. Meanwhile, we still reveal that the majority of remaining keywords are related to leather byproducts, like luggage, handbag and leather edge painting in the same agglomeration. It is notable that some agglomerations specialize in overlapping industries, for instance, the footwear industries in agglomerations 2, 8 and 9. Functional characteristics shown by specialization agglomerations from the manufacturing sector in the GBA.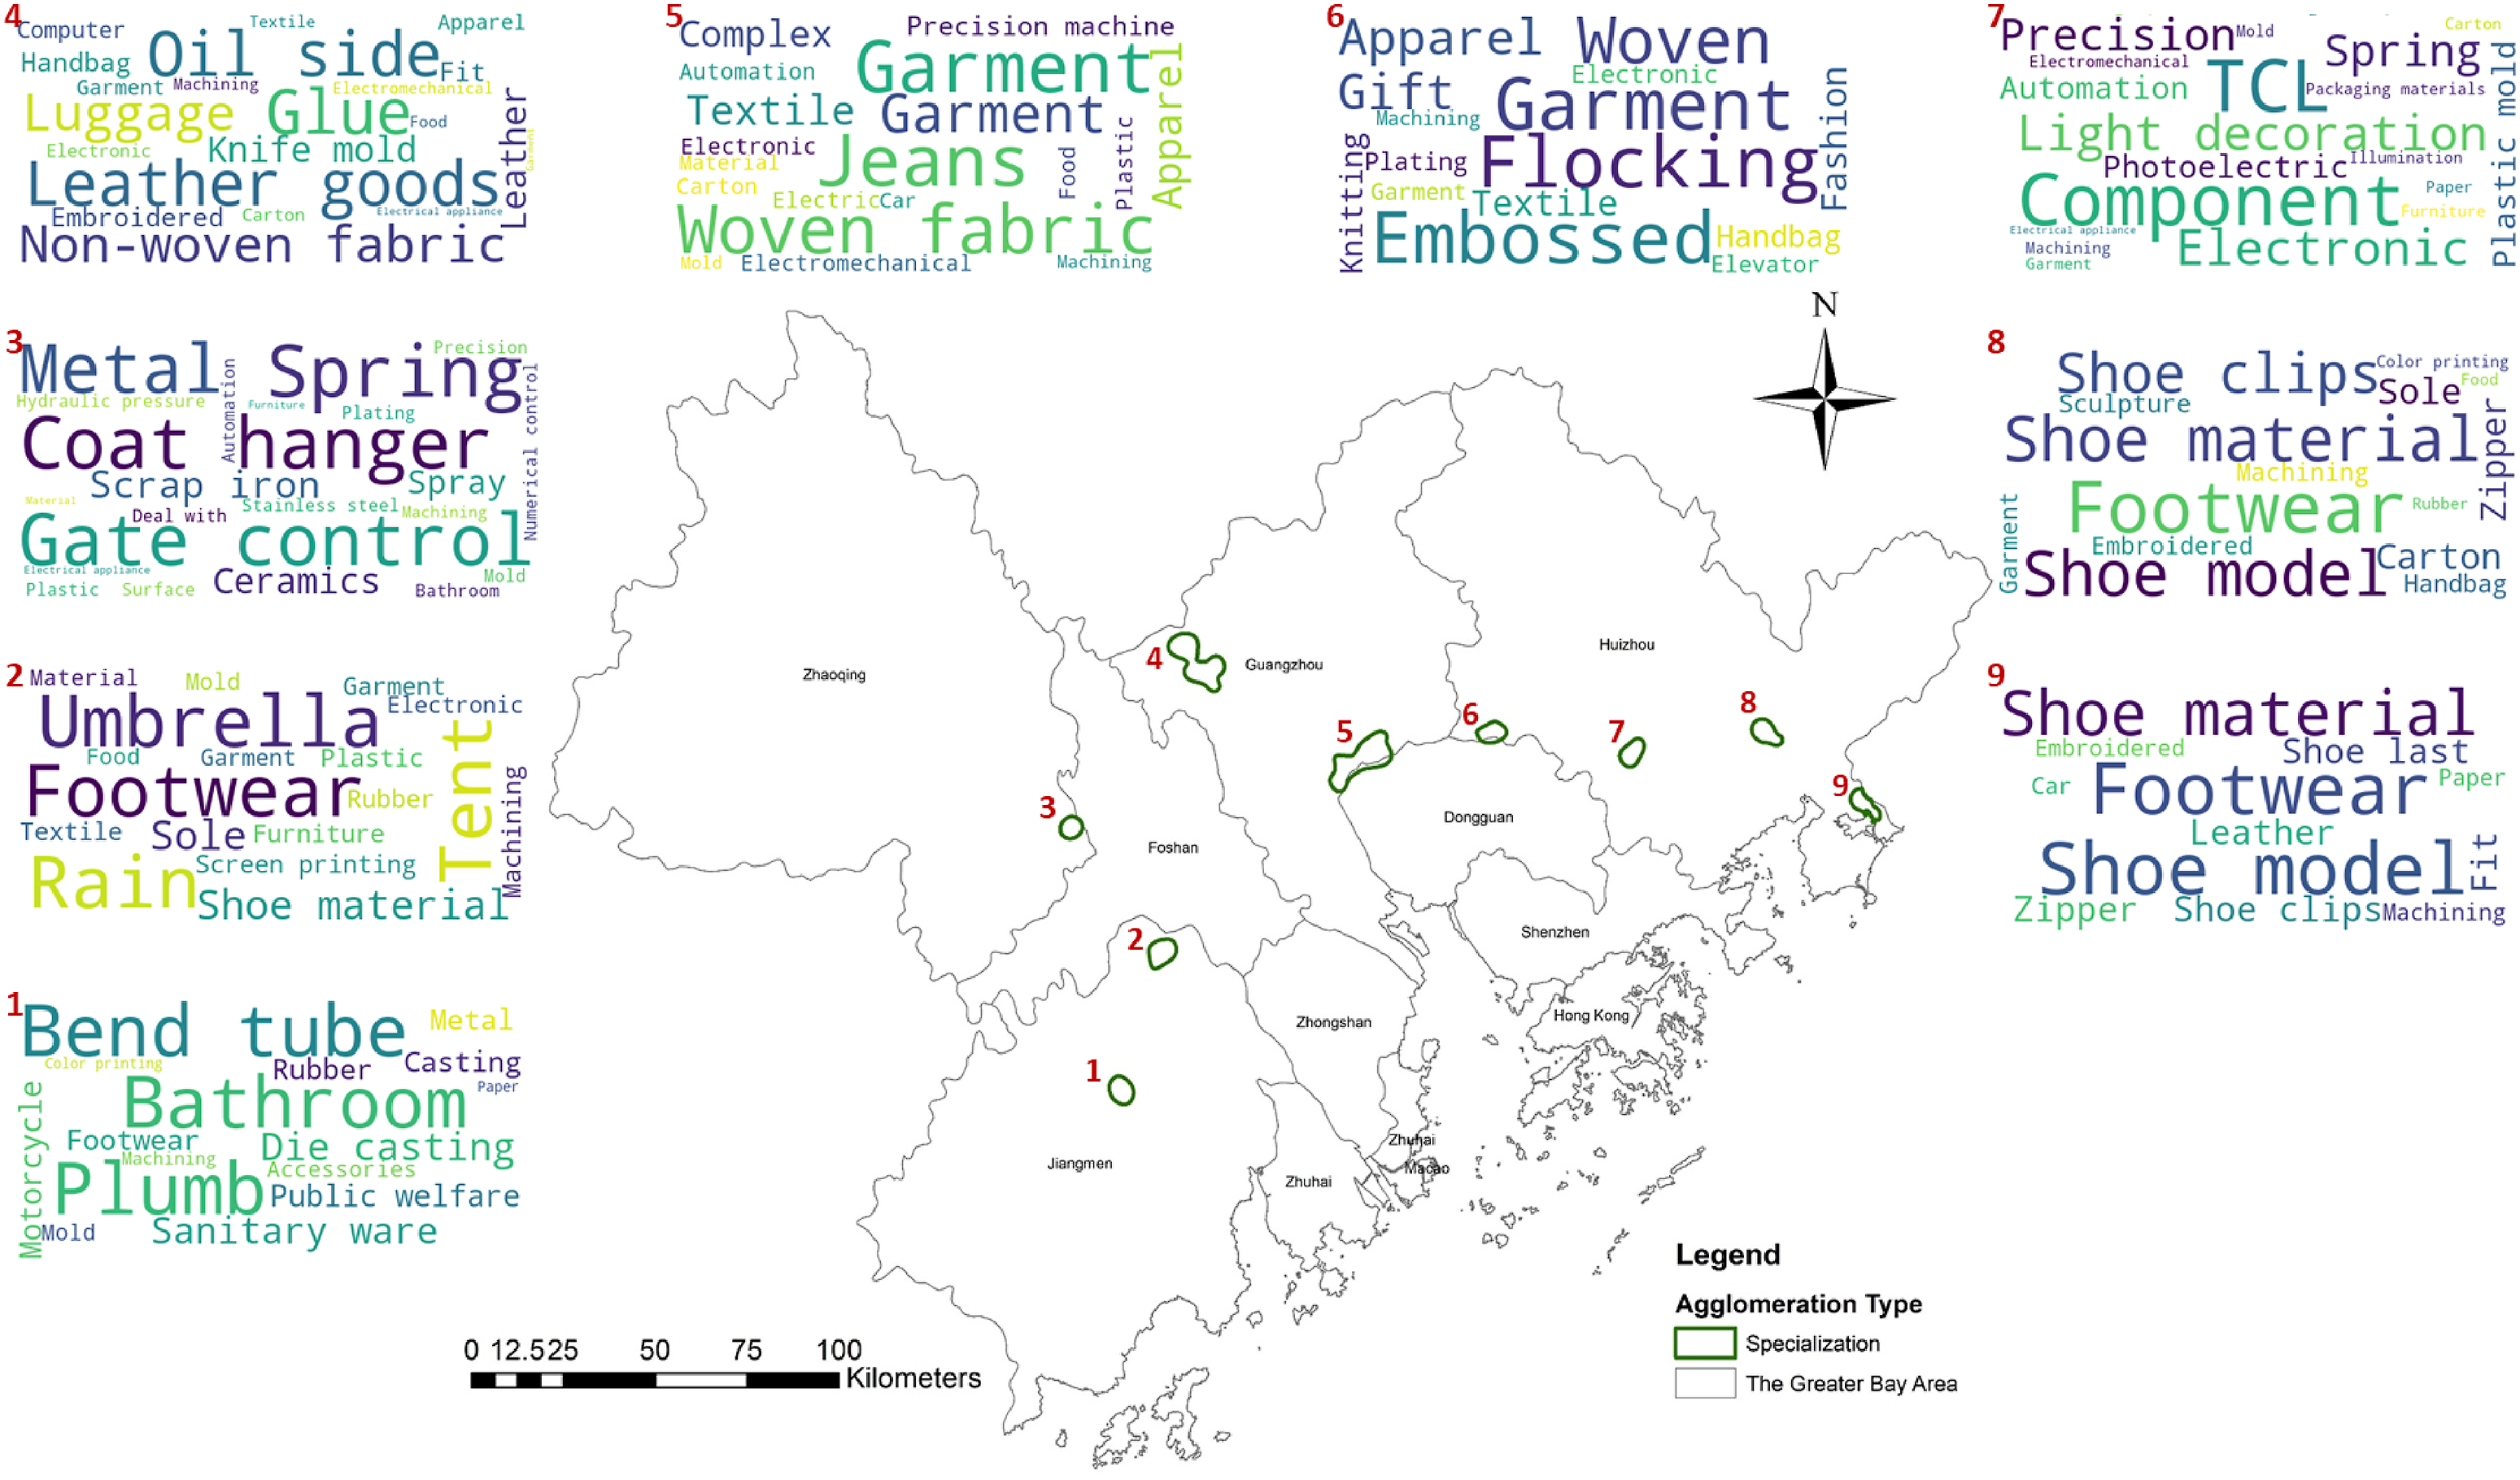
On the other hand, Figure 5 manifests the semantic functions upon all agglomerations categorized into diversification economies. Various semantics of unrelated industrial divisions are exhibited inside agglomerations, and they are mainly formed by printing, electronic, appliance, garment, metal hardware and material industries. By comparing word clouds from specialization economies, the words in diversification agglomerations deliver more abundant and miscellaneous industrial functions. These findings provide supplementary support that diversified effects have an intrinsic capacity for supplying more kinds of goods and services along with a stronger interplay across different industrial sectors (Capello, 2015). Functional characteristics shown by diversification agglomerations from the manufacturing sector in the GBA.
It is essential to note that we observe distinct local spatial patterns shown by different agglomeration economies. The geospatial distribution of specialization and diversification economies indicates a clear core-periphery pattern, as demonstrated in Supplemental Figure S6 (a). In particular, the specialization agglomerations have largely appeared in the hinterland areas of peripheral GBA, while the diversification industries are concentrated in the central cities. In reference to the census data provided from the Worldpop, a population density map of 2018 at a resolution of approximately 1 km2 is also provided in Supplemental Figure S6 (b). A high population density is discovered in the most agglomerate regions with diversification economies. In contrast, a relatively lower population density is indicated within specialization agglomerations. Nonetheless, by considering remaining areas mostly with extremely low population, both two types of agglomeration economies are identified in urbanized regions such as city centres and sub-centres (Strange, 2008; Van der Panne, 2004). Overall, our empirical results exhibit that agglomeration economies are strongly connected to their geographic location and population density. This is an important discovery in the understanding of the local spatial disparities between specialization and diversification economies.
Discussion and conclusion
Industrial agglomeration measurement has been long discussed by previous studies. From our knowledge, the local spatial and functional patterns of sectoral industries are short of theoretical and empirical explorations because of the challenges of data accessibility. By using POIs data, the present study is designed to measure sectoral industrial agglomerations in the GBA for understanding the roles of spatial and functional organizations.
The empirical results of the spatial aspect suggest that various sectoral industries exhibit significantly different geographic configurations. Specifically, the primary sector is testified as two large-scale concentrations located towards west GBA, while concerning the manufacturing industries, a dual-centre configuration is revealed in the central megacities. This finding is partially inconsistent with the discovery of Liu et al. (2019) who analyse remote sensing images and suggest a small number of manufacturing spaces in the metropolitan areas of Shenzhen and Guangzhou. A possible explanation of this is that the remote sensing images cannot reveal the details on the vertical concentration of industrial space, for instance, small workshops and factories can operate inside a downtown industrial building. Unlike primary and secondary sectors, the result of the tertiary sector suggests a dispersed spatial layout surrounding the traditional administrative and economic centres in cities of GBA. A twofold implication is presented to study the spatial organization of economic activities. First, spatial heterogeneity of sectoral industries is able to be deemed as a geographical proxy of economic activities. Such heterogeneity reflects an imbalanced regional development as regards various economic sectors in GBA. Second, it is worth discussing such imbalanced activities revealed by our analytical findings. External determinants such as input resources, local workforce, land-use issues, intercity transport and regional policies are to some extent related to geographic proximity which can shape industrial distribution patterns (Faggio et al., 2017).
Besides the spatial aspect, variations of functional characteristics across agglomerations are reported based on POIs semantic visualization. Given a specified economic sector, each agglomeration covers a series of industrial productions and services that are distinguished from others. Industrial agglomerations identified in our results can be categorized into two types of agglomeration economies. Specialization economies are clearly confirmed as a dominator through the primary sector, while diversification economies are revealed in industries from the tertiary and quaternary sectors. One hint from these empirical findings is that relatively integrated industrial and supply chains have been established in the GBA for miscellaneous products and services.
More illuminating is that both specialization and diversification economies are reported from the functional semantics of secondary sectoral industries in the GBA. Research by Caragliu et al. (2016) suggested that specialization agglomerations are shown to be more formidable for the less populated areas, whereas diversity effects are more influential in denser urban regions. A similar conclusion is reached by our case study that the specialization agglomerations are ascertained more concentratedly in peripheral GBA with lower population density. These agglomerations generally contain large proportions of keywords about low-tech specialized products or manufacturing activities. Our observation is consistent with what has been found in previous work by Greunz (2004), suggesting that low-tech industries with more conventional and standardized production can reap more benefits from Marshall specialization economies. Taking an example, industrial spaces labelled as the garment and footwear productions probably consist of interrelated manufacturers and firms, by the means of commonalities and complementarities. On the other hand, diversification agglomerations are found in the populated areas surrounding central megacities of GBA that cover a wide range of industrial divisions. This makes it possible to offer miscellaneous productions and services, guiding the growth of metropolitan economies. Furthermore, industrial functions shown inside diversification agglomerations can provide an essential context for knowledge spillovers. In this regard, knowledge spillovers allow people in one industry to learn some cross-discipline knowledge from other industrial practitioners (Strange, 2008). Compared to the usage of predefined industrial categories, our analytical results go beyond previous studies, by illustrating that semantics can reveal more abundant and nuanced information about industrial functions.
Some limitations need to be noted. One concern related to the findings of the spatial organization is that primary industries like forestry, plantation and mining activities may involve land-intensive productions. In this regard, their spatial extents are difficult to be reflected by point events using kernel density estimation (Sheather and Jones, 1991). Besides, solely depending on the use of POIs may overlook some details of the intensity of industrial activities. For instance, some transactions, employment or profit by local companies are ignored. In this regard, regional statistical data, such as industrial value, patterns and employment data should be jointly considered to support the further exploration of industrial intensity. Another limitation of this case study is that we only, respectively, investigate the spatial and functional characteristics of sectoral agglomerations. However, given a certain industrial sector, latent relationships among identified agglomerations may contain some potential implications and are not inspected in our study. Further research with more focus on the interplay among agglomerations is therefore suggested.
Practical implications
The contributions from this study are essential to not only theoretical literature but also practical implications. The empirical evidence has yielded valuable insights for policy formulation and implementation. First, controlling for economic sectors, we identify significant spatial heterogeneity regarding concentration of human activities, which are related to locational advantages. These advantages can be attributed to location-specific natures, regional policies, land use issues and others (Faggio et al., 2017). The manufacturing industry favours rural areas such as northern Shenzhen, western Guangzhou and peripheral GBA due to the lower land cost, adequate labour and proximities to flourishing markets. In this sense, assuming strong preferences for such specific activities, these findings can provide regional policymakers who are interested in both economic development and secondary industries with additional incentives for manufacturing activities.
Second, by extracting functional characteristics from identified agglomeration, the functional heterogeneity is also reported in our case study. Findings are interesting. Results from the primary sector clearly demonstrate the attractiveness of horticulture in urbanized spaces, while quaternary industries located in Shenzhen exhibit strong propensity for ICT productions. More importantly, manufacturing activities display disparate functional tendencies that specialization agglomerations locate in less populated areas, whereas diversified industrial agglomerations are more influential in denser urban regions. Taken together, our research findings suggest that policymakers and planners should have more targeted development plans to enhance the industrial agglomerations in specific areas in the same economic sector. Therefore, it is recommended that locally tailored strategies for agglomerations can be proposed based on their spatial and functional information. For instance, local policies in manufacturing agglomerations should be tailored to facilitate the upgrade process of conventional manufacturing modes.
Finally, moving to the megaregional scale, the tendency of cross-regional agglomerations suggests that an in-depth collaboration among GBA cities is requisite to promote regional economic development. As the results reported, there are some homogeneous competitions of industrial activities in the places with different city tiers within GBA, such as the clothing and electronic industries. In this context, it is worth noting that questions like how to avoid such peer competitions in conventional industries with misallocation of resources and enhance spatial and functional collaborations among cities are a long-standing consideration and should be addressed in the future.
Supplemental Material
sj-pdf-1-epb-10.1177_23998083221075641 – Supplemental Material for Spatial and functional organizations of industrial agglomerations in China’s Greater Bay Area
Supplemental Material, sj-pdf-1-epb-10.1177_23998083221075641 for Spatial and functional organizations of industrial agglomerations in China’s Greater Bay Area by Zidong Yu, Jinyan Zu, Yang Xu, Yimin Chen and Xintao Liu in Environment and Planning B: Urban Analytics and City Science
Footnotes
Declaration of conflicting interests
The author(s) declared no potential conflicts of interest with respect to the research, authorship, and/or publication of this article.
Funding
The author(s) received no financial support for the research, authorship, and/or publication of this article.
Supplemental material
Supplemental material for this article is available online.
Author Biographies
References
Supplementary Material
Please find the following supplemental material available below.
For Open Access articles published under a Creative Commons License, all supplemental material carries the same license as the article it is associated with.
For non-Open Access articles published, all supplemental material carries a non-exclusive license, and permission requests for re-use of supplemental material or any part of supplemental material shall be sent directly to the copyright owner as specified in the copyright notice associated with the article.