
Abstract
Nighttime vitality has garnered attention in recent years as an important indicator reflecting urban economy and quality of life. However, it is difficult to characterize this intangible issue. As a response, this study employed a data-driven approach to measure nighttime vitality and explored its relationships with urban spatial structure. Specifically, the data from Meituan.com—the largest Chinese shopping platform for local consumer products and retail services—were used to measure nighttime vitality based on a hierarchical weighting method. Multidimensional characteristics of the urban spatial structure were evaluated. Spatial regression models were conducted on the effect analysis of urban spatial structure on nighttime vitality. Relationship estimations were statistically significant with indicators, such as block functions, building density, interaction density, enclosure of locals, and the age structure of the main population. Our findings provide a more complete understanding of nighttime vitality, which is often overlooked in urban vitality studies. Insights derived from this study could help formulate spatial strategies to enhance nighttime vitality and quality of life.
Introduction
Nighttime vitality refers to the capacity of promoting lively social and economic activities at night, which can be stimulated by the interactions between human and built environment (Jacobs 1961; Ye et al., 2018). Nowadays, seeking a more vibrant urban place has become a key issue of sustainable urban development (Braun and Malizia 2015). However, China’s early urbanization characterized by rapid but low-quality expansion inevitably resulted the decreasing of vitality (Williams et al., 2019; Yue et al., 2021). Particularly in COVID-19 epidemic, the decline in night lights representing night economy was observed worldwide (Xu et al., 2021). Therefore, measuring nighttime vitality and influencing factors is conducive to building a livable environment (Chen et al., 2019; Lan et al., 2020; Wu et al., 2018a).
Nighttime has often been overlooked in urban studies (Van Liempt et al., 2015). Time, as an important characteristic of the urban vitality, should be as important as space (Xia et al., 2021). A series of empirical studies show that nighttime vitality can’t be generalized by daytimes for the specificities in psychological and emotional factors and environmental factors (Edensor 2015; Morris 2011; Saraiji et al., 2016). The aggregations and movements of the population during the daytime are mainly affected by commuting, daytime vitality is more stable and easier to recognize (Lin and De Meulder 2012). By comparison, nighttime vitality can better reflect the residents’ night-life style, relieve trivial work and everyday worries, which can transform the intense earning patterns of the day into relaxed spending patterns of the evening. The differences between nighttime and daytime vitality are not only temporal, but also social and environmental dimensions (Kim 2020). In addition, the spatial variations of nighttime vitality depends much on the destinations that are selected by the residents’ subjective perception (Pan and Du 2021). Therefore, it is necessary to find an appropriate proxy to represent the nighttime vitality. Thanks to recent emergence of large-amount of geodata, scholars obtain the capacity to improve the measurements of nighttime vitality within a finer scale.
Urban spatial structure is the expression of the relationships and interactions among the physical environment, functional activities, social-economic development, and population movement (Anas et al., 1998; Krehl 2015). The two-dimensional (2D) indicators contain land use, population distribution, arrangements of buildings and road networks. As the carrier of residents' daily night activities, urban spatial structure is highly linked with urban vitality (Chen et al., 2019). Although several studies have identified the effects of urban spatial structure on vitality (Lan et al., 2020; Mouratidis and Poortinga 2020; Zhang et al., 2020), they are not fully applicable for nighttime vitality. For example, street functions have a default effect for daytime use, rather than 24 h a whole day (Song and Siu 2011). Besides, the subjective perception of residents from the three-dimensional (3D) environment is rarely analyzed in related studies. The influence mechanisms of nighttime vitality are still unclear.
Taking Shenzhen, China as a case, this study aims to develop a data-driven approach to measure nighttime vitality and explore the effects of urban spatial structure. Our work aims to: (1) design a new and reasonable method to quantify the intangible concept of nighttime vitality; (2) extend the indicators of urban spatial structure from a 3D perspective; (3) explore the quantifiable relationships between the urban spatial structure and nighttime vitality. The findings would help urban policymakers and planners to improve living environment and develop nighttime economy.
Conceptual definition and related works
Nighttime vitality: its definition and characteristics
After a long discussion since 1960s, the definition of urban vitality has become gradually clarified as human activities and social interactions related to building environment (Jacobs 1961; Montgomery 1998; Ye et al., 2018). Nevertheless, different performances between urban vitality and nighttime vitality are still missed. Recent empirical studies show nighttime vitality cannot be equivalent with urban vitality as the former one has a strong temporal feature (Kim 2020; Van Liempt et al., 2015). For the further definition of this issue, this study adds a time limit, namely the period between 6 p.m. and 6 a.m. (Beer 2011). In addition, 10 p.m. is used to distinguish the early and late nighttime periods considering frequently closing time of shops.
Nighttime vitality has unique socio-economic, demographic and environmental characteristics that should be considered in analyzing the influencing mechanisms of nighttime vitality. The mainly activities occurring at night are production or consumption behaviors in service industries, including catering, shopping, recreation, and fitness, which is the main socio-economic characteristic of nighttime vitality (Bianchini 1995). The demographic characteristic of nighttime vitality is also obvious as the young generation is the “main force” stimulating nighttime vitality (Chatterton and Hollands 2002; Van Liempt et al., 2015). External factors, such as infrastructure and urban management, tend to perform differently during day and night (Song and Siu 2011). Finally, due to the absence of sunlight, nighttime vitality depends more on residents' perception of environment including comfort and safety (Young and Farber 2019).
Measuring nighttime vitality with multi-sourced urban data: achievements and limitations
The emergence of new multi-sourced urban data has provided detailed spatial-temporal records about human activities, which can inspire us to study nighttime vitality. For example, Wu et al., (2018a) and Chen et al., (2019) both used social media data to reflect the temporal variations of human mobility and aggregation. Xia et al., (2020) adopted the small catering business data and night-time light data to distinguish daytime and nighttime vitality. Meanwhile, night light remote sensing imagery has been applied as a proxy for nighttime vitality (Zhang et al., 2021). In addition, mobile phone activity has been applied to measure pedestrian activities as an indicator of nighttime vitality (Kim 2020; Yang et al., 2021).
These above studies have proven that vibrant places are spatially different between day and night (Zhang et al., 2020). Nevertheless, existing works still left several limitations. There are significant relationships between nighttime light and population density or economic level, while they are also uncertain (Briggs et al., 2007). That is, the places with brightest lights are sometimes not the most populous and economically developed places. In addition, the social media check-ins and mobile phone data inevitably have problems including accuracy and sampling bias (Yuan and Wang 2018). Therefore, it is necessary to introduce new data and methods as more effective and direct indicators measuring nighttime vitality.
Urban spatial structure and vitality: achievements from a 2D perspective
Lists of some studies on urban vitality and its influential factors.

The emergence of street view images: possibility of human perception
Street view images, as a new data source reflecting the human perception of environment, has been gradually applied in urban studies (Tang and Long 2019; Yao et al., 2019). Meanwhile, deep convolutional neural networks provide technical support for efficient image information recognition. Street view images has been used to evaluate the safety perception of street (Larkin et al., 2021), green visibility (Long and Liu 2017; Wu et al., 2022), walkability (Su et al., 2019), and visual quality (Ye et al., 2019b). Human perception is an important component for evaluating urban spatial structure (Jiang et al., 2022). To date, indicators related human perceptions of local environment are rarely considered in analyzing nighttime vitality.
Current gaps and our study
Most studies related to nighttime vitality have the following limitations: (1) an efficient and objective indicator is needed to measure nighttime vitality; (2) human perceptions of environment are rarely quantified in the studies of nighttime vitality; (3) the influencing mechanisms of urban spatial structure on nighttime vitality remain unclear. As a response, this study quantitatively measures the nighttime vitality using Meituan data, evaluates the urban spatial structure with empathizing human perception, and reveal urban spatial structure-nighttime vitality nexus comprehensively.
Methodology
Research design
Figure 1 depicts the methodological workflow of our study, specifically: (1) collecting and processing of multi-source urban data, including Meituan, road network, and street view images; (2) measuring nighttime vitality of two periods and evaluating the multi-dimensions of urban spatial structure; (3) adopting a spatio-temporal pattern analysis and spatial regression modeling to mine the distribution of nighttime vitality and determine the relationship with urban spatial structure; and (4) providing implications for stimulating nighttime vitality and better design. The methodological workflow of the study.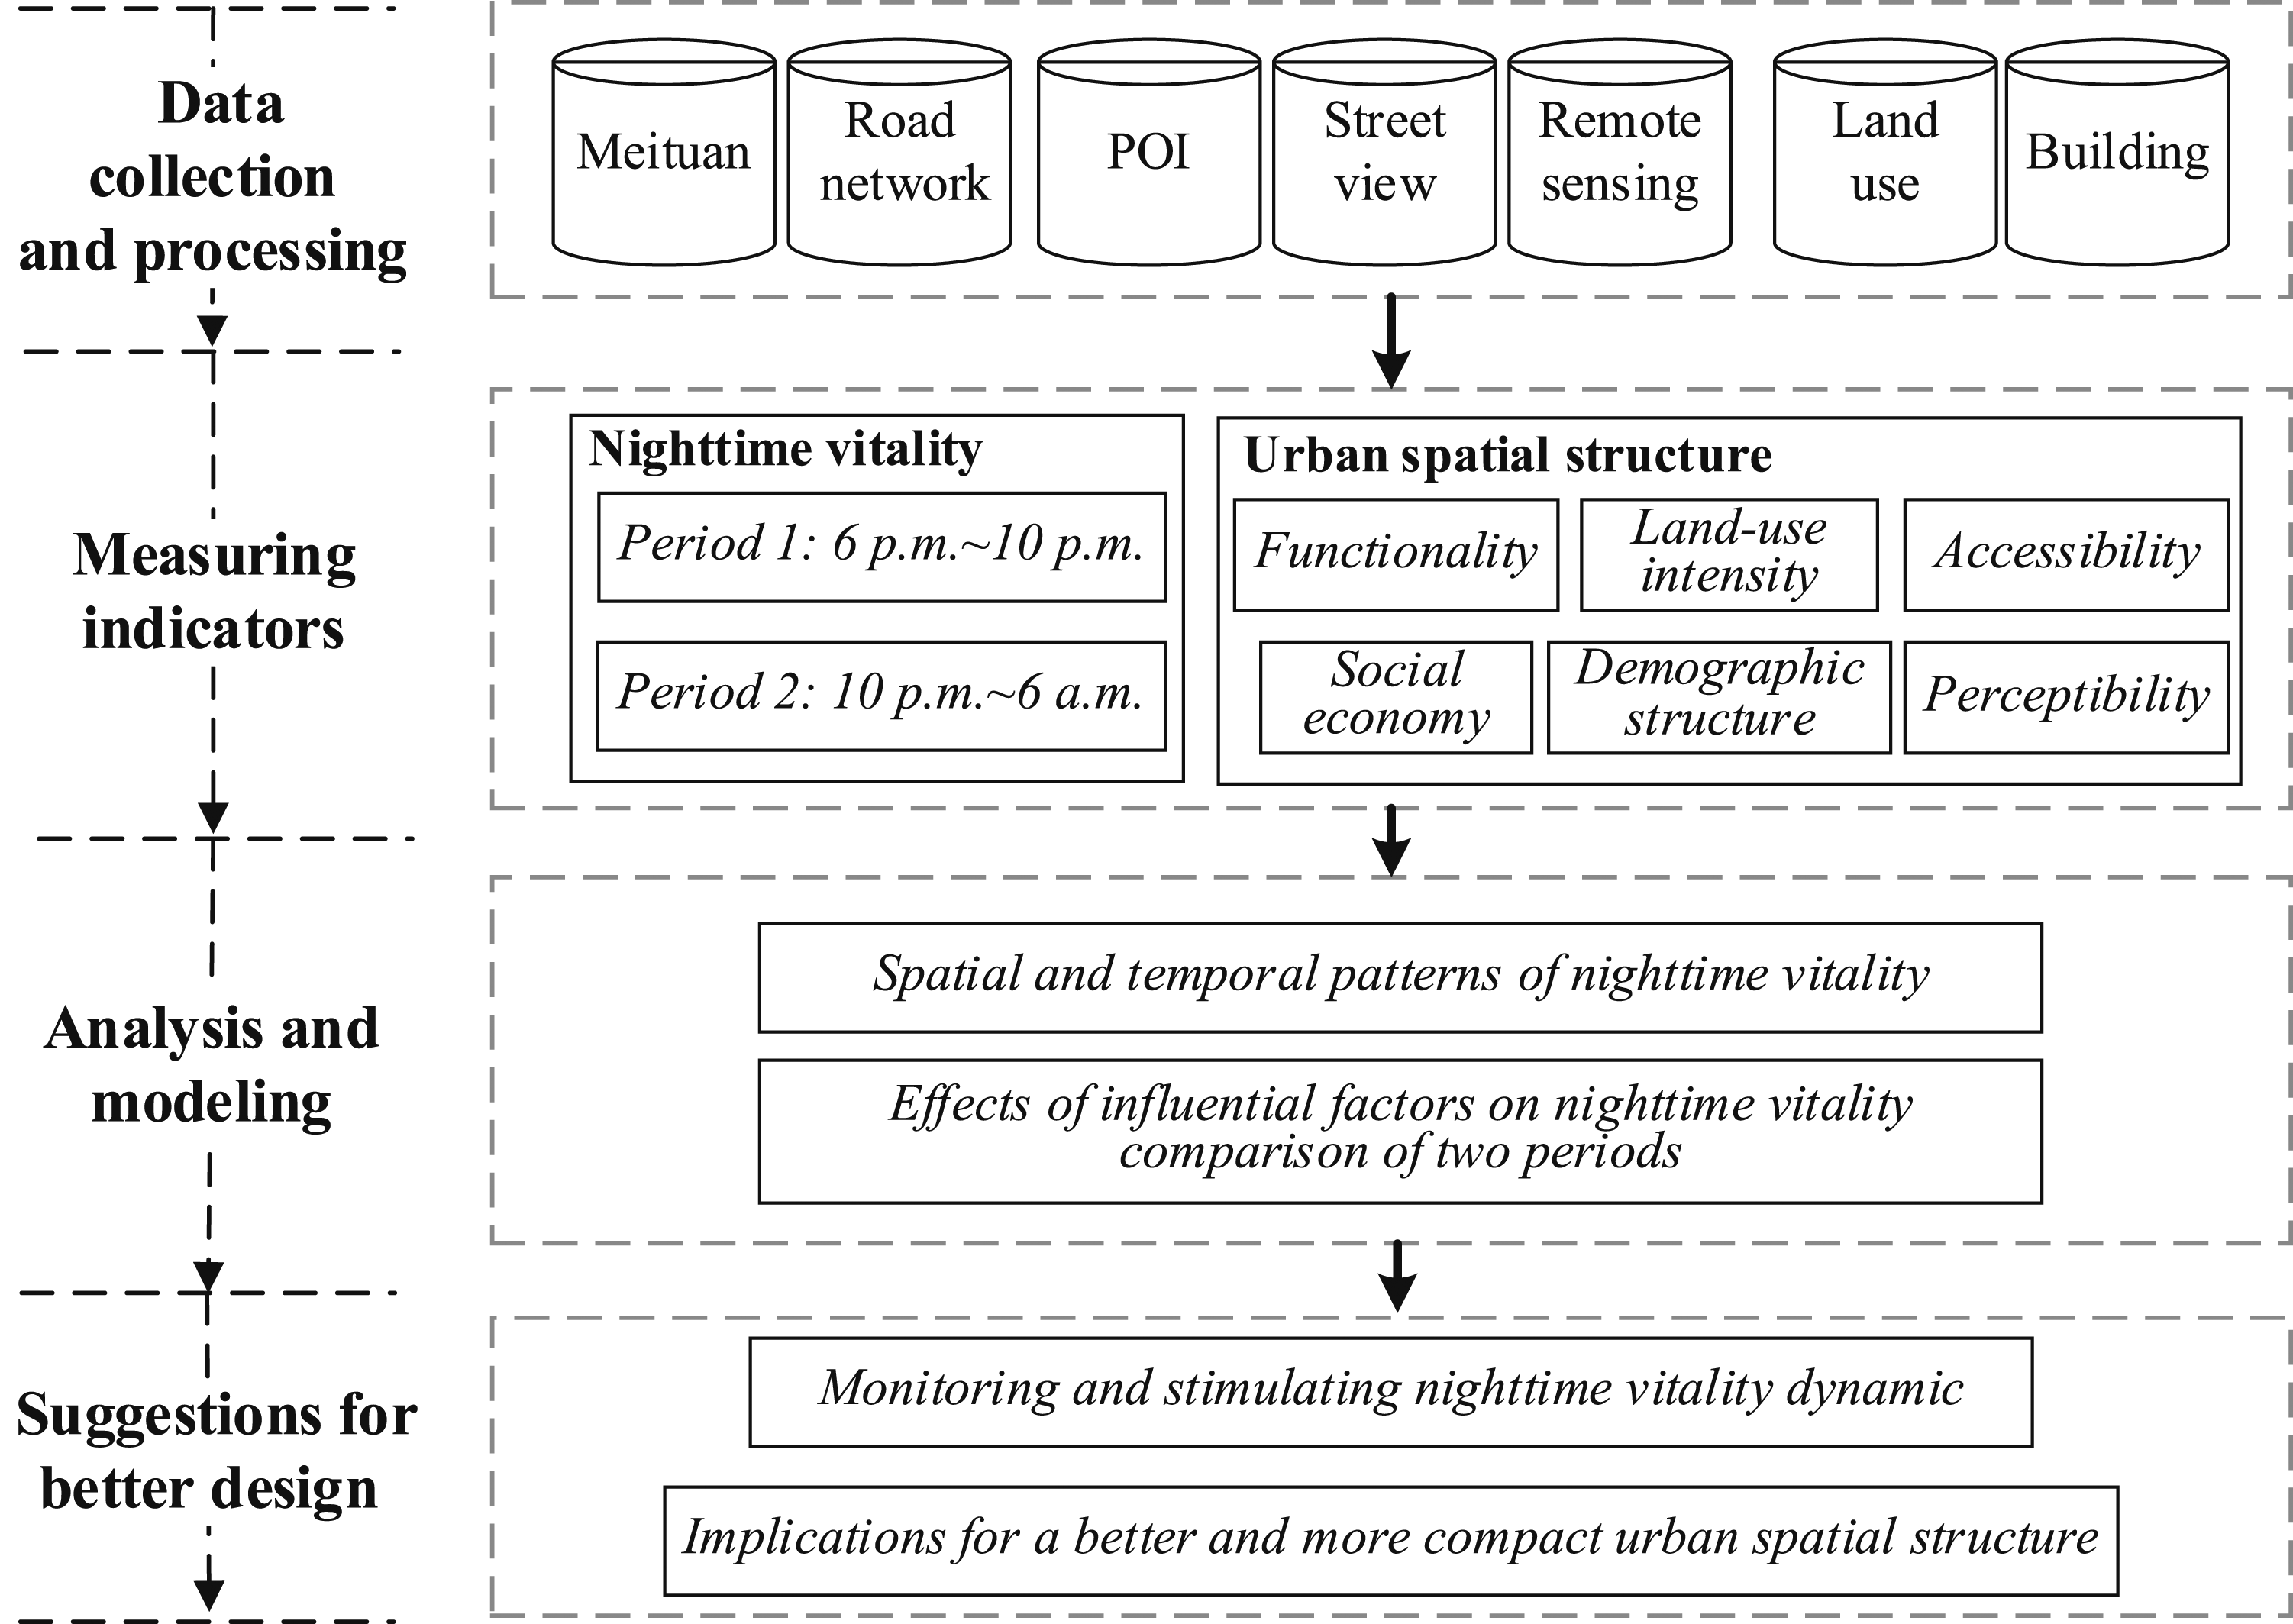
Study area and data description
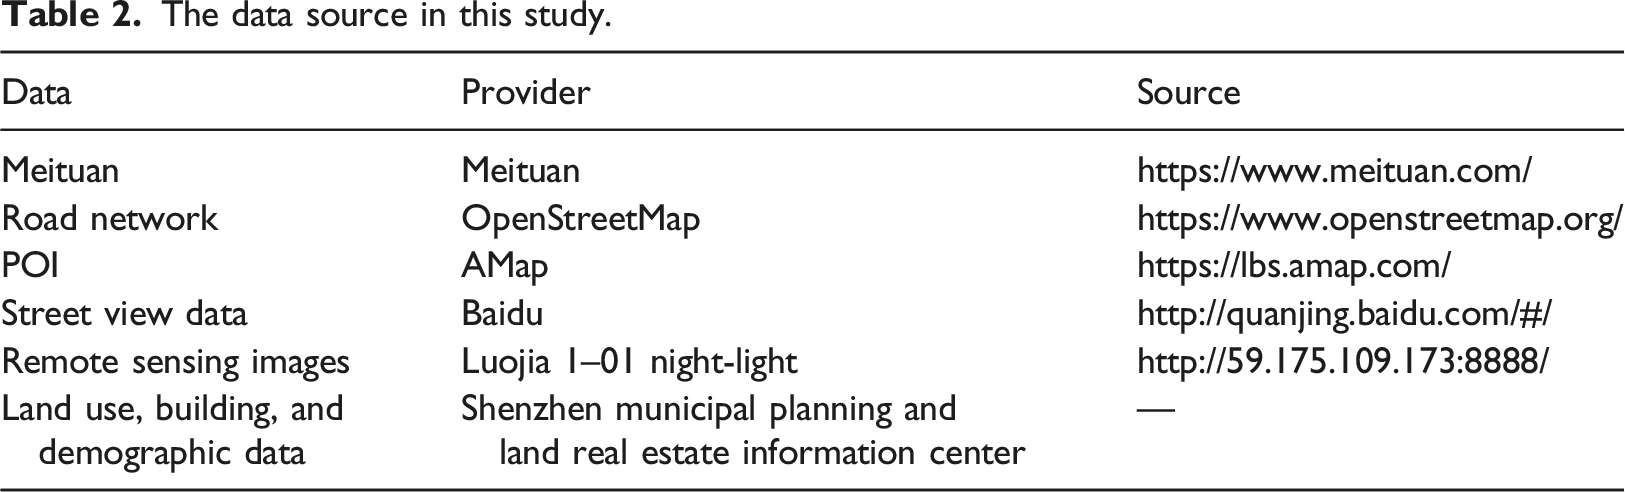
The data source in this study.
Measuring nighttime vitality using meituan
Meituan, known as the Chinese Yelp, records tags and geographic information. Data attributes, including POI categories and business hours, can better reflect the interaction information and contribution intensity of nighttime vitality. Considering the daily habits of Chinese residents (especially the best sleeping time) and the frequently opening hours of shops, 6 p.m.–10 p.m. and 10 p.m.-6 a.m. were selected as the early and late nighttime periods, respectively (Beer 2011; Lin et al., 2021).
Following previous studies, a hierarchical weighting method was proposed to measure nighttime vitality based on the POI categories and business hours (Figure 2). The demand tags were set to reflect humans–environment interactions, including food, shopping, leisure, and life services. This study set the level 1 weight according to the demand tags of business shops. The importance rankings of four categories were obtained through a questionnaire survey conducted by researchers and professionals in related fields (Appendix A). Then, analytic hierarchy process (AHP) was used to determine the level 1 weight of the four category services (Appendix B). The level 2 weight was calculated based on the business hours of shops. For each additional business hour, the level 2 weights were increased by 1. Finally, the nighttime vitality of blocks was calculated based on the density of the weighted shops. The process of the hierarchical weighting method.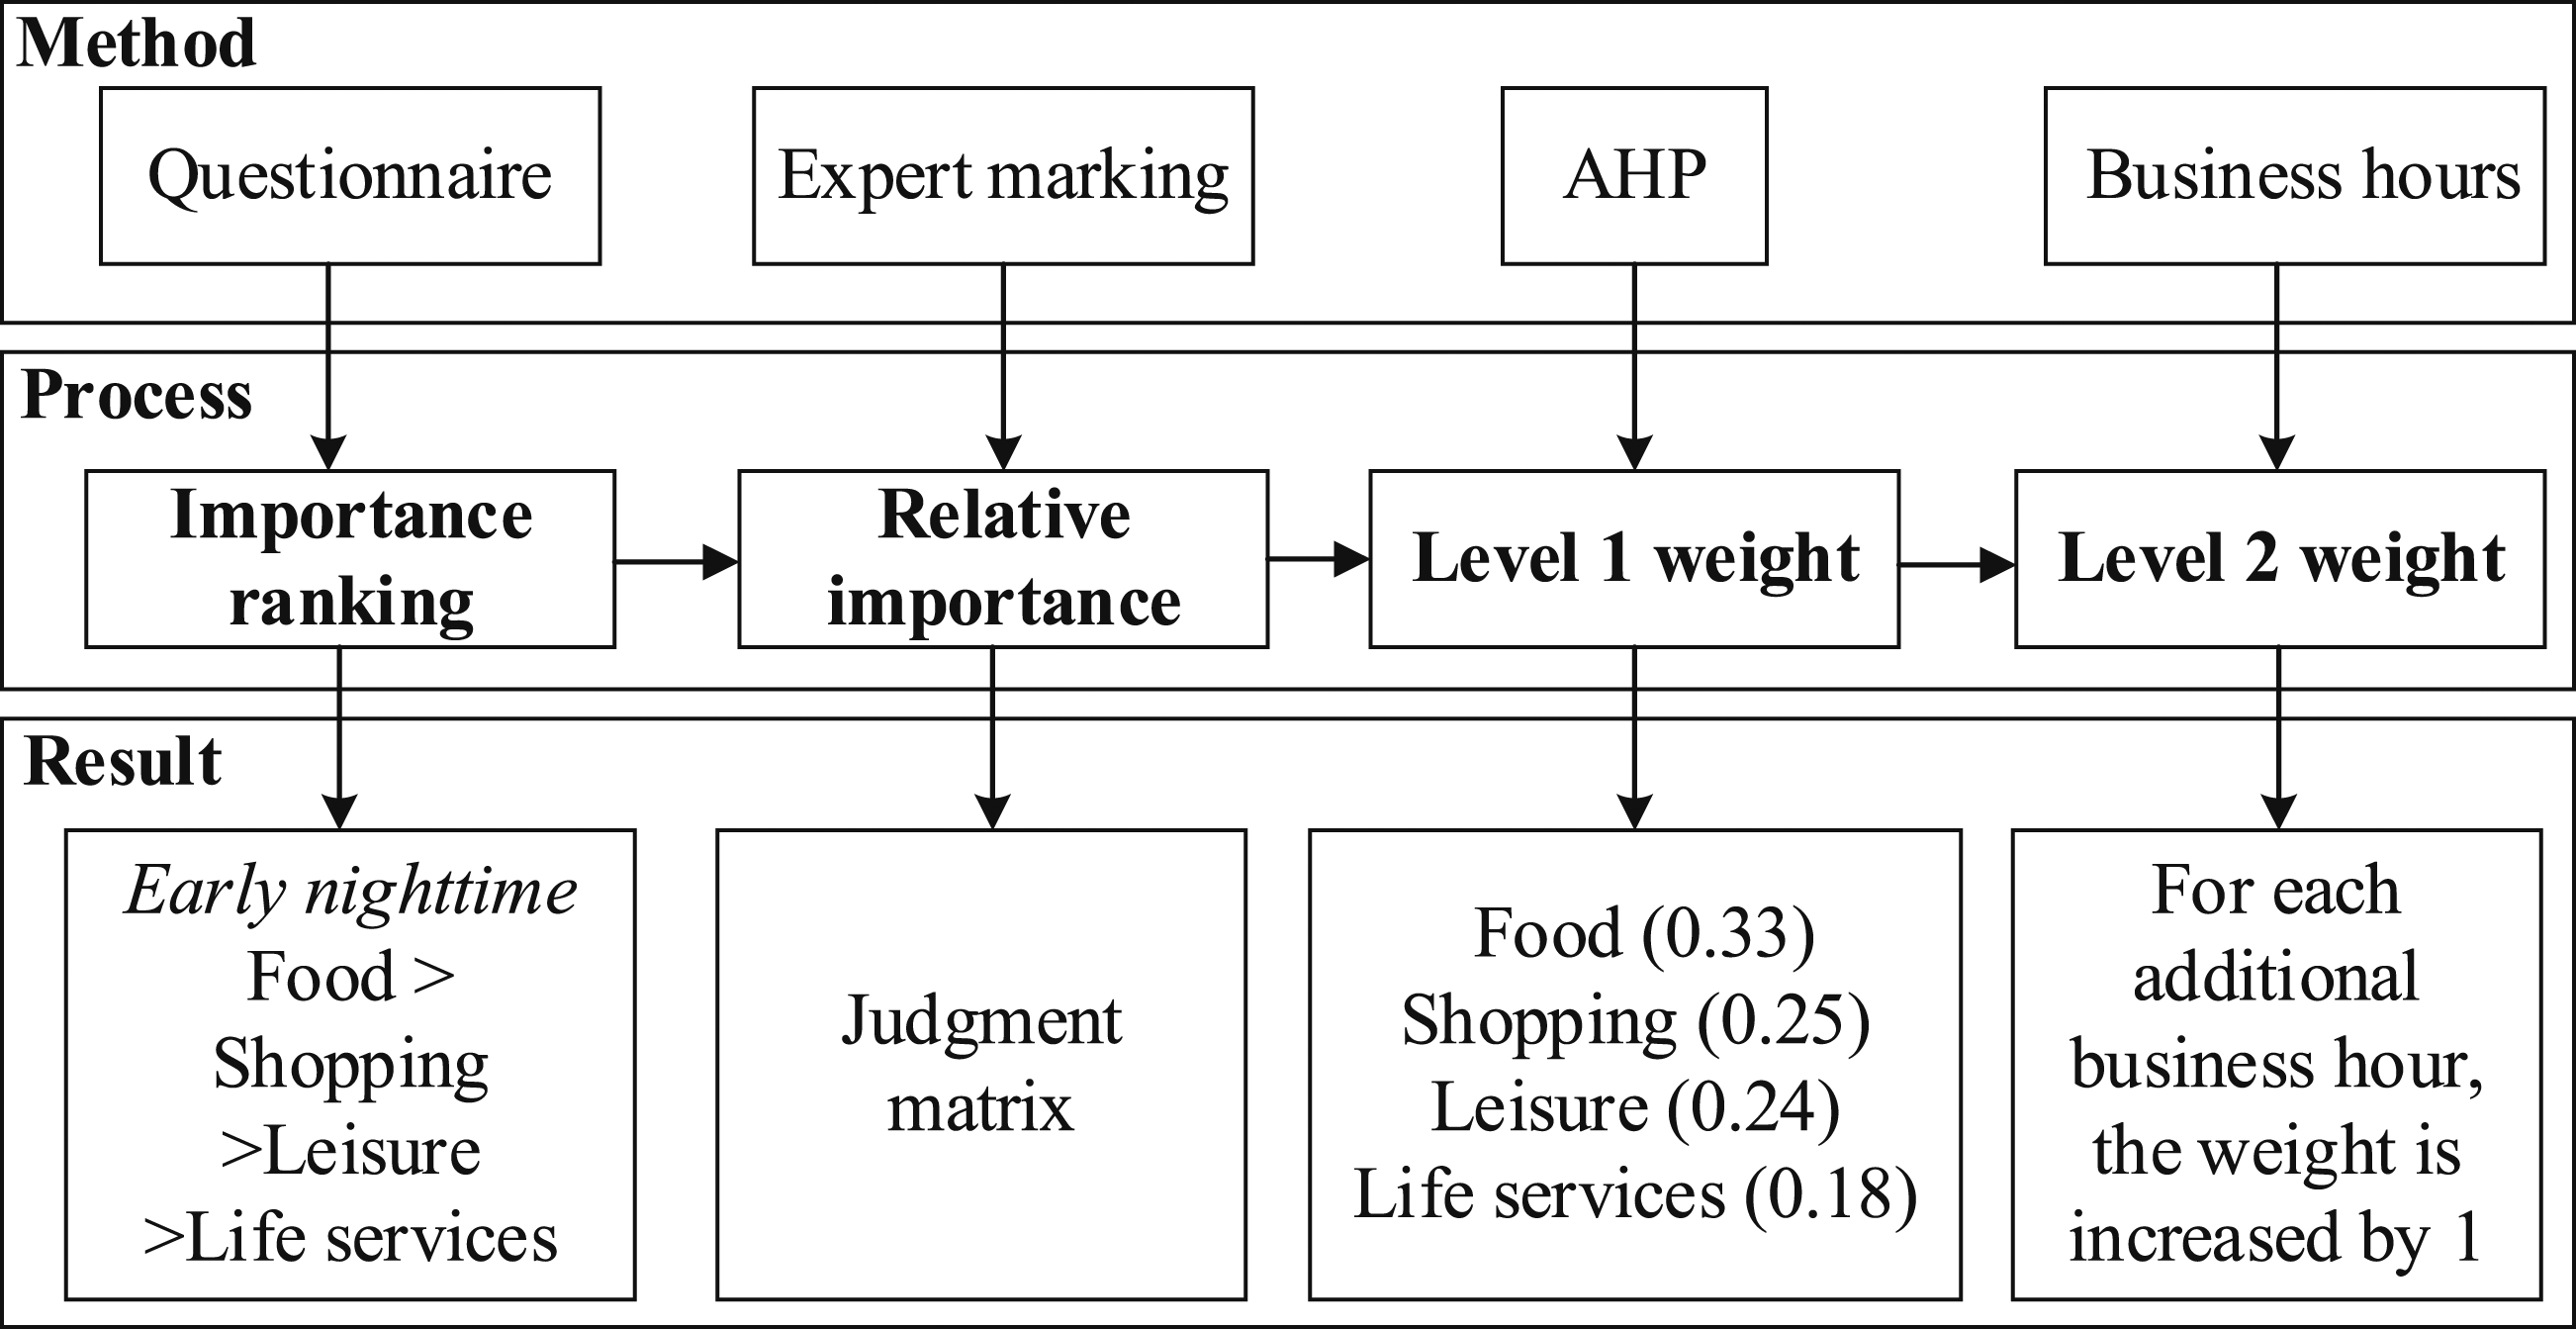
Selection of exploratory indicators
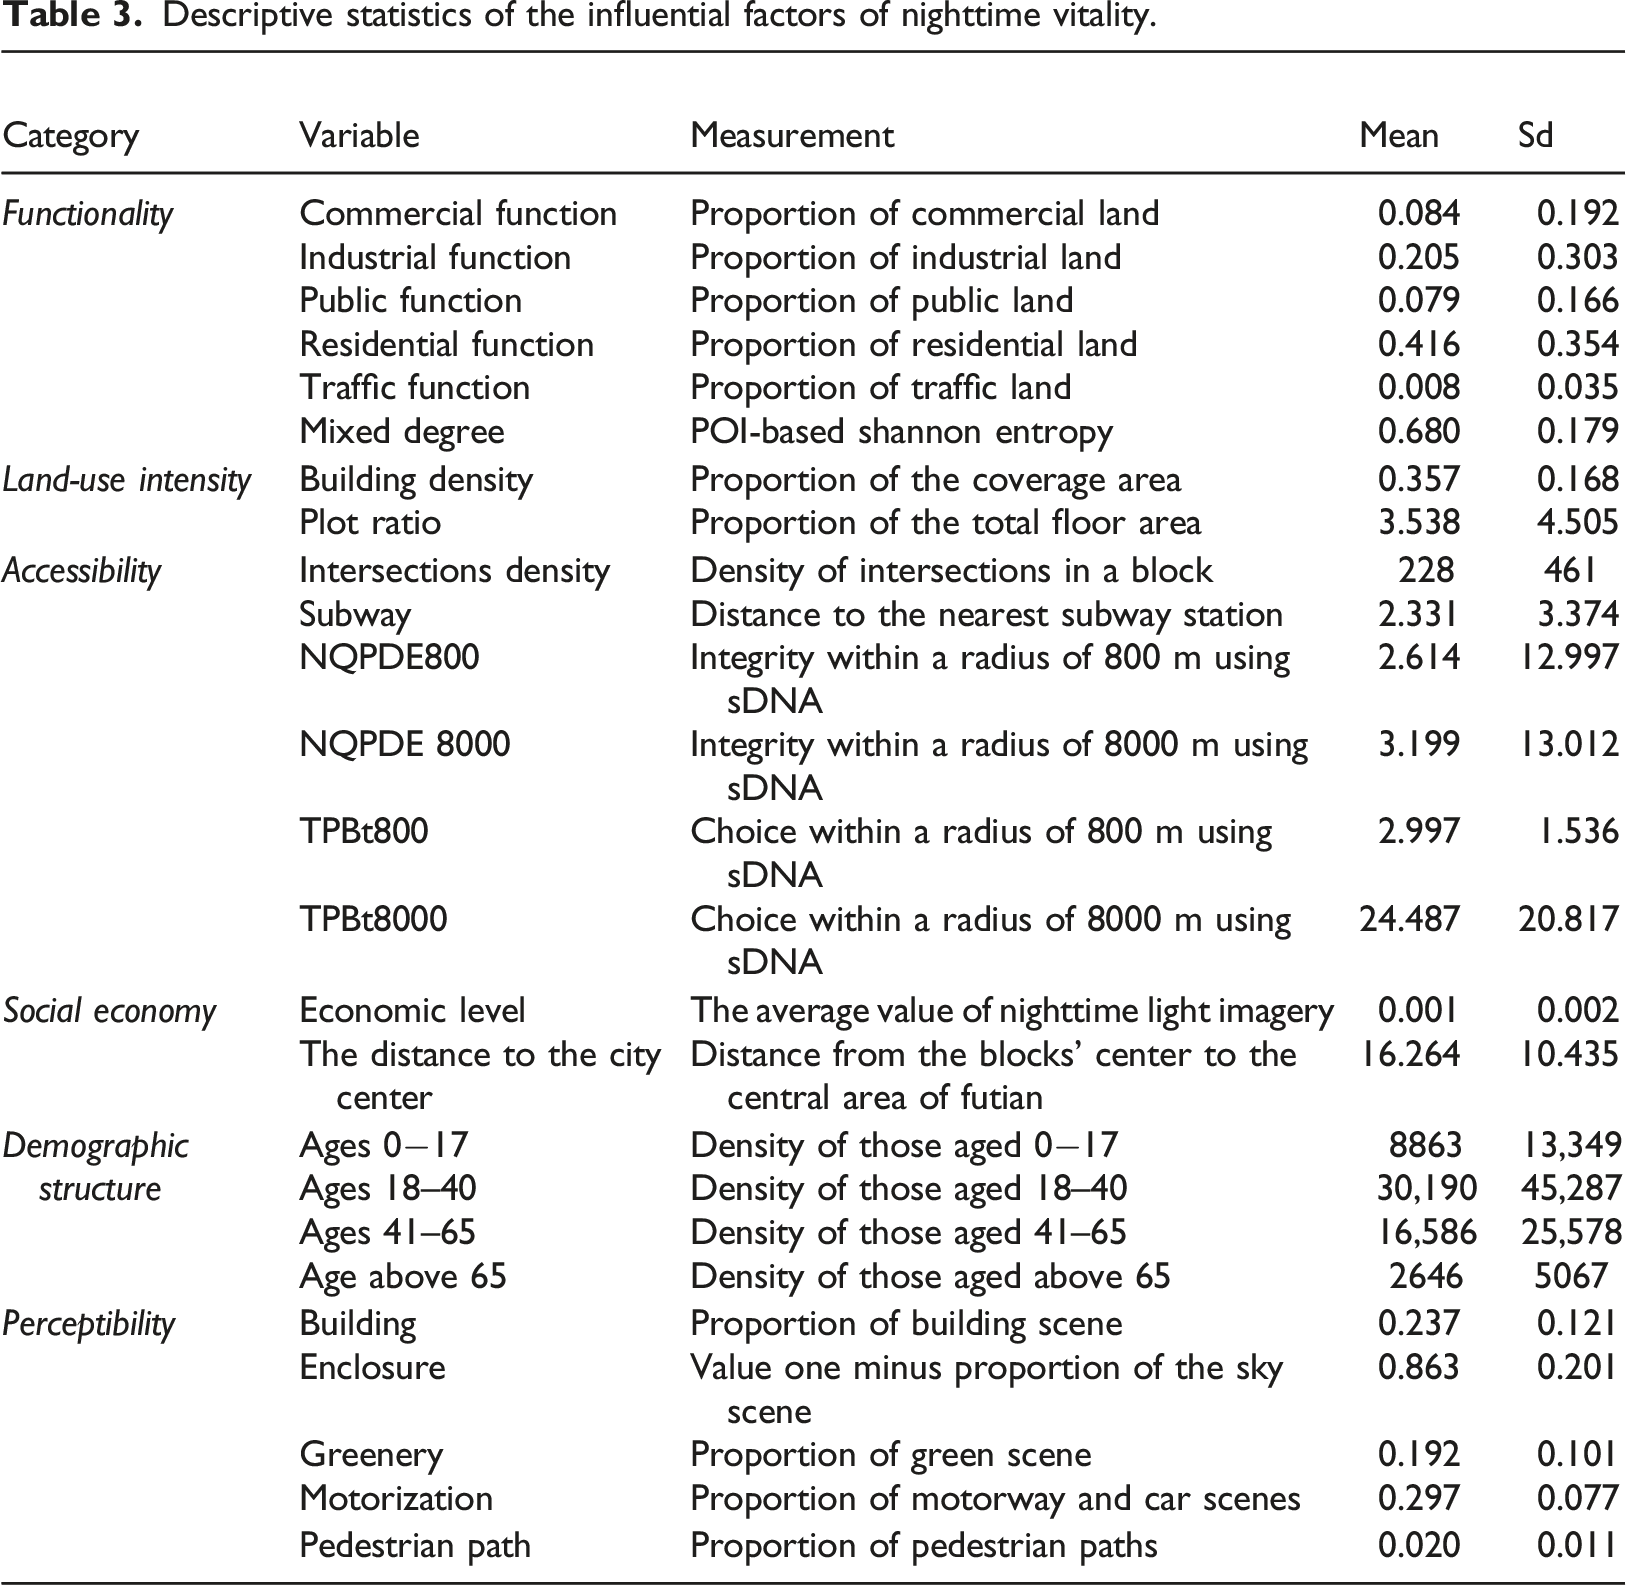
This study comprehensively elaborated the urban spatial structure from dimensions of functionality, land-use intensity, accessibility, social economy, demographic structure, and perceptibility. Functionality herein reflects the spatial organization of different land uses and the diversity of utilization (Vanderhaegen and Canters 2017). Functionality was measured by the proportion of commercial, industrial, public, residential, and traffic functions in the block as well as POI-based mixed degree. Appropriate land-use intensity ensures that the blocks can be used by residents with sufficient density during certain periods, which was measured by building density and plot ratio. Accessibility refers to the traffic convenience of the block, which was quantified by the density of intersections, distance to the subway, choice and integrity. Based on spatial design network analysis (sDNA), the tools of two phase betweenness (TPBt) and network quantity penalized by distance (NQPD) were used to calculate the choice and integration within a range of 800 m and 8000 m (TPBt800, TPBt8000, NQPDE800, and NQPDE8000). Social economy included indicators of economic development measured by Luojia 1–01 night-light data and the distance to the city center. Demographic structure included the density of residents aged 0−17, 18–40, 41–65, and above 65. Perceptibility denoted residents’ perceptions and experiences for built environment, such as comfort and safety. The indicators related perceptibility was measured by the street view image using SegNet algorithm (Badrinarayanan et al., 2017). This algorithm helps to identify the road, building, sky, greening and other factors in street view images and calculate them according to the proportion (Wu et al., 2020). For example, the variable of enclosure is calculated as following
Spatial error model
In this study, spatial error model (SEM) is used to explore the relationships between nighttime vitality and urban spatial structure (Elhorst 2003). For SEM, the existence of spatial dependence does not directly affect the structure of the regression model but is shown by the error term. SEM is specified in equation (2)
Results
Spatial distribution of nighttime vitality
The spatial distribution of vitality in early and late nighttime (Figure 3) reveals an obvious downward trend in later nighttime. Most of the street blocks with high nighttime vitality are in the south of Shenzhen, while nighttime vitality is relatively low in the west-northern areas, with only a few blocks of relatively moderate activity. The nighttime vitality of street blocks show a clear north-south difference. The obvious dual structure inside and outside the original special zone still exists. Global Moran’s I test was used to evaluate the spatial autocorrelation of nighttime vitality, with the values being 0.261 and 0.239 for two periods. These results indicate that nighttime vitality of the two periods showed significant spatial autocorrelation: the larger the spatial distribution of the aggregation of blocks, the more active the nighttime vitality. Furthermore, we have conducted interviews experts with professional degree in urban planning and related disciplines to ensure the validity of results of nighttime vitality distribution. The overall spatial distribution patterns of nighttime vitality measured based on interviews and Meituan data has been verified. Spatial distribution of vitality in early and late nighttime.
Bivariate local Moran’s I method was also used to reveal the coupling relationship between vitality in early and late nighttime. A high and positive bivariate local Moran’s I suggested high-high clusters (H-H) or low-low clusters (L-L). A high, negative bivariate local Moran’s I implied spatial outliers including high-low outliers (H-L) and low-high outliers. The H-H clusters means that both the target block and its neighborhoods in two periods have high nighttime vitality. Figure 4 reveals that the spatial patterns of vitality in two periods are similar. In addition, we also show blocks in some regions with H-H relationship, such as in the Yuehai (A), Huaqiang North and Nanyuan (B), Guiyuan (C), Shatoujiao (D), Xin’an (E), Gongming (F), and Longcheng (G) sub-districts. These areas reflect typical regions with high nighttime vitality. In Yuehai sub-district in Nanshan district, known as China’s Silicon Valley, there are several famous high-tech enterprises, such as Huawei and Tencent. The “nine-nine-six” work mode has become a popular corporate culture and even a mandatory rule in China’s high-tech industry (Xiao et al., 2020). Shatoujiao sub-district in Yantian district is an important export processing base and trade center in the east of Shenzhen. The Special Border Management Area is open 24 h, which is the main reason for the high nighttime vitality. The Huaqiang North and Dongmen sub-districts belong to two famous business districts in Shenzhen that are fully equipped with commercial service facilities (including KTV, 24-h restaurants, convenience stores, and bars). Most of these areas are Shenzhen’s central business districts, high-tech industrial parks, and scenic spots, indicating that our proposed method can effectively identify diverse functional forms with high level of nighttime vitality. Spatial distribution of spatial clusters and outliers.
Relationships between influential factors and nighttime vitality
First, the multicollinearity between independent variables was determined based on the value of variance inflation factor (VIF). Variables with a VIF value greater than 10 were removed, including the variables of NQPDE8000, motorization, and ages 0–17. Then, ordinary linear regression and spatial lag regression models were implemented to analyze the nighttime vitality for early nighttime and late nighttime, respectively (Appendix C). The tests of Breusch-Pagan and Koenker-Bassett and Jarque-Bera proved the heteroscedasticity and non-normality of residuals in the ordinary linear regression. Moreover, spatial autocorrelation diagnosis showed that there was a high degree of spatial autocorrelation. Therefore, SEM was employed to analyze nighttime vitality for early nighttime (Model 1) and late nighttime (Model 2).
Descriptive statistics of the influential factors of nighttime vitality.
The main land use and functional diversity of blocks have significant impacts on spatial-temporal variations of nighttime vitality (Xia et al., 2020). For early nighttime, all variables related to block functionality showed significant effects on nighttime vitality. While proportions of residential and commercial land and POI mixed use had positive effects on vitality, proportions of traffic, public and industrial land have negative effects. For late nighttime, the most obvious difference is the variables of functional diversity. The effect of functional diversity in late nighttime was not significant. It was related to the demand for night-time consumption (García-Palomares et al., 2018). Land-use intensity including high building density and plot ratio tends to increase nighttime vitality, which proves that compact and concentrate urban form meaning convenience and efficiency for residents can be conducive to the vitality.
All variables related to accessibility significantly impact nighttime vitality, except for the variable of subway in late nighttime. The main reason is some subway lines close between 10 p.m. and 11 p.m. Intersection density and TPBt800 showed positive effects on nighttime vitality. The mobility at night, the attraction of local environment and the sense of security are more dependent on the accessibility and convenience of transportation, mainly due to the lack of sunlight (Mahmood et al., 2012). The variable of economic level shows no significant effects on nighttime vitality, which might be explained as the economic level and interaction level are different aspects of nighttime vitality (Tu et al., 2020). The distance to city center shows a significant negative effect. Although Shenzhen has developed on a multi-center urban planning pattern, the role of the city center is far-reaching. The city center of Shenzhen still attracts high level of nighttime activity. It is also worth noting that the variables of ages 18–40 and ages 41–65 effectively improves the nighttime vitality of blocks, suggesting that residents of this age group are the main actors at night. Studies have proved that the young consumer groups have become the main force to promote the development of the night vitality (Hadfield 2015). Contrarily, there is a significant negative relationship between population density of those aged above 65 and nighttime vitality, which is consistent with the living habits of older adults.
Finally, the perceptibility variables of building, enclosure, greenery and pedestrian path show significant but differing effects on nighttime vitality, which indicates that the necessity of human perception in studying nighttime vitality. Notably, there is a negative relationship between enclosure and vitality. This effect can be explained as the safety of the surrounding environment is an important factor for nighttime activities. Residents tend to prefer safer, more open, and less enclosed places (Shulin et al., 2014). Similarly, the variable of greenery also has negative effect on nighttime vitality. Although studies have shown that greenery can effectively improve the quality of the visual environment, many people prefer to avoid the areas with high greenery (especially the municipal parks) at night (Rahm et al., 2021).
Discussion
Spatial patterns of nighttime vitality and urban spatial structure
This study proposes a hierarchical weighting method to measure the nighttime vitality by emphasizing human-environment interactions. The proposed quantification method can identify nighttime vitality in diverse functional forms. Combined with the empirical demonstrations, our proposed method can effectively measure the nighttime vitality in a finer scale. Meanwhile, this analytical approach using Meituan data contains two advantages. First, the Meituan data is freely available, which allows the proposed measurement of nighttime vitality to be extended to other cities. Second, the store information, especially business hours collected from Meituan data can quantify nighttime vitality by reflecting the interaction between people and store entities.
As a dynamic and complex spatiotemporal issue, related factors of nighttime vitality are diverse and changeable. Our study demonstrates that nighttime vitality is significantly related to urban spatial structure. The variations of nighttime vitality can reflect spatial heterogeneously urban spatial structure, such as functionality and perceptivity. There is a significant relationship between urban spatial structure and nighttime vitality that varies across different periods of vitality. Thus, strategies for boosting nighttime vitality should be tailored to time. This discovery supports the argument that the improvement of nighttime vitality can depend on the optimization of urban spatial structure and efficient land use.
In terms of special classifications, Functionality variables that significantly improve nighttime vitality are proportion of residential and commercial land and diversity of POIs. Although it has become a consensus that land use mixing can improve urban vitality, this study finds that different land use mixing features would bring diverse effects on nighttime vitality. The positive effect of residential function increases faster than that of commercial function. Meanwhile, the proportion of industrial and traffic functions have negative effects on nighttime vitality. Therefore, it would be more effective to consider the land use types in the process of promoting nighttime vitality, compared with blindly emphasizing functional mixture. According to estimated coefficients above, keeping residential and commercial functions between 1:1 and 1:1.5 would bring an optimized positive effect for enhancing nighttime vitality.
Land-use intensity including density and plot ratio can enhance nighttime vitality. High building density and plot ratio can provide a richer choice of space use, while increasing the variety and capacity of continuous activities. The effects of variables related to accessibility are complex. Other variables such as intersection density and TPBtE800 show positive effects on nighttime vitality. In particular, the estimated coefficient between TPBt800 and nighttime vitality tends to increase after 10 p.m., which reveals the importance of pedestrian scale accessibility. The same result can be obtained from the estimated coefficient of Pedestrian path. Demographic structure is rarely considered in vitality studies while is important for improving nighttime vitality. The youth group is the main force of street life during nighttime. Perceptibility, including pedestrian path, greenery, building and enclosure, is important for improving nighttime vitality. Residents' subjective feelings also play an important role in nighttime vitality, and the preferences are closely related to destination choices at night. The sense of security and comfort of urban public spaces is an important quality of urban design that can affect vitality, especially at night.
Planning implications for stimulating nighttime vitality
Shenzhen is evolving from a monocentric to polycentric spatial structure. Our study of nighttime activities and interactions can provide a better understanding of urban spatial structure. The government and urban planners should pay attention to the existing high nighttime vitality districts, create an exclusive culture and consumption atmosphere among blocks, actively launch night blocks and products, constantly improve the night service function of the city, and further promote the night economy of the blocks as well as the city’s value. Blocks that lack nighttime vitality, especially in some new urban developments, also require attention. These “unpopular and depressing” blocks can provide valuable references for understanding whether they need to be revitalized or remain as they are.
Our results reveal that nighttime vitality of blocks is shaped heterogeneously by the deviations of urban spatial structure. More precise and nuanced interventions and strategies to simulate nighttime vitality, especially in north Shenzhen, are necessary. Planners and managers need to comprehensively emphasize the coordination of compact development, space quality, urban road network density, mixed land-use, and safety environment to achieve higher synergy and stimulate nighttime vitality according to local conditions. For example, in high-tech and industrial zones, the vertical mixed use of “rail transit land, commercial land, office and residential land” should be encouraged to promote the rational compound of block functions and the refinement and improvement of stock space. Moreover, planners should design small living circles within certain buffer zones of residential areas and implement open communities to achieve a “combination of dynamic and static” place. Some public places, such as parks and squares, can provide a buffer zone to overcome noise from nearby roads while ensuring accessibility. An optimal urban spatial structure stimulating nighttime vitality should also consider and integrate the perceptions of beneficiaries. Urban planners and policy makers should understand the importance of combing 2D and 3D indicators. Pedestrian path, greenery and outdoor lighting must be considered together, as their interaction affects residents' nighttime activities.
Conclusion
Emerging technologies and multi-source urban data are being developed at an unprecedented rate. They create new opportunities to study human dynamics, assess the urban physical environment, and inform human-oriented urban design (Ye et al., 2019a). This study paves the way for future avenues of research on nighttime vitality in a data-driven approach. Our findings can provide an in-depth understanding of nighttime vitality, economy, and living environment. The value of urban big data in studying population dynamics and living environments at the city scale is prominent in this study, which can fully support data-driven and evidence-based urban planning methods.
Although this study reiterates our inherent impressions about nighttime vitality, certain limitations should be overcome in future studies. First, because there are diverse views about urban nighttime vitality, such as population aggregation, the economic development, and the interaction between people and entities. Measuring nighttime vitality using a single indicator is not enough. Second, the performance of human-scale indicators are involved in the statistical analysis. Perceiving the safety and preferences of the local environment from the human perspective can further enrich relevant research. Finally, the pervasive nonlinearity and synergism of urban spatial structure on urban vibrancy should also be researched.
Supplemental Material
Supplemental Material - Measuring urban nighttime vitality and its relationship with urban spatial structure: A data-driven approach
Supplemental Material for Measuring urban nighttime vitality and its relationship with urban spatial structure: A data-driven approach by Chao Wu, Minwei Zhao and Yu Ye in Environment and Planning B: Urban Analytics and City Science.
Footnotes
Declaration of conflicting interests
The author(s) declared no potential conflicts of interest with respect to the research, authorship, and/or publication of this article.
Funding
The author(s) disclosed receipt of the following financial support for the research, authorship, and/or publication of this article: This research was funded by National Natural Science Foundation of China (41901326, 52078343), Natural Science Foundation of Jiangsu Province (BK20190742), Natural Science Foundation of Shanghai (20ZR1462200), Social Science Foundation of Jiangsu Province (21SHC005), and Fundamental Research Funds for the Central Universities (22120210540). We would like to express our appreciation for the editor and anonymous reviewers for the time and effort they have taken to provide such insightful guidance.
Supplemental Material
Supplemental material for this article is available online.
References
Supplementary Material
Please find the following supplemental material available below.
For Open Access articles published under a Creative Commons License, all supplemental material carries the same license as the article it is associated with.
For non-Open Access articles published, all supplemental material carries a non-exclusive license, and permission requests for re-use of supplemental material or any part of supplemental material shall be sent directly to the copyright owner as specified in the copyright notice associated with the article.