
Abstract
The COVID-19 pandemic has dramatically impacted our daily lives worldwide. For instance, pandemic-prevention policies restrict people’s mobility, which causes problems in accessing urban greenspaces. Indeed, unequal access to urban greenspace has been accentuated during the most stringent lockdowns of 2020 and 2021. Amid such challenging circumstances, there has been a growing attention placed on Sustainable Development Goal (SDG) 11.7, which has brought opportunities for urgent action. In this paper, we applied the Gini coefficient to our analysis of unequal access to urban greenspaces across all urban planning areas in six special municipalities in Taiwan. Moreover, we also conducted comparative analyses between the Gini coefficient and other socio-economic factors. The results show that approximately 63.98% of the urban planning area suffers from unequal access to greenspaces. In addition, urban greenspace provision and household income show significant positive correlations with the Gini coefficient, which reflects Taiwan’s environmental injustice. Furthermore, these findings can help city planners and decision-makers evaluate levels of equality in each urban planning area and decide which priority areas should be improved. Finally, this study can also be used as a reference for decision-makers to realise SDG 11.7 in the post-pandemic era.
Introduction
Urban greenspaces, which include parks, agricultural land and urban forests, are highly regarded as a crucial service for attenuating current global stresses (Shoari et al., 2020; Ugolini et al., 2020). Visiting urban greenspaces contributes to one’s physical and mental health by providing experiences in nature, recreation, exercise and social interaction (Belmeziti et al., 2018; Bratman et al., 2015; Enssle and Kabisch, 2020; Tan et al., 2021). During the recent global COVID-19 pandemic, trends of access and use of urban greenspaces changed globally (Venter et al., 2020; Yan, 2020). The lockdown and related policies, such as limiting park-opening hours, reducing services (e.g. pavilions, benches, play areas, sport facilities and courts) and social distancing, reflect the limited amount of urban greenspace in our cities (Poortinga et al., 2021; Uchiyama and Kohsaka, 2020). Research has shown that long periods of staying at home and being unable to access urban greenspaces during the pandemic may have increased the risk of psychological distress, anxiety, domestic abuse, obesity and adverse physical conditions (Berdejo-Espinola et al., 2021; Clemmensen et al., 2020; Hubbard et al., 2021; Speed et al., 2020; Wilke et al., 2021). This is particularly the case among certain vulnerable groups, such as the elderly, people with physical disabilities and people with low incomes (Benfer and Wiley, 2020; Boserup et al., 2020; Kavanagh et al., 2021; Khademi et al., 2020; Rotarou et al., 2021). To some degree, the COVID-19 epidemic prevention strategies intensified unequal access to urban greenspaces and created environmental injustice in metropolitan areas. The demand for urban greenspaces has become even more essential during the COVID-19 pandemic (Lopez et al., 2020), and this situation may continue in the post-pandemic era (Rodgers, 2020). Increasing greenspace accessibility, availability and equality will mitigate both physical and mental health problems (Jennings et al., 2016). Thus, there is a need for governments to rethink their plans for urban greenspaces for current urban planning areas in the post-pandemic era.
The continued restrictions and regulations pertaining to the COVID-19 pandemic have indeed negatively impacted most Sustainable Development Goals (SDGs), which were introduced by the United Nations (UN) in 2015 (Shulla et al., 2021). Progress in realising the SDGs was already slow before the COVID-19 outbreak, but the pandemic has made the situation even worse (Berchin and De Andrade, 2020). Although we are addressing these difficult challenges, the growing attention on specific SDGs, such as SDGs 1, 3, 8 and 11, nonetheless creates the opportunity for possible urgent actions (Andreucci and Marvuglia, 2021). In this study, we would like to address how Taiwan could still make progress towards SDG 11.7 in the post-pandemic era. In particular, SDG 11.7 stipulates that urban areas must provide universal access to safe, inclusive, and accessible, green and public spaces by 2030; the target also highlights that equality of access to greenspaces in urban area is paramount. The wide range of benefits provided by urban greenspaces helps encourage cities to achieve the SDGs. Unfortunately, many studies have indicated that an inequality of access to urban greenspace is frequent in urban areas (Chen et al., 2020; Wolch et al., 2014; Wüstemann et al., 2017; Yao et al., 2014). Such inequality is often correlated with a wide variety of social-economic factors, such as race, ethnicity, age, income and education level (Comber et al., 2008; Dai 2011; Ferguson et al., 2018; Łaszkiewicz et al., 2018; Tahmasbi et al., 2019; You, 2016). To mitigate the severity of such environmental injustices, planning systems can play an essential role in protecting urban greenspaces and ameliorating accessibility in the post-pandemic era (Rodgers, 2020).
To improve the problem of environmental inequality and to achieve SDG 11.7, an investigation into the equality of urban greenspace accessibility is vital. Indeed, scholars have already begun measuring the inequality of greenspace access at different spatial scales. Kabisch et al. (2016) compared urban greenspace availability in 299 European cities and found that accessibility in southern European cities, such as Valetta (Malta) and Irakleio (Greek), are often lower than those in northern European cities, such as Umeå (Sweden) and Berlin (Germany). Wüstemann et al. (2017) and Wu and Kim (2021a) used the Gini coefficient to identify inequalities in greenspace provision across Germany’s and China’s major cities, respectively. Wu et al. (2020) utilised a Gaussian-based two-step floating catchment to evaluate greenspace accessibility in Beijing, and Stessens et al. (2017) integrated diverse indicators to analyse greenspace accessibility in Brussels. Some studies have suggested that research conducted on greenspace accessibility should separate urban and rural areas (Chen et al., 2020; Wolff et al., 2020). The lack of distinction between urban and rural areas is, to some degree, problematic because the different planning purposes between the two may influence both planning systems and planning laws, which leads to enormous differences in the two areas. These kinds of studies cannot highlight the inequality in areas with a high-population density. In addition, the discussion regarding inequality in the context of Taiwan’s urban greenspaces is relatively rare. To address these gaps in the academic literature, this study seeks to assess the inequality of access to urban greenspaces in urban planning areas, which are defined by the Urban Planning Law, in Taiwan. These urban planning areas are highly metropolitan, with a high-population density; they also have a great demand for greenspaces. Additionally, this study aims to explore these two main questions: First, we will quantify general accessibility to urban greenspaces in each urban planning area and measure the equality of the urban greenspace distribution in six special municipalities in Taiwan. Secondly, we will discuss whether there is any relationship between greenspace accessibility and socio-economic factors.
The research is organised as follows. After the introduction, we briefly describe the dataset and methods applied in this study. Following is the results section, which include the inequality of greenspace accessibility and the relationship between socio-economic factors. Then, section discussion and section conclusion come next.
Study area, data source and methodology
Study area
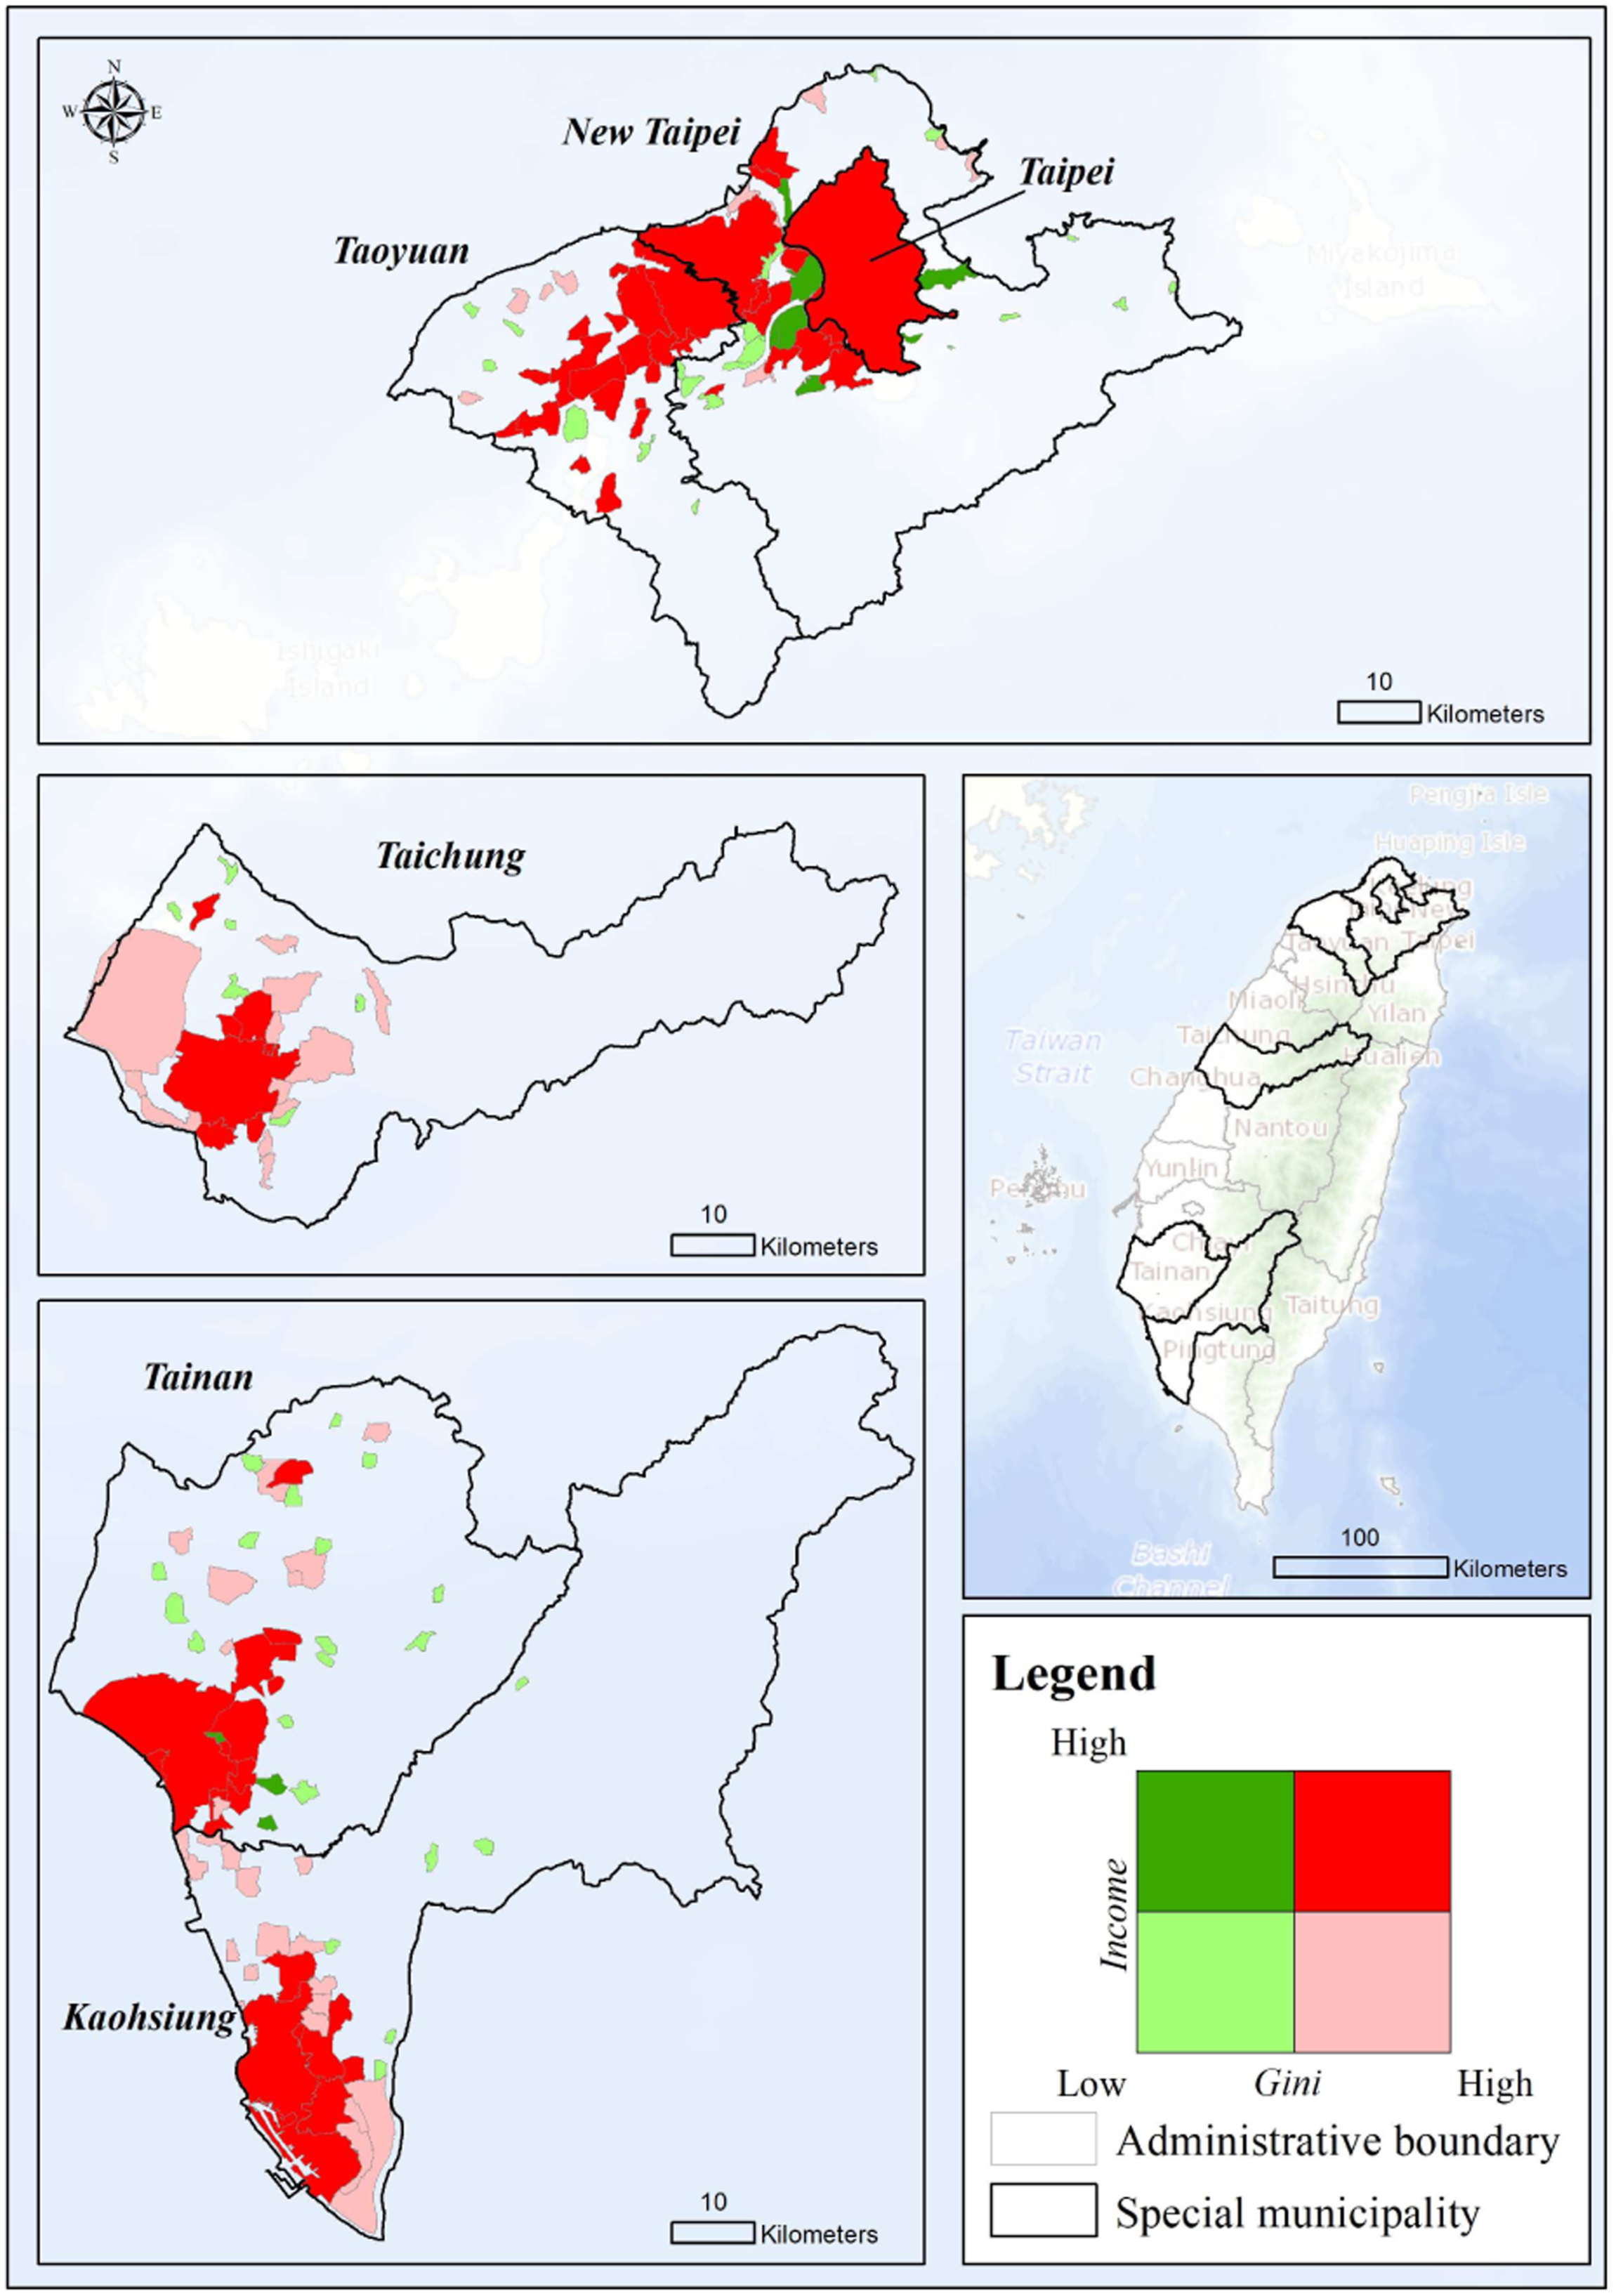
This study analyses urban planning areas defined by Taiwan’s Urban Planning Law in the six special municipalities, which include Taipei City, New Taipei City, Taoyuan City, Taichung City, Tainan City and Kaohsiung City (Figure 1). During the pandemic, these areas were hotspots for COVID-19 cases. As of 18 May 2022, of the total confirmed cases in Taiwan, there were 176,096 (17.95%) in Taipei City, 372,720 (37.99%) in New Taipei City, 153,382 (15.63%) in Taoyuan City, 64,417 (6.57%) in Taichung City, 35,207 (3.59%) in Tainan City and 59,071 (6.02%) in Kaohsiung City. The total cases within the six special municipalities constitute approximately 87.74% of the total cases in Taiwan. The regulation strategies, such as self-quarantining and social distancing, have increased the demand for access to open greenspaces and have created an obstacle to achieving SDG 11.7. The urban planning areas are the most developed areas and have the highest population density in Taiwan, and residents often suffer from insufficient and inaccessible urban greenspaces. An analysis of such spaces accurately reflects the problem of greenspace practices in Taiwan in the post-pandemic era. Thus, the urban planning areas in the six special municipalities have been chosen to serve as the study area. There are three main plans, each based on different planning objectives, including a county plan, a town plan and a special district plan. According to Taiwan’s Urban Planning Law, county plans should be formulated in the capital and special municipality. Any area in which the population has reached 3000 5 years ago and has subsequently increased by more than one-third over the last 5 years, or where more than 50% of the total employed population whose is engaged in industrial and commercial work, should develop a town plan. In these cases, a special district plan should then be drawn up to develop industries, maintain specific landscapes or for other purposes. Regarding the instruction for planning urban greenspaces, the Urban Planning Law indicates that a greenspace shall be systematically designed according to population density and environmental conditions, and that the total area of greenspace shall not be less than 10% of the entire urban planning area. Study area.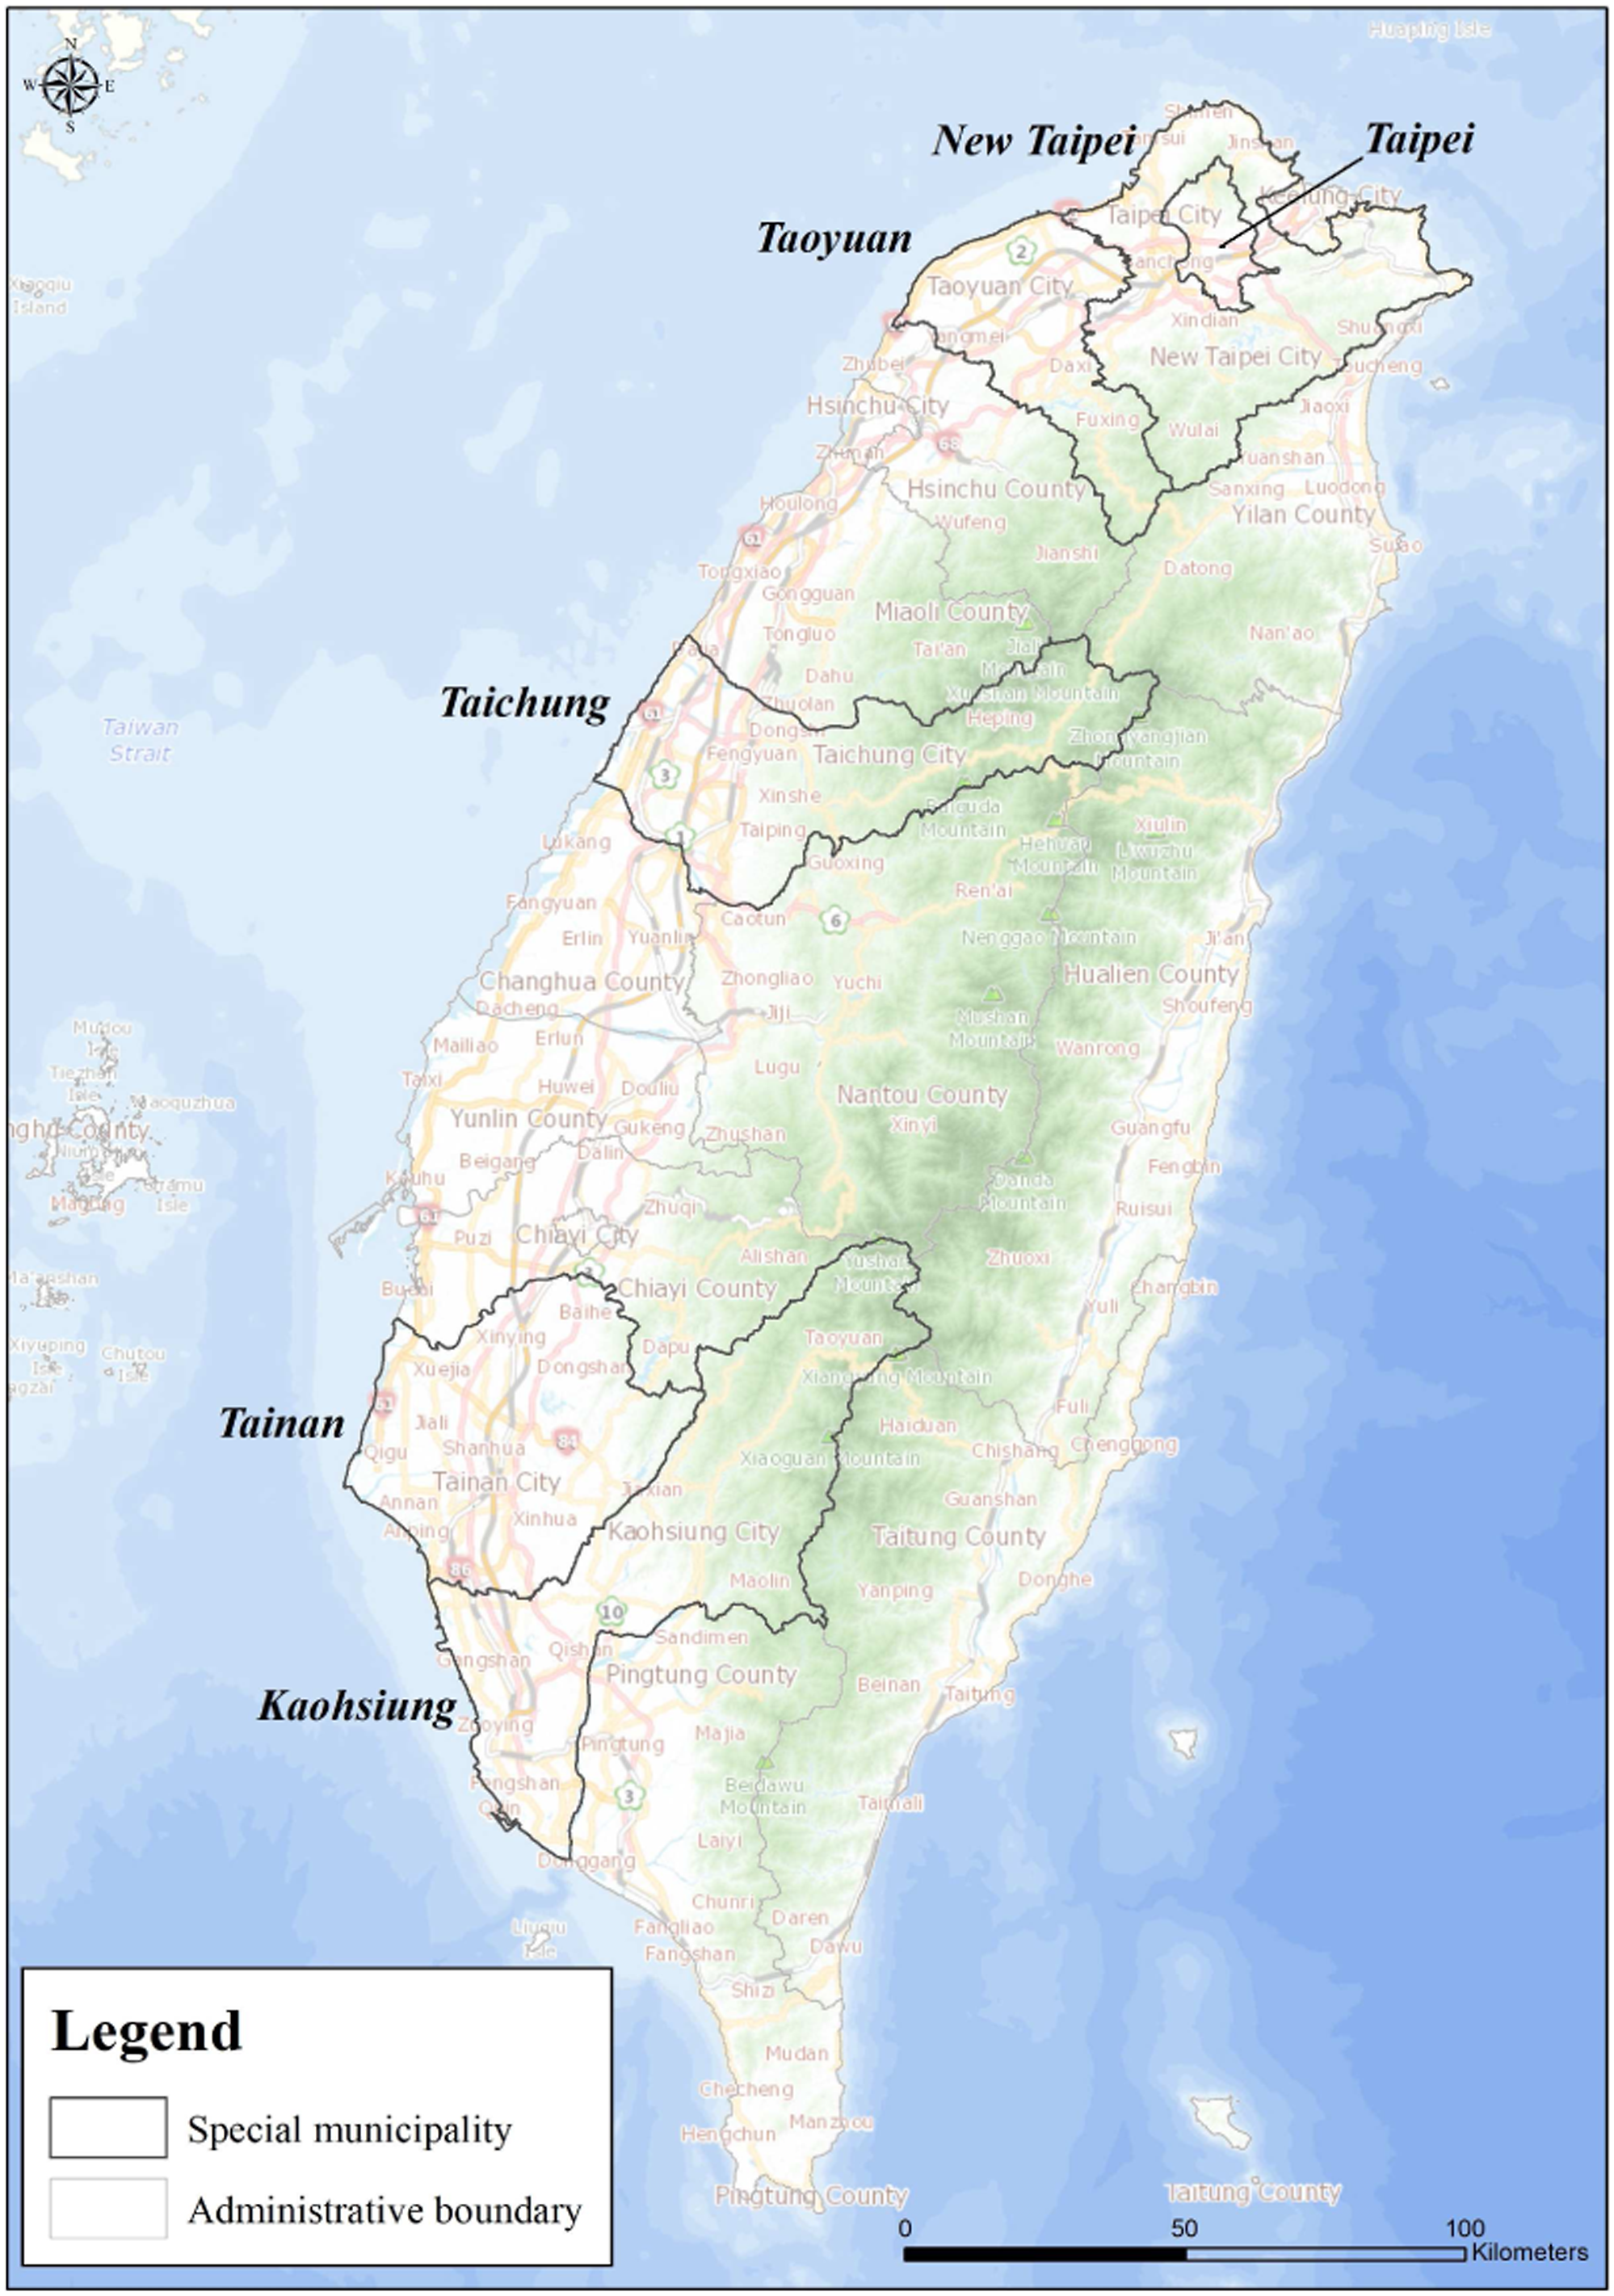
Data source
The number of urban planning areas according to each plan.

The land use investigation data, provided by the National Land Surveying and Mapping Centre, Taiwan, has been applied to identify urban greenspaces. The definition of urban greenspace in our study includes parks, agricultural land and urban forests (Liu and Russo, 2021; Nesbitt et al., 2019). Therefore, we selected land use data from the Level 2 code in the 2017 dataset. Parks (code: 0702), paddy fields (code: 0101), upland fields (code: 0102), orchards (code: 0103), coniferous forests (code: 0201), broad-leafed forests (code: 0202), bamboo forests (code: 0203), mixed forests (code: 0204) and brushwood (code: 0205) are all included in our study to represent urban greenspaces. The urban greenspace is generated for conducting further analysis.
Regarding the population data, we applied the population data collected by the Basic Statistical Area. The Basic Statistical Area is the finest area for statistical data in Taiwan (Social-Economic Geographic Information System, 2021). The principle of defining this statistical area is that the population of each area does not exceed 450 people. The Basic Statistical Area can precisely reflect the actual population distribution.
Studies have suggested that equality of access to urban greenspaces is correlated with socio-economic factors (Gupta et al., 2016; La Rosa et al., 2018; Wolch et al., 2014; Yu et al., 2020). We followed the established academic literature to select the three most commonly discussed socio-economic variables, including population density, urban greenspace provision and GDP, to explore the relationships of each with the Gini coefficient (Volin et al., 2020; Wu and Kim, 2021a; Xiao et al., 2019; Xu et al., 2018). We added up the population data from the Basic Statistical Areas within the urban planning area, and then divided the total population by the area to obtain the population density of each urban planning area. Furthermore, GDP data were collected from the 2017 Financial Annual Report, which was provided by Taiwan’s Ministry of Finance. Next, we added up the population from the Basic Statistical Areas within the urban planning area and then divided the total population by the area, thereby determining the population density of each urban planning area. In addition, GDP information was collected from the 2017 Financial Annual Report, provided by Taiwan’s Ministry of Finance. The spatial unit of the dataset is a village; thus, we calculated the average GDP of villages that intersect with urban planning areas to obtain GDP data for each urban planning area.
Methodology – measuring the inequality of access to urban greenspace in urban planning areas
There are many approaches to measuring accessibility to urban greenspaces (Rigolon et al., 2018). Rigolon (2016) stated that there are three main aspects to measuring accessibility: proximity, area and quality. Proximity measures the distance one must travel to the closest urban greenspace; area describes the amount of urban greenspace within a particular geographic unit; and quality mainly pertains to which indicators may influence residents visiting urban greenspaces. In our study, we applied the area concept for measuring accessibility. First, this study calculated the total urban greenspace within a 500 m linear buffer zone from each Basic Statistical Area centroid. The Basic Statistical Area centroid represents the average location where residents live; the 500 m radius is the maximum walking distance that residents can tolerate (Wüstemann et al., 2017). Afterwards, we then calculated the average value of the total Basic Statistical Area greenspaces within each urban planning area to evaluate the accessibility of the urban planning area.
For measuring the equality level, we applied the Gini coefficient to measure inequality. The idea of the Gini coefficient is to quantify the concept of the Lorenz curve. Although the Gini coefficient is most frequently applied in the field of economics, it has been applied productively in a variety of fields, for example, open greenspace (Kabisch and Haase, 2014; Wu and Kim, 2021a; Wüstemann et al., 2017; Xu et al., 2018), education (Banzragch et al., 2019; Yang et al., 2014), health (Asada et al., 2018; Goesling and Firebaugh, 2004) and transportation (Delbosc and Currie, 2011; Jang et al., 2017). The Gini coefficient can be computed according to the following formula
Results
Urban greenspace accessibility in urban planning areas
Urban greenspace accessibility in urban planning areas of six special municipalities (m2).

Equality of access to urban greenspaces in urban planning areas
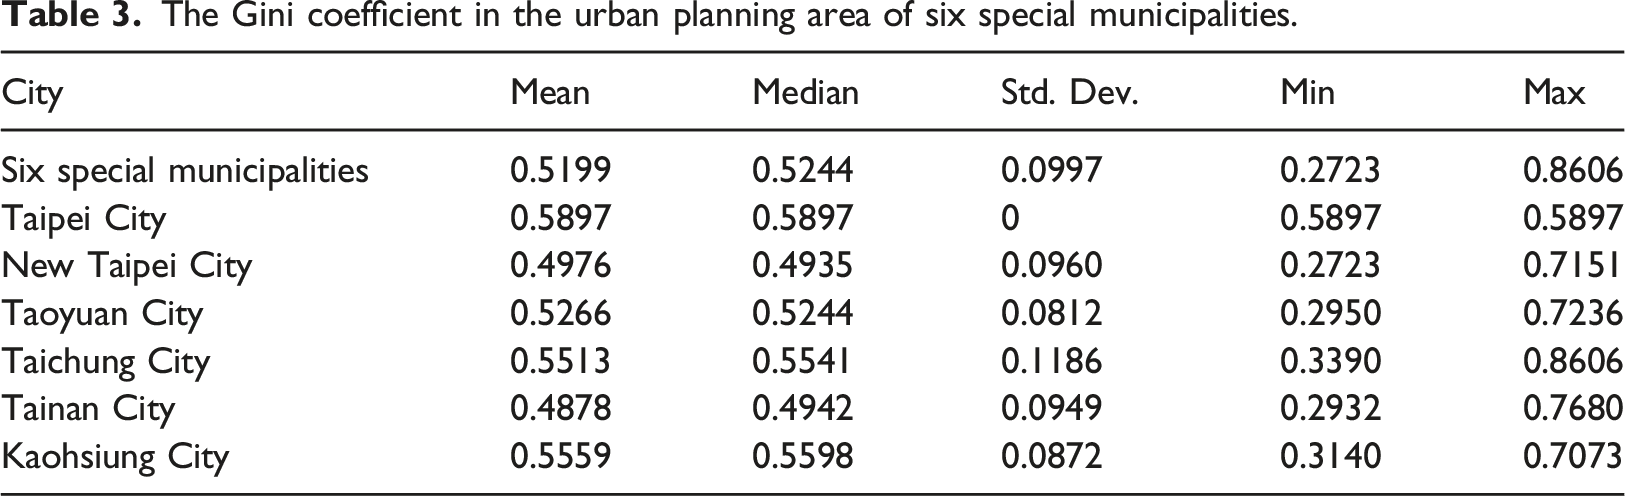
The Gini coefficient in the urban planning area of six special municipalities.

Map of Gini coefficient distribution.
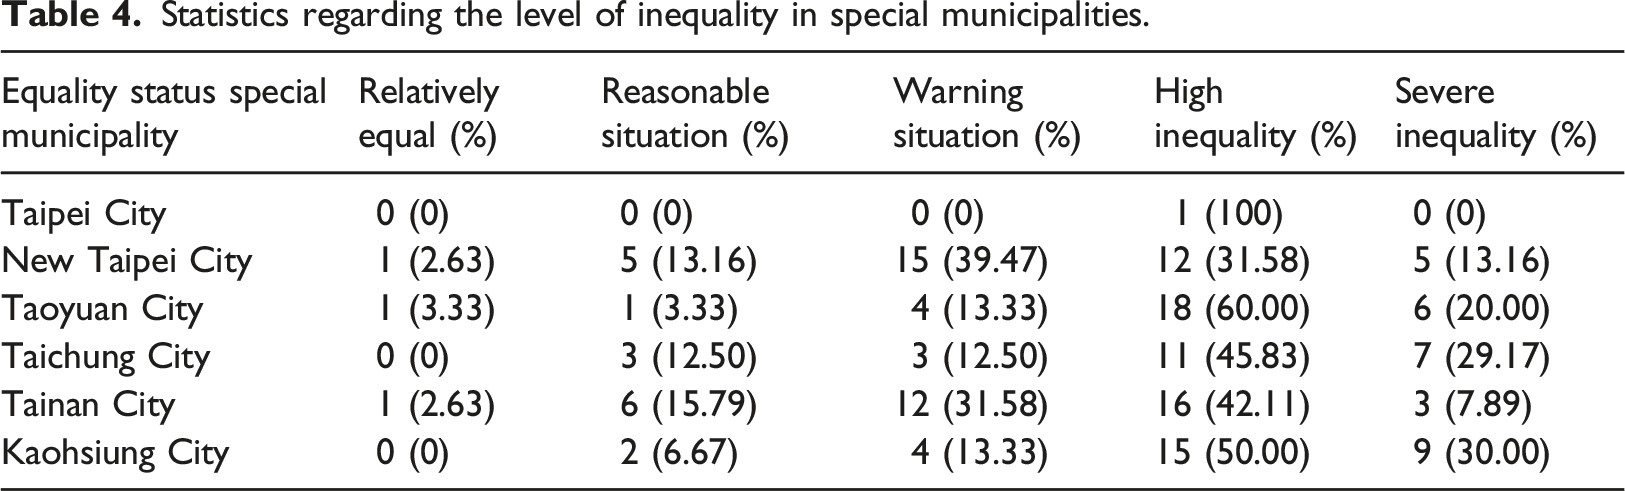
Statistics regarding the level of inequality in special municipalities.
Equality of access to urban greenspace and socio-economic indicators
Next, we conducted comparative studies between inequality and socio-economic indicators. First, we discuss the relationship between the Gini coefficient and population density (Figure 3). The population density average is approximately 7894 (pop/km2). The urban planning areas with more than the average population density have a relatively high degree of dispersion, with the highest population density in Yonghe Urban Planning Area. Urban planning areas with a high Gini coefficient and high population are generally the early-development areas in each special municipality, except for Tainan City. In contrast, the urban planning areas that have low population density and a high Gini coefficient mostly surround the early-development areas (Figure 4). Overall, the correlation coefficient between the Gini coefficient and population density is 0.01 and shows no significant relationship. This result indicates that the problem of inequality still exists whether or not the population density in the urban planning area is high. Correlation between the Gini coefficient and population density. Gini and population density bivariate choropleth map.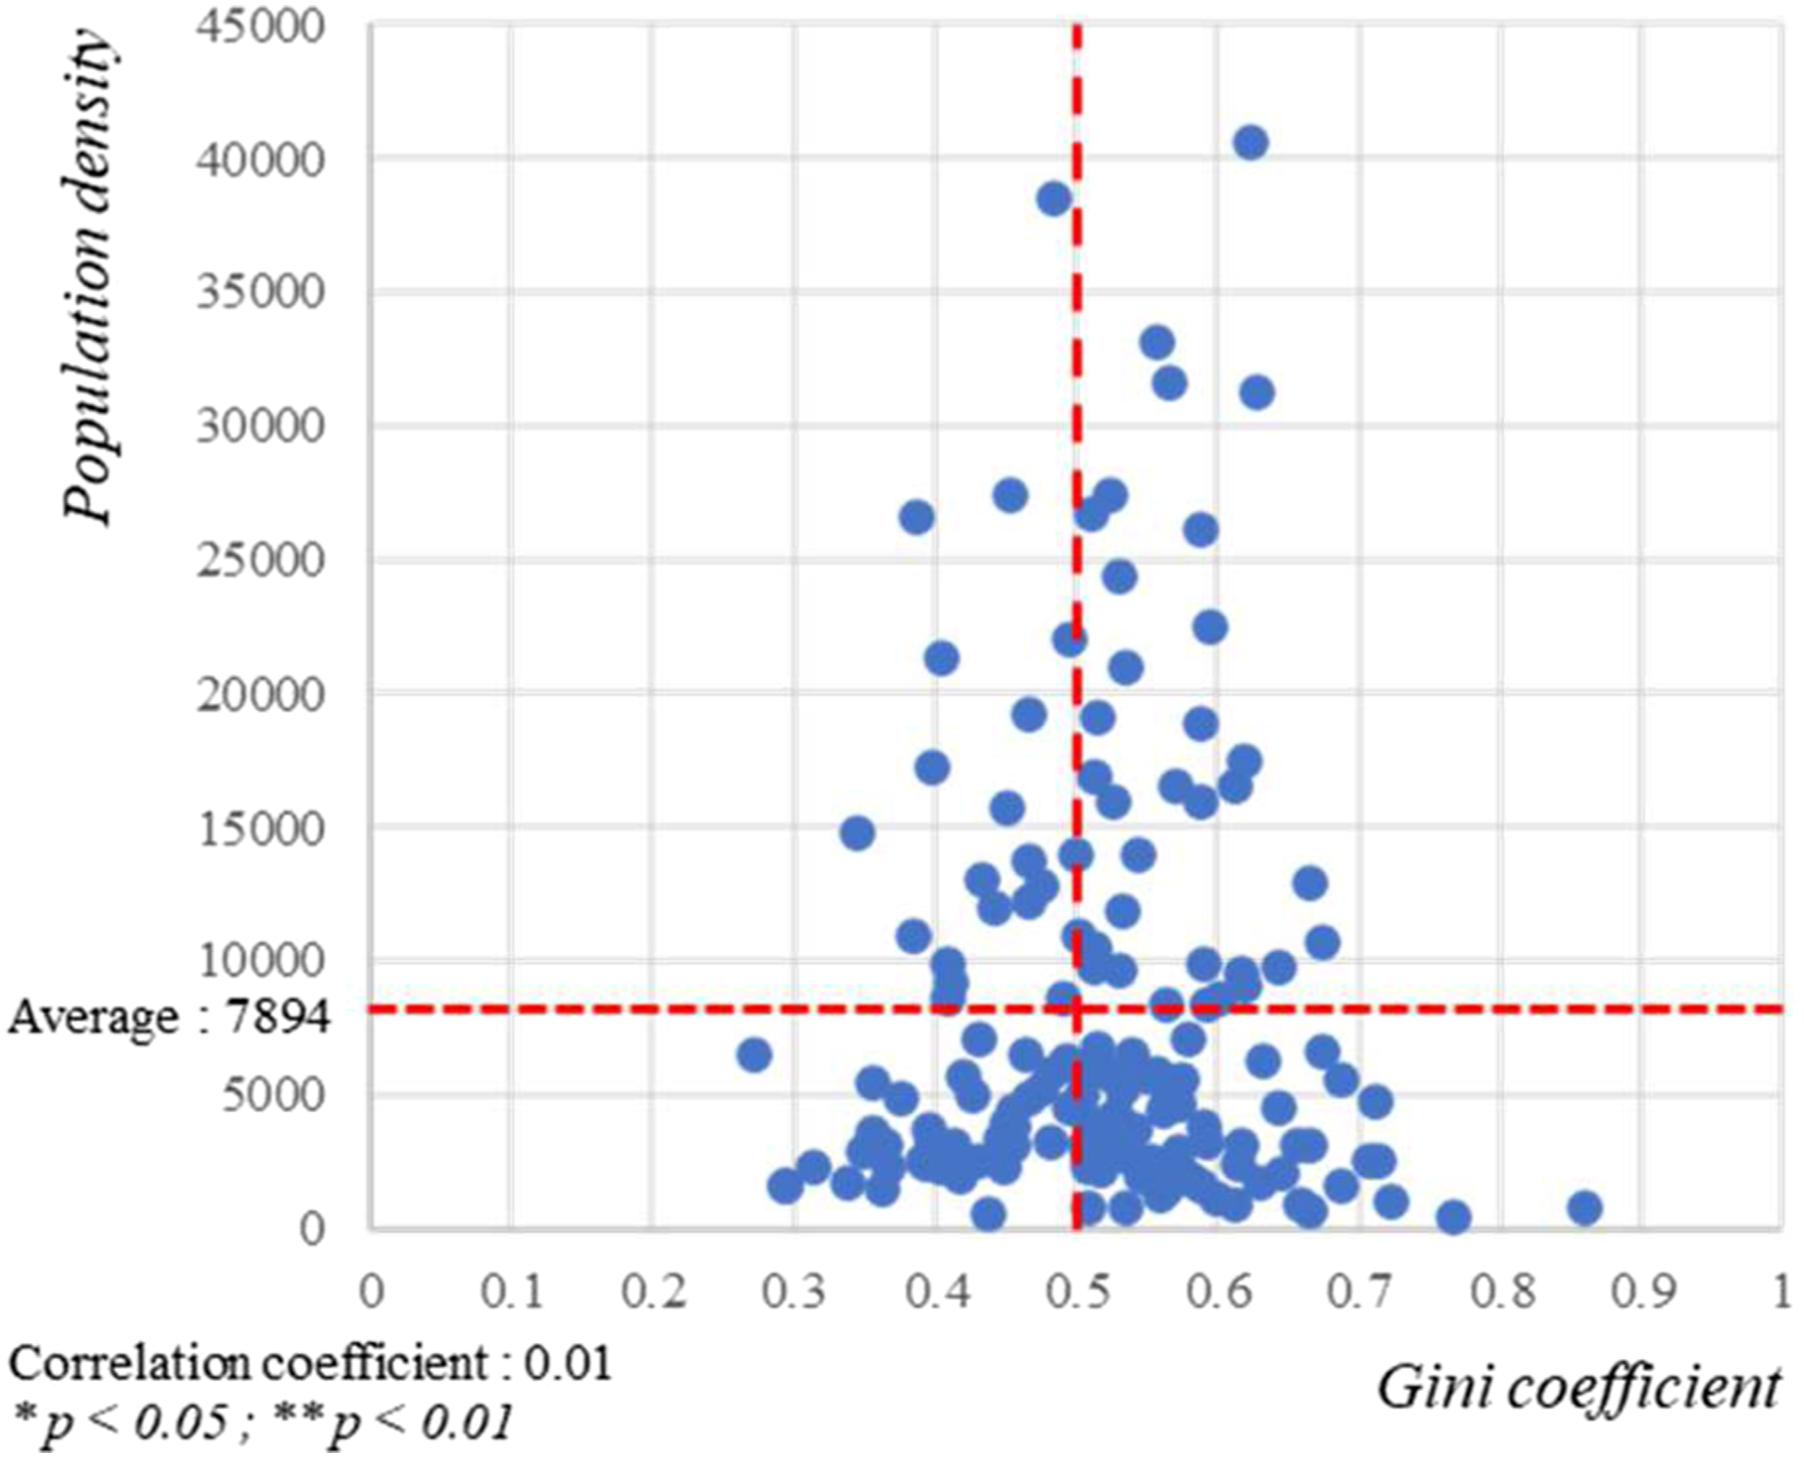
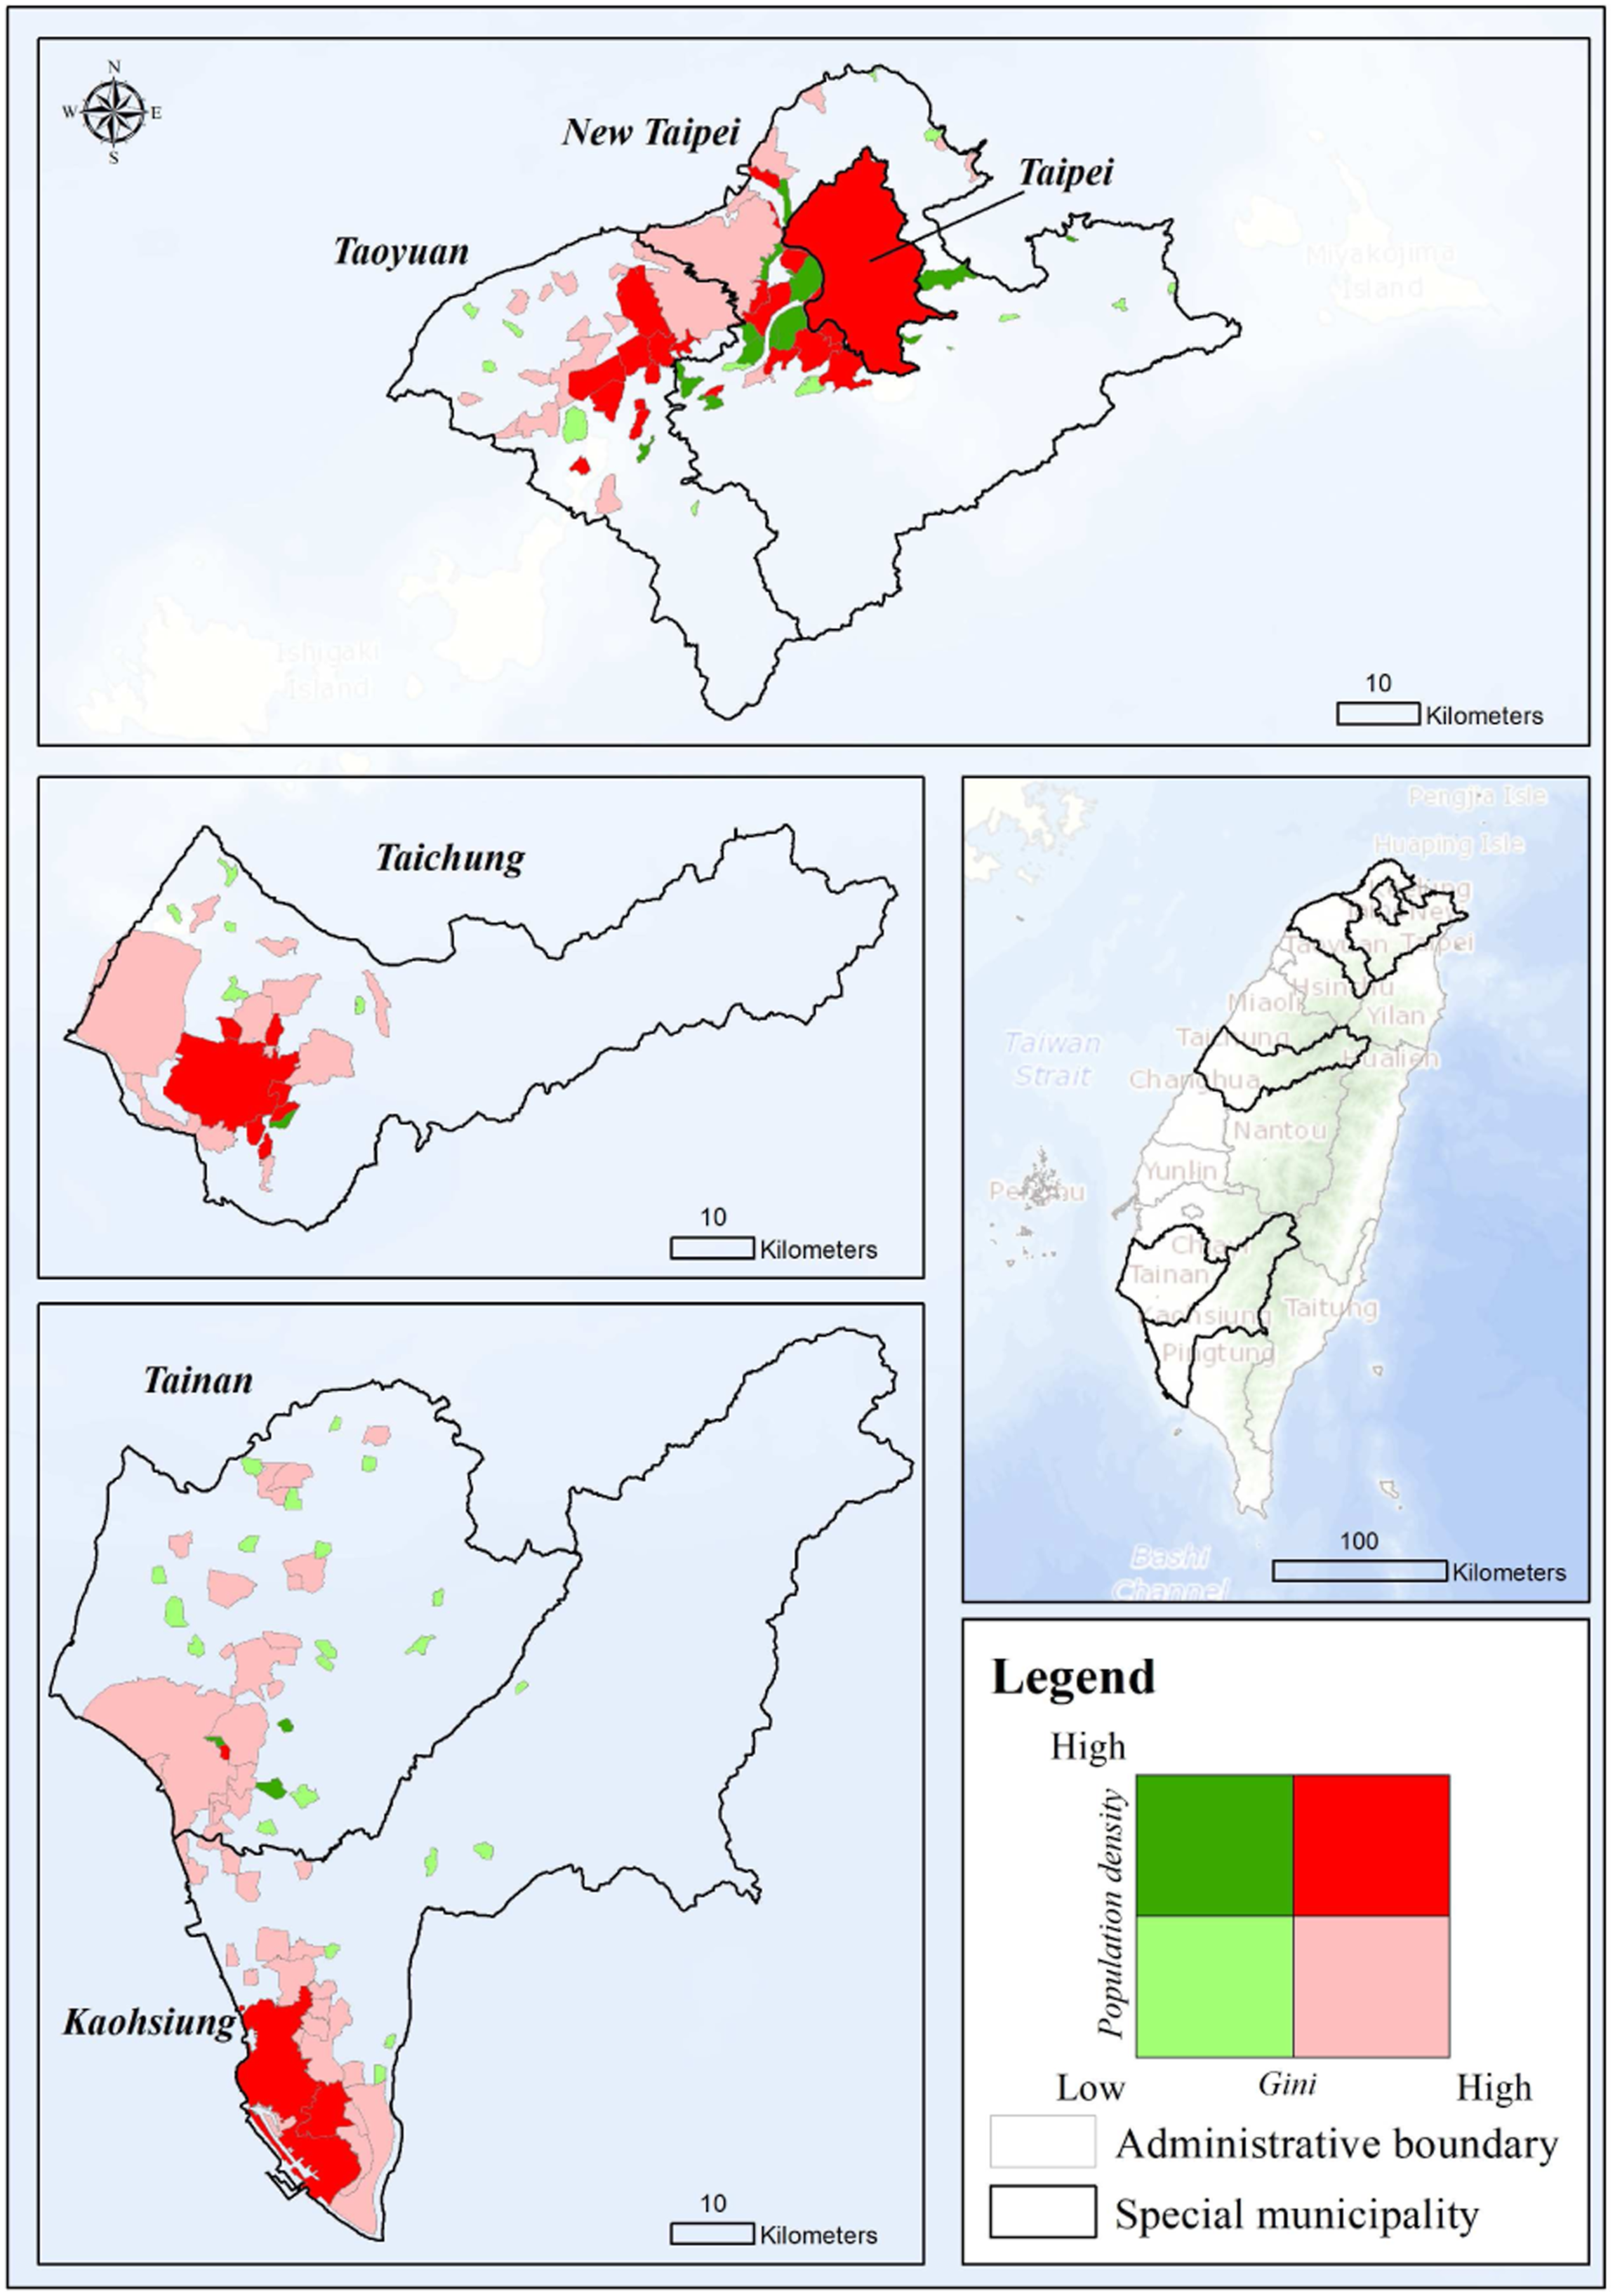
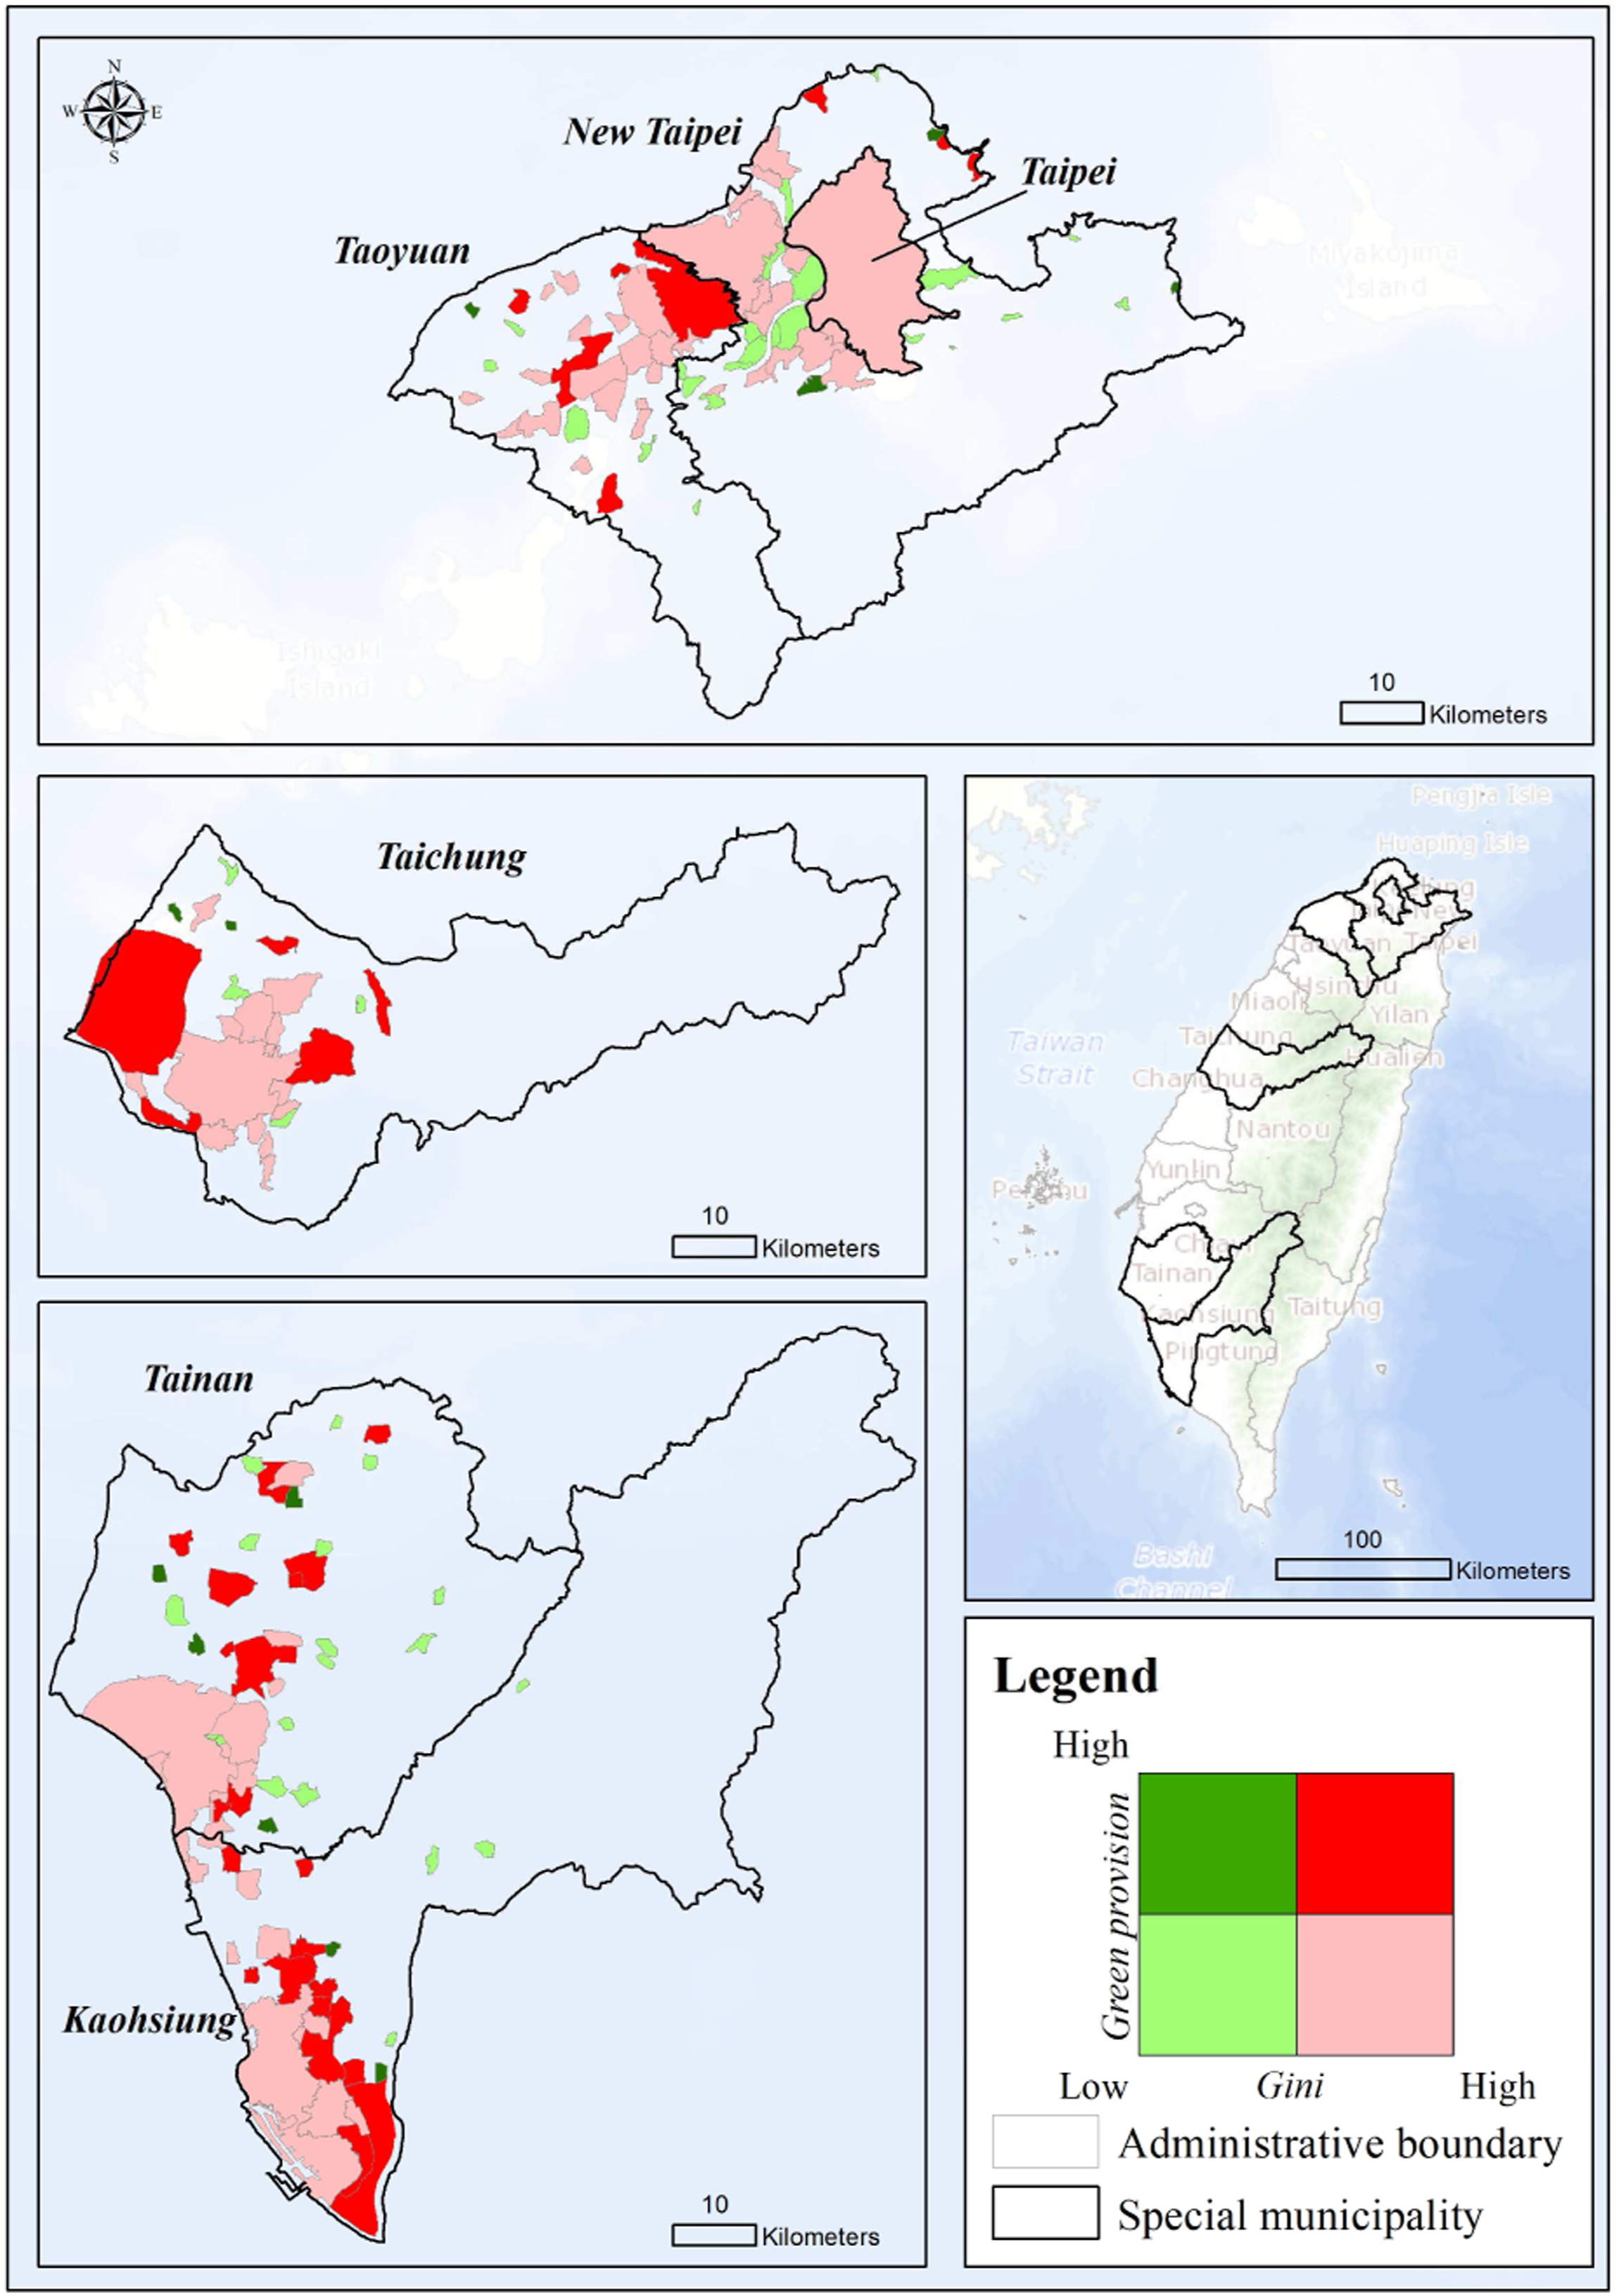
Figure 4 demonstrates the relationships between the Gini coefficient and the average urban greenspace provision. The results indicate disparities in urban greenspace provision across all urban planning areas. The average amount of urban greenspace within a 500 m buffer zone ranges from 138461.25 m2 to 155.68 m2. In addition, the number of urban planning areas with high greenspace provision and a low Gini coefficient is fewer than in other categories; most of the urban planning areas have a low greenspace provision and a high inequality circumstance (Figure 5). Each early-developed area in the special municipalities suffers from low greenspace and high inequality. Only the cities surrounded by rural areas have equality of access to relatively high open green open space (Figure 6). In addition, there is a positive relationship between urban greenspace provision and the Gini coefficient. Correlation between the Gini coefficient and urban greenspace provision. Gini and urban greenspace provision bivariate choropleth map.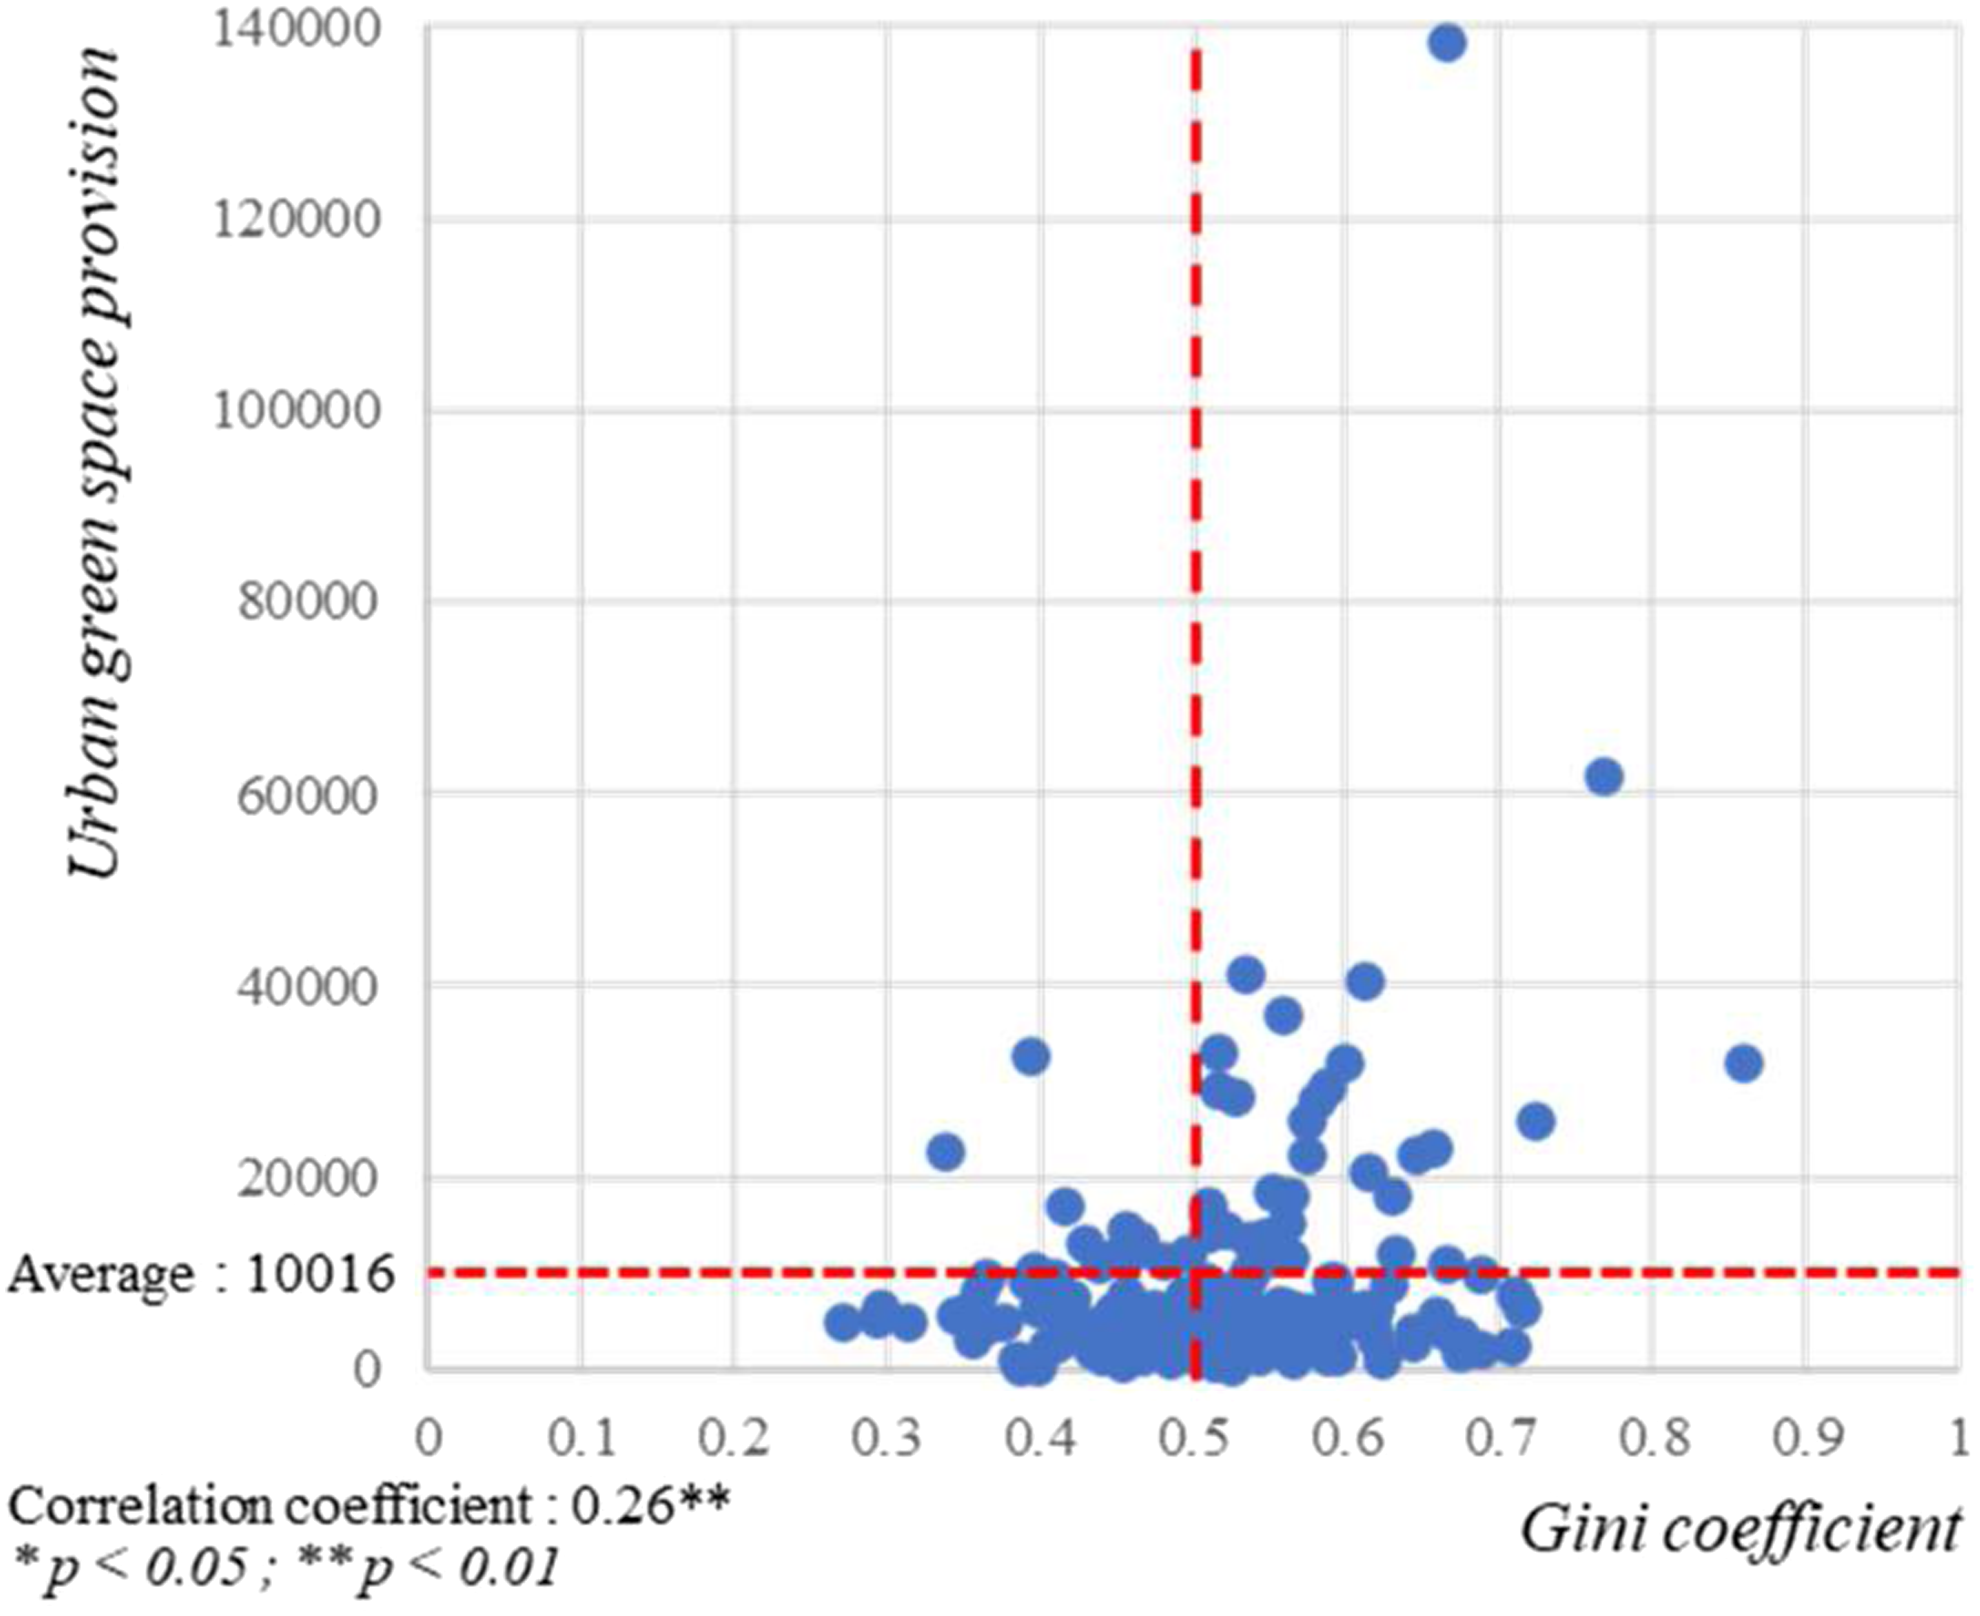
Finally, we analysed the relationship between the Gini coefficient and household income (Figure 7). The average income in all special municipalities is 817,000 NTD per year, and the income ranges from about 1,208,600 to 636,500 NTD annually, for Taipei and Pingxi Urban Planning Area, respectively. Urban planning areas that are high-income are clustered primarily in northern Taiwan and the early-developed regions of Taichung, Tainan and Kaohsiung. Urban planning areas with low income and a low Gini coefficient are located mostly in rural areas (Figure 8). Additionally, we found that both the Gini coefficient and the income correlation coefficient is 0.40 and shows a significant relationship. This suggests that high-income areas often face inequality problems regarding accessibility to urban greenspace. Correlation between the Gini coefficient and income. Gini and income bivariate choropleth map.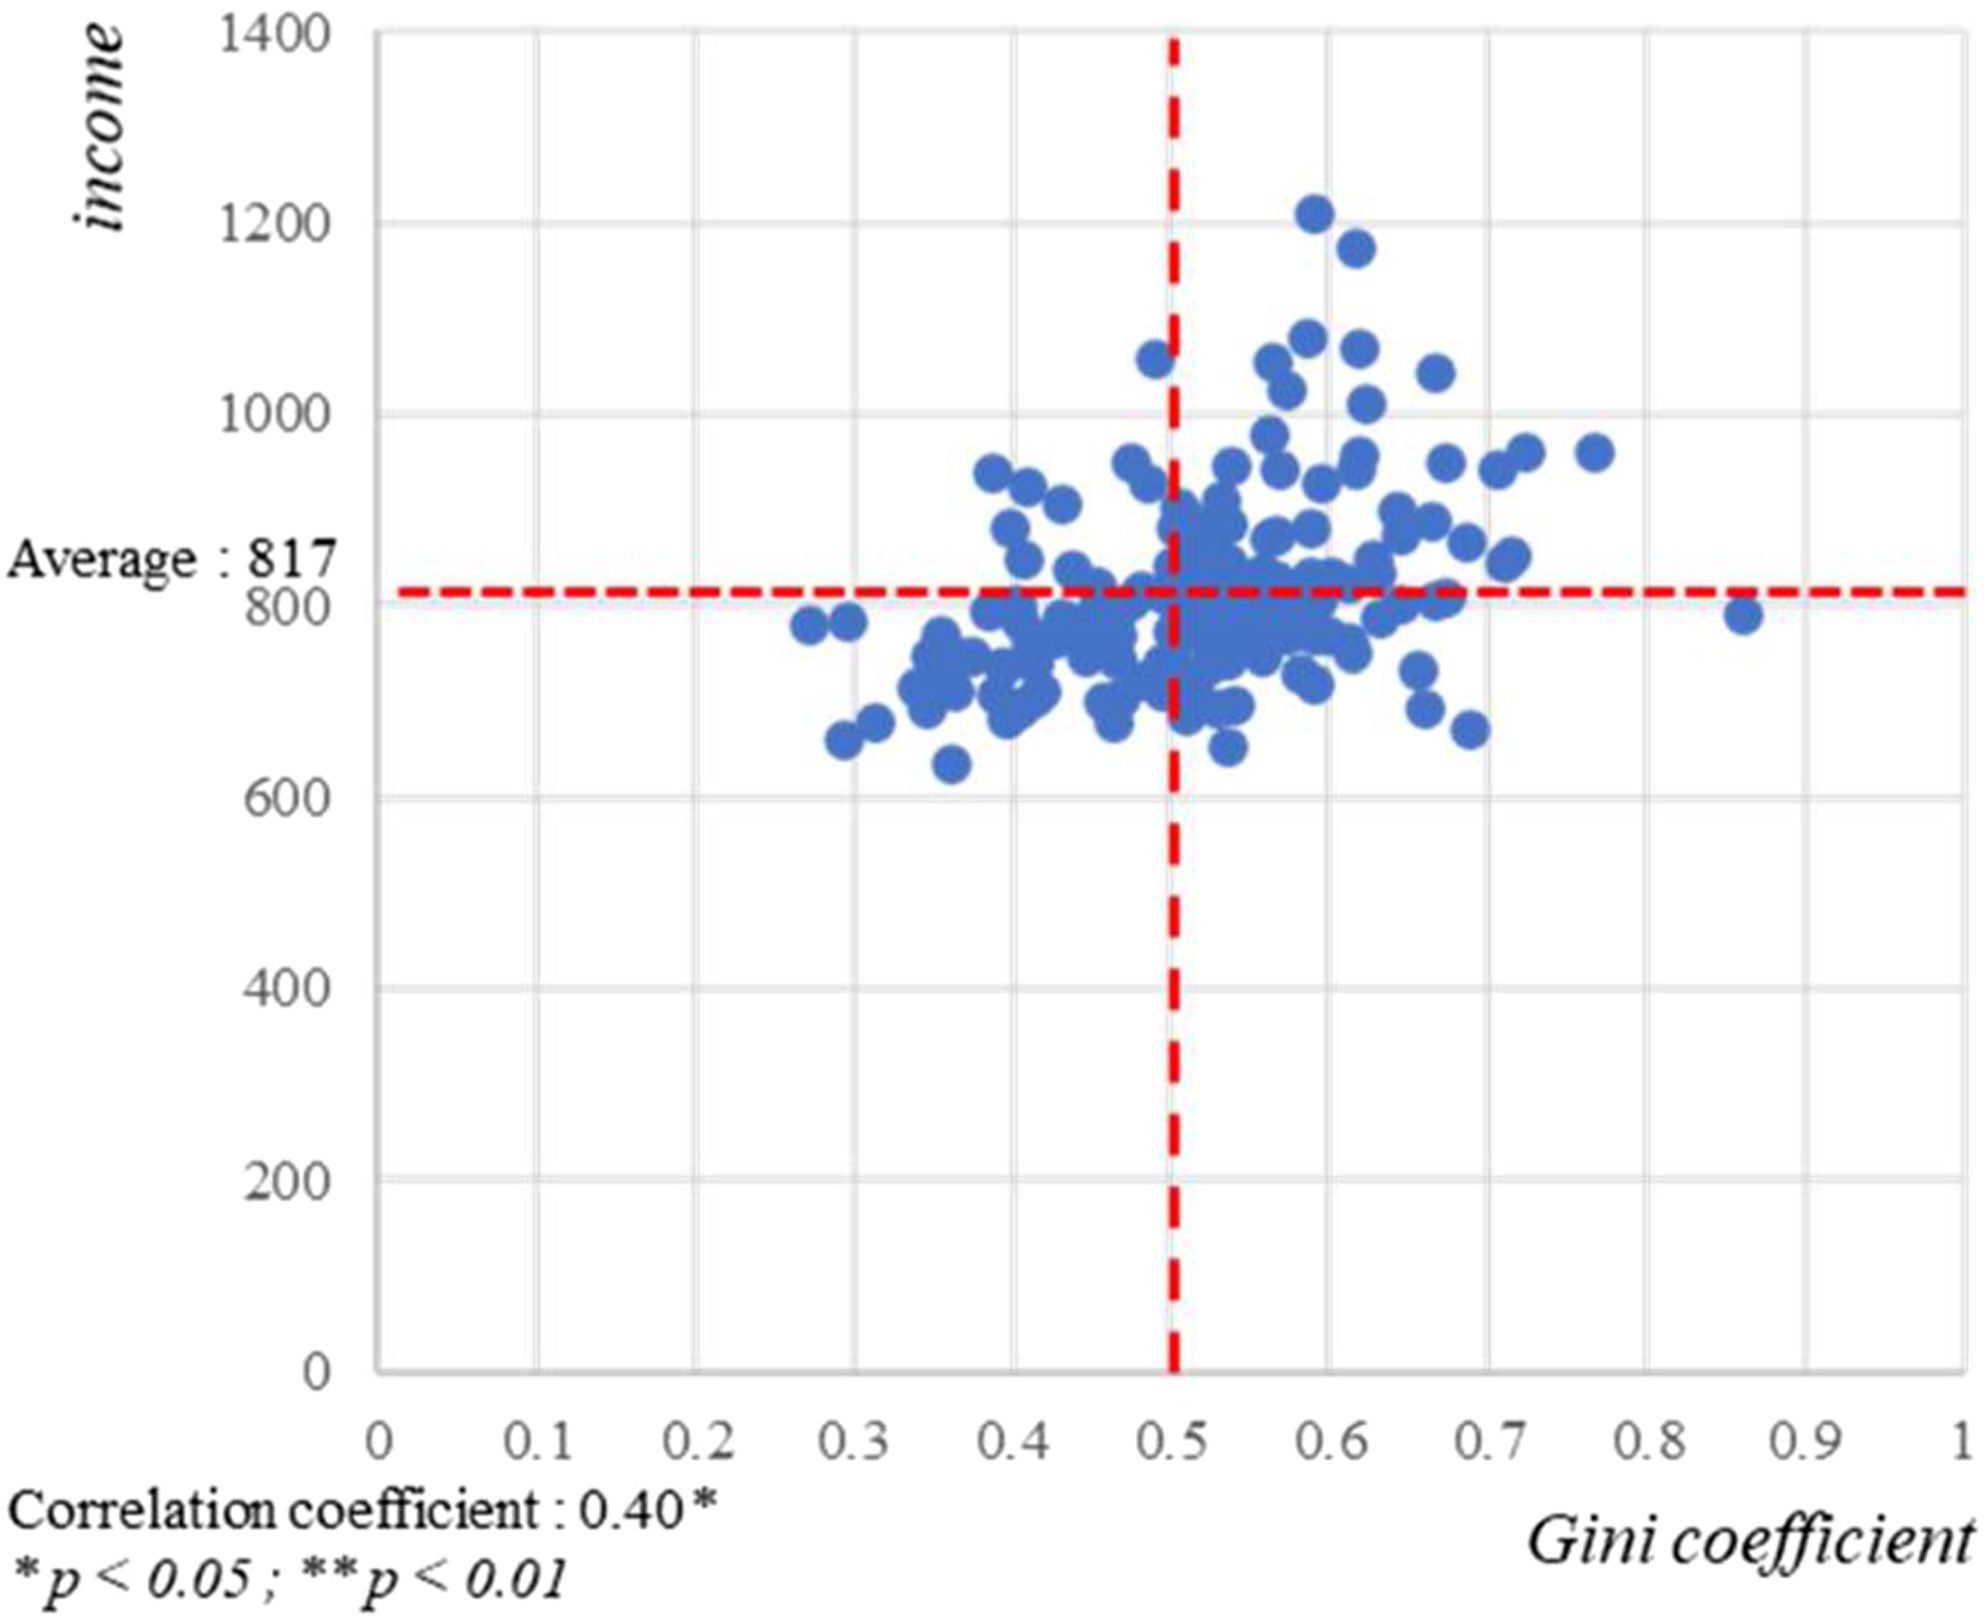
Discussion
In this study, we have discussed unequal accessibility regarding urban greenspace, with a focus on urban planning areas in Taiwan. According to Taiwan’s Urban Planning Law, open greenspace should constitute more than 10% of the urban planning area; however, most of the urban planning areas miss that target. In addition, the average urban greenspace provision within walking distance (500 m) per capita is approximately 1.03 m2. This is far below some of the targets suggested by other countries. For instance, Berlin aims for 6 m2 of urban greenspace per person (Senatsverwaltung für Stadtentwicklung und Umwelt, 2013), and the Netherlands’ target is a minimum of 60 m2 open green open space per capita within a 500 m buffer zone around households (De Roo and Roozen, 2011). Such comparisons suggest that the open greenspace in Taiwan’s urban planning areas is highly insufficient.
Our analysis provides invaluable evidence for decision-makers to inspect urban greenspace planning in Taiwan’s six special municipalities in terms of inequality. Generally, the Gini coefficient results show that over 63.98% of urban planning areas are classified as having an inequality of accessibility to urban greenspace (Gini coefficient >0.5). Because of Taiwan’s geographic conditions, a high proportion of people gather in the urban planning area, which worsens environmental inequality. This analysis, which focuses on urban planning areas, indeed reinforces that there is a problem with inequality. Decision-makers can apply the Gini coefficient as a reference in prioritising the specific urban planning areas that need improvement. In addition, the relationships between the Gini coefficient and socio-economic factors are noteworthy. The Gini coefficient shows no correlation with population density, which demonstrates that unequal accessibility to open greenspace can happen in any urban population density. Although, the result differs from previous studies, which found positive relationships between the Gini coefficient and population density (Kabisch and Haase, 2014; Wu and Kim, 2021b), we consider that this is the effect of confining studies to highly developed areas (i.e. urban planning areas). On the other hand, urban greenspace provision and income do have a positive relationship with the Gini coefficient. In fact, several studies have indicated the same issue (Feng et al., 2019; Liu et al., 2021). Areas with high-income levels or larger amounts of open greenspace are likely to have more inequality, which may cause environmental injustice or green gentrification problems (Gould and Lewis, 2012; Sharifi et al., 2021).
Decision-makers should ensure sufficient and spatial equitable open greenspaces to enhance residents’ physical and mental health in the post-pandemic era (Anguelovski et al., 2018; Geng et al., 2021; Slater et al., 2020). Olszewska-Guizzo et al. (2021) found that lockdown restrictions considerably impacted cognitive functions and, furthermore, advised that exposure to urban greenspace can decrease negative neuropsychological effects. The kinds of access encouraged are recreational walks and fulfilling needs for rest and exercise (Ekkel and De Vries, 2017). Therefore, the urgent need for sufficient and accessible urban greenspaces cannot be overemphasised when planning urban greenspaces in the post-pandemic era (Pan et al., 2021). Moreover, Braubach et al. (2021) suggested that urban planning practices should consider unequal distribution of open greenspace to make progress towards SDG 11.7. Thus, a discussion addressing complete accessibility and inequality regarding urban greenspaces can help cities achieve SDG 11.7 after the pandemic. Although the SDG 11.7.1 indicator emphasises the average share of cities’ built-up areas that are open spaces for public use (United Nations, 2015), we suggest that city planners should also consider measuring greenspace inequality when drafting future urban plans. Our case study finds that there is still a gap between residents’ demands for open greenspaces and their actual development. The incomplete understanding of residents’ demands, a lack of resources, and political interventions may lead to the inappropriate planning of greenspaces; moreover, a dearth of monitoring and assessing greenspaces may have caused urban planners’ negligence of urban greenspace distribution. Thus, assessing greenspace accessibility and inequality, conducting adequate communication with residents, and regular reviews of implementing urban greenspaces are advised to be executed in the planning system. Given the constant demand for urban greenspaces in the post-pandemic era, Taiwan’s city planners should rethink and improve current urban greenspace strategies to realise SDG 11.7. They should also plan open greenspaces from a multifunctional perspective (Hansen et al., 2019), and consider that both provision and equality (Zhu et al., 2019) may gradually achieve the goal.
There are some limitations to our study. First, the land survey data applied in our study does not reflect the multi-functionality of land use. For instance, playgrounds and sports fields in schools can also serve as open greenspaces, but the land survey data have not actually been separated from schools. Future studies could apply multiple datasets and methodologies, such as remote sensing (Nero, 2017; Yang et al., 2020) or social sensing (Chen et al., 2018; Feltynowski et al., 2018), to define urban greenspace for further analysis. Second, because of the data limitations in Taiwan, this study has not included people’s different social conditions in the analysis. Different social groups, such as those based on race, age or occupation, might have varying demands for urban greenspace (Kabisch and Haase, 2014; Wen et al., 2020). Future studies could therefore investigate differences in access to urban greenspace among different social groups in detail. By doing so, studies could conduct a deeper and more comprehensive analysis of SDG 11.7. Thirdly, spatially inconsistent phenomena should be considered when analysing relationships between the equality index and socio-economic factors. Spatial statistical methodologies, such as the spatial lag model, the spatial error model and geographically weighted regression, could also be applied in future analyses (Fang et al., 2021; Xu et al., 2018).
Conclusions
In summary, we analysed unequal accessibility to urban greenspace in urban planning areas. We have also discussed the relationships between the Gini coefficient and socio-economic factors. The average urban greenspace provision within walking distance (500 m) per capita is approximately 1.03 m2, which indicates a lack of urban greenspace provision in Taiwan’s urban planning areas. In addition, the Gini coefficients show that more than 63.98% of urban planning areas have inequality problems, and 23.60% are in warning situations. In general, older developed areas in special municipalities suffer from low greenspace accessibility and high inequality. Due to the dearth of available land, scarcity of funds and the complexity of property rights in these areas, the feasibility of constructing greenspace decreases, as these factors often become obstacles to realising a livable city during the urban planning process. These results reveal a severe problem in green injustice, which should be both discussed publicly and solved in Taiwan. Furthermore, positive relationships between the Gini coefficients and income and green provision have been found; however, the Gini coefficients show no significant correlation with population density. To provide universal access to safe, inclusive and accessible green and public spaces in the post-pandemic era, the importance of considering both provision and equality in urban greenspace planning cannot be overemphasised.
Taiwan’s geographical condition means that there are relatively few livable areas in Taiwan, which reinforces the pursuance of green equality. However, empirical research on green equality remains relatively limited in Taiwan. As a pioneering empirical study conducted at the urban planning scale, these results show that there is indeed a real problem of unequal access to urban greenspaces to Taiwan’s city planners and decision-makers. In our case, unequal access to open greenspace can occur in urban planning areas, regardless of population density. In addition, urban planning areas with high-income levels and green provision can more easily address problems of green inequality. Overall, our work provides new evidence that could be invaluable in helping decision-makers and planners to identify urban planning areas more accurately that should promote the equitable distribution of urban greenspace. City planners and decision-makers are responsible for proposing planning policies and offering location-sensitive planning that consider both provision and equality, so that open greenspace planning can realise SDG 11.7.
Footnotes
Declaration of Conflicting Interests
The author(s) declared no potential conflicts of interest with respect to the research, authorship, and/or publication of this article.
Funding
The author(s) received no financial support for the research, authorship, and/or publication of this article.