
Abstract
Plans can only impact practice when elected officials adopt, enact, and approve funding for specific strategies. We explore ways to track implementation from the planning documents to elected officials’ priorities and to their voting patterns to identify the consistencies and gaps that may limit the impact of plans. We use Twitter data mining, text content analysis, and voting records from the digitized council minutes in Calgary, Alberta, between the 2017 municipal election and the last quarter of 2020. We connect the expressed preferences to votes for each councilor over the study period. On the two most salient topics—transit and affordable housing—those who expressed support on Twitter also supported investments. With one exception of an anti-tax councilor, over time, the rest of the councilors reached agreements on public investments (supra-local funding lightened the financial burdens for the city facilitating “yes” votes). Planners can derive meaningful information from the elected officials’ social media communication, such as concerns and support for specific planning initiatives, to promote successful plan implementation. This information can also enhance voters’ awareness of local officials’ views and actions on planning initiatives.
Introduction
When planners and communities develop and adopt plans, they expect that all or parts of the plans will be implemented with some level of success and some positive tangible outcomes. The plan implementation literature distinguishes between two dimensions of implementation corresponding to two views of how plans impact reality (e.g., Alexander and Faludi 1989; Gabris 1992; Baer 1997). Seeing plans as blueprints means that implementation can be assessed as the conformance between the built environment and criteria set forth in the plan, for example, redevelopment type, density, or location. Seeing plans as general visions and directions leads to focusing on their performance or usefulness, for example, whether plans are used or referenced in decision-making, and/or whether plan-making processes themselves build collaborative cultures, coalitions, or support for initiatives.
From either perspective, implementation assessment is a complex endeavor (Laurian et al. 2017). First, it is virtually impossible to assess the implementation of whole plans, and most researchers find it necessary to zoom into selected planning goals or priorities (Laurian, Day, Backhurst, et al. 2004; Laurian, Day, Berke, et al. 2004). Second, while some planning efforts seek to address realities that are readily measurable, for example, air quality or the number of affordable housing units built, others target more intangible outcomes, for example, sense of place or quality of life (Lyles et al. 2016). Third, even outcomes tracked through indicators do not necessarily imply that changes can be attributed to the plan, for example, the lack of affordable housing has more to do with market forces and private developers’ decisions than with plans or plan implementation efforts (Berke et al. 2006).
Here, we explore a new approach to implementation assessment that focuses on the role of elected officials. Whether seen as detailed blueprints or general visions, plans are primarily used, managed, and implemented by planning staff to shape public and/or private behaviors and investments. Beyond staff analyses, outreach programs, and recommendations, all major budgetary and policy decisions involved in moving plan strategies forward require approval by elected officials, usually through votes. Yet there is a dearth of literature on the connections between plans, plan implementation, and the role of elected officials (their priorities and their votes) in planning outcomes.
Thus, we explore how plan implementation research might be informed by analyzing whether and how elected officials communicate about and vote on planning initiatives. Most local elections are non-partisan. It might be tempting to assume that pro-planning, Democratic-leaning elected officials tend to put a higher priority on topics such as sustainability, transit, affordability, and accessibility than small government, conservative elected officials. Yet, at the local level, we cannot assume that the left-right ideological continuum (or chasm) aligns in straightforward ways with local planning decisions.
In a previous paper, Han et al., (2021) explored whether local elected officials campaigned on planning issues, and found that social media campaign communications reveal candidates’ priorities on salient planning topics (e.g., transit, affordable housing, access, densification). Here, we explore whether elected officials’ campaign priorities remain identical once they are in office, and whether they translate into actual decisions and votes. To do so, we develop and test new plan implementation evaluation methods.
Literature review
Plan implementation: City councils as decision-making loci
Plan writing is an essential part of the planning process and can set a city or subunit of a city on a new course of action. Yet, since plan writing happens only every 5, 10, or 20 years, depending on the plan considered, it is, generally speaking, a rare occurrence. Most of the life of a municipality happens after plans have been adopted. Implementation of plan goals and objectives happens through many avenues: through zoning and other regulations, changes in zoning, rules, and policies, direct investments, incentives to the private or nonprofit sectors, communication, coalition-building, persuasion, and changes in culture, norms, or expectations.
Most, if not all, planning decisions are highly path-dependent, which can lock municipalities into suboptimal policies and behaviors (Woodlief 1998). Large portions of municipal budgets are dedicated to non-discretionary items (e.g., salaries, benefits, and other spending for fire, police, or schools). Past zoning, codes, and policy decisions impact current and future options, meaning that often, planners’ and city councils’ hands are actually tied. Finally, major decisions (e.g., support light rail or affordable housing construction) typically entail a myriad of subsequent decisions, all of which are premised on the initial decision. In this sense, implementation decisions are, in practice, highly constrained.
Planning decisions made within or despite path dependencies are inherently political—not in the partisan use of the term, but to the extent that they imply tradeoffs, resource allocations, and competitions (Rabinovitz 1968), impact all aspects of urban life, and engage planners, bureaucrats, elected officials, entrepreneurs, interest groups, and the general public (Auerbach 2012). With limited resources, elected officials must prioritize and choose between initiatives. As they do so, they allocate resources to what (or who) they implicitly or explicitly believe is deserving of public investment (roads v. transit, homeowners v. renters, largest taxpayers v. the poor…). Thus, decision-makers’ ideology, their views of the role of government, and of what and who is deserving of support necessarily play a part in resource allocation decisions (Tausanovitch and Warshaw 2014).
In local government, the City Council is the decision-making body, and most planning decisions that require public investments must thus be approved by local elected officials on Council. Political processes not only implement but also shape and modify planning decisions (Tewdwr-Jones 2002). In North America, where planning decisions are largely local (even though constrained and/or supported by supra-local legal, social, and economic rules and incentives), elected officials have a crucial role to play in all planning decisions, from goal and policy setting to investments and implementation. The power of municipal authority is exerted by elected and non-elected bureaucrats, including planners, through communication, influence, or power over processes and decisions, and finalized activities (Foucault 1982). This power is exerted at two points in the voting process: decisions about policies, and decisions about budgets to implement those policies. The latter, we believe, is the most immediate and relevant measure of elected officials’ influence over reality.
Local elected officials are typically not elected for their expertise in planning or public affairs (they are rarely trained in relevant fields, especially in small towns). Instead, they are elected because they are well known, have name recognition, and/or because they ran a convincing campaign. Even in local government where voter turnouts are very low, representative democracy is premised on the notion that voters elect representatives who, they expect, will speak for and act upon their interests, values, and preferences once in office. However, distrust in elected officials (at the local, state/provincial, and federal levels) is prevalent, largely because elected officials are perceived to not represent their constituents’ interests. In a majority vote system, minorities, and indeed 49% of the population, can be poorly represented by their elected officials. Beyond the underrepresentation of minorities, perfect representation is impossible since constituents’ interests are neither singular nor well-defined, nor explicit.
Even if they were perfectly representative, elected officials would not be legally bound to pursue their constituents’ interests. It is worth briefly exploring the position of elected officials. The Madisonian democratic ideal sees elected officials as delegates (at the local level, delegates of their district or ward). Yet, elected officials may see themselves as trustees instead of delegates (Rehfeld 2009). They may see their job, once in office, to do what is “best” or “right” regardless of voters’ preferences. In this case, they will define “best” or “right” based on their personal ideologies. When elected officials’ preferences diverge from their electorate’s, they will have to choose to support what their electorate wants, or what they think is right. This is indeed common: “[S]enators’ preferences diverge dramatically from the preference of the average voter in their state. The degree of divergence is nearly as large as if voters were randomly assigned to a senator.” (Barber 2016)
The political science literature has recently explored the deep disconnect between legislators’ votes and their constituents’ preferences (Schechter 2017): “When their ideology aligns with constituent interest… politicians vote in accordance with their constituents, 89 percent of the time. When their ideology is opposed to the preferences of their constituents, however, politicians act according to majority opinion only 29 percent of the time.” (Schechter, 2017) “[This gap does not appear connected to] competitive elections, term limits, campaign contributions, or media attention. The evidence is most consistent with the assumption of a citizen-candidate model that legislators vote their own preferences.” (Matsusaka 2015)
Thus, at the federal level, elected officials “vote their conscience” rather than vote to represent their constituents. This may partly explain distrust in elected officials. While the research is conducted on national rather than local elected officials, there is little reason to believe that it would be vastly different at the local level. On the one hand, local elected officials may be more responsive to feedback from their constituents since they interact more often, but on the other hand, local voter turnout in local elections is so low that it is likely that most residents do not pay much attention to council decisions (until potholes appear on their street that is).
In addition, representative democratic rule is inherently biased toward majority opinions and interests. Thus, minority views and needs, such as the needs and interests of the very poor, homeless, youth, transit-dependent, ethnic minorities, etc. are systematically underrepresented at all levels of government. Elected officials may run on progressive or regressive platforms. They may successfully advance their agendas, or fail to do so. They may run on platforms that fully or partially match their true views. And they may change their views and priorities once in office in light of financial, legal, or political constraints.
For all those reasons, electoral platforms and campaign discourse may not translate into actions. Yet, they are the only signals the electorate has at the ballot box, and remain the only clue we have about candidates’ priorities before election day. Thus, it is important not only to understand the priorities of elected officials (which Han et al. (2021) did use social media electoral campaigning materials) but also to explore potential divergences between their discourse and decisions. Those divergences, as well as path dependencies and resource constraints, may contribute to the plan “implementation gap.”
To examine how those divergences may impact plan implementation, we need to explore whether and to what extent planning priorities expressed during electoral campaigns translate into actual decisions, that is, votes, once elected officials are in office.
We identify municipal elected officials’ planning priorities through their social media posts (Han et al., 2021). The literature on municipal use of social media is rich and growing. Cities and city officials use social media to disseminate, or “push,” information to the public in one-way communications, for example, with announcements and open data platforms; to engage residents, for example, via two-way communication and networking system (especially via Twitter); and to deliver government services and provide participatory opportunities through e-government strategies (Bonsón et al. 2019; Gruzd et al. 2018; Haro-de-Rosario, Sáez-Martín, and del Carmen Caba-Pérez 2018; Graham, Avery, and Park 2015; Ellison and Hardey 2014; Oliveira and Welch 2013; Mossberger et al. 2013; Graham and Avery 2013).
Politicians also use social media during electoral campaigns and while in office for a variety of reasons. They can engage directly (in a de-mediated fashion) with their constituents, and generate greater public engagement by using social media platforms (Marquart et al. 2020). Politicians tend to be more trusted when they present themselves and their views on social media and through opinion pieces (e.g., blogs) than on traditional media (Enli and Rosenberg 2018). Thus, they build on social media to appear more honest and authentic to their constituents—this is particularly true of populist politicians (Schmuck and Hameleers 2020; Ernst et al. 2019). It is noteworthy that most studies in the literature find that public officials use social media mainly as one-way communication tools, especially Facebook and Twitter rather than two-or-more-way communication and exchange platforms, most likely in an effort to control their messaging. Such carefully worded and thought-out postings could elucidate their official positions on controversial planning agendas which may lead to their decision-making (i.e., votes) during city council meetings.
Thus, this paper seeks to answer the following research question: What can elected officials’ Tweets reveal about their planning priorities, and can they shed light on their votes in support of, or in opposition to, planning agendas?
Methodology
Previous research shows that tweets provide relevant and meaningful information about the contents of elected officials’ communications with their constituents on salient planning issues. Using the case of the 2017 Calgary Municipal Elections in Canada, Han, Laurian, Dewald (2021) demonstrated that elected officials’ social media campaign communications can be used to identify their priorities and perceptions of planning topics, to contrast those priorities with plans, and to identify whether discrete plan components align with candidates’ and councilmembers’ priorities—and might thus be more or less likely to be implemented. Here, we explore whether council members’ votes align with their pre- and post-election communications, and with the plans. Using Twitter data collected from the mayor and the city councilors since the 2017 Calgary election, we performed a series of text content analyses—Semantic Network Analysis and Sentiment Analysis to answer our research question. Figure 1 illustrates the conceptual and analytic framework developed for this study. Conceptual and systematic analytic framework.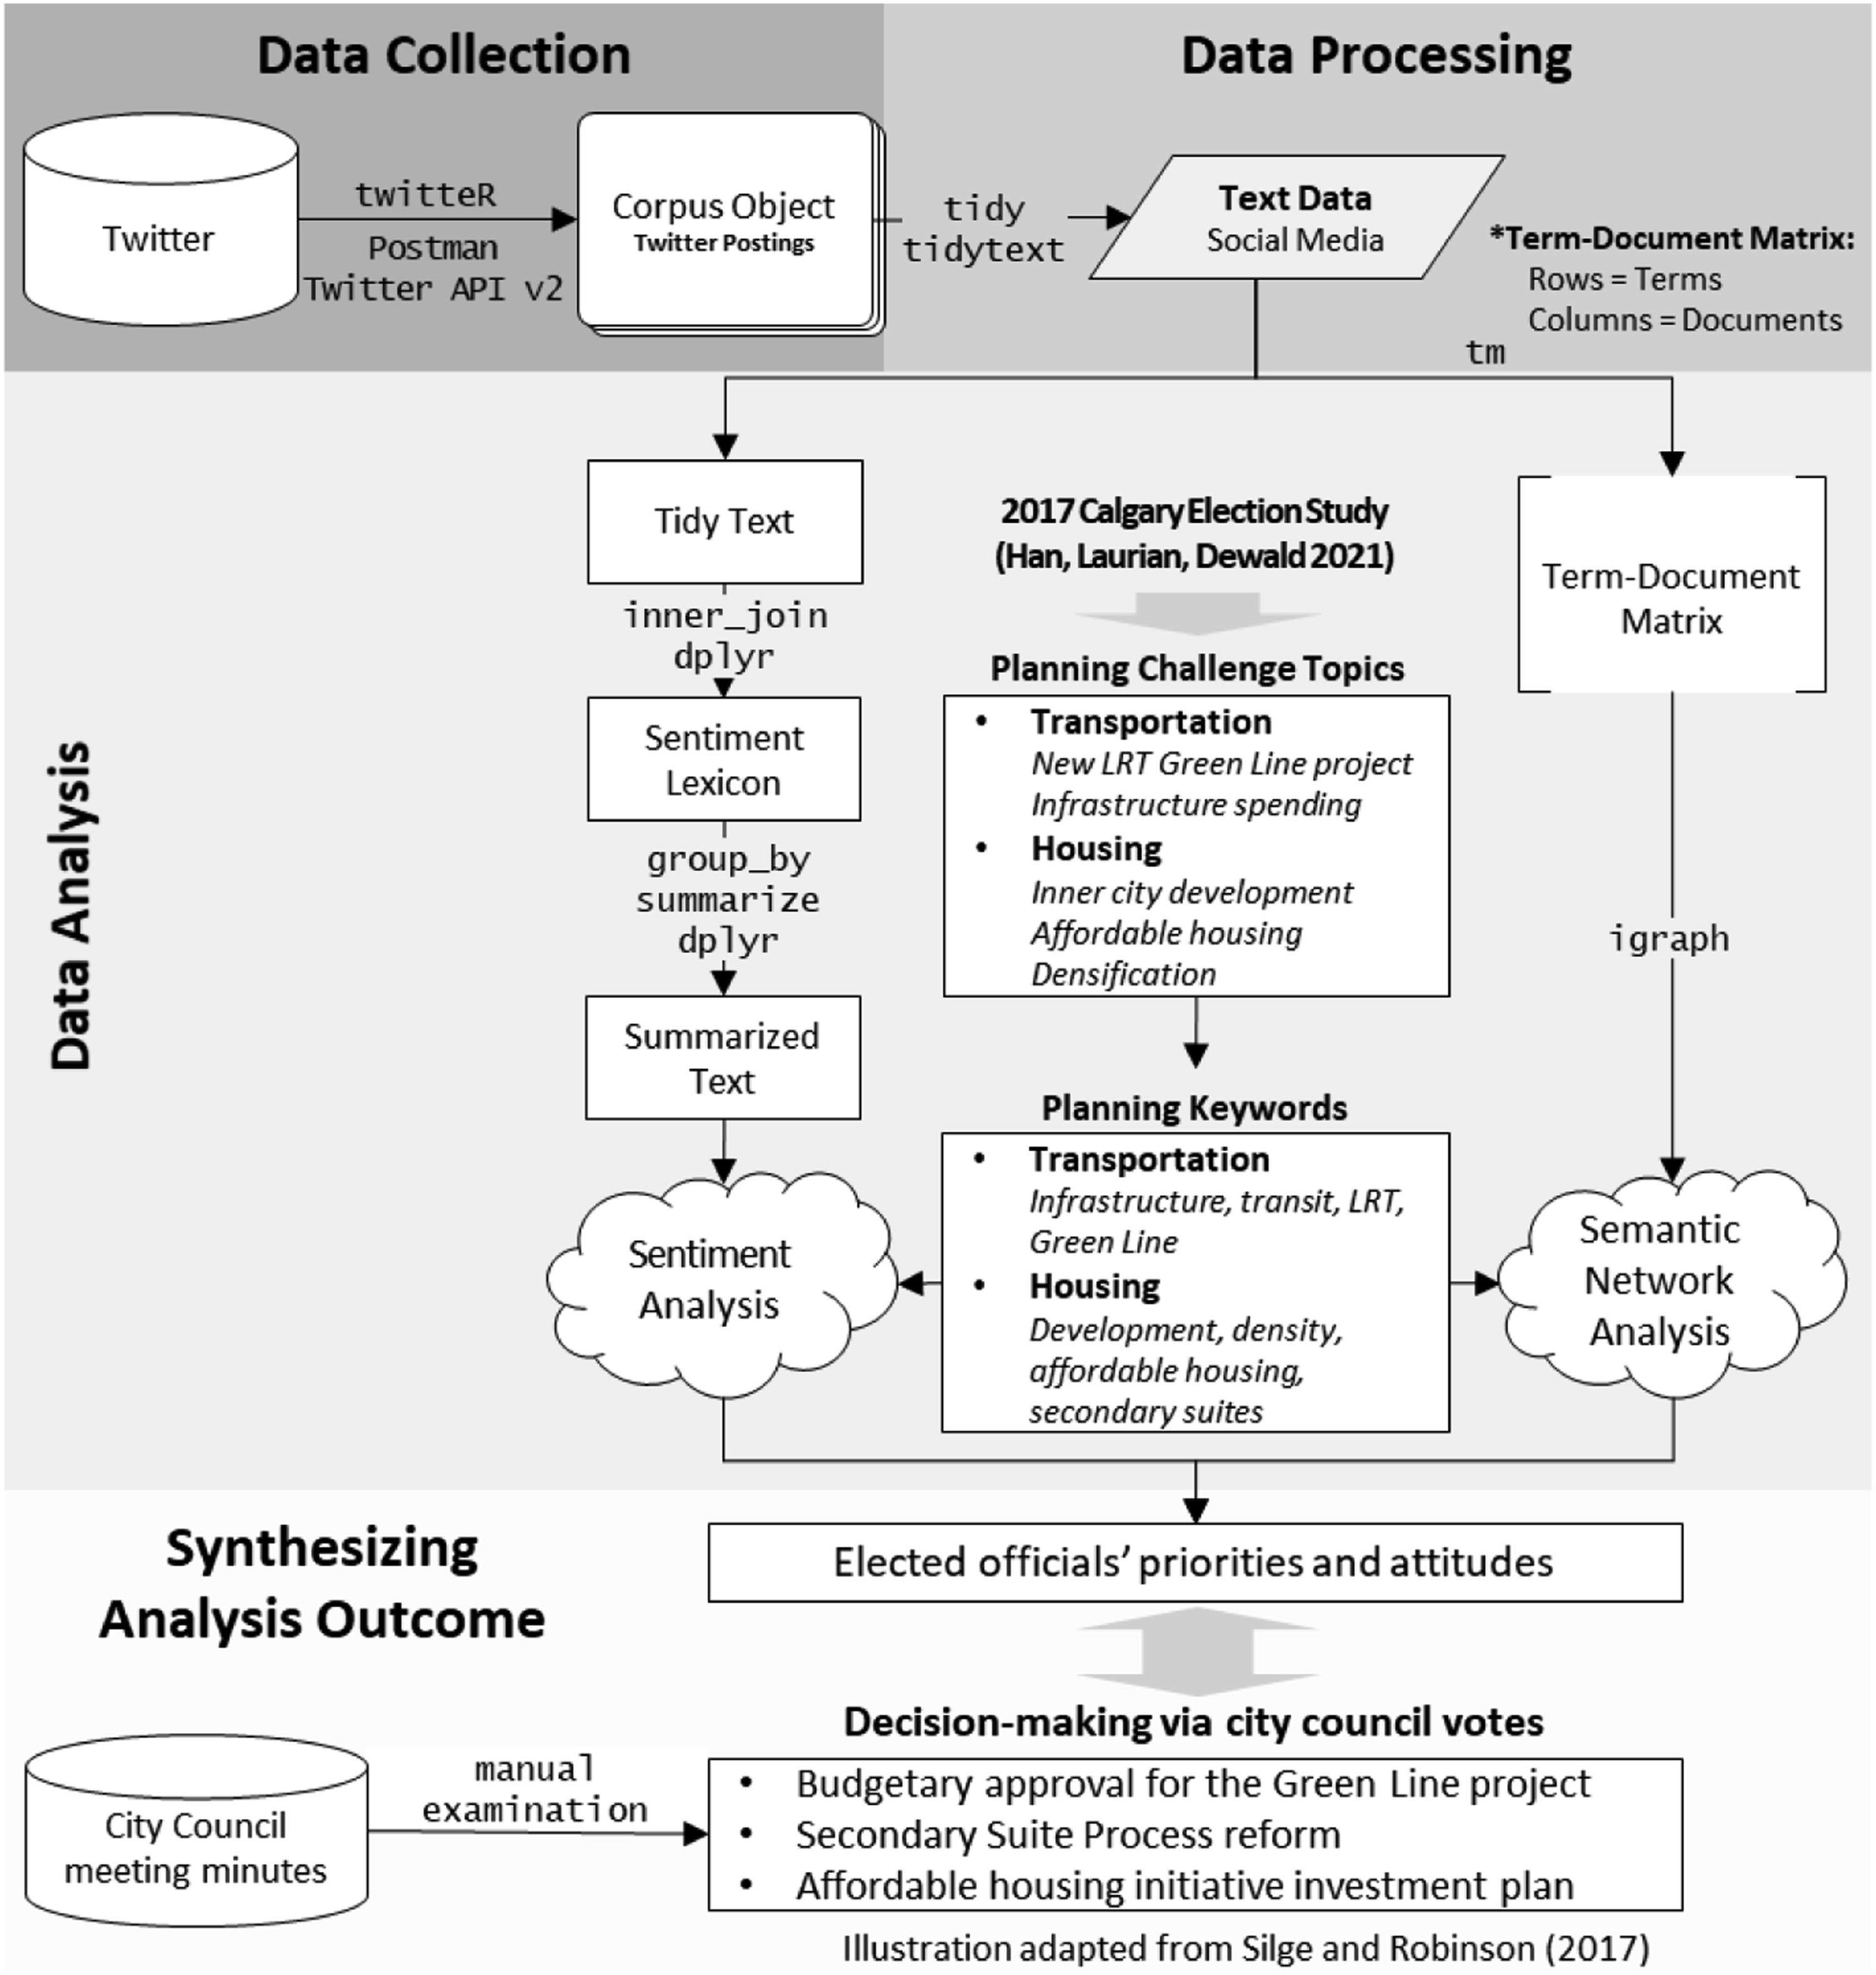
Data collection
We tracked the Twitter posts of elected officials and their voting records from July 2017 to December 2020. This period included the 3 months of the election campaign period from July 2017 to October 2017 and the post-election period from November 2017 to December 2020. We only collected Tweets from the 14 publicly disclosed official accounts of the mayor and councilors. 1 Official accounts are typically used by elected officials to express their views on salient local agenda items that are likely to come up for decisions and votes (Larsson and Skogerbø 2018). We used Twitter Open Application Program Interface (API)–based “rtweet” package in R to download tweets (Kearney et al. 2020). After manually examining the collected tweets, we found that there were missing elements as Twitter limits the bulk downloading of tweets by 3,200 per user. We thus used another API-based Twitter downloading tool called Twitter API v2 on Postman to collect archived tweets by users and timelines. In total, we collected 32,530 tweets from the 14 elected officials over the course of three and a half years. We extracted corpus data from the collected tweets using a text mining package called “tm” in R (Feinerer, Hornik, and Artifex Software, Inc. 2017)
Figure 2 shows the distribution of the collected tweets by elected officials and fiscal quarters, as well as the timing of key local planning decisions. As the total number of tweets varies greatly by officials, we normalized the number of tweets for each fiscal quarter by the total number of tweets posted during our study period. The number of tweets for all 14 elected officials peaked during the campaign period (Q3 2017), then declined until the fourth quarter of 2020. Elected officials’ Twitter activity spiked considerably in Q4 2017, Q2 2018, Q4 2018, Q2 2019, and Q2 2020, that is, at the time of approval of the process for approving Secondary Suite (2017 Q4), of the Light Rail Green Line (2020 Q2), and of the spending plan for the federally funded affordable housing Rapid Housing Initiative (2020 Q4). The spike in Q4 2018 corresponds to the period when councilors were debating bidding for hosing the 2026 Winter Olympic games. After a majority of the electorate opposed the bidding, the councilors ended the exploration. The spike of Twitter activity for Ward 14 councilor stood out in Q2 2019 when he expressed strong support for extending producers’ responsibility for recycling, but this activity did not correspond to any policy decision. Percentage of tweets by fiscal quarter and major policy decisions.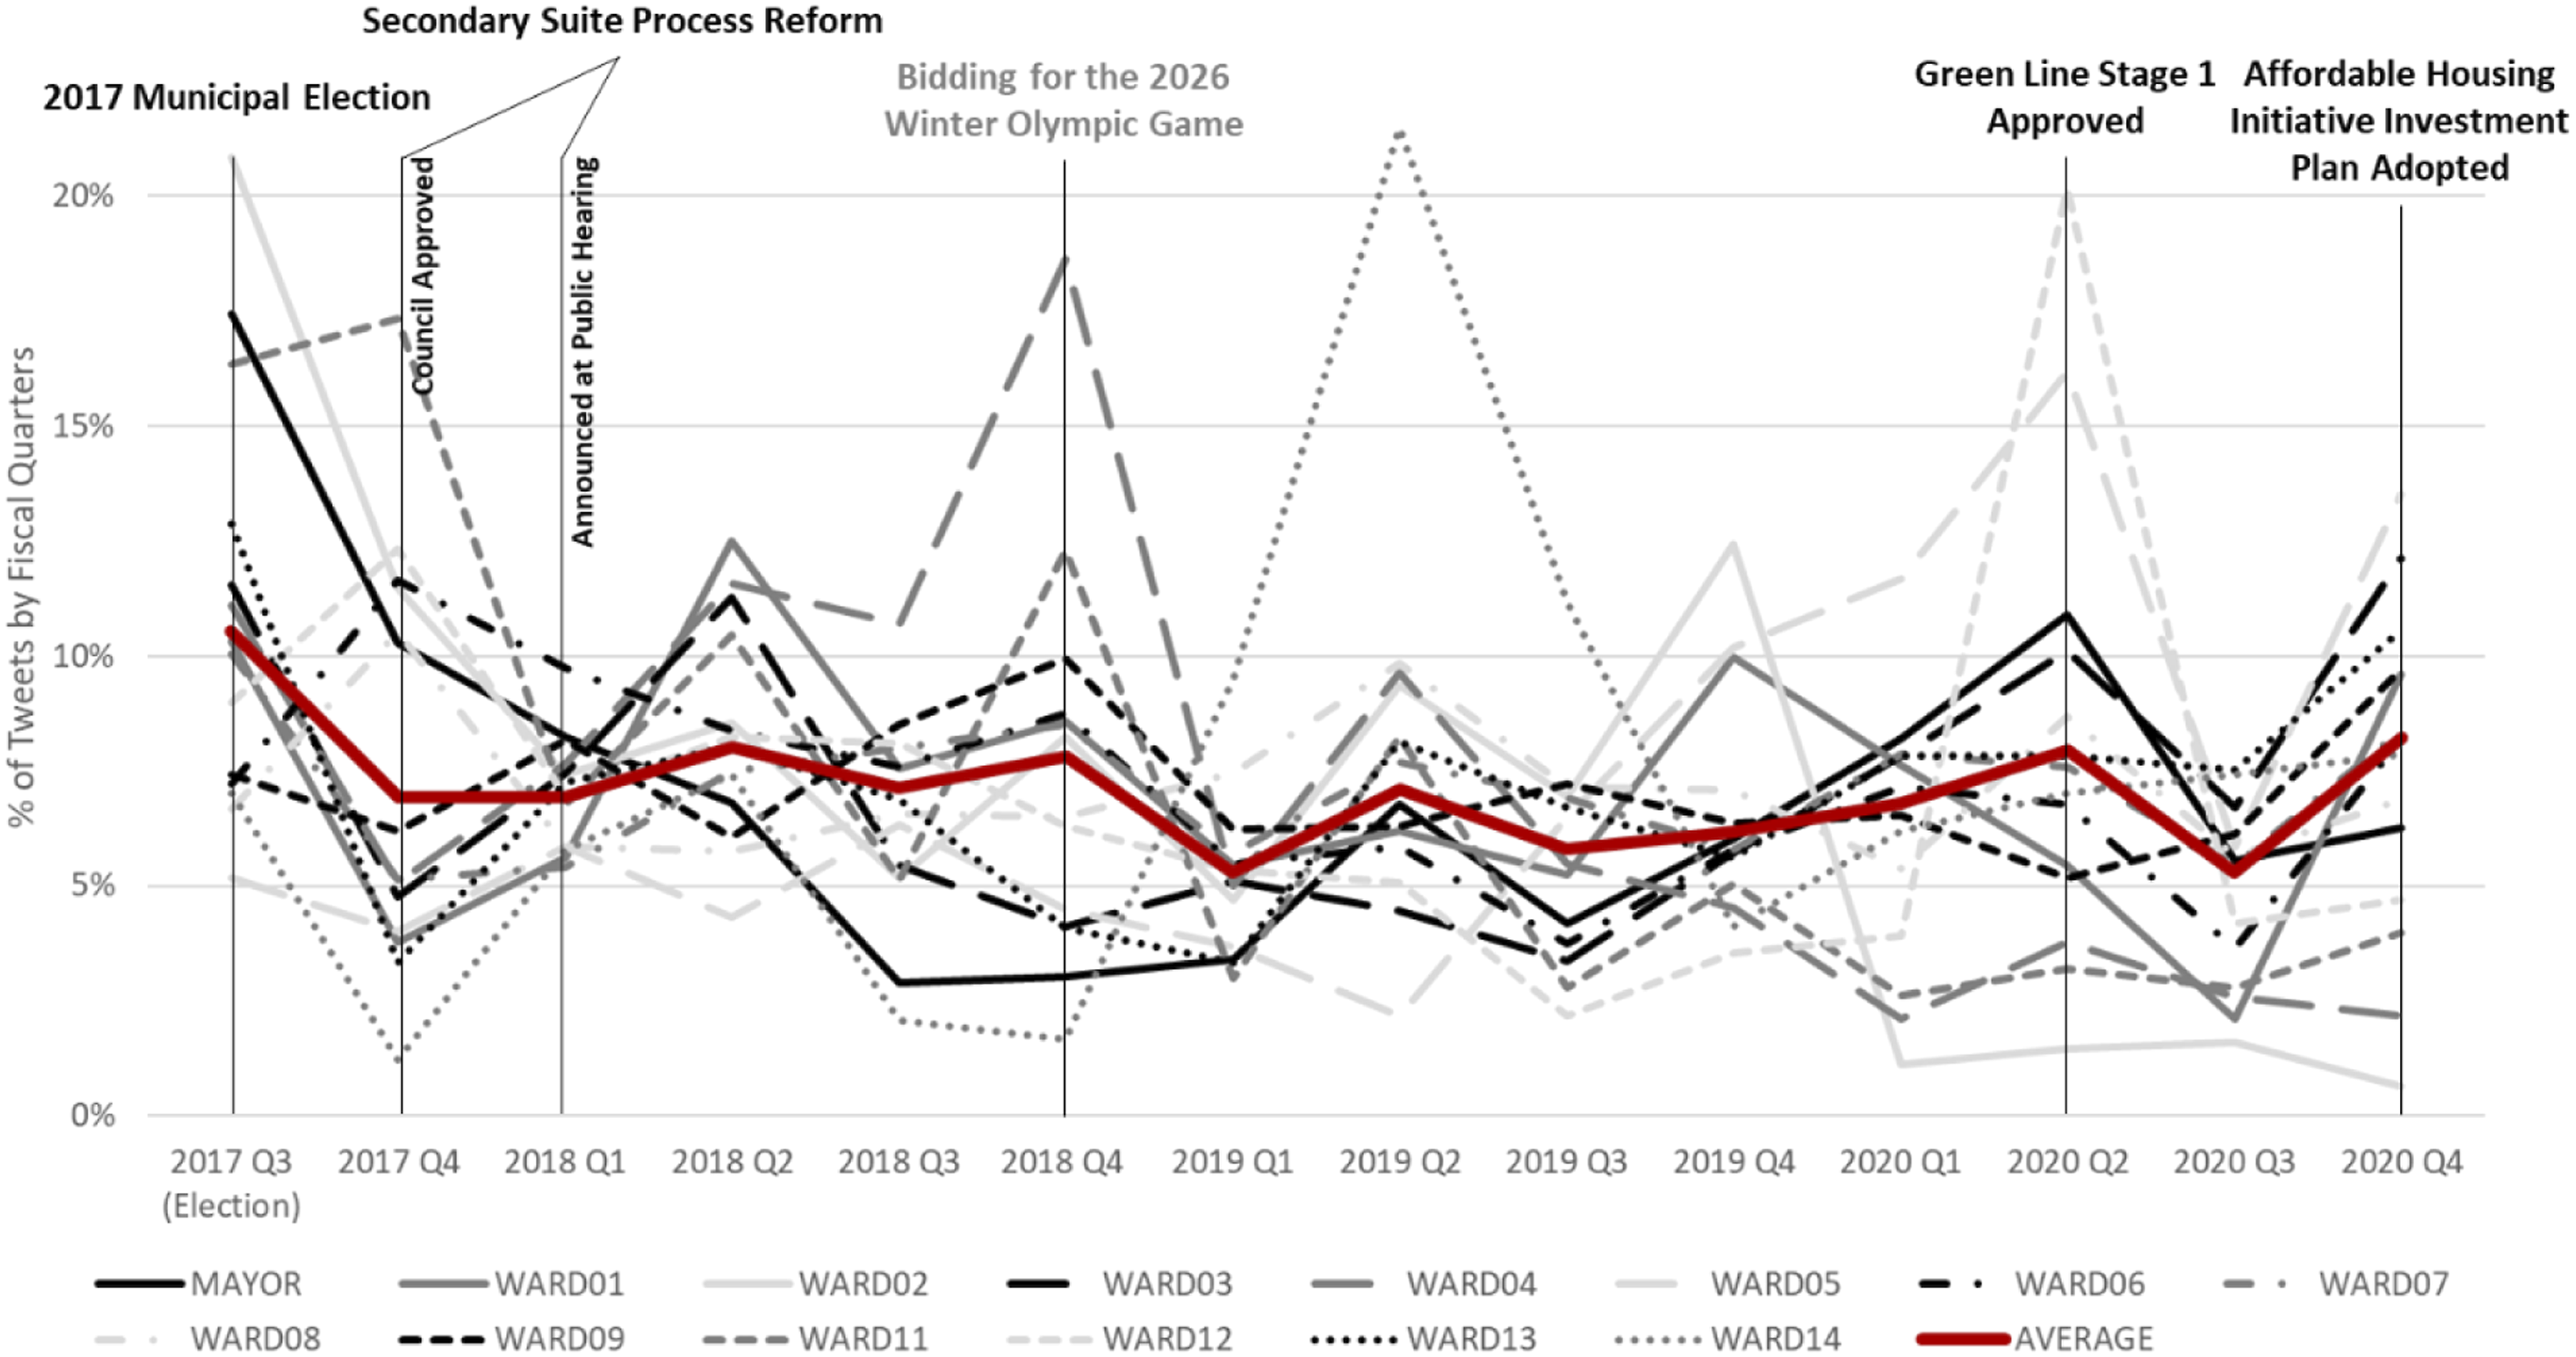
Topic selection: Identifying planning priorities through tweets
While Han, Laurian, and Dewald (2021) explored the salience of all planning topics in electoral campaign social media posts, this study aims at linking the views elected officials express to their decision-making votes. Some planning-relevant topics that emerged as important in the electoral campaign cannot be linked to actual votes or decisions. For instance, it is difficult to link anti-tax or anti-regulation platforms to specific votes (a councilperson may vote against a project to reduce tax spending, or because they disagree with project contents). In contrast, for specific infrastructure projects or regulatory changes, such as light rail or residential densification efforts, Nay or Yay votes can be contrasted to views expressed about the project.
In the 2017 Calgary Municipal Election, Han, Laurian, and Dewald (2021) found that elected officials prioritized, in their campaign social media communication: Transportation topics, especially Transit (it was the mayor’s sixth priority and on average councilors’ third priority) and the newly planned Green Line Light Rail Transit (LRT) (the mayor’s second and councilors’ fourth priorities). Other key priorities were related to Housing: development was the mayor’s third priority and ranked 10th priority among councilors; housing Affordability ranked as the mayor’s fourth priority and councilors’ 16th priority, and Secondary Suite (known as Accessory Dwelling Units in the US) was councilors’ 15th priority, but it did not appear in the mayor’s campaign social media.
To assess the linkage between the prioritization of planning topics in electoral campaigning and actual decisions, we focus on Transportation and Housing. Transportation topics include Transit, BRT, Light Rail, and the Green Line, as well as Streets, Roads, Sidewalks, and Expressway. Secondary Suites were proposed to densify the suburbs and diversify the affordable housing stock in the inner suburbs. Thus, the topic is conceptualized as nested under Density and Housing Affordability (see Figure 3). The analysis parameter: Nested keywords on transportation and housing.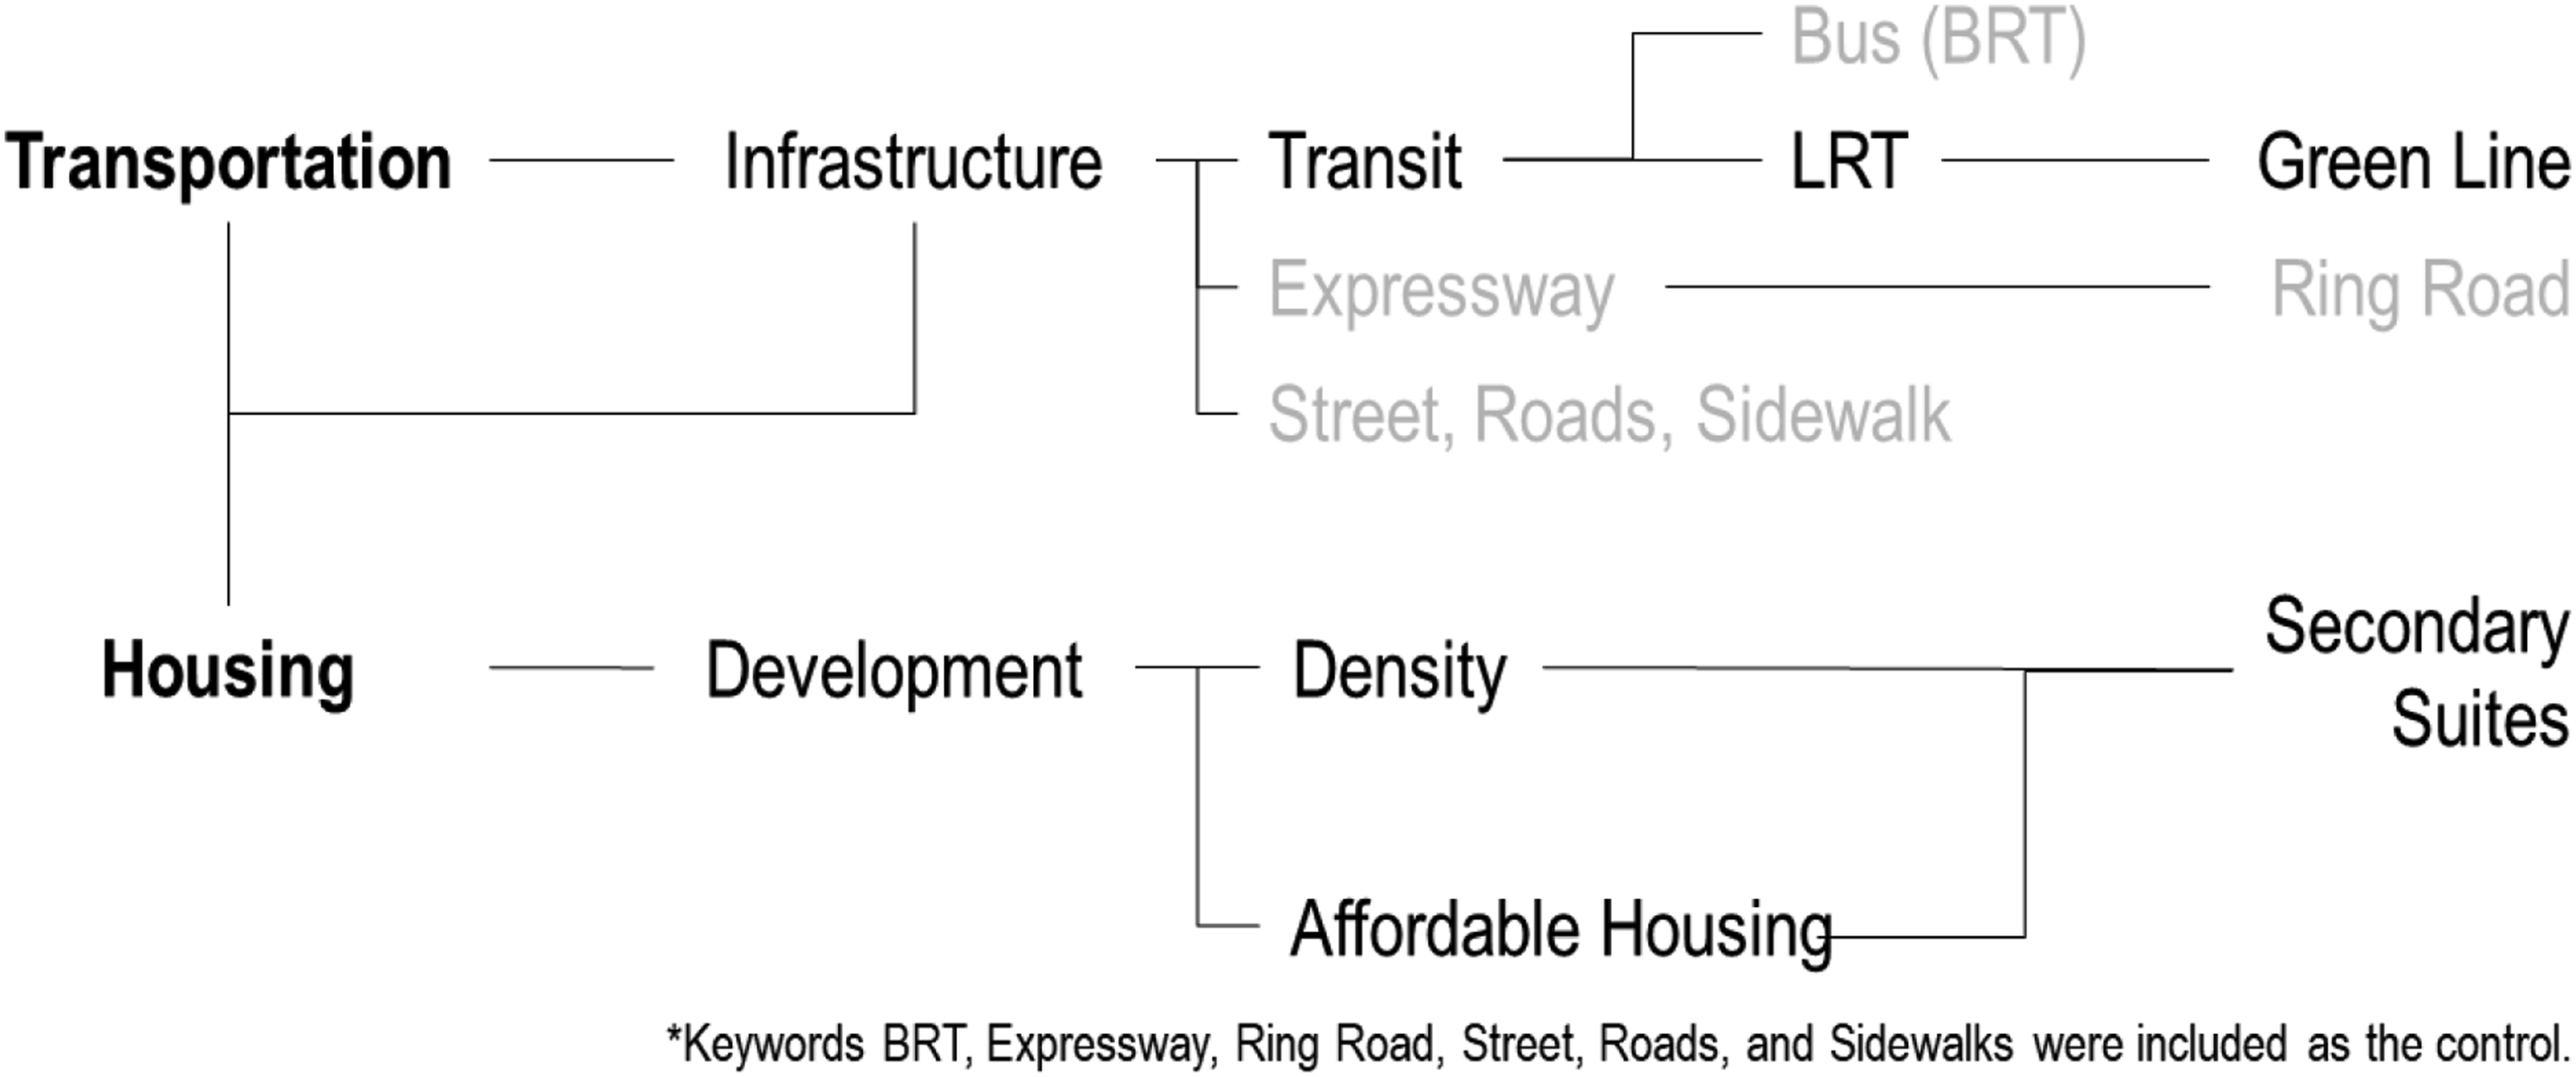
Plan and policy decisions to implement the planning elements.
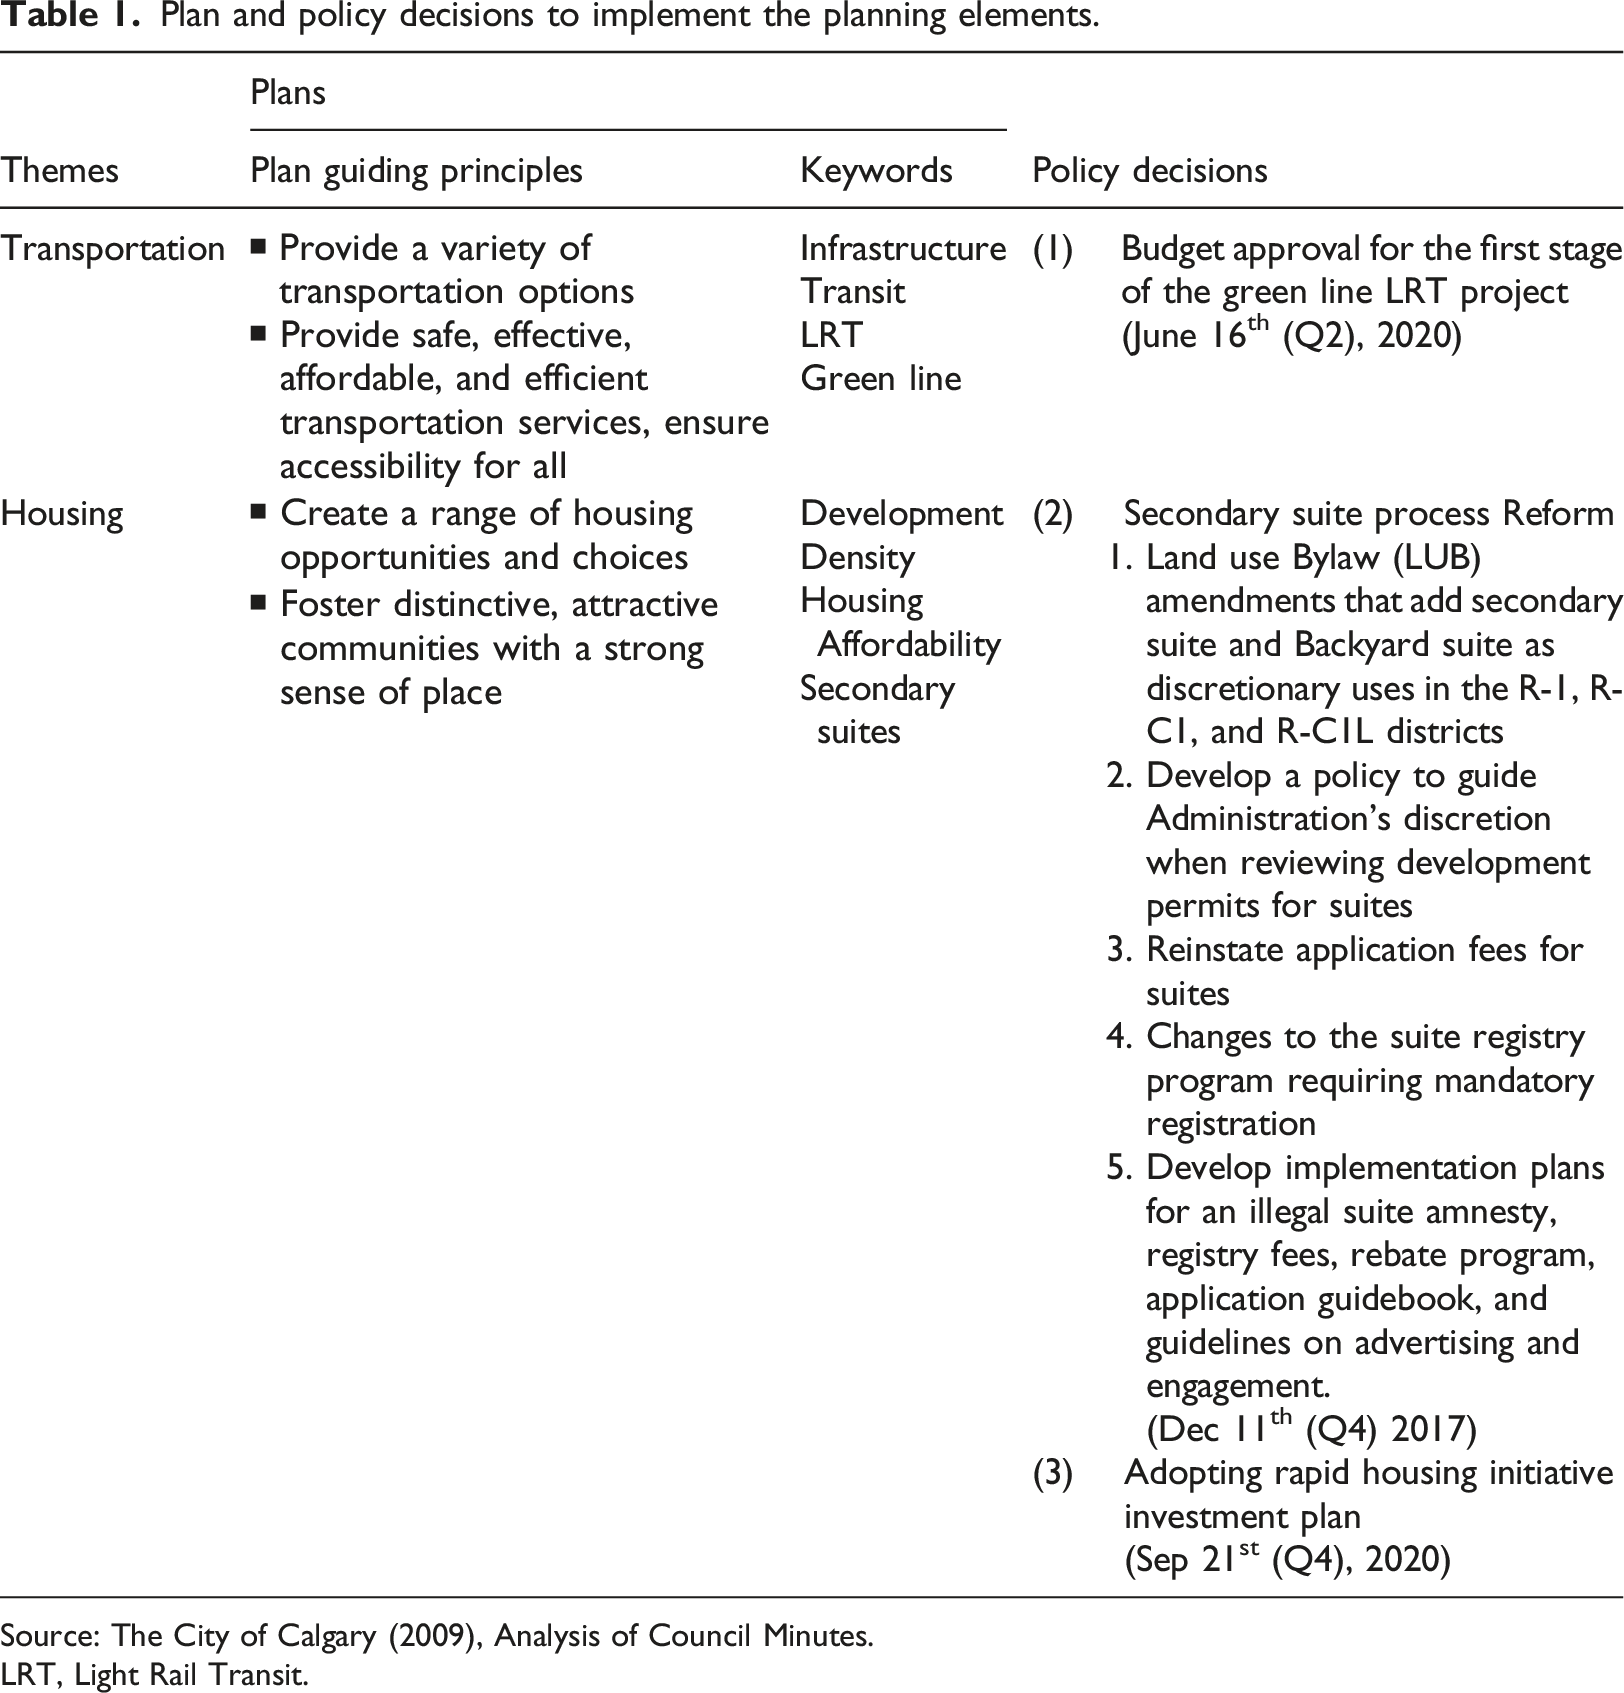
Source: The City of Calgary (2009), Analysis of Council Minutes.
LRT, Light Rail Transit.
Semantic network analysis: Assessing the priorities
We use Semantic Network Analysis (SNA) to identify the extent to which elected officials prioritized transportation, development, and housing-related planning issues over time. SNA treats texts as networks of words (nodes), connected to other words (other nodes). For each tweet, all words are nodes operating in the context of a vast network of other words. This type of network analysis has the advantage of “representing the semantic content of message in the actual, natural language in which they were originally expressed, resulting in greater external validity and reducing translation error in moving from what is said to the representation, resulting in greater internal validity” (Danowski 1993: p. 219 from Doerfel 1998). While word frequency counts are commonly used in text analysis, SNA considers frequencies as well as words’ positions in their semantic corpus contexts (Yang and González-Bailón 2016, 333; Diesner and Carley 2011; Atteveldt 2008; Carley and Palmquist 1992). For instance, the two examples below have the same word frequency for Transit. Candidate (A) And let the festivities (festival) begin! #Calgary Transit has ramped up service to (…) 24hrs. Yahoo! Candidate (B) Construction has already begun on the North Crosstown BRT this past July. This project will make transit move faster along this important corridor, and when the Green Line comes north it will make our commutes even faster.
While Candidate (A) only expresses positive sentiment on extending transit service during a festival, Candidate (B) focuses on Transit in association with other important terms like BRT, Green Line, Corridor, and Commutes. Both candidates use the word “Transit” once. However, when taking the semantic context into account, Candidate (B) connects Transit to other important keywords, thus “prioritizing” Transit more than Candidate (A). Since the Eigenvector Centrality assigns relative scores, ranging from 0 to 1, to each term within the Semantic Network and weighs the word connected to other words with high scores, the ECS of Candidate (B) is higher than the ECS of Candidate (A). The ECSs of each topic keyword were calculated from the aggregated texts containing the keywords, for each elected official, and for each quarter, and then visualized using bubble charts to show longitudinal changes in elected officials’ priorities on the given keyword over time. By aggregating tweets on a keyword posted by each elected official in each fiscal quarter, we sought to control for various styles of writing (e.g., short or long) when conducting semantic network analysis. Our manual examination of randomly sampled tweets confirmed that these aggregated tweets contained enough contexts to analyze elected officials’ priorities.
Sentiment analysis: Assessing attitudes
Sentiment analysis is widely used for analyzing opinions expressed in social media (Ceron et al. 2015; Ceron et al. 2014; Chung and Mustafaraj 2011; Godbole et al. 2007; Mostafa 2013; O’Connor et al. 2010). To assess elected officials’ attitudes toward each keyword, we conducted a sentiment analysis of the corpus using a positive/negative opinion lexicon dictionary, Bing, developed by Liu (2012). The Bing dictionary is made up of 6789 words, 2006 of which are positive and 4783 are negative. We also considered using another lexicon dictionary AFINN developed by Finn Arup Nielson which consists of 1598 negative words and 878 positive words (Naldi 2019). The sensitivity analysis comparing the results from using two different dictionaries showed that the two were positively correlated (cor = 0.731, t = 153.26, df = 20465, p-value < 2.23e−16). Because Bing dictionary offers a wider range of emotional terms, we decided to use it for our sentiment analysis.
To examine potential changes in elected officials’ priorities and attitudes toward each topic during and since the election, we first subset the Tweets containing the keywords of interest and categorized them by fiscal quarters. In doing so, we sought to compare the expressed sentiments of the 14 elected officials on each keyword at a given time and track the changes in their sentiments over time. We calculated the sentiment score by subtracting the sum of negative terms from the sum of positive terms and then divided it by the total number of emotional terms (the sum of positive and negative terms) for each tweet containing the keyword. Then, we calculated the average of the sentiment scores of the keyword-containing tweets grouped by elected officials and fiscal quarters. This normalization was done to control for the elected officials’ “tendency” in their sentimental expressions on a given keyword. We acknowledge that the sentiment expressions do not always equate to users’ opinions or positions on controversial matters, but we believe that by calculating the average score from the aggregated samples we could assess whether their overall attitudes gear toward supporting or opposing planning agendas of our interest. Our analysis showed that while some elected officials indeed showed a tendency to use monotonous and neutral tones, some exceptional ones tended to use stronger emotional terms which coincided with their positions on certain planning agendas.
Tracking decision-making via council votes
Next, we used voting records to assess whether priorities and sentiments (expressed before and after the elections) translate into actual decisions. All major planning decisions, whether infrastructure or programmatic investments (funding light rail or additional bus routes) or legislative or regulatory in nature (e.g., zoning changes) are enacted through city council votes. Elected officials’ voting records are systematically recorded in city council meeting minutes. We collected the minutes of all meetings in our study period (37 council meetings, no meetings were held during Q4 2017 and Q4 2018).
We analyzed council votes on all planning issues related to transportation and housing to examine whether and how elected officials’ priorities and attitudes toward each topic impacted their votes. First, we identified agenda items that were relevant to the transportation-relevant topics: “Infrastructure,” “Transit,” and project-specific terms such as “Green Line LRT,” and to housing-relevant topics: “Development” “Housing Affordability,” and “Secondary Suites.” During the study period, council meetings included 54 agenda items related to “Transit,” 21 items on “Infrastructure,” 21 items on the “Green Line LRT” project, 11 items on development/redevelopment (excluding zoning approvals), four items specific to “Secondary Suites,” and two items on “Housing Affordability.” Of these items, three items were identified as final decision-making that led to actions (i.e., implementation): final budget approval for the Green Line LRT project, adoption of the reformed Secondary Suites policy, and adoption of the budget allocation plan for the affordable housing project, Rapid Housing Initiative. After identifying these agenda items, we counted the number of “for” and “against” votes for each elected official. We joined this voting record to the findings from the Semantic Network Analysis and the Sentiment Analysis to assess the relationships between elected officials’ explicit priorities and their voting records.
Findings
Elected officials’ priorities (centrality) and attitudes
We present Eigenvector Centrality scores (ECS) and average sentiment scores (SS) in a single bubble chart by fiscal quarters between the 2017 Municipal Election and the last quarter of 2020 (Figures 4 and 5). The size of circles in each figure indicates the relative importance of keywords compared to other words in the elected officials' tweeter conversation (1: most important). The color of the circle shows the average sentiments in tweets containing the keywords (red: negative; blue: positive). Council meeting voting records are displayed on the right side of the bubble chart, indicating how each elected official voted on each agenda item related to the keywords. This illustration allows us to track how elected officials’ priorities and attitudes toward our keywords of interest changed over time. The period when the three key decisions on Transportation and Housing were made are highlighted with gray-colored boxes in Figures 4 and 5. Figure 5 shows how few posts focus on housing and secondary suites compared to transportation topics, which are much more salient in Calgary’s public concerns and news. Comparing these two figures to Figure 1 showing elected officials’ Twitter activity, we can see that the spike in the Twitter activity during Q2 2020 when the council approved the budget for the Green Line project coincides with significantly higher centralities of keywords Transit and Green Line in the same quarter. Twitter activity spiked when elected officials approved the spending plan for Rapid Housing Initiative, but we did not find a parallel increase in the keyword centralities. Longitudinal observation of elected officials’ planning priorities and attitudes on keywords transit and Green Line Light Rail Transit. Longitudinal observation of elected officials’ planning priorities and attitudes on keywords housing affordability and Secondary Suites.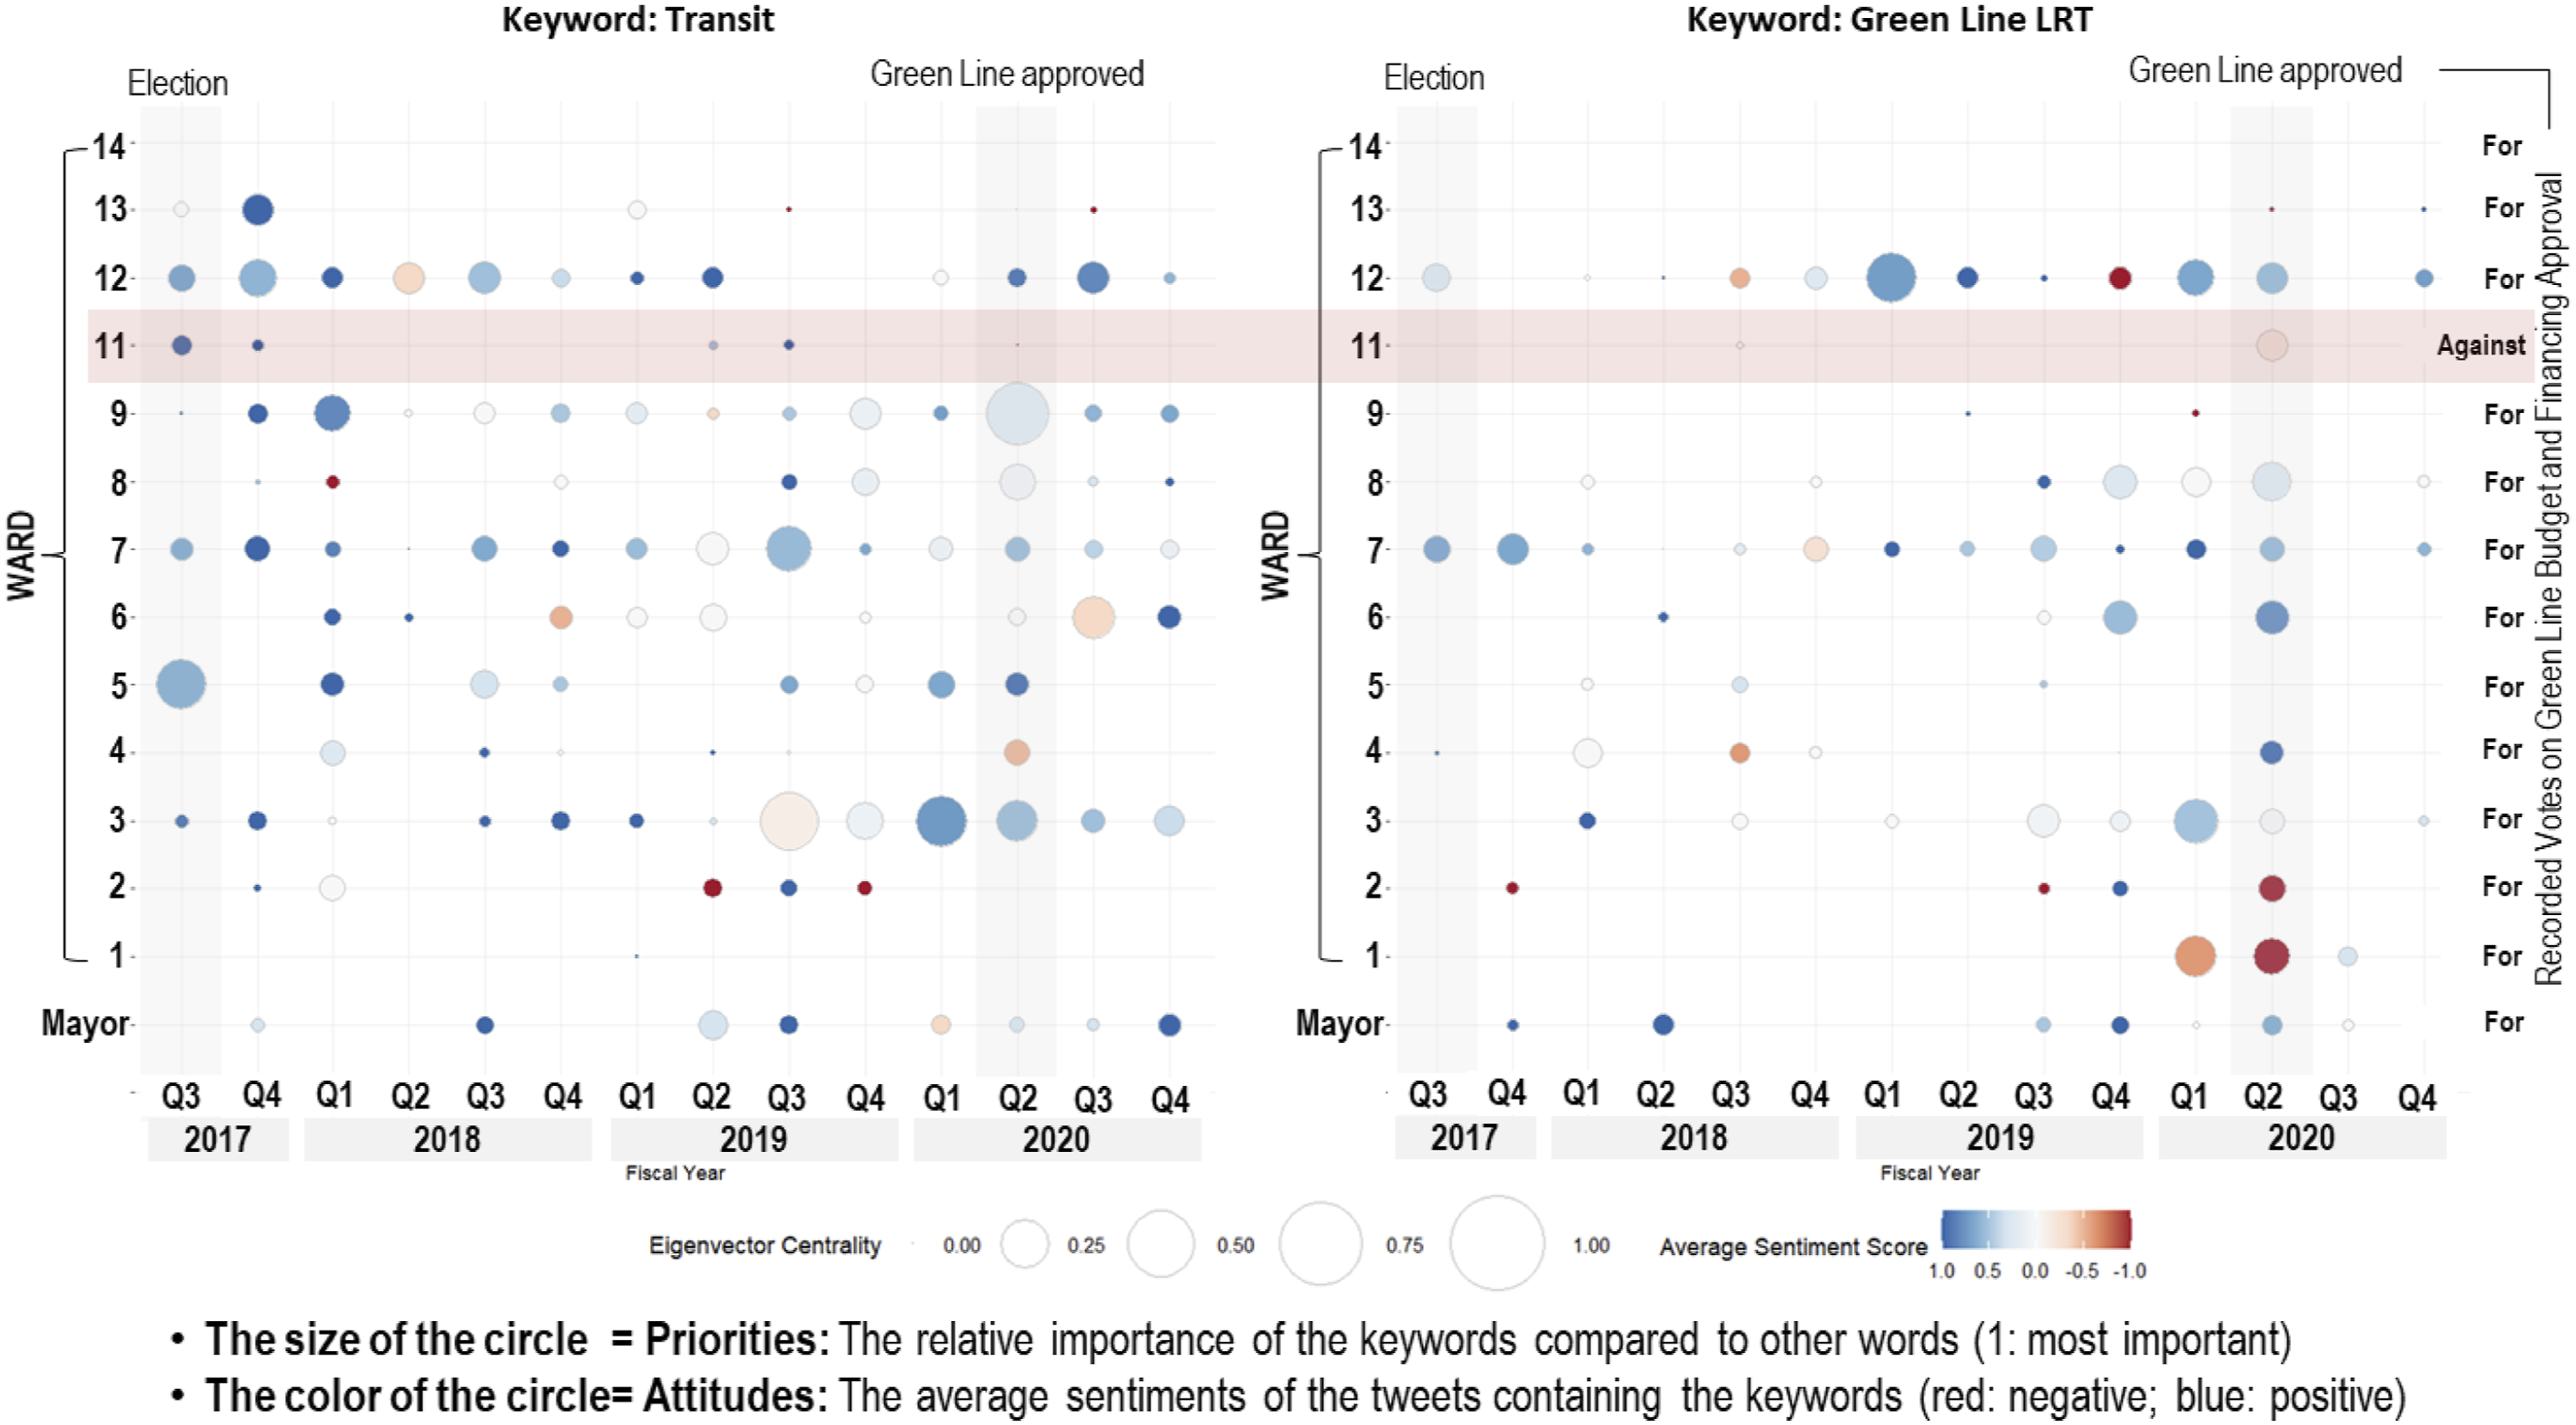
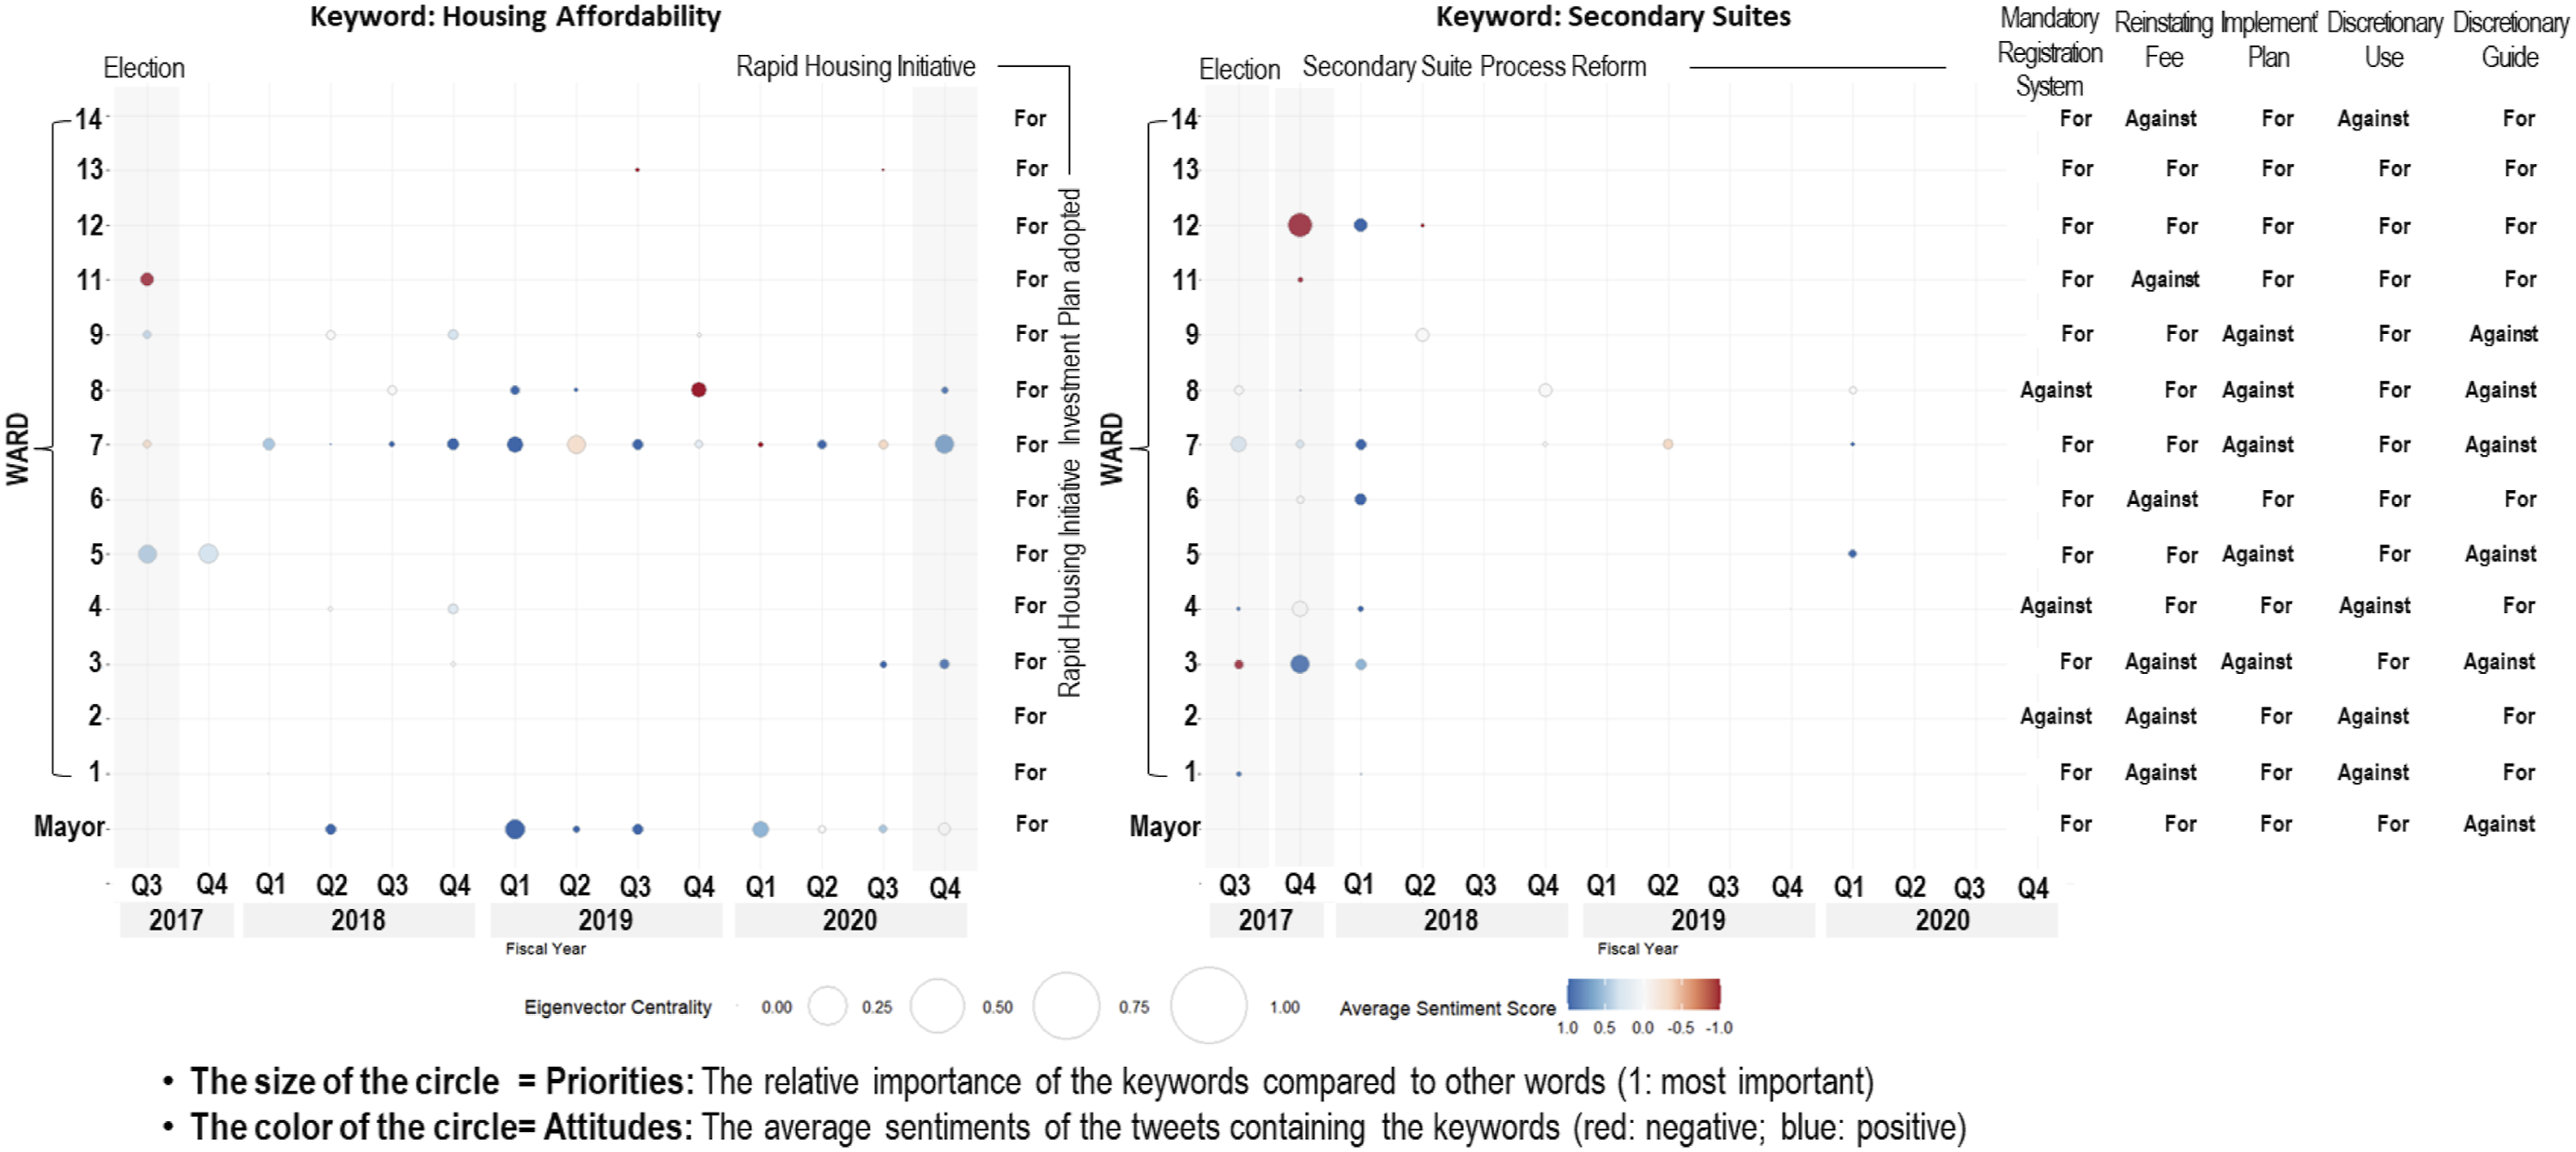
Figure 4 shows that councilors of Ward 3, 5, 7, 11, and 12 whose Twitter communications during the 2017 Election (Q3 2017) showed high centrality on the keyword “Transit” continued to tweet about Transit throughout their 3-years of tenure. Ward 7 and 9 councilors represent communities near the downtown area. “Transit” appeared every quarter in their tweets as they advocated for public transit throughout their term. These councilors generally showed positive attitudes in their Twitter communication about “Transit”—mostly colored in blue. Ward 2 councilor, who represents a greenfield suburb, did not discuss the topic much during his campaign or tenure; but when he did, he expressed very strong negative sentiments (Q2 and Q3 2019). Overall the councilors who showed positive sentiments with regard to transit during the 2017 election campaign continued to express their support for transit throughout their tenure (Ward 3, 5, and 12: outer suburbs). During Q3 2020 when voting to approve the budget for the first phase of the Green Line, the councilors representing the wards that will benefit from the new transit line showed strong positive sentiments (Ward 7, 8: downtown, and 12: outer suburb), whereas those representing the greenfield suburbs located on the edge of the city where the transit line will not be extended showed negative sentiments (Ward 1, 2, and 13: outer suburb). Ward 1 and 2 were particularly critical of the city’s approach to financing the Green Line project. We should note here that when politicians express their sentiments on projects, they may express themselves more strongly than residents would because they use communication platforms to position themselves on one side of a topic or another to appeal to their constituents, and potentially also “signal” their broader political views (e.g., general anti-tax positions, or pro-government interventions views).
Priorities, attitudes, and voting
In the council minutes, we found four agenda items related to the Green Line project that led to votes during Q2 2020. Before the final budgetary approval for the Green Line project, the agenda items went through a series of revisions during which some councilors voted “against” on items they did not agree on. For example, Ward 2 and 11 councilors requested that funding for the Green Line project be put the authorization of Calgary electors during the 2021 General Election. The other 12 councilors and the mayor voted against it. On the final vote to approve the budget for Stage 1 of the Green Line project (Green Line Budget and Financing Approval, GC2020-0616), the mayor and all councilors (except for Ward 11) voted “for” approving the project. Matching the voting record to Figure 4, we found some consistency in the prioritization of the Green Line—almost all elected officials actively tweeted about the Green Line project in Q2 2020 when the council meetings focused on the project. However, the association between the voting records and the attitudes expressed on Twitter was difficult to verify. The councilor of Ward 11’s negative sentiments expressed in his Tweets about Green Line in Q2 2020 was consistent with the “against” vote. However, Ward 1 and 2 councilors who also showed strong negative sentiments during this period voted “for” the approval. We explored this apparent discrepancy by examining their tweets.
Ward 1 councilor tweeted:
Calgary city council finance group's Number Two thinks
It’s great when people do ZERO research and imply something inappropriate. I am on the
Calgary on the cusp of disastrous decision on
And Ward 2 councilor tweeted:
I am live with @CalgaryToday on @770CHQR with @seanchucalgary this afternoon. We are talking about the arena,
Thank you @JyotiGondek for this Common Sense and Fiscally Responsible Plan for the
The north portion of the
While both Ward 1 and 2 councilors raised their concerns over the financing of the project, Ward 2 councilor also expressed his discontent over the Green Line not getting extended to his ward. Despite their discontent, they ended up voting to approve the budget with the rest of the councilors.
The Council of Ward 11 expressed concerns about the costs of the project. He tweeted his reasons for voting “no” saying:
More than a month ago, I submitted critical questions in writing to #yyccc administration. I made very clear that I needed this [key information] to make final decision on whether to proceed with the
Regarding housing, only a few councilors and the mayor talked about “Housing Affordability” after the election. Ward 7 councilor and the mayor talked consistently about affordable housing, mostly using positive terms. Although Ward 7 councilor does not have a professional degree in planning, she has been recognized as pro-planning during her 20 years on council. Regarding, affordable housing, she tweeted:
The Calgary Housing Company is happy to finally be working with a Minister who understands
For the first time in a very long time, we have all three orders of government plus housing providers working together to build and maintain
The incumbent mayor Nenshi, a strong advocate for affordable housing tweeted:
…We need continued investment to meet Calgary's
Over 15,000 new
Ward 11 councilor who expressed very strong negative sentiment on the keyword during the election did not discuss the topic afterward.
It's bizarre to see new
There was only one agenda item specific to “Housing Affordability” in Q3 2020 which was on the adoption of the Rapid Housing Initiative Investment Plan to use the federally funded Rapid Housing Initiative for affordable housing development. This agenda item was approved unanimously by the elected officials. This may indicate that when the elected officials have a common interest and are in general agreement with a particular issue, the issue may not appear much in their social media communications. In this particular case, the councilors appeared to have no reasons to oppose the item as it was about “spending” already awarded funds from the federal government.
Another major housing-related decision was the reforming of the Secondary Suites application and designation process. This agenda item was put on vote almost immediately after the elected officials’ new term began. As illustrated in Figure 5, the councilors voted on five sub-items on the reform which were all passed with majority votes with objections from a few councilors. Reforming the policy that had already been adopted from the previous administration may be a matter of technicality that is unlikely to raise any serious concerns. This may be the reason why the elected officials did not discuss much on the topic after approving the reform.
Conclusion: Tweets and votes analysis—a useful tool for planning practice and research
Social media can predict elected officials’ decision-making, but not always
Overall, we saw a significant increase in the elected officials’ Twitter activities and an increase in the centralities (i.e., priorities) when they discussed major policy decisions. We showed that social media can be used to describe elected officials’ priorities and their association with their voting patterns. For instance, Ward 7 councilor and the mayor who posted consistently and positively about housing affordability voted “yes” on the agenda items on affordable housing, and Ward 11 councilor who criticized the budgetary constraints of the Green Line project using negative terms voted “no” on the budget approval. However, we also found that some negative attitudes expressed on Twitter did not lead to voting “against.” Despite strong negative sentiments about the Green Line project, the councilors of Ward 1 and 2 voted “for” the budget. In the council minutes, we found that those councilors came to an agreement with the rest of the council after a series of deliberations and revisions. In other words, negotiated agreements changed their original negative positions to a “yes.”
Some of the elected officials’ consistent communication and decision-making somewhat verified what previous research had found about politicians’ communications on social media appearing more credible, honest, and authentic to their constituents (Enli and Rosenberg 2018; Schmuck and Hameleers 2020). We also showed that, as Tewdwr-Jones (2002) noted, decision-making is indeed a political process of deliberation and negotiation through which the elected officials modify planning decisions.
Decision-making depends on the nature of policies
Each of the three key policy decisions examined in this study had unique characteristics. Decision-making on the Green Line project was about approving infrastructure construction budgets, which is the final stage of plan implementation to enhance public transportation. In such a case, reaching consensus among the elected officials was easier because the project had already gone through numerous deliberations during the planning phase (e.g., reviewing plans from the planning department, transportation engineering studies, etc.).
The decision on affordable housing was about approving a plan to spend federal funds for affordable housing development, which is the beginning stage of plan implementation. Until these funds are allocated to communities for actual developments, the councilors are likely to discuss and vote on necessary policy items. During this phase, elected officials may support or oppose the items which will show as different degrees of priority (i.e., centrality) and sentiments in their social media communication.
Lastly, it may be easier to pass the agenda items on legacy policies established under the previous administration, especially when the majority of the elected officials are incumbents—10 out of 14 elected officials including the mayor are incumbents. Voting items related to the Secondary Suites reform policy were mostly about technicalities such as reinstating fees and changing zoning designations to permit Secondary Suites. In this case, the provisions were revised as needed when the majority opposed but eventually passed with majority votes.
Methodological framework to track plan implementation and its limitations
As more and more elected officials use social media to communicate with their constituents, we hope that the methodological framework used in this study could help voters better understand their elected officials’ priorities and attitudes toward important planning issues and how they may affect their decision-making.
We believe that tracking the Twitter activities along with important policy decisions could also help us understand the obstacles to plan implementation. For example, by detecting patterns from a massive amount of data consisted over 30,000 Twitter samples, we located the tweets of elected officials who voted against approving a budget for the LRT project, which could hinder the city’s goal of enhancing public transportation. From the focused analysis of the Tweets, we could identify the rationales behind their votes. The analytical framework used in this study could be further applied to analyzing various opinion-based text data for planning. For instance, planners could assess public sentiments on re/development projects and identify the most salient planning challenges from public input collected during the community engagement stage of the planning process.
Despite its usefulness and effectiveness, there are several caveats to applying these methods for planning practice and research. First, some actors are not active on social media, and this methodology does not capture their views. Second, since the analyses were based on selected keywords, we may have missed Tweets written using synonyms or misspelled keywords. Last, we recognize that Tweets from elected officials’ public accounts may not always represent their actual points of view as their posts may have been strategically worded with the assistance of professional communication staff. Thus, their public-facing communications may not always represent the rationale behind their decisions and votes. This calls for a follow-up study involving political psychology and strategic communication.
Footnotes
Declaration of conflicting interests
The author(s) declared no potential conflicts of interest with respect to the research, authorship, and/or publication of this article.
Funding
The author(s) received no financial support for the research, authorship, and/or publication of this article.