
Abstract
Complexity theory has become a conceptual framework and a source of inspiration for Smart City initiatives. In addition to many other conceptions, the Urban Digital Twin (UDT) became both a concept and a tool for generating the revolutionary act of data-driven 3D city modeling. Indeed, the UDT has increased the ability of planners to make decisions vis-à-vis data-driven city models; at the same time, however, it has attracted criticism because of its focus on the physical dimensions of cities. In facing these challenges, we seek to join the conceptual and practical efforts to generate a social turn in the field of Smart Cities and urban innovation. Creating a UDT with a social focus, we maintain, is not only a 1:1 translation of the built environment into the social realm, but also demands interdisciplinary knowledge from the fields of sociology, anthropology, planning, and ethics studies. This article makes theoretical and methodological contributions.
Prologue
This study took form during the outbreak of the Coronavirus pandemic of 2020–21, in which the age-old practices of quarantine and social distancing were employed as means of halting the spread of the virus. Prior to the pandemic, the goal of the study was to produce an administrative and planning solution for elderly residents of the neighborhood of Hadar in Haifa, Israel. The more the virus spread, the worse the situation of the elderly population in general, and in the neighborhood of Hadar in particular, became. During Israel’s second lockdown, 14 elderly residents died alone in their apartments, and their bodies were found in an advanced stage of decay only a few days later (data source: ZAKA-Israeli NGO rescue units). It was a meaningful moment for the development of our research. This was a new and unusual phenomenon for Israeli society that put the Municipality of Haifa in an uncomfortable and helpless position, raising the question: How could such a thing happen in a city like Haifa, which is ranked 24 on the list of the world’s Smart Cities (according to the IESE Cities in Motion Index, 2014 (Aharon-Gutman et al., 2018))? For us, it was a result of the lack of an effective social and administrative response to social issues within the conception of the Smart City (Kitchin, 2014; Sadowski and Bendor, 2019).
Introduction
In this article, we propose the Social Urban Digital Twin (SUDT) as a conceptual framework for incorporating social aspects into the decision-making process. The SUDT imbricates with the development and maturation of the Urban Digital Twin (UTD), which is associated with the ideas, logics, and practices of Smart City conceptions and technology (Batty, 2018; Shahat et al., 2021). The UTD model is viewed as the holy grail of Smart City technologies (Deren et al., 2021; Ruohomaki et al., 2018), serving as a means of collecting and integrating city data that is streamed in real time from physical devices connected to information and communications technology (ICT) and grounding it in a 3D model of physical space. The SUDT encodes methods from the UDT and expands them with sociological approaches, such as focusing on social issues like urban aging and gentrification, and integrating social fabric and the built urban environment. This, we hold, is reflective of a new socio-technical imaginary in the social turn of Smart Cities (Jasanoff and Kim, 2015; Sadowski and Bendor, 2019).
As with every social phenomenon, this study also had a contextual system that produced unique conditions for the growth of the idea of the SUDT. These contexts differ fundamentally from the conditions surrounding the development of previous Smart City technologies, including that of the UDT. The SUDT concept was developed as part of an applied research grant provided by the National Insurance Institute of Israel and in cooperation with local communities and with Haifa’s municipal Department of Welfare. In other words, the SUDT was developed by a technological-academic research institute using social-institutional funding and is therefore not subject to the logics of the neoliberal corporate economy (Cardullo and Kitchin, 2019; Harvey, 2003). Another difference between the environments in which Smart City technologies are typically developed and development of the SUDT lies in the case study and the geographical scale used. Commitment to the neighborhood scale in a locality characterized by ethnic mixing, low socioeconomic ranking, and a high percentage of elderly residents made engagement with the social fundamental to the project: that is, it is abundantly evident that this neighborhood cannot be understood without understanding poverty, old age, social disparities, etc. Another important contextual system was provided by the Coronavirus pandemic: the development of the SUTD began just moments before the pandemic and reached its height during the crisis itself. This period highlighted the importance of the social dimension in urban management during an epidemic and bolstered our motivation to engage in the social content world. Indeed, we maintain that the SUDT constitutes not only an act of translation between disciplines, but rather also a new conceptual idea that poses new questions and challenges regarding ethics and regulation, models of cooperative development, and power relations.
This article makes theoretical and methodological contributions.
In section one, we present the concept of the SUDT and its contribution to the theory of urbanism. Section two takes a look at the neighborhood of Hadar as a case study, with a focus on its elderly citizens during the Coronavirus pandemic. Section three constitutes the core of the study, with its formulation of the SUTD protocol as a tool for a social turn in Smart Cities. The proposed six-phase generic protocol can be applied to a wide variety of places and social issues. In this section, we demonstrate their application within our specific case study and show how the protocol sheds new light on the work of the municipal Welfare Department and civil society. The paper concludes with a summation of the process, its potential, and the conflicts it poses, and proposes follow-up studies for expanding the boundaries of the development of the SUDT.
Section 1: From UDT to SUDT: The social Turn in the field of Smart Cities
Over the past few years, projects from the field of Smart Cities have come under substantial criticism for focusing too heavily on technological development that can enable the city to manage urban crises (Cardullo, 2020; Nochta et al., 2020; Verrest and Pfeffer, 2018). This criticism comes in response to the lack of socio-technological applications aimed at assisting with and solving problems within urban systems (Cardullo and Kitchin, 2019; Sadowski and Bendor, 2019). In light of this criticism, Smart City technology companies have started to brand themselves as “social companies” while simultaneously meeting the neoliberal economic corporate conditions of profit and power relations (Harvey, 2003; Kitchin, 2013). Developments that have been portrayed as “social” because they reduce the communication between city residents and mayors, have intensified this criticism in light of the corporate dominance in building conceptions and tools, which has allowed corporate interests to seep into the social realm. The result has been a socio-technical imagination that has appropriated smart urbanism, established its status using the narrative of the urban crisis and technological redemption, and assimilated the social into sellable templates. Researchers have called for a counter-narrative to facilitate alternative social representation (Sadowski and Bendor, 2019 p.557). The absence of social perspectives in the realm of Smart Cities has resulted in immense disparity in the economic development and social resilience of different cities, and the outcomes constitute the main social challenges of our time: displacement, gentrification, and spatial inequality. These phenomena have emerged due to technological gaps between the welfare departments and the economic departments of cities, among other things.
Our research focuses on the UTD model, which is regarded as an essential tool for Smart City technologies (Ruohomaki et al., 2018). The roots of the development of the UDT lie in the processes of digital twin product design and production—that is, in the replication of physical consumer products within a virtual system that allows optimal symbolization and planning of the product or the production line (Grieves and Vickers, 2017; Singh et al., 2021). Over the past decade, the digital twin has also gradually developed into the urban field, producing a “virtual copy” of urban physical space (Batty, 2020; Shahat et al., 2021). The UDT links 3D models to urban data by feeding data from throughout the city into the UDT to provide an effective way of contemplating, recognizing, and controlling physical space. In many cases, the data that is fed into the UDT is generated by a variety of devices and means associated with Smart City technologies (Deren et al., 2021). Sensors, cameras, and smart technical infrastructures produced by Information and Communication Technology (ICT) and the Internet of Things (IoT) are integrated into the UDT datasets model, facilitating the creation of a multidisciplinary and multilayer image of the city (Batty, 2018). The UDT’s unique form allows the research, simulation, and testing of new design ideas for the city, the main goal of which is to improve the city system itself. Batty (2018) argues that UDTs are similar to a computer model and are limited in the variables and processes they can manage. Therefore, typical UDTs deal with a specific topic or issue, such as planning (Schrotter and Hürzeler, 2020), sustainability (Dembski et al., 2020), or disaster management (Fan et al., 2021), to name just a few.
We are critical of the UDT as a tool that portrays primarily the physical environment of the city and that has almost completely ignored the city’s social fabric. Smart Urbanism addresses this lacuna by adding the aspects of city technology to the ideas of urbanism (Verrest and Pfeffer, 2018). The theory of urbanism, which emerged from the field of urban studies, focuses on incorporating the physical and the social environments into a single fabric. In other words, it seeks not to focus on the urb (Latin: a city surrounded by wall, symbolizing the physical realm of cities) or the urbanus (Latin: the devotion or sense of belonging to a city, symbolizing the social realm of the city), but rather to face the challenge of urbanism—the relations between the two. In response to this challenge, Smart Urbanism proposes “citizen-centric” as a method of integrating the social fabric and the physical environment (Cardullo and Kitchin, 2019).
Researchers from the fields of Social GIS and Critical GIS have responded to this challenge with the argument that cartographic transformations using the tool of Geographic Information Systems (GIS) have the potential to bring about social change (Ballas et al., 2018; Pavlovskaya, 2018). These movements have called for adopting the methodology of GIS mapping technology, which is typically associated with the forces of progressive development and managed by economic corporations; they have also advocated change in fields of knowledge and methods of mapping to promote values and social issues that have been sidelined or have vanished from the public discourse.
In this study, we ask how the progressive development of Smart City technologies can be expanded by critical thinking in the social sciences, by doing that we hope will minimize the digital gap (Graham, 2002) between the municipal welfare departments and the conception of Smart City management.
Section 2: The case study: the neighborhood of Hadar in Haifa
Our case study focuses on the neighborhood of Hadar in Haifa, Israel’s third largest city. A port city with a long history, Haifa is home to a mixed population of Arabs and Jews. Today, Hadar has a population of 43,413 (according to the National Insurance Institute of Israel) living in 14 different statistical areas covering a total area of 2.83 square kilometers. Hadar was founded in 1922 on the mountainous slopes of Mt. Carmel, which required building within a complex topography (Fisher, 2014) and a building typology of three-to-four stories, with no elevator. At first, the neighborhood experienced a golden age during which cultural institutions and public buildings were built and the population was largely middle to upper class. Since the beginning of the 1970s, however, Hadar has experienced a process of social and physical decline (Shilo, 2018). During the mass Jewish immigration to Israel from the former Soviet Union in the 1990s, apartments in Hadar that had long stood empty were populated by new immigrants seeking inexpensive housing solutions (Komemi and Yavelberg, 2015). This period also witnessed the onset of the phenomenon of apartments being split into smaller apartments to maximize rental profits.
In the context of the city’s elderly population, Hadar is an aging neighborhood, with 16.7% of its residents over the age of 65, in comparison to a national average of 12%. Fifty-eight percent of the neighborhood’s 65+ population are either single, widowed, or divorced, in comparison to a national average of 40%. This indicates that the elderly residents of Hadar have a higher risk of living in solitude than Israel’s overall elderly population.
Engaging the issue of the elderly during the Coronavirus pandemic sheds light on new challenges to the neighborhood. The elderly residents who live alone and in poverty found themselves in extreme situations due to the “social distancing” requirement, which became a necessary condition for preventing and limiting Coronavirus infection. As a result, the first and second lockdowns witnessed the death of 14 lone elderly residents, whose bodies were only found in their homes a few days later (data source: ZAKA).
Section 3: SUDT protocol implementation
Phases of the development of the SUDT protocol. Each phase is based on unique technological conceptions and social-theoretical content.
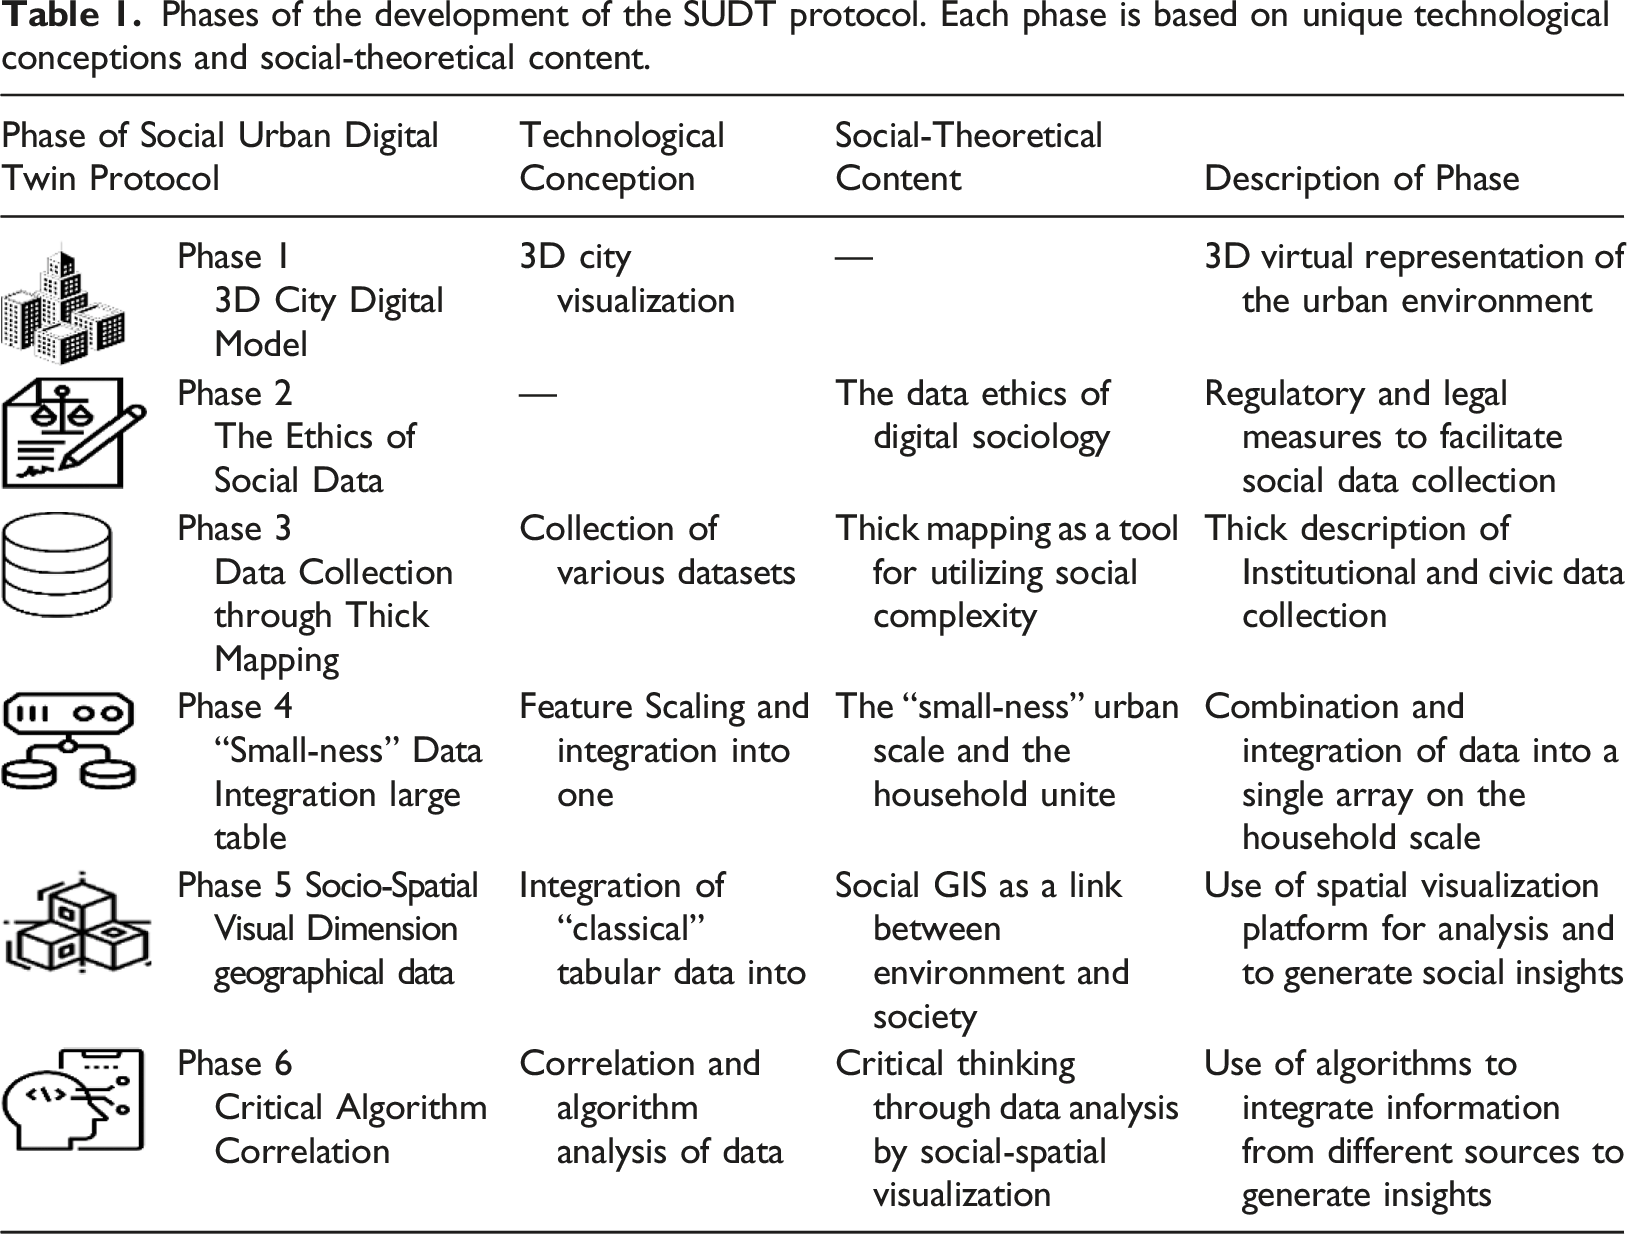
Phase 1: 3D city digital model
A SUDT creates a mirror image of the environment in virtual space (Batty, 2018; Grieves and Vickers, 2017). Therefore, the production of many UDTs has begun with a visual representation of the physical space within the virtual realm through the creation of 3D models of the city based on CAD design technology or VRML (Virtual Reality Modeling Language) (Levine et al., 2021). The 3D city model has made history as a tool for generating discussion and producing city strategy (Toland and Kilbane, 2018). Today, in the digital age, the 3D city model has assumed a new, virtual configuration, and its physical materiality has been replaced by multi-scale and multi-view photo-geometric technology, enabling it to be both dynamic and integrative (Shirowzhan et al., 2020). Therefore, the production of an SUDT begins with the creation of a 3D mirror image, in virtual space, of the built physical realm. There are many methods for creating 3D city models, from commercial companies, to open-sourced platforms such as OSM, to the use of drones with integrated cameras that produce completely automated real 3D models.
Two languages of 3D model representation of the physical environment. Left: Hyperrealism Model by Simplex. Right: Vector Spatial Model by Systematics.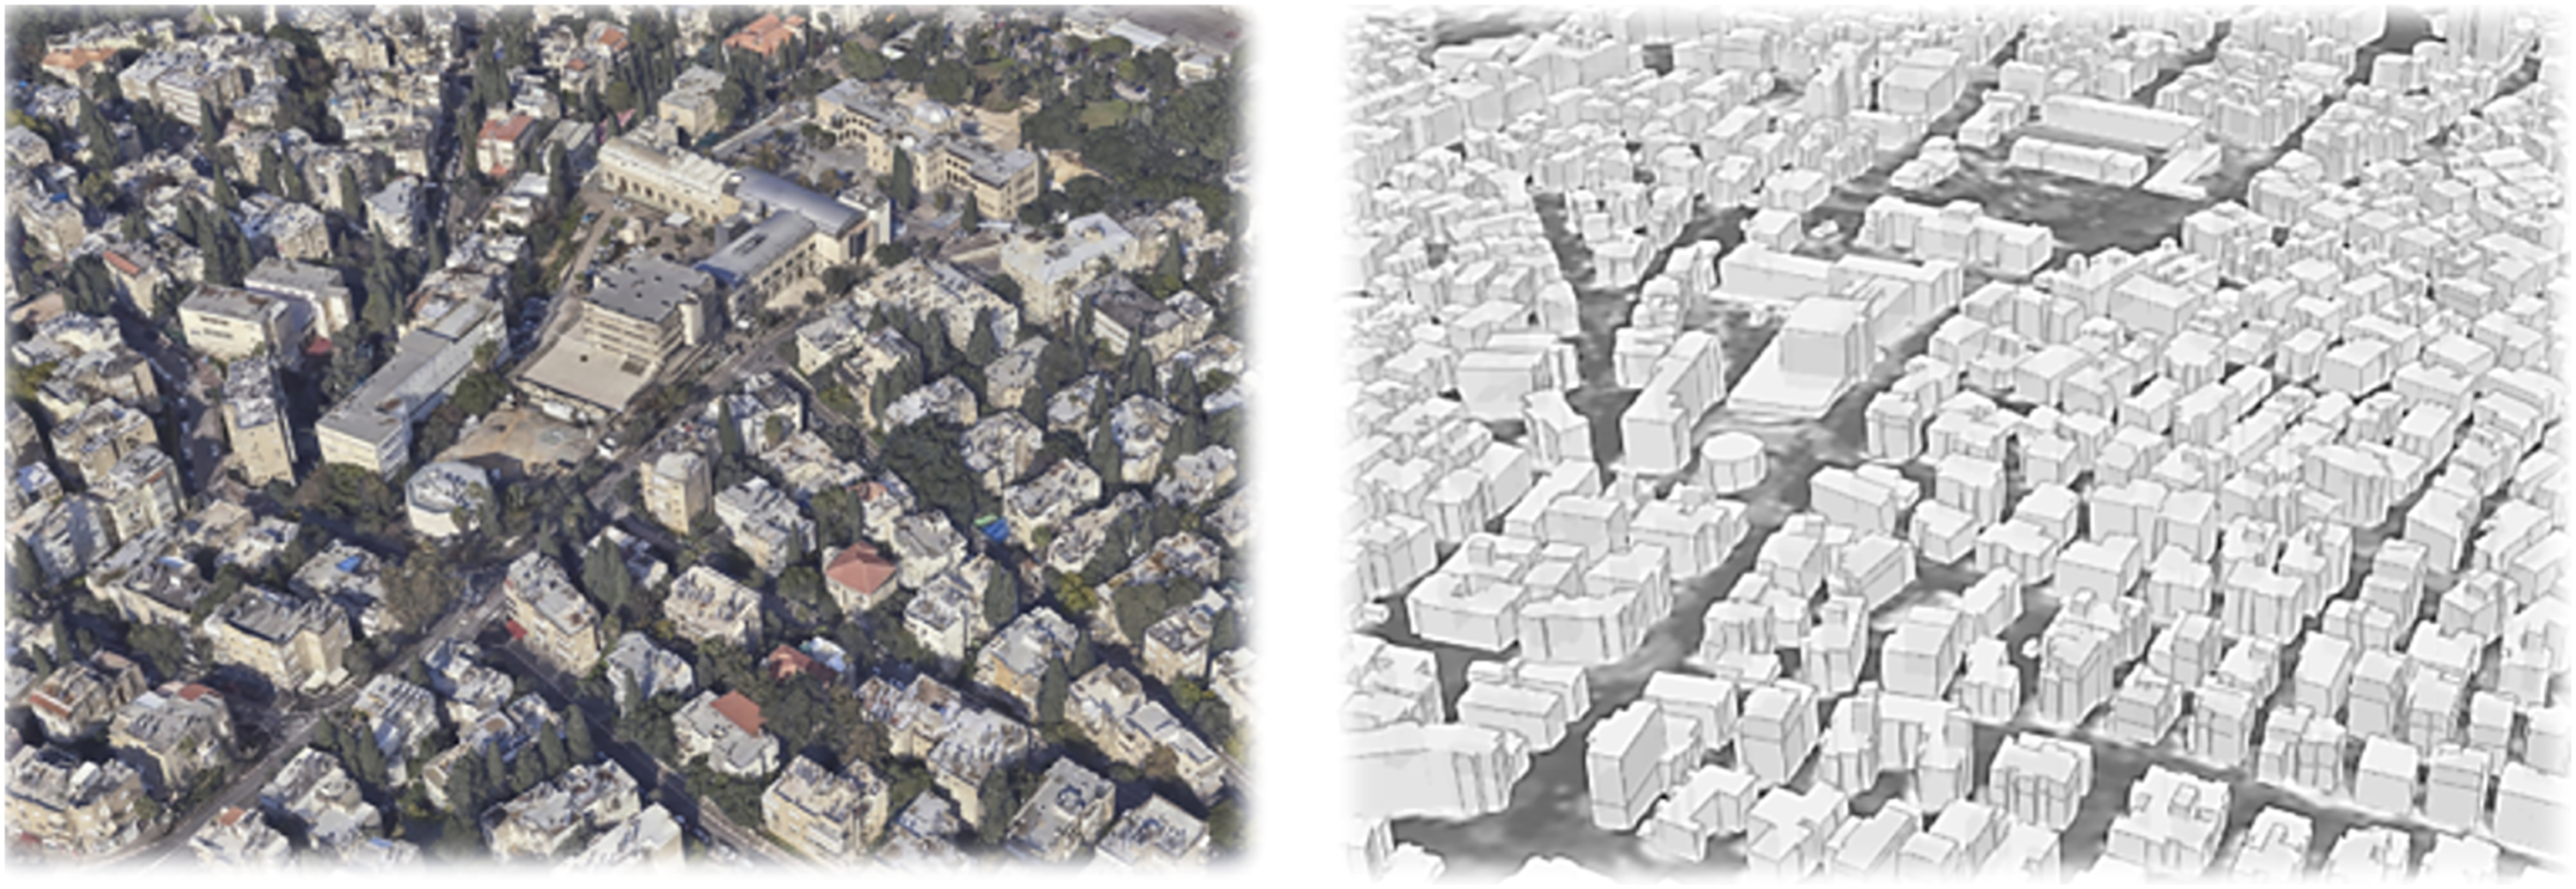
Phase 2: The ethics of social data
Whereas the first phase of the SUDT model presented above is a generic phase of UDT development, the second phase marks a turning point – from a focus on built urban space to a focus on social fabric. This turn requires adaptation and raises ethical and legal questions that are very popular in the field of Digital Sociology (Lupton and Deborah, 2015). The SUDT model offers a solution for contending with social issues and therefore requires a process of collecting and assimilating social data. A broad spectrum of laws and regulations were instituted to protect the privacy of the population. Producing the SUDT requires learning the laws of the public sector throughout the country and signing the necessary contracts. Therefore, before getting underway with socially focused research, it is necessary to first build an institutional support structure consisting of an attorney and the Cyber Director of the relevant organization to assist in creating a legal and contractual basis for receiving the data.
Phase 3: Data collecting through Thick mapping
Data is not single-use and is not one dimensional. The essence of the Digital Twin lies in its ability to incorporate substantial changing data to serve as a foundation for conducting analyses and generating insights (Kenett and Bortman, 2021). The SUDT relates to data as an epistemological means of reflecting a narrative that differs from reality. Social data can come from institutional and non-institutional bodies, and understanding social complexity necessitates viewing it from different perspectives and on different scales (Aureli and Schino, 2019). For this reason, we propose the concept of “thick description” (Geertz, 1973) a methodology from the field of Cultural Anthropology, as a method of data collection. Thick description refers to a process by which the neighborhood is documented in a “thick” manner (i.e. data is collected, accrued, and presented in a holistic manner that enables us to learn about the neighborhood and about a broad spectrum of subjects). The idea behind the SUDT is not to collect data pertaining only to specific questions selected ahead of time, but rather to open up the data-collection process to broader contexts.
Thick description is the basis of critical thinking, as it provides researchers with a wide cultural and political contextual framework in which to analyze phenomena and narratives (Presner et al., 2014). It can be used to highlight and conduct a combination of micro and macro analyses with multiple interpretations and to tell open stories that do not reflect a single worldview. To establish and expand the idea of creating multiple narratives, we propose filling out the institutional database with data that is generated not only from the top down but also from the bottom up.
Social digital twin database.
The health-related data pertained to Coronavirus on the level of the statistical area. This dataset contains quantitative data regarding the number of those infected and those recovering broken down by age and statistical area. The data is updated on a daily basis, and we therefore wrote scripts to access this data and update the SUDT in real time.
From the Survey of Israel, we drew information pertaining to the physical and planning aspects of the neighborhood of Hadar. From this dataset, we incorporated information regarding topography, land-use designation, blocs and plots, and street names.
The National Insurance Institute of Israel is the state body responsible for facilitating the enactment of the social rights of all inhabitants of the state through financial payments. As a result, this agency possesses extremely detailed social information on all Israeli residents. As part of our research cooperation with this project, the National Insurance Institute provided us with absolute information on the level of the statistical area, including the number of inhabitants, a breakdown by age group, a breakdown by family status, and information regarding financial benefits.
The Municipality of Haifa provided us with a file on local property tax in the form of an Excel table with 22,000 rows, each representing a household in the neighborhood. The table contained the following columns: property type (residential or commercial), property area, age of property holder, and tax discount applied. This information enabled us to characterize the social and economic situation of the neighborhood’s residents. The city hotline provided us with a file documenting calls going back one year; the file contained the address at which the hazard occurred, a categorical description of the type of hazard, and a verbal description. The municipality’s Culture and Community Department assisted us in generating data regarding social volunteers and activists.
1. A food basket distribution dataset, containing the addresses of elderly residents who received a food basket during the second Coronavirus lockdown: This distribution was conducted by civil society organizations seeking to help elderly residents who typically visit food basket distribution points but who were now refraining from leaving their homes out of fear of being infected by the virus. 2. A building coordinators’ dataset, which provided us with information about building maintenance: Buildings with a building coordinator had maintenance costs that are higher than buildings without a building coordinator. 3. The addresses of community members: Our study collaborated with the Shahaf Foundation, a philanthropic organization that offers financial support to local communities in Hadar that provided a list of all their communities’ members in the neighborhood.
Phase 4: The “small-ness” of data integration
This is a complex phase, because it demands a process of dismantling and assembling the array of data that was collected during the previous phase and creating a new dataset. In this phase, we ask how integration and unification can be achieved among the data arriving from different information sources, and, in the process, also in different formats and on different urban scales (statistical areas as opposed to addresses). In the field of data science, this complex issue is known as “feature scaling,” and its goal is to achieve the standardization and normalization of datasets. To achieve optimal feature scaling, we use principles and concepts from the field of urban sociology, which proposes the concept of “small-ness” and a shift to small urban scales as a means of critically analyzing urban complexity (Ocejo et al., 2020). In this spirit, we recommend that the SUDT dataset preserve the smallest urban unit that exists in the dataset.
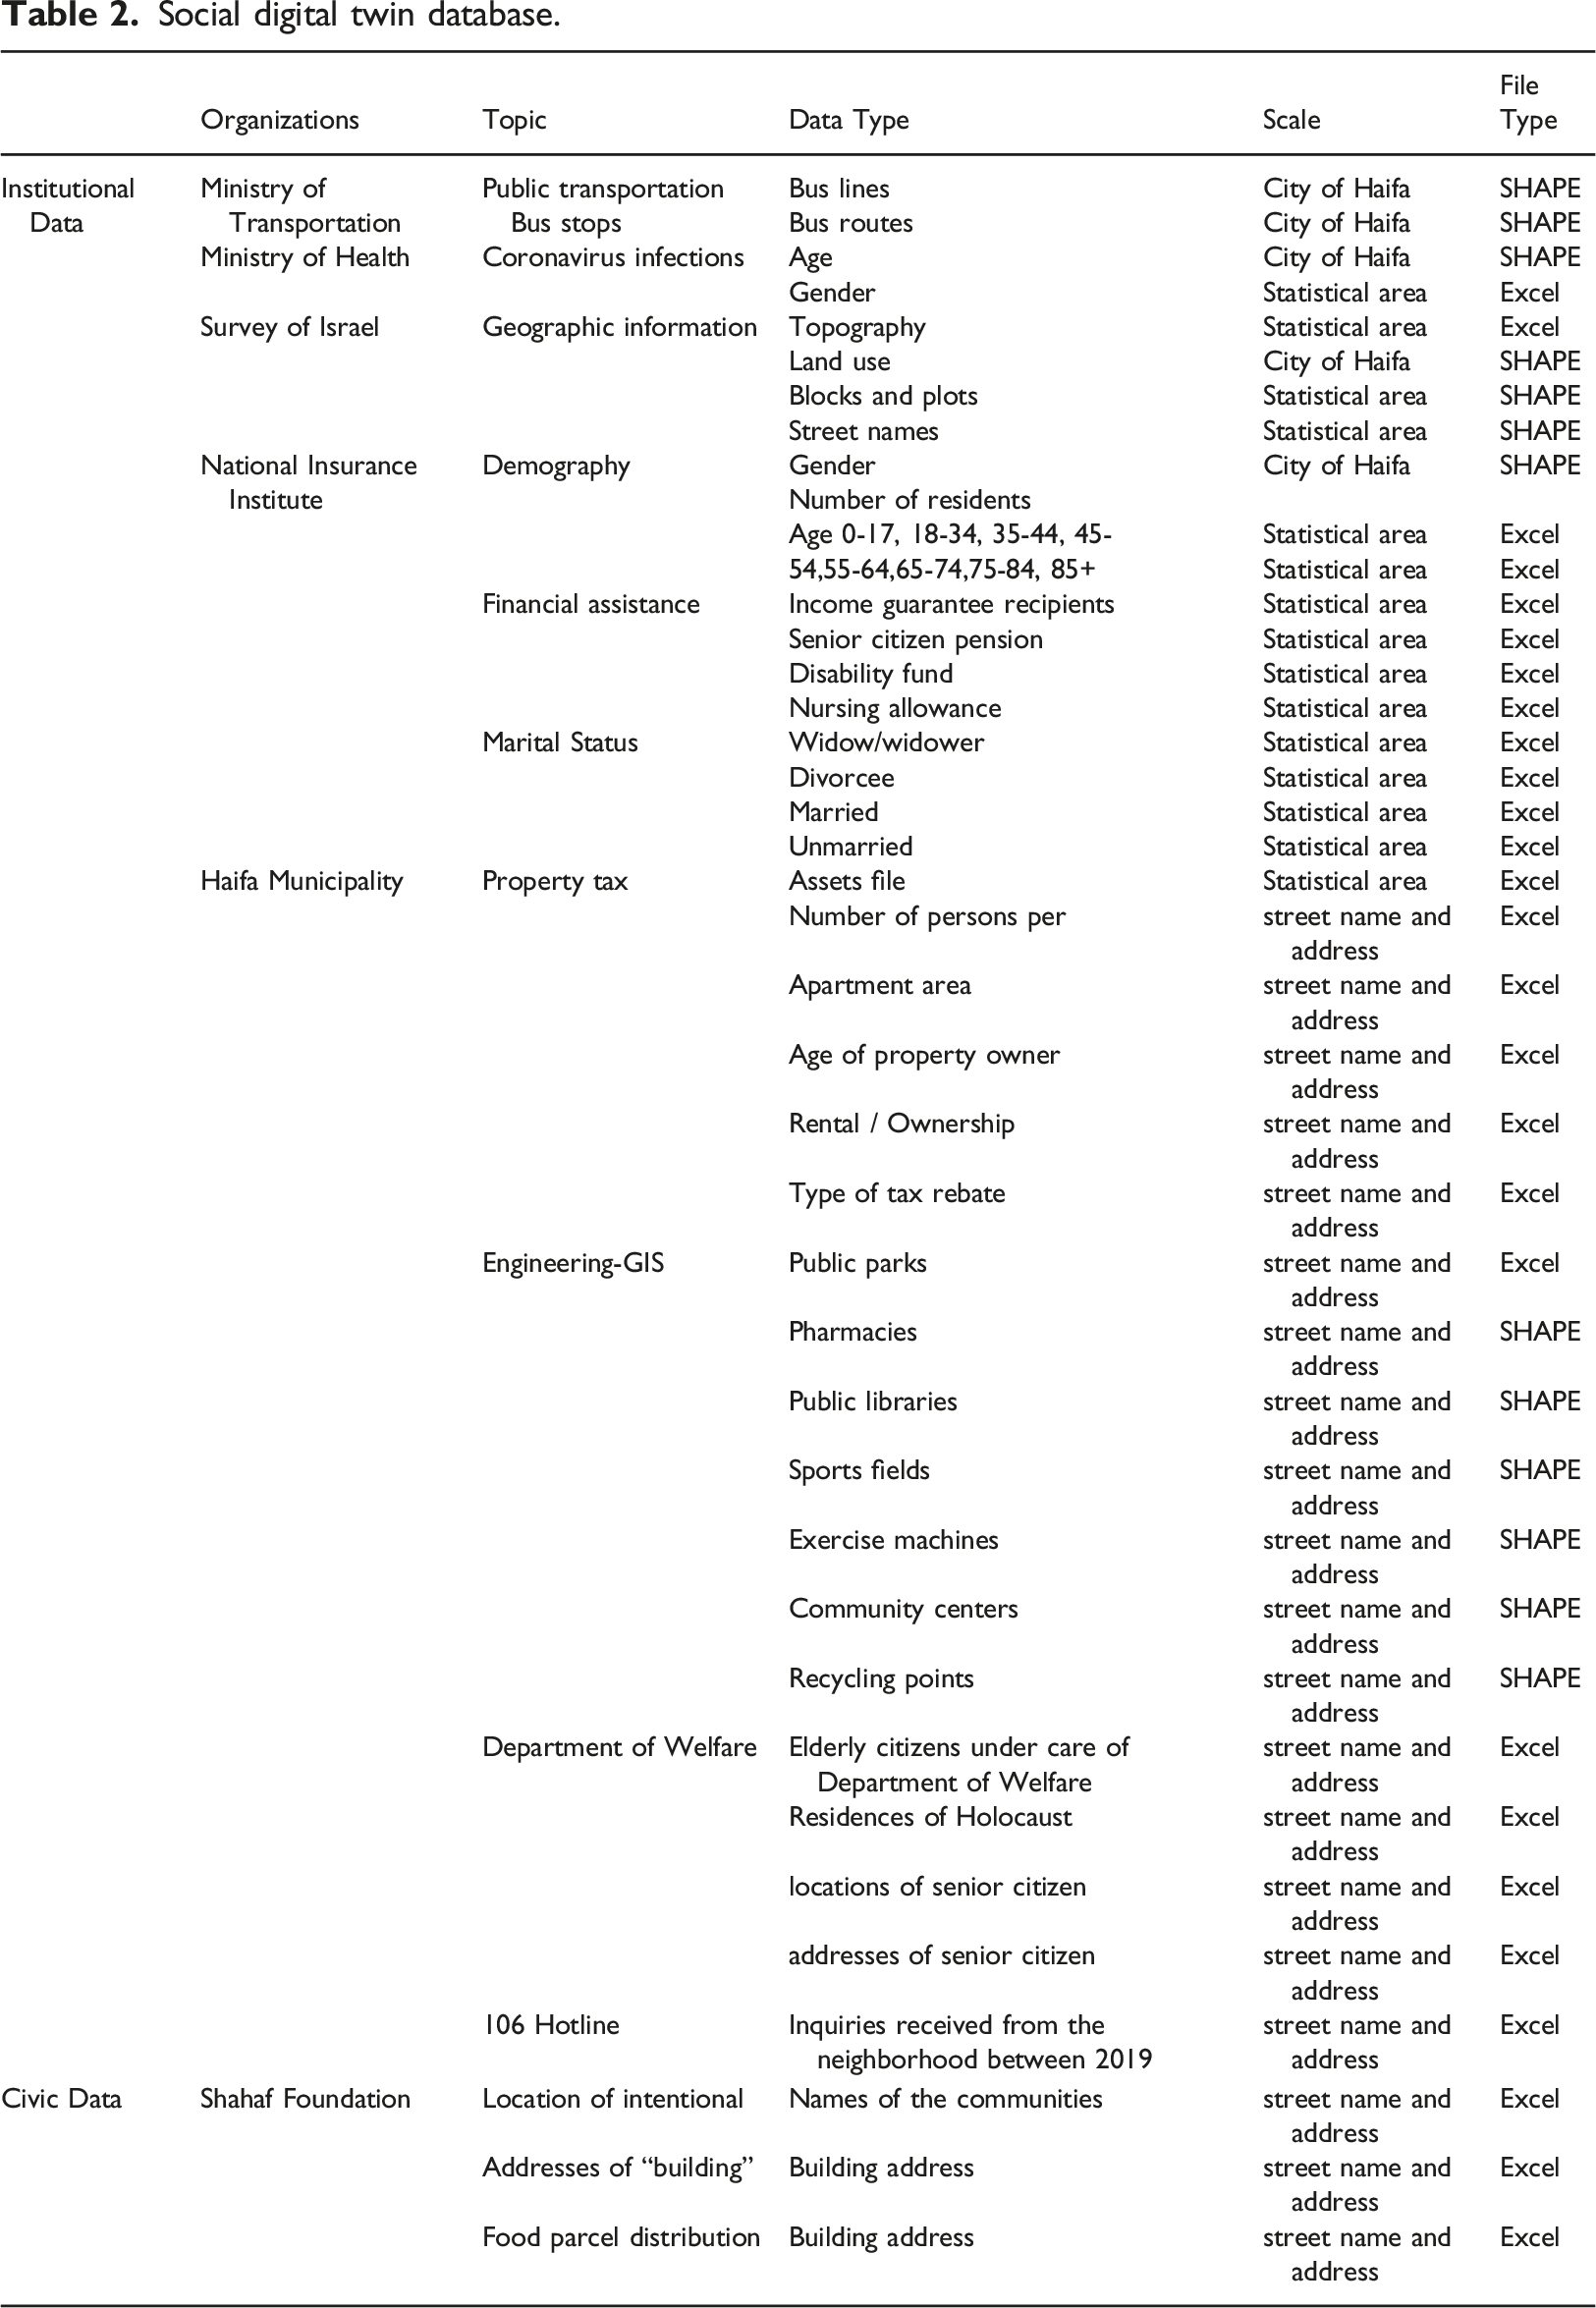
Phase 5: The socio-spatial visual dimension
This phase’s goal is to use spatial visualization and analysis to generate social insights and create a logical context linking geographical space and social complexity (Aharon-Gutman et al., 2018; Ballas et al., 2018). In this phase, we structured “classic” tabular data into geographical-data descriptions of points, lines, and polygons, using methods and techniques form Social GIS to create visual representations of the elements of the social data.
1. The distance of the elderly resident’s residence from points of interest: The goal of this analysis was to assess the extent to which public functions are accessible or inaccessible for the elderly residents of the neighborhood. According to a study of the “age-friendly city” (Kano et al., 2018), optimal mobility of elderly residents in public space requires them to live within 250 m of accessible functions such as a bus stop, a medical clinic, a post office, a public park, and a grocery store. Social Digital Twin model visualization. Top: Visualized in green. Elderly households located more than 250 meters away from local parks. Bottom: Spatial distribution of adult daycare centers in relation to home addresses of members.
We selected the entire elderly population (65+) from the local property tax file and marked the buildings in the neighborhood in which they lived. We then marked the location of the relevant public functions using open street mapping. Next, we formulated a spatial query for a 250-m-long spatial buffer around the social function in question, and on the map we marked the elderly residents who do not live near it. 2.
Phase 6: Critical algorithmic correlation
This stage has extended the fundamental concept of Digital Twin technology, mixing different kinds of data to facilitate correlation and coordination for producing data insights (Grieves and Vickers, 2017) and using critical thinking and social-geospatial layers to extract social insights. In this phase, we propose analyze the relationships between a discrete quantitative variable and other variables using algorithmic analysis of the social dataset (produced in Phase 4 of the protocol). In addition, to implement the concept of the SUDT, which links the social fabric and the physical built fabric, we produce social-geospatial layers that enable us to critically analyze the result of the algorithmic analysis in relation to the built environment. This phase is composed of four stages (Figure 3): (1) The input stage, in which a single variable is selected from the entire data set. (2) The algorithm process stage, in which we propose using the generic algorithm of mutual information, which assesses the mutual dependence of two discrete variables. (3) The output stage, in which we use the algorithm to display the two variables with the highest percentages of similarity to the variable we selected in the input stage. And (4) the geospatial layer stage, which produces a new geospatial layer displaying the two variables with the highest percentage of similarity identified by the algorithm. This layer actually represents the spatial-social relationship between the two variables, enabling critical thinking data analysis. The four stages of implementing the algorithm.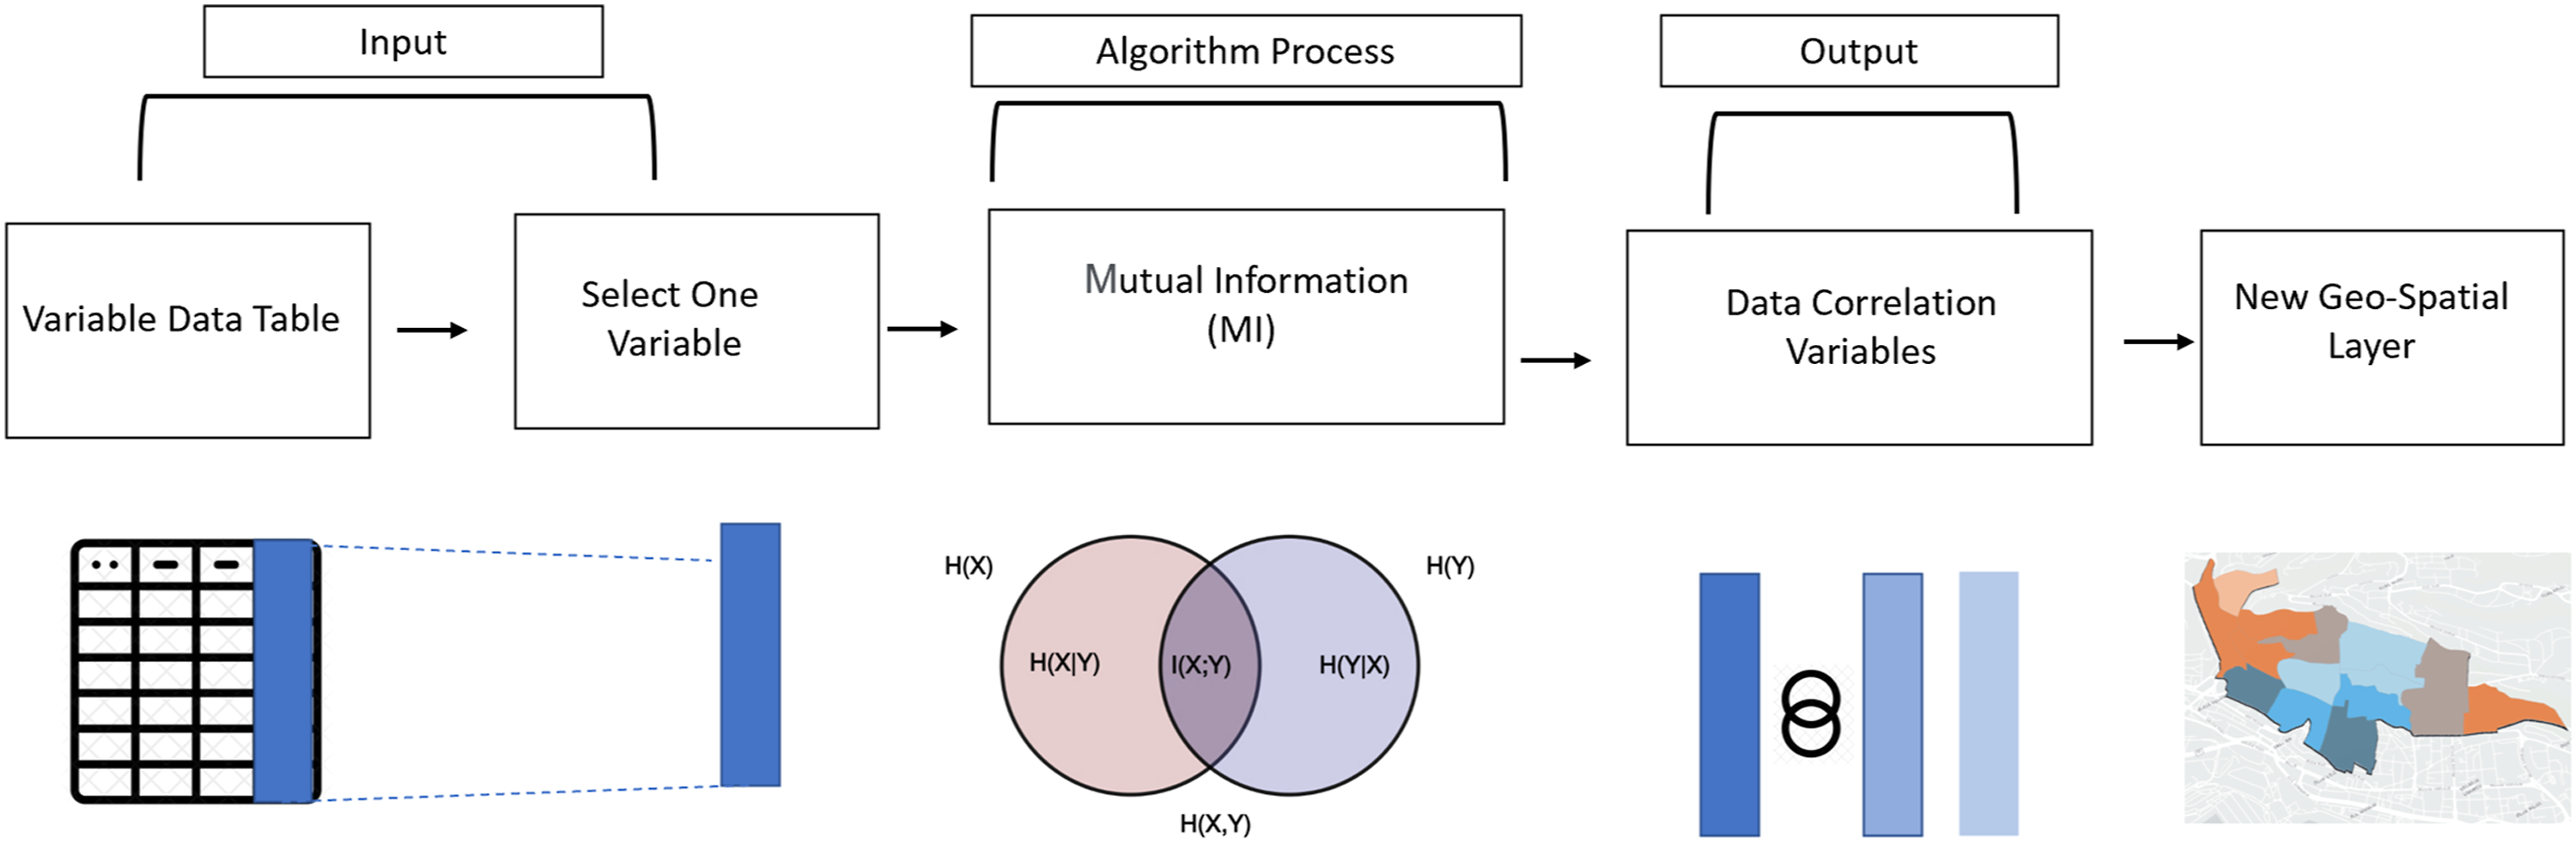
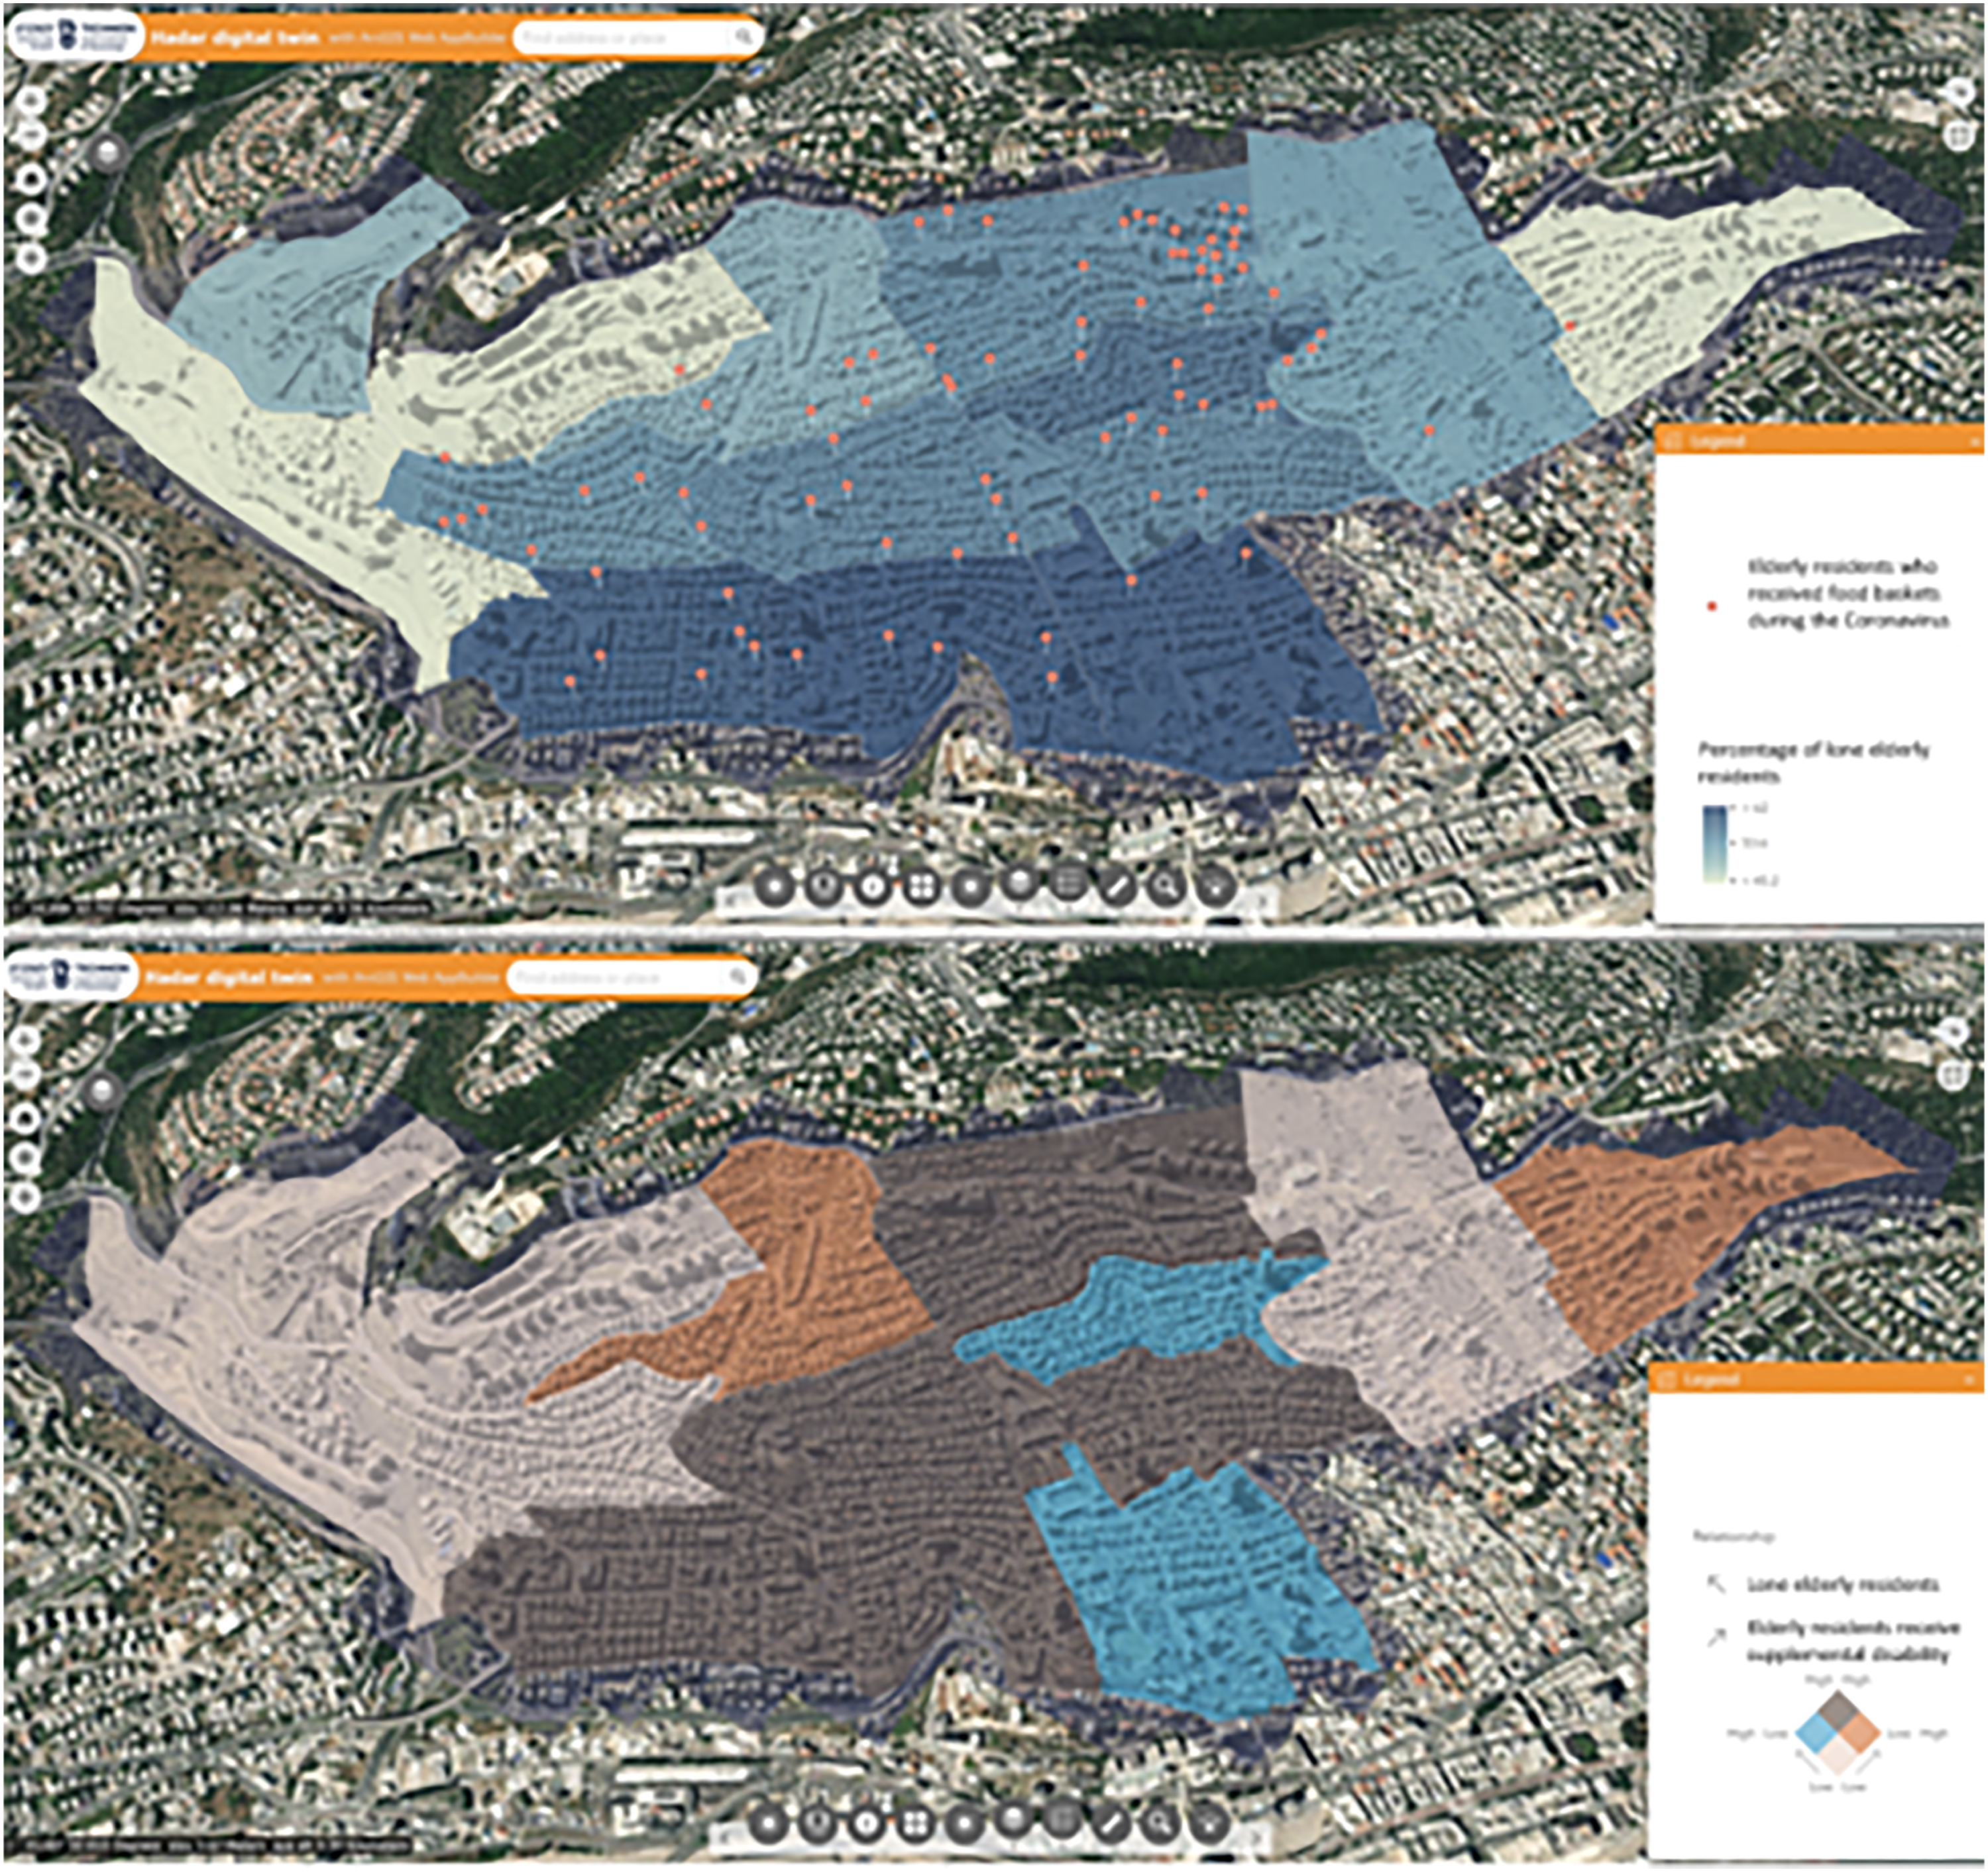
In the input phase, we chose the variable of elderly residents (65+) with a family status of single, divorced, or widowed. According to the Welfare Department of the Municipality of Haifa, these are the elderly residents who are at a higher risk of solitude. We refer to this variable as “lone elderly residents.” We applied the mutual information algorithm and assessed the dependence relationship between it and the rest of the variables in the main table, establishing that “lone elderly residents” have the highest level of dependence vis-à-vis the following variables (Figure 4): • Correlation between the variable “lone elderly residents” and the variable “elderly residents who received food baskets during the Coronavirus [pandemic]”—76%. The source of this information was civil society elements in the neighborhood of Hadar. During the first Coronavirus lockdown in Israel, civil society elements distributed food baskets to the elderly population. That is, this work with algorithms enabled us to generate the feedback that the way in which civil society distributed the food baskets was highly correlated with the spatial distribution of the population of “lone elderly residents”. • Correlation between the variables “lone elderly residents” and “elderly residents who receive a supplemental disability benefit—62%. The source of this data was the National Insurance Institute of Israel. In other words, we can therefore conclude that many elderly residents who are “lone elderly residents” are also elderly residents with disabilities. This correlation’s translation into a geospatial layer showed us that this phenomenon is more prominent and widespread in certain parts of the neighborhood known for their lower socioeconomic status than in others, further highlighting the seriousness and complexity of the phenomenon. Social-Spatial Visualization Top: Correlation between “lone elderly residents” (shaded blue) and “elderly residents who received food baskets during the Coronavirus” (dots) Bottom: Correlation between “lone elderly residents” and “elderly residents who receive supplemental disability benefits.
Discussion and recommendations for future research
In this study, we discussed the most up-to-date theories of the social turn of the Smart City and how our SUDT development protocol can serve as a means of generating this social turn. The study promotes the core issue of urbanism by binding together the social and physical fabrics of the city; it also contributes not only to increasing the accessibility of the urban social fabric but increases access to the social issues of the city. Its goal is to support the realm of city decision-making, with an emphasis on reducing the digital gap that characterizes the city administration’s department of welfare. In this article, we showed how the SUDT constitutes both a theoretical conception and a practical tool for responding to the challenge we sought to address in this study: to bring about a social turn in the Smart City. The concept of the Social Urban Digital Twin emerged from the adoption of two ostensibly contradictory conceptions: that of critical sociology, which views the concept of the Smart City from the side and seeks to understand it in the context of social and economic power relations; and the progressive conception of technological development, which is based on a belief in the ability of technological tools to respond to the challenges of the current age.
To continue developing the field, we propose a number of further studies:
In conclusion, this study adds an additional tier to the growth discourse of urban analytics and city science by marking and defining a new sub-field of research and development: the SUDT. It combines critical theory and applied practice to further social policy through the use of technological tools from the world of progressive development that also function in the world of critical thought. It also calls for and creates an opportunity for follow-up studies to continue the development and application of the SUDT in order to further the social turn in the field of Smart Cities.
Footnotes
Declaration of Conflicting Interests
The author(s) declared no potential conflicts of interest with respect to the research, authorship, and/or publication of this article.
Funding
The author(s) disclosed receipt of the following financial support for the research, authorship, and/or publication of this article: This work was supported by the Israeli National Insurance Institute.