
Abstract
Commercial pedestrian blocks play an indispensable role in urban life. With the development of urban commercial intensification, the construction of commercial pedestrian blocks has ushered in a period of rapid development. To explore the spatial form and structural features of commercial pedestrian blocks, we examined the Qingniwa-Tianjin Street commercial pedestrian block in Dalian, China. We developed a new quantitative research method, using Isovist-App software simulation, big data statistics and Arc GIS analysis methods to explore the spatial morphological structure characteristics of commercial districts. The results show that Tianjin Street’s pedestrian axis has low spatial permeability and monotonous browsing routes. This suggests that the outdoor pedestrian space design does not attract crowds to wander around and stroll. The overall centrality of the space was relatively high, and the spatial accessibility was good. The walking route provided a wide field of vision, stimulating people’s desire for exploration. The space is highly guided, and people can visit according to the designed route. There is a big difference in the spatial aggregation and dispersion of POI facilities. Transportation, sports, and leisure facilities are the most evenly distributed, while shopping and life service street facilities vary considerably. During holidays, the intensity and duration of crowd activities are the largest, followed by working days and weekends. The people in the block mainly gather in the western and southern commercial complexes, and the attractiveness of outdoor pedestrian streets is lower than that of commercial complexes. Node space B has pedestrian streets with varying spatial interfaces and inconsistent visual appeal. The results can be used to support the spatial form and structural renewal design of commercial pedestrian blocks. The methods presented in this study provide a quantitative approach for the spatial analysis of other functional areas in the city.
Introduction
In the era of the experience economy, commercial streets with high visual appeal can significantly enhance the economic and social vitality of public spaces (Portman et al., 2015). As mentioned in “The Life and Death of Big Cities in the United States,” street pedestrian space characterizes the quality of a city, providing safety and stimulating social interactions (Montgomery, 1998). As a typical urban public pedestrian space, commercial pedestrian blocks can enhance the economic and social vitality of public spaces (Guo et al., 2021; Meng et al., 2014). More than 50% of human brain cells are used to process visual information, and vision occupies the most important experience ratio among all social perception modes (Fominykh et al., 2015). Research on commercial pedestrian blocks has mainly focused on the traditional participants’ perception of the spatial environment, exploring the relationship between the commercial environment and crowd behavior (Du et al., 2020; Lee and Yoon, 2015; Sharifi Noorian et al., 2020). Previous studies have largely overlooked analyzing these blocks from the visual domain, spatial form, and structural perspectives. In traditional quantitative research, software simulation and questionnaire survey results cannot provide verifiable research results.
The starting point of spatial visual domain analysis is the human visual system (Batty, 2001; Berlyne, 1970; Raman et al., 2014). This system draws on the knowledge of computational science (Fisher-Gewirtzman and Wagner, 2003; Fisher-Gewirtzman et al., 2013; Turner et al., 2001) and space syntax theory (Hillier, 2007; Varoudis and Psarra, 2014) and uses software simulation to express visually observable images intuitively. However, observers often sample them according to their own intentions and curiosity and do not completely and objectively quantify the output spatial attributes. The emergence and application of Isovist (constant velocity lines) provide a solution to this problem (Lonergan and Hedley, 2016). Studies have shown that Isovist can be applied to architectural interior spaces and urban blocks and quantify space by recording spatial attributes and other viewpoint fields (Batty, 2001; Kim et al., 2019; Simpson et al., 2017). The rapid development of big data technology has enriched research on the dynamic spatio-temporal relationship between human behavior and the spatial environment (Shaw et al., 2016; Wu et al., 2018). The information points represented by POI are specific places where people gather and perform daily activities. Understanding the configuration of urban space POI can effectively help urban planners evaluate regional vitality and spatial structural design. (Cai et al., 2019; Gao et al., 2017; Lyu et al., 2016). In addition, due to the rapid development of data rendering and visualization software, heat maps have become the most commonly used mode for displaying massive amounts of data and are widely used in related research on urban planning (Babicki et al., 2016; Chenweishan and Liang, 2016; Jia et al., 2014). In China, the Baidu heat map has been widely used to study urban spatial structure and functional areas due to its accurate time and space information (Sha et al., 2018; Shen and Karimi, 2016; Zheng et al., 2020).
Our research is based on the theory of Isovist and software simulation of spatial morphological features and uses big data to quantify and analyze spatial structural features. We investigated the spatial morphological characteristics of the visual domain, the spatial sequence experience of pedestrian routes, the spatial aggregation and dispersion of commercial-related POI facility data, the degree of street function mixing, and the spatio-temporal characteristics of crowds in the neighborhood using mutual verification. The main innovation of this study is verifying the application of Isovist-App in street space, developing a new research method, and comprehensively using a variety of quantitative tools to analyze the spatial morphological structure characteristics of commercial pedestrian blocks. This study improves understanding of the spatial design of commercial pedestrian blocks, the layout of commercial facilities, and the spatial form of other urban functional areas and provides quantifiable guidance and recommendations for urban renewal design.
Methods
Study area and data collection
In 2020, China’s “Government Work Report” proposed upgrading the pedestrian street through transformation and promoting consumption recovery. In the same year, the Qingniwa-Tianjin Street Pedestrian District in Dalian, Liaoning Province, China, was selected as the second batch of national pilot pedestrian streets. Figure S1 shows the study area, the Qingniwa-Tianjin Street Pedestrian District, which has a long history and nearly a hundred years of commercial tradition. The block covers about 55 ha, and the main pedestrian street (i.e. Qingni Street, Shengli Culture Plaza, Tianjin Street) is 1380 m in length and 20–30 m in width.
The Isovist-App was used to measure the overall shape of the block space and route measurements, and POI points and crowd heat distribution maps were used to analyze the block’s physical and social space structures. The CAD drawing was derived from the actual project plan “Qingniwa Bridge-Tianjin Street Pedestrian Street Renovation and Upgrade.” The POI data came from AutoNavi API, and the data was obtained, corrected, and classified on a third-party website. The heat map was acquired from the Baidu map. The heat map data came from the Baidu Map Platform and is based on the histogram statistics of different color pixels of the heat map, which is convenient for comparing different degrees of crowd aggregation.
Procedure
The methodology is roughly divided into 3 parts. First, software simulation was used to measure the spatial attributes of commercial pedestrian blocks globally and route measurements. Route measurement was used to select the main walking sections (i.e. Qingni Street-Shengli Square-Tianjin Street) and perform change trend statistics and spatial sequence analysis. The characteristics and problems of the spatial sequence were then summarized according to the curve change trend. Second, POI facility data and GIS kernel density analysis were used to calculate various data points in the block space. The POI facility included 5743 data points, categorized into 6 groups: shopping services, living services, catering services, transportation facilities, accommodation services, and sports and leisure services. A 50-meter buffer zone was established for each street, and a grid calculator was used to calculate the number of POI points in each buffer zone and the ratio of various POI points. The blending calculation formula was used to visualize the functional blending degree of the street. Finally, the heat maps were generated using the Baidu map platform for 12 August 2021 (workday), 14 August 2021 (holiday), and 15 August 2021 (weekend). From the preliminary experiments, the time period for taking pictures was determined to be 7:00–23:00, and the time interval was 1 hour. Fifty-one heat maps were obtained, and Adobe Photoshop was used to preprocess the images and calculate the heat value of the pixel points. Dual analysis for temporal and spatial dimensions was used on the aggregated primary data.
Parameter design
Isovists are the collection of all visible point positions in space (Benedikt, 1979). The operating principle of Isovist is the attribute analysis of the isokinetic line (Figure S2). Studies commonly use the isovist field to measure the topological relationship of different functional spaces (Ostwald and Dawes, 2020; Tzortzi, 2004). To more accurately determine the attributes of isovists in space, we selected 10 indicators for quantitative analysis (Table S1).
POI data calculation formula
Nuclear density estimation was used to quantify the degree of spatial aggregation and dispersion of different types of POI facilities and is given by the formula (Rosenblatt, 1956)

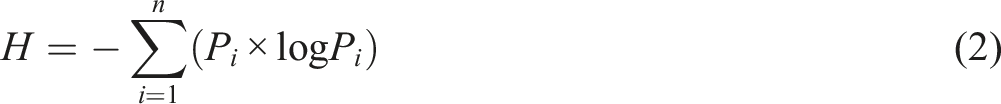
The degree of street function mixing was determined by calculating the number and proportion of POI within a certain range of each street. We used the spatial connection tool in ArcGIS to identify the number of various POIs and the total number of data points in each road buffer and calculated the proportion of various POIs in each buffer through the field calculator. Calculate the functional mix of each road according to the formula. The degree of functional mixing of street land (H) is given by the expression (Long Ying, 2016)
Heat map analysis method and calculation formula
The heat map analysis used the Adobe Photoshop method, referred to as the PS method. Different colors were selected in the image, and the number of pixels in the PS was determined to compare the temporal and spatial distribution of different heat regions. The PS method can obtain data through intuitive operations and is suitable for qualitative or confirmatory analysis of a small number of images. Only 3 days of heat map data were used in this study, so we chose the PS method to adjust and identify problems at any given time. The heat map was assigned with seven levels (Figure S3).
The grid calculator tool of ArcGIS was used to calculate the average heat intensity throughout the day. The average heat intensity (

Results
Isovist’s spatial characteristics and sequence guidance
Using the Isovist-App to scan the space of commercial pedestrian blocks, 79,483 reference coordinate points were generated. The area, choice, and integration were obtained as global measurement results (Figure 1), and their average and standard deviation were calculated (Table S3). Analysis of block view area, selection degree, and integration degree.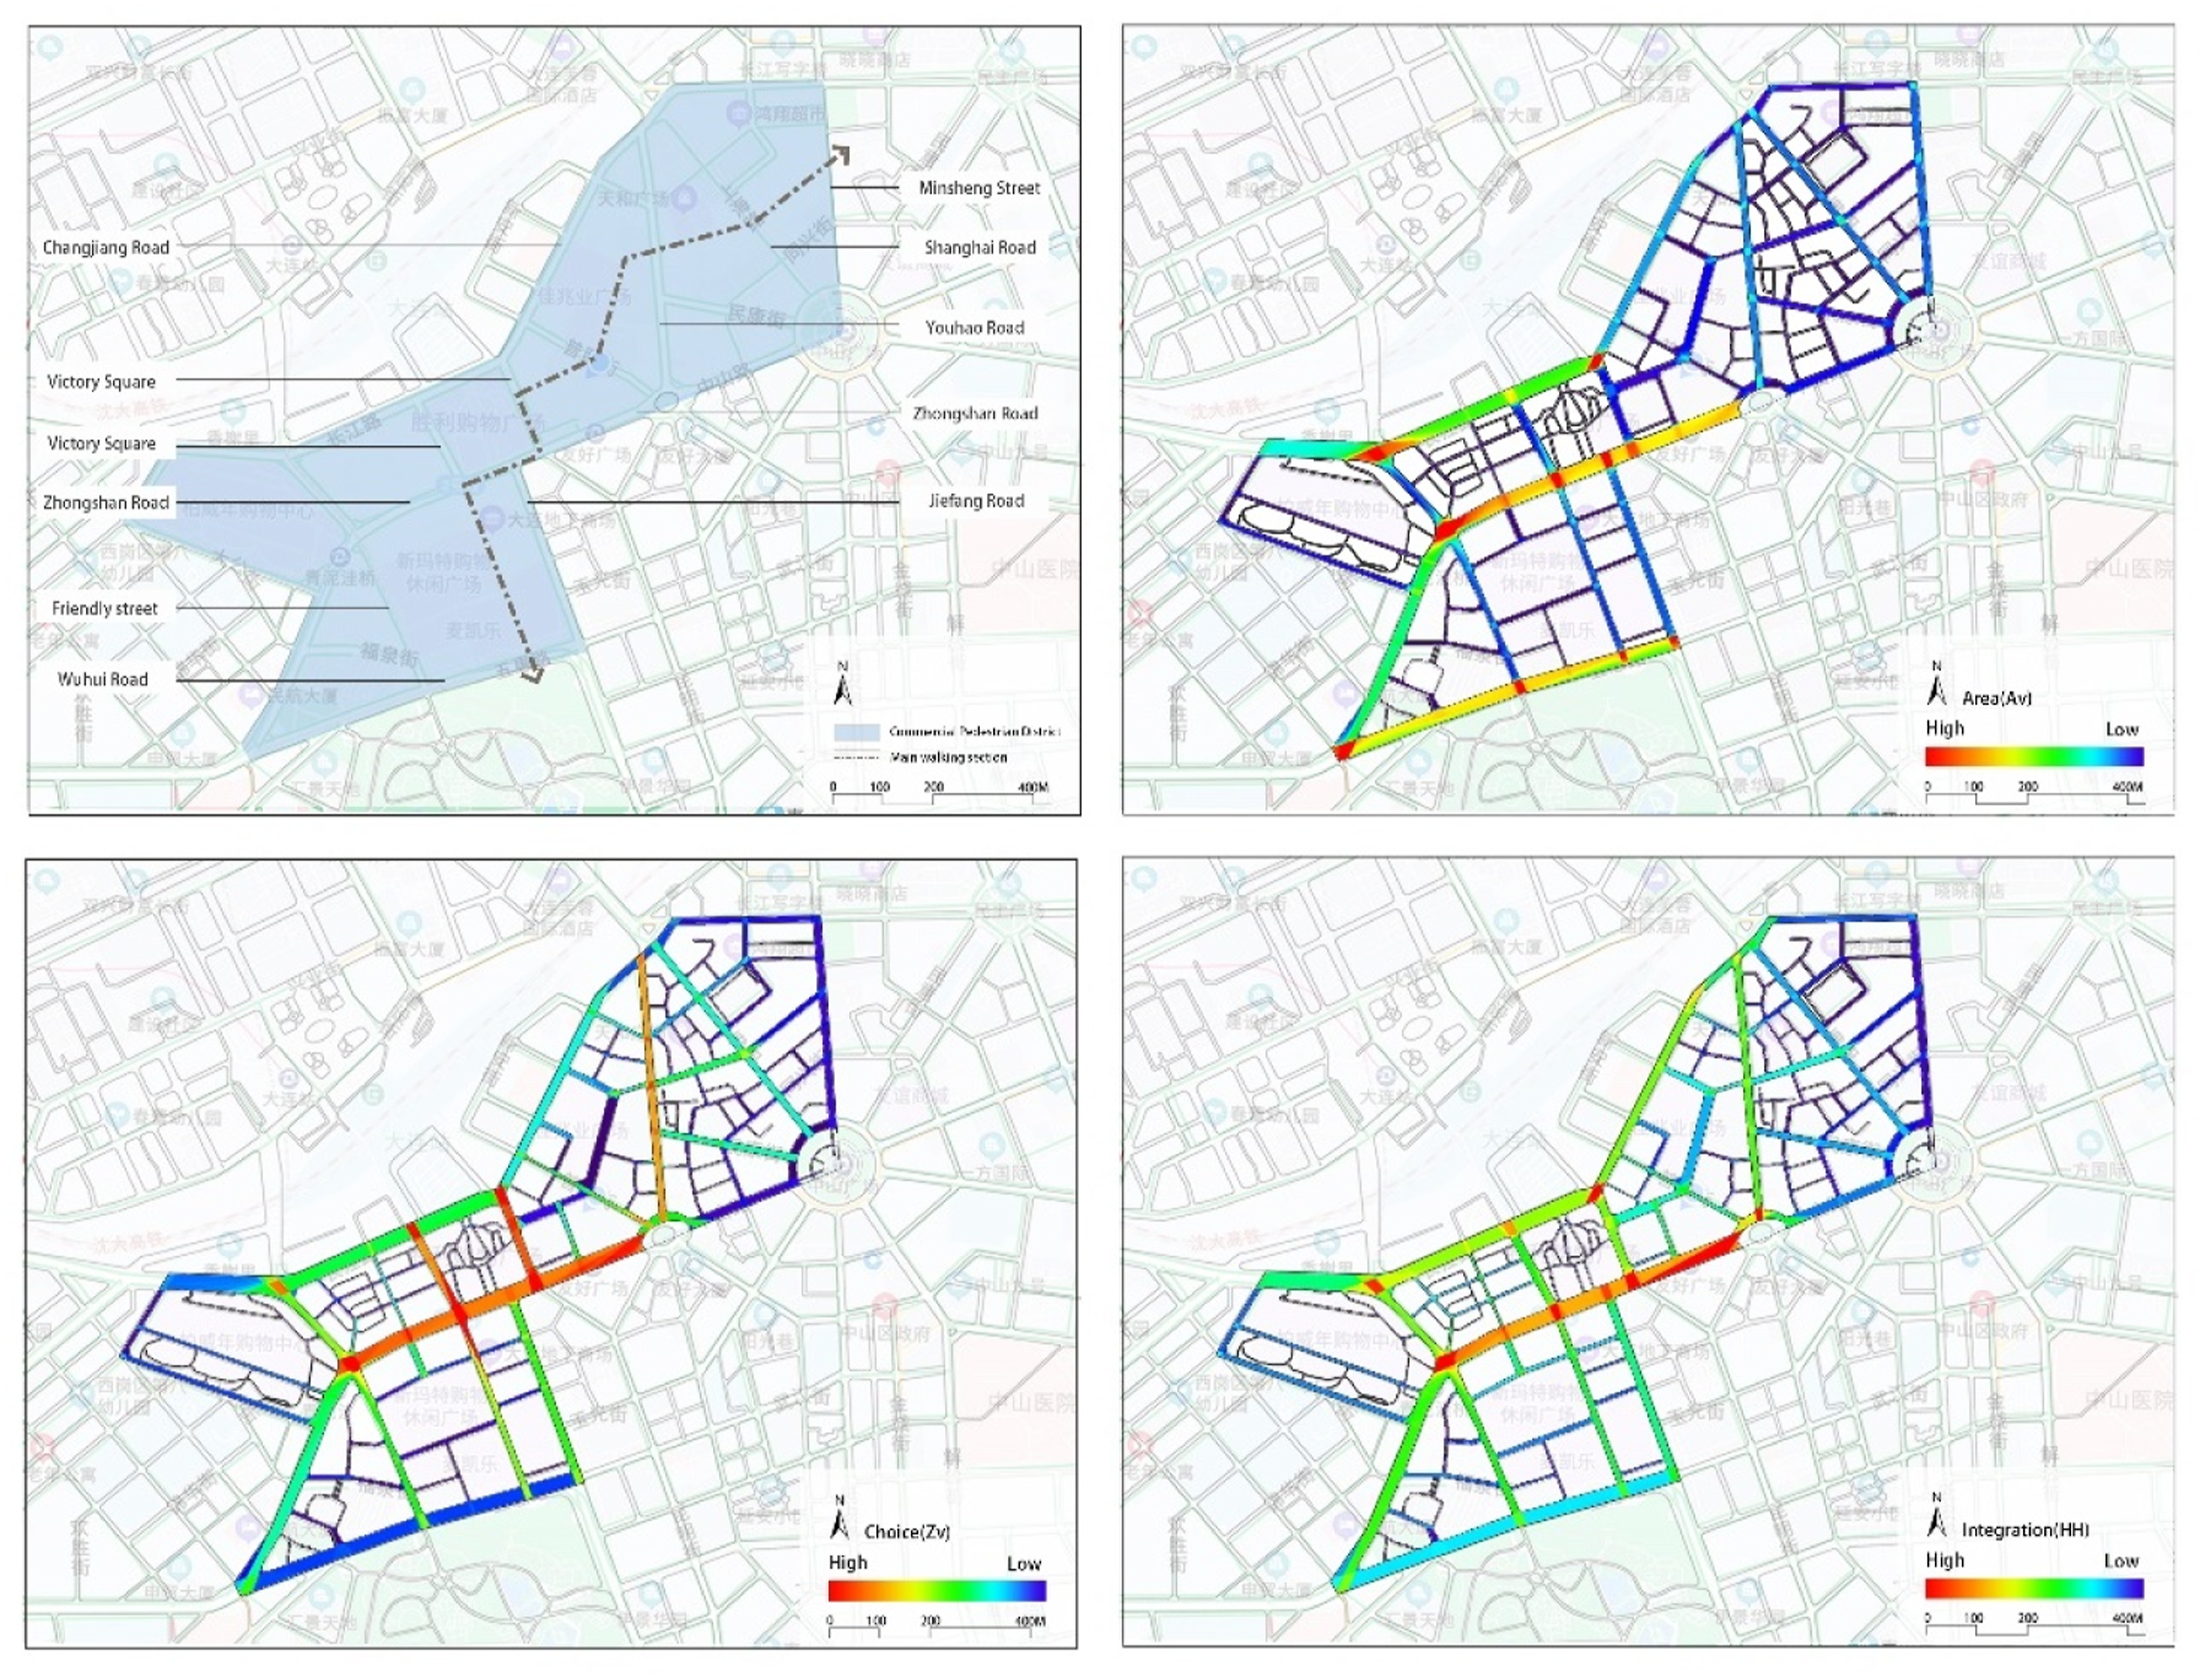
Area represents the extent of the space visible from the viewpoint within the space range. The east-west road connection value of the block was higher than the north-south road. Zhongshan Road had the highest connection values at 1.05–1.93. The connection values for Changjiang Road and Wuhui Road ranged between 0.78–1.32 and 0.78–1.27. The north-south road was generally low, mainly concentrated in the 1.22–1.38 range. The connection value of the main pedestrian section was low, mostly concentrated between 0.28–0.41.
Choice indicates how likely it is for any location to be seen on all shortest routes to all other spaces (Freeman, 1977; Hillier et al., 1986; Hillier et al., 2012). In the study, the choice of the block gradually declined from the center into the surroundings. Zhongshan Road and the roads connected to Shengli Square had the highest choice values, ranging from 0.46 to 0.63. Minsheng Road and Shanghai Road had low choice values between 0.06 and 0.26. The choice degree of the main pedestrian section was higher in the south section than in the north section, with values in the 0.12–0.53 range.
Degree of integration indicates the angular topological distance from each street to all other street segments within a certain distance range (Gatrell, 1985; Teklenburg et al., 1993). The degree of block integration decreased from the central road to the north-south, and the eastern section was the lowest. Zhongshan Road had the highest degree of integration at 3.22–3.26. Changjiang Road on the north side was slightly higher than Wuhui Road on the south side at 2.83–3.24 and 2.21–2.86, respectively. The section on the east side had the lowest values. Minsheng Road, Shanghai Road, and Youhao Road had the lowest degree of integration, with values concentrated in the 1.44–1.99 range. The southern section of the main pedestrian street was higher than the northern section, with values distributed between 1.76 and 2.54. According to the average and standard deviation of the area, choice, and integration degree, the degree of data dispersion can be characterized as low and relatively uniform for the entire study area.
Spatial nodes A-D (Figure S4) were selected in the main pedestrian sections, and path measurement and spatial sequence experience analysis of the node space were performed (Figure 2). The curve area exhibited a downward trend with four large peaks. The space node A-D coincided with the wave crest. However, point A was between the large wave crests, while the other three points were all small wave crests. The changing trend in the jaggedness curve was similar to the area. The wave crest appeared earlier, concentrated in the 0–200 range, and the fluctuation range was large and had started decreasing and stabilizing. There were more waving crests (about 18 times greater), and the crests where the four spatial nodes overlapped were small. Spatial sequence change curve.
The occlusivity and the O/P had comparable trends, and the fluctuation range was largely similar. Except for the occlusivity, which fluctuated considerably in the 400–550 segment of the viewpoint, the other spatial values were between 0.25 and 0.50, while the O/P values ranged between 280–380 and 500–550, and they were at a large wave crest with a value of 0.55. None exceeded 0.6, but the positions of the four spatial nodes were not significantly related to the position of the O/P value crest. Except for the higher starting viewpoint, the other viewpoint values of the drift curve were in a stable fluctuation state, with two large peaks appearing at viewpoints 250 and 520.
The vista length showed a downward trend, and the 0–250 viewpoint segment was at a higher level. The viewpoint segment fluctuated in the low-level range. The spatial position of the viewpoint coincided with the peaks of the 2 curves, and the values of positions A and C were higher than those of B and D. The range curve showed an upward trend; the farther away the point was from the starting point, the larger the value. The compactness curve roughly showed a low-high-low trend. Although the two curves had different trends, they both showed strong fluctuations of the viewpoint 550. The compactness peak appeared in the 250–500 segment of the viewpoint, and the node’s position in the A-D space had no discernable relationship with the position of the wave crest.
The spatial convergence and divergence of POI and the mixed degree of street function
POI point data do not currently have time information, but this study mainly focuses on analyzing urban physical space and material environment elements, so we did not consider it. The crawled POI point data was cleaned, deduplicated, coordinate corrected, and classified, and six types of business-related data were selected for quantitative analysis (Table S4).
The kernel density analysis tool in GIS was used to visualize the agglomeration degree of spatial elements of 6 types of POI data points (Figure 3). The shopping service information point had the largest number, and the spatial agglomeration differed considerably. The main distribution was in the Qingniwa business district on the south side, the commercial complex on the west side, and the central shopping plaza. The pedestrian street section had the lowest spatial agglomeration value at 28/km2. The life service facilities were mainly concentrated on the north side of the block, the central shopping plaza, and the central shopping plaza. The commercial complex on the west side had the highest spatial concentration, ranging between 45 and 5328/km2, and distributed in a plane pattern between the central and northern sides. The spatial distribution of various POI point data aggregation density.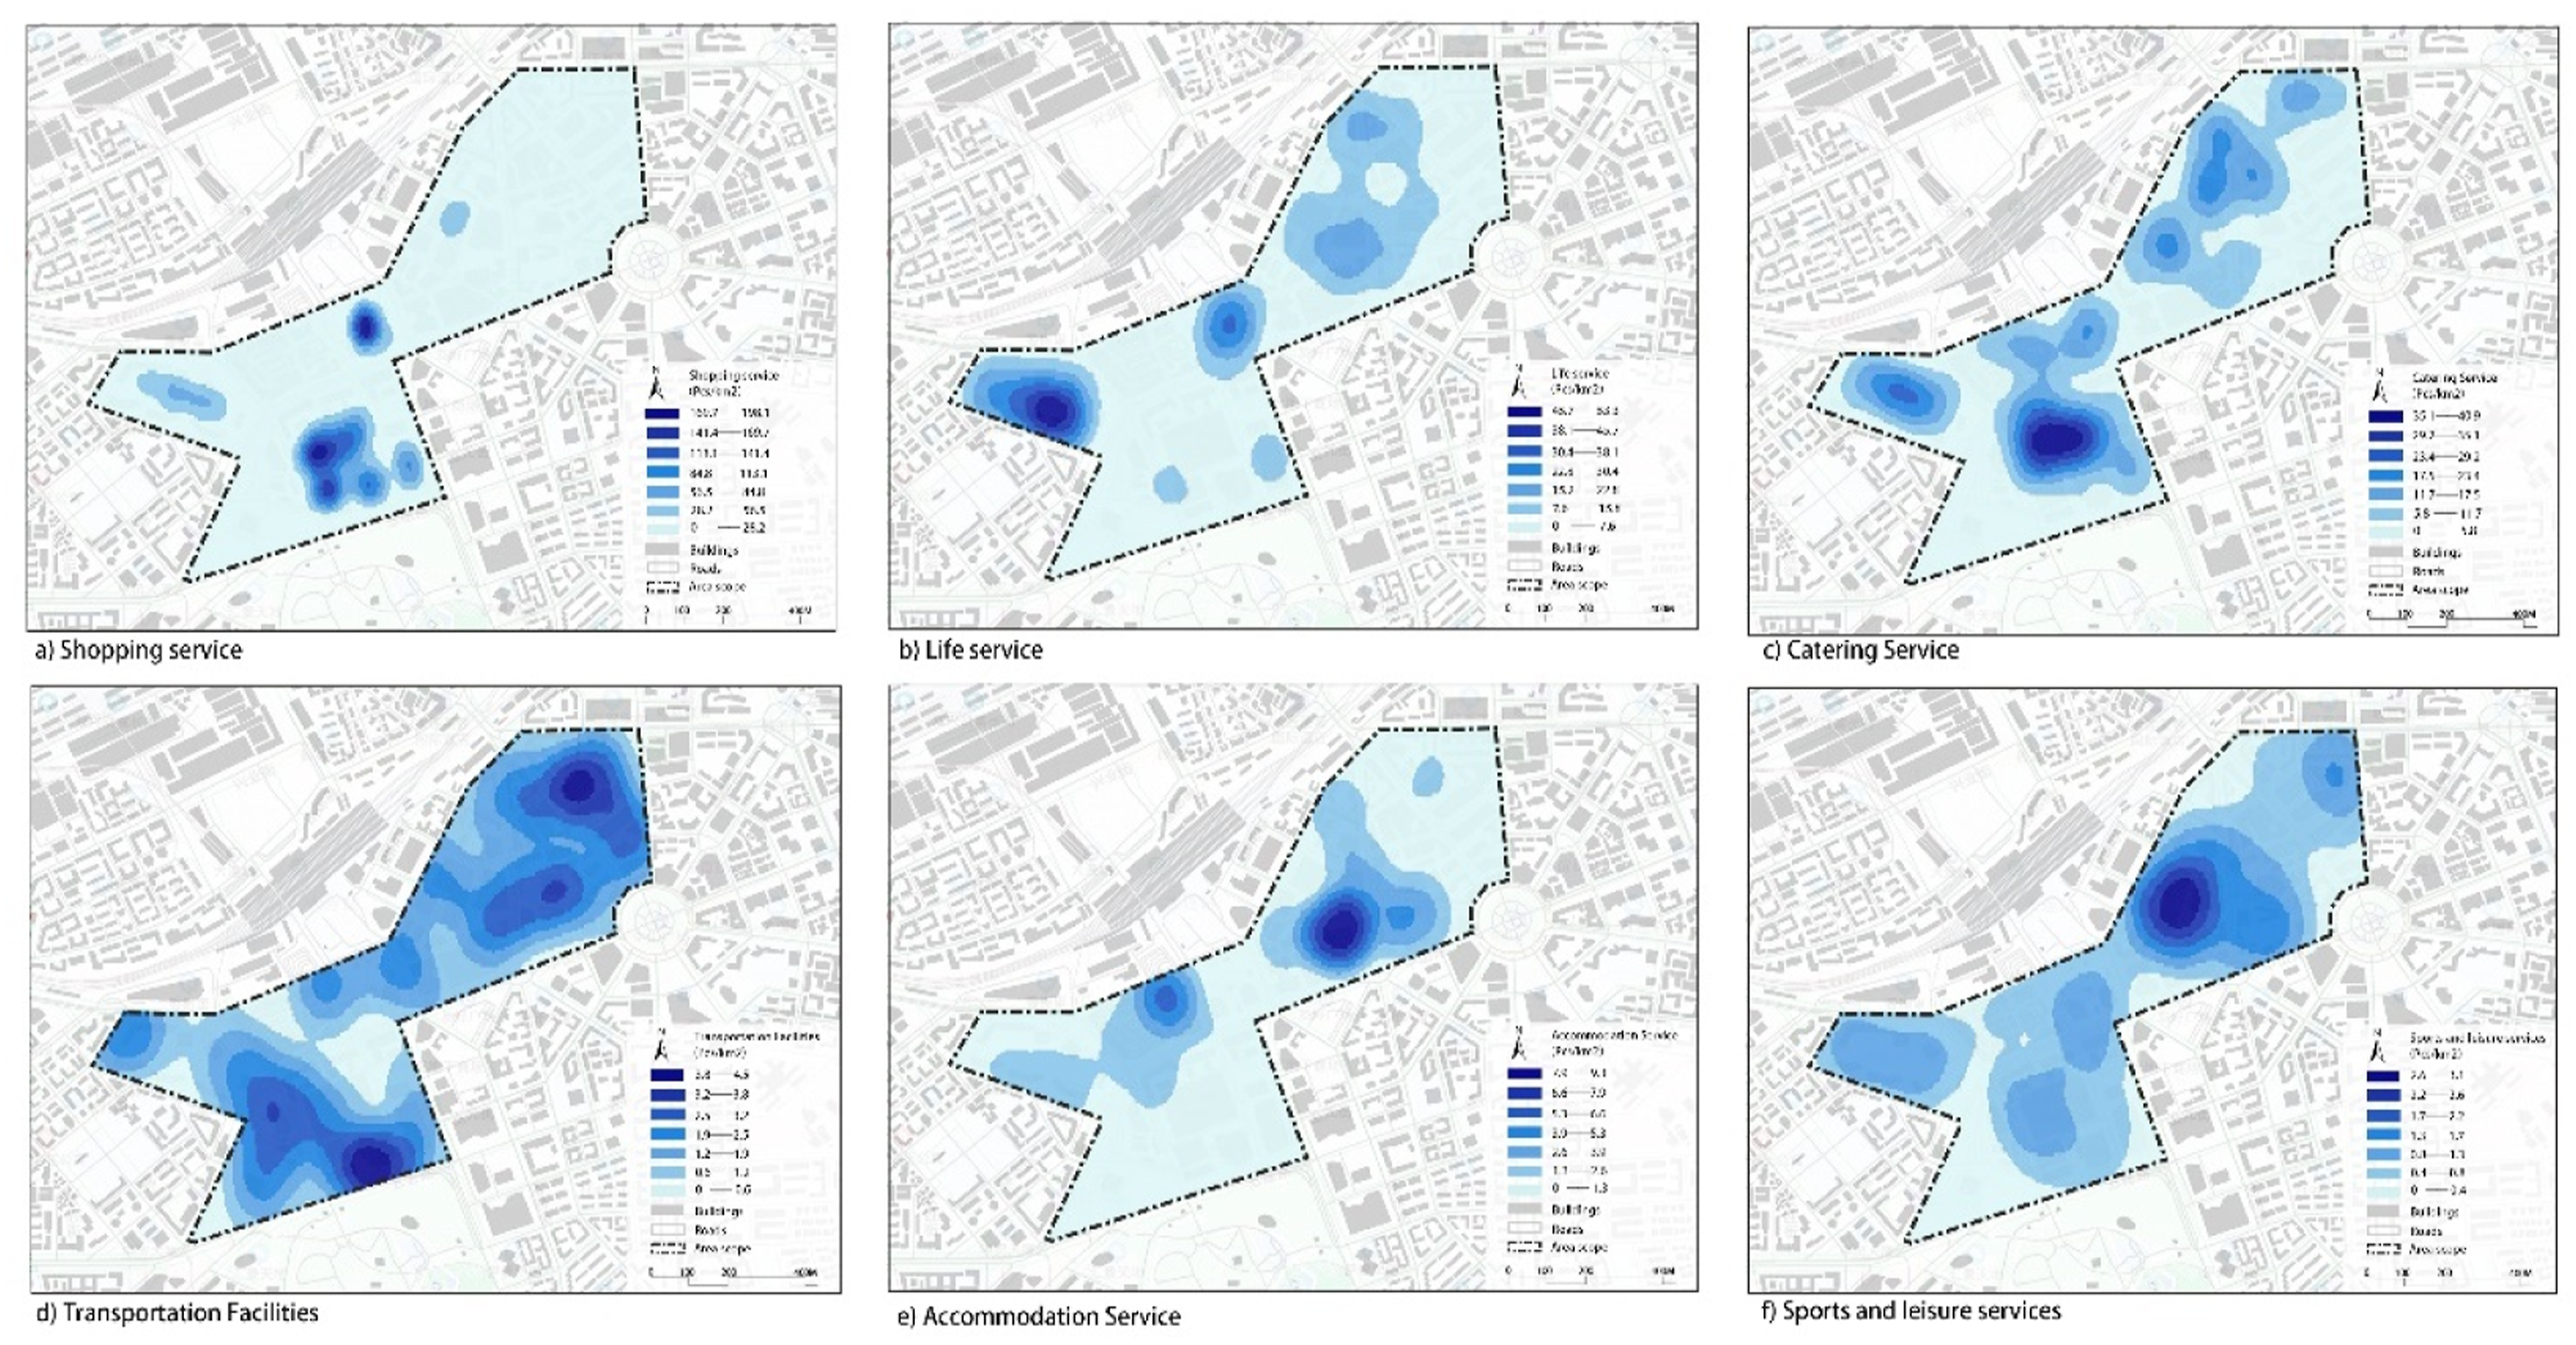
The number of catering service information points did not differ significantly from the life services. However, there were two different layout states. The former was more evenly distributed in space, with the Qingniwa commercial district on the south having the highest value. The latter had a low spatial concentration and wide coverage, with the southern business district having a high aggregation of about 35–40/km2. The spatial distribution of the transportation facilities was the most evenly distributed. This suggests that the rail transit stations, bus stations, bus lines, and parking lots (spaces) in this block covered a wide range and that the transportation system was excellent.
The accommodation service layout was similar to the life service and was mainly concentrated in the north and the middle. The highest density space was situated in the middle at about 7–9 spaces/km2. The difference between the gathering and dispersion of the sports leisure was small, and the business format layout covered the entire commercial pedestrian block. The center of the pedestrian section had the highest concentration of space, about 2–3 per km2, which lays the business foundation for constructing cultural and leisure outdoor pedestrian blocks. The spatial distribution results of the degree of agglomeration for the various business forms provide the material element basis in studying the spatial form of the block.
The grid calculator in GIS was used to calculate the proportion of various POIs in each buffer zone and the functional blending degree of each road (Figure 4). We found that the functional mix of the same road was quite different. Highly mixed streets were mainly situated in the north and center, and the pedestrian section (Tianjin Street) had the highest degree of functional mix. For the vitality experience value of public walking spaces, the road mixing degree of the commercial complex on the west and south sides of the block was at a medium level. Crowd activities were mainly concentrated indoors, meaning that they cannot be reflected by the road function mixing degree. Areas with low street function mix mainly appeared on the east circular traffic island and the southwest side, mainly traffic roads. The POI data category was single, and the street function mix was low. The results of the mixed degree evaluation of street functions were used as the basis for the comparative analysis of the spatial morphology of the block. POI street function mix.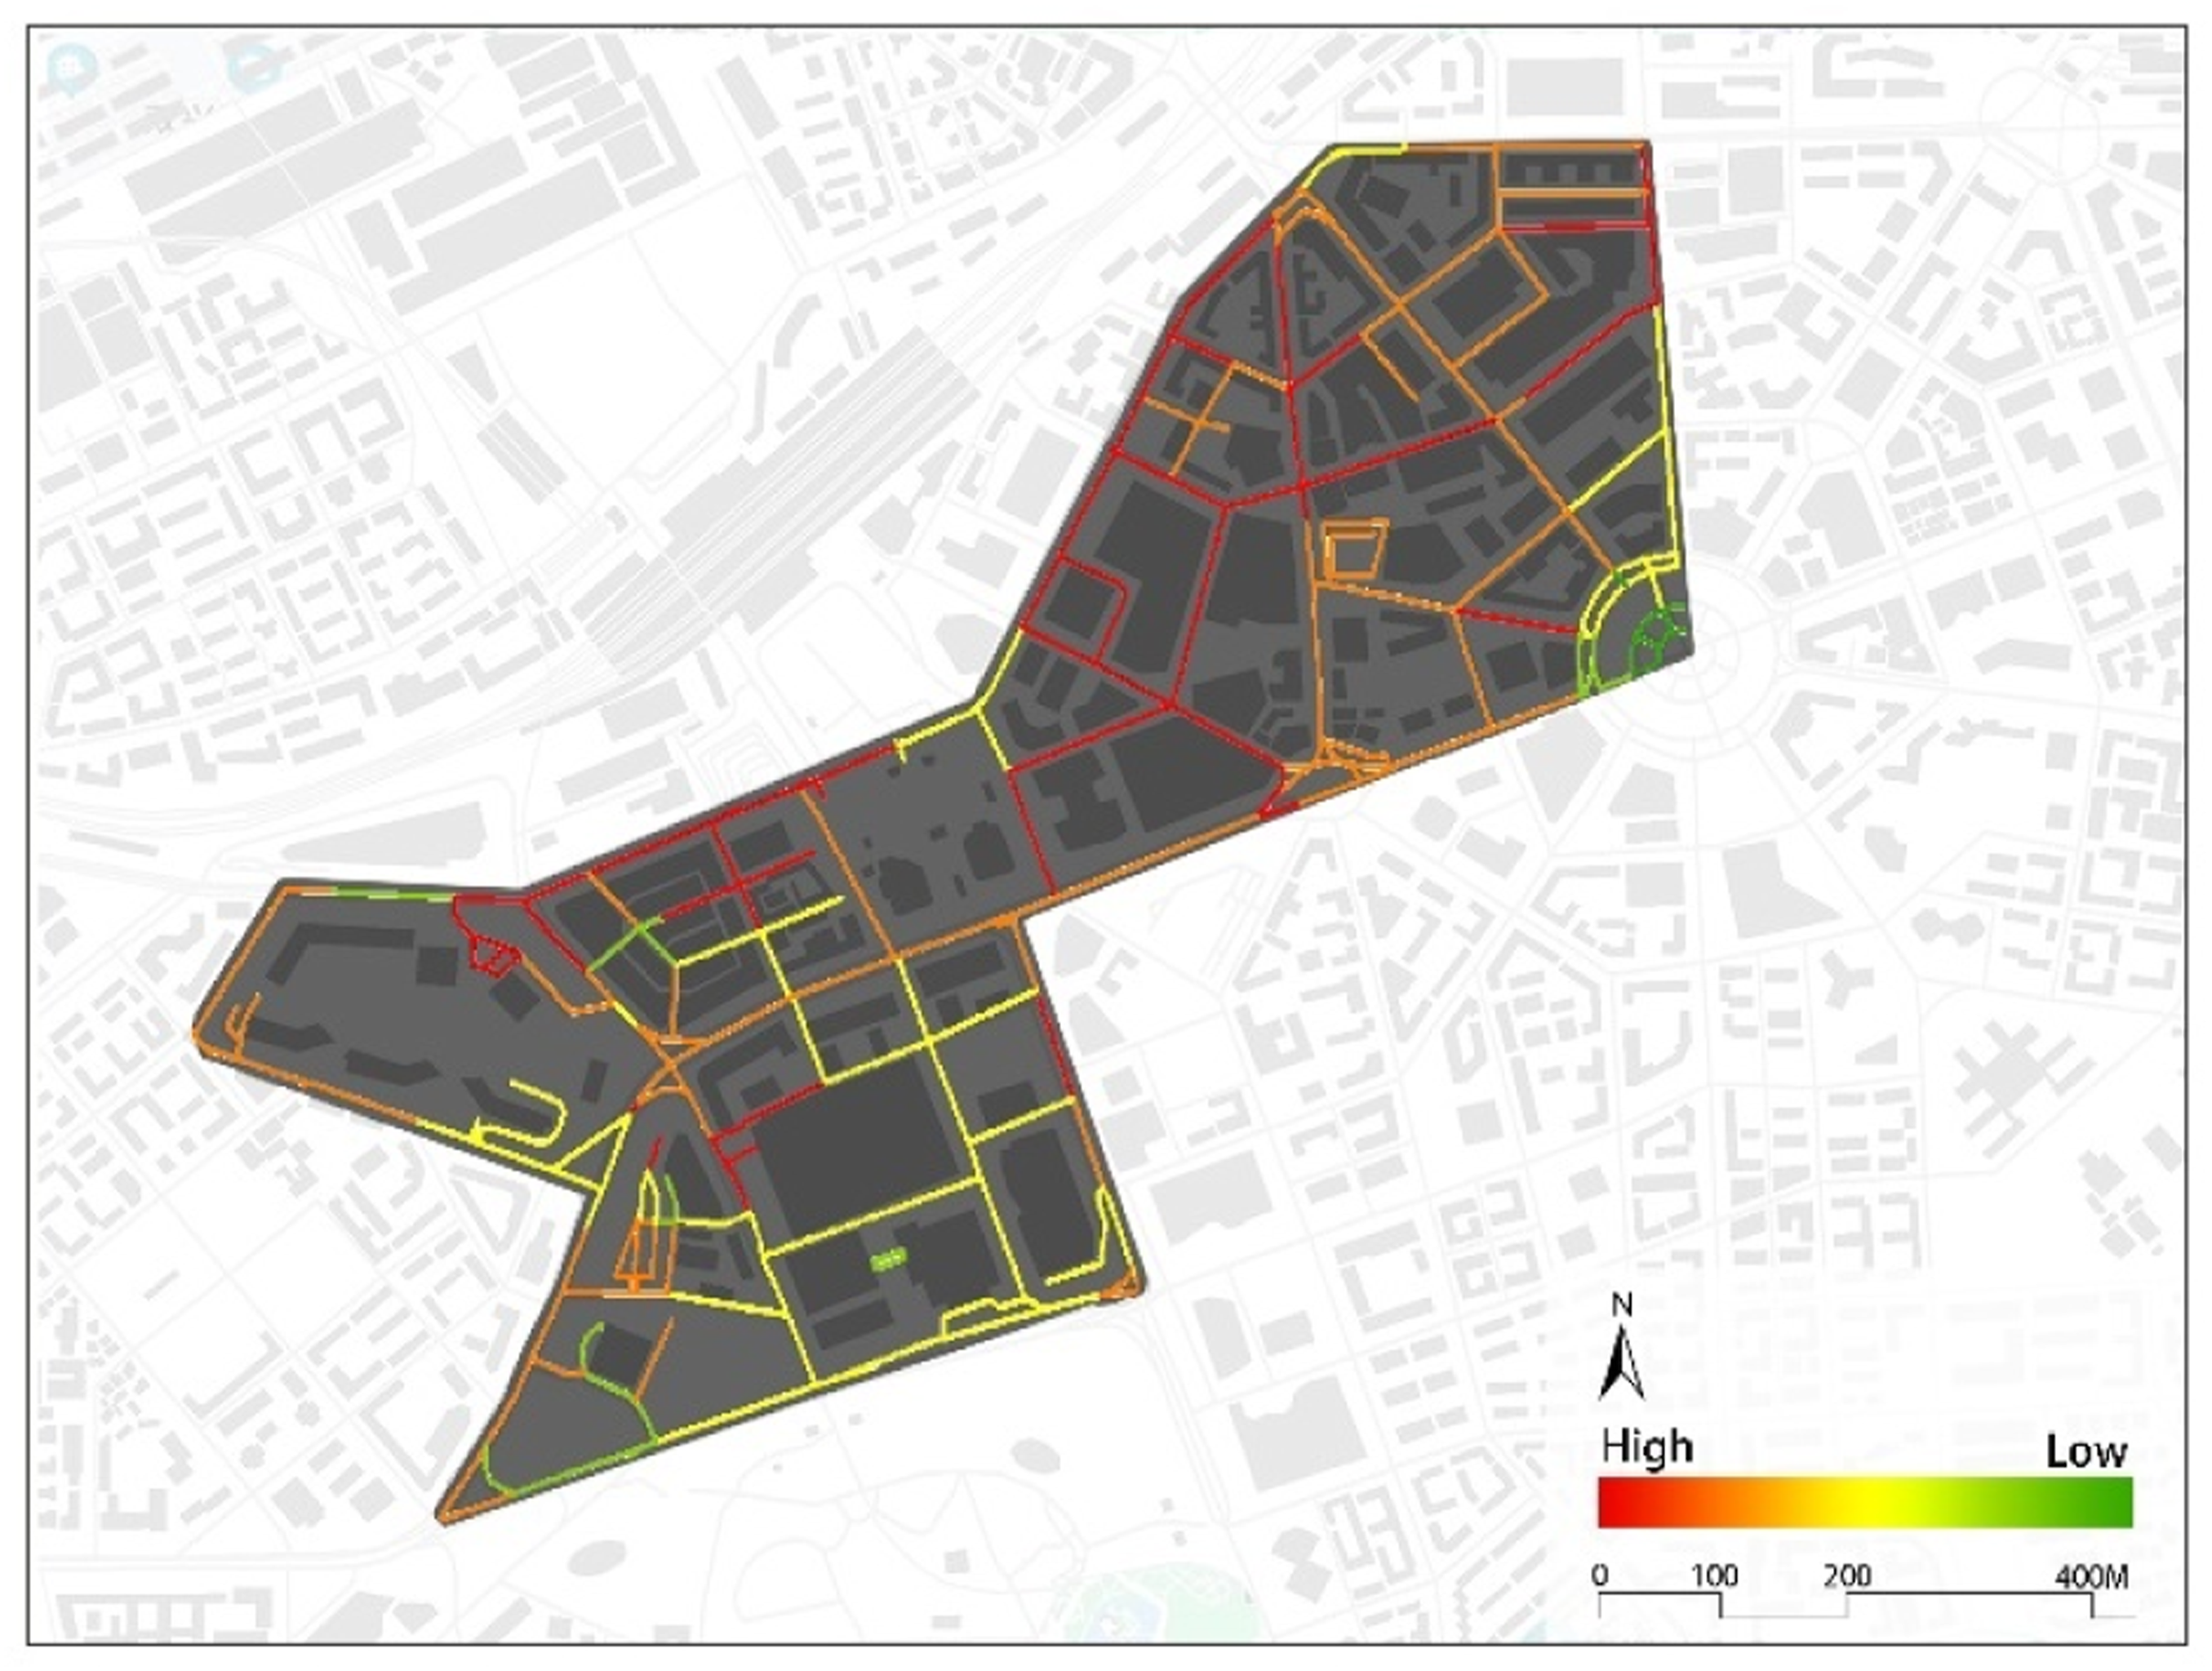
Spatio-temporal distribution of people flow in heat map
Extent changes in high-heat areas on different days.
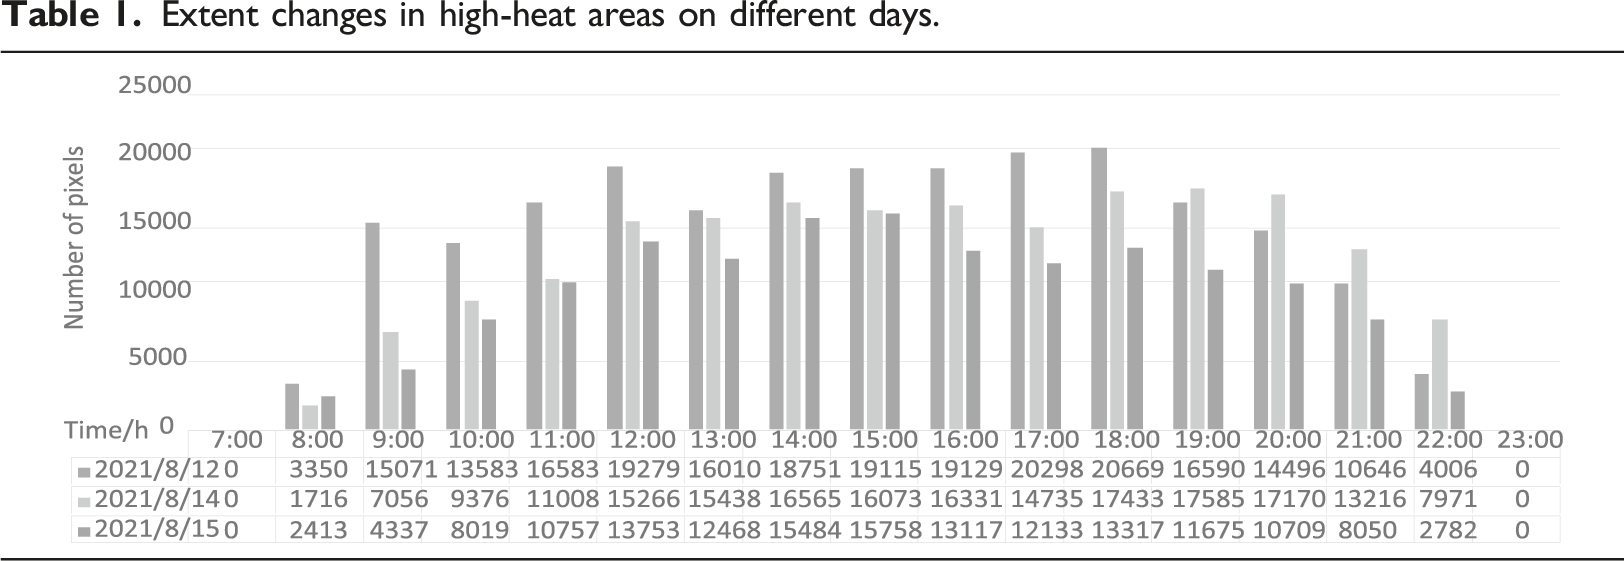
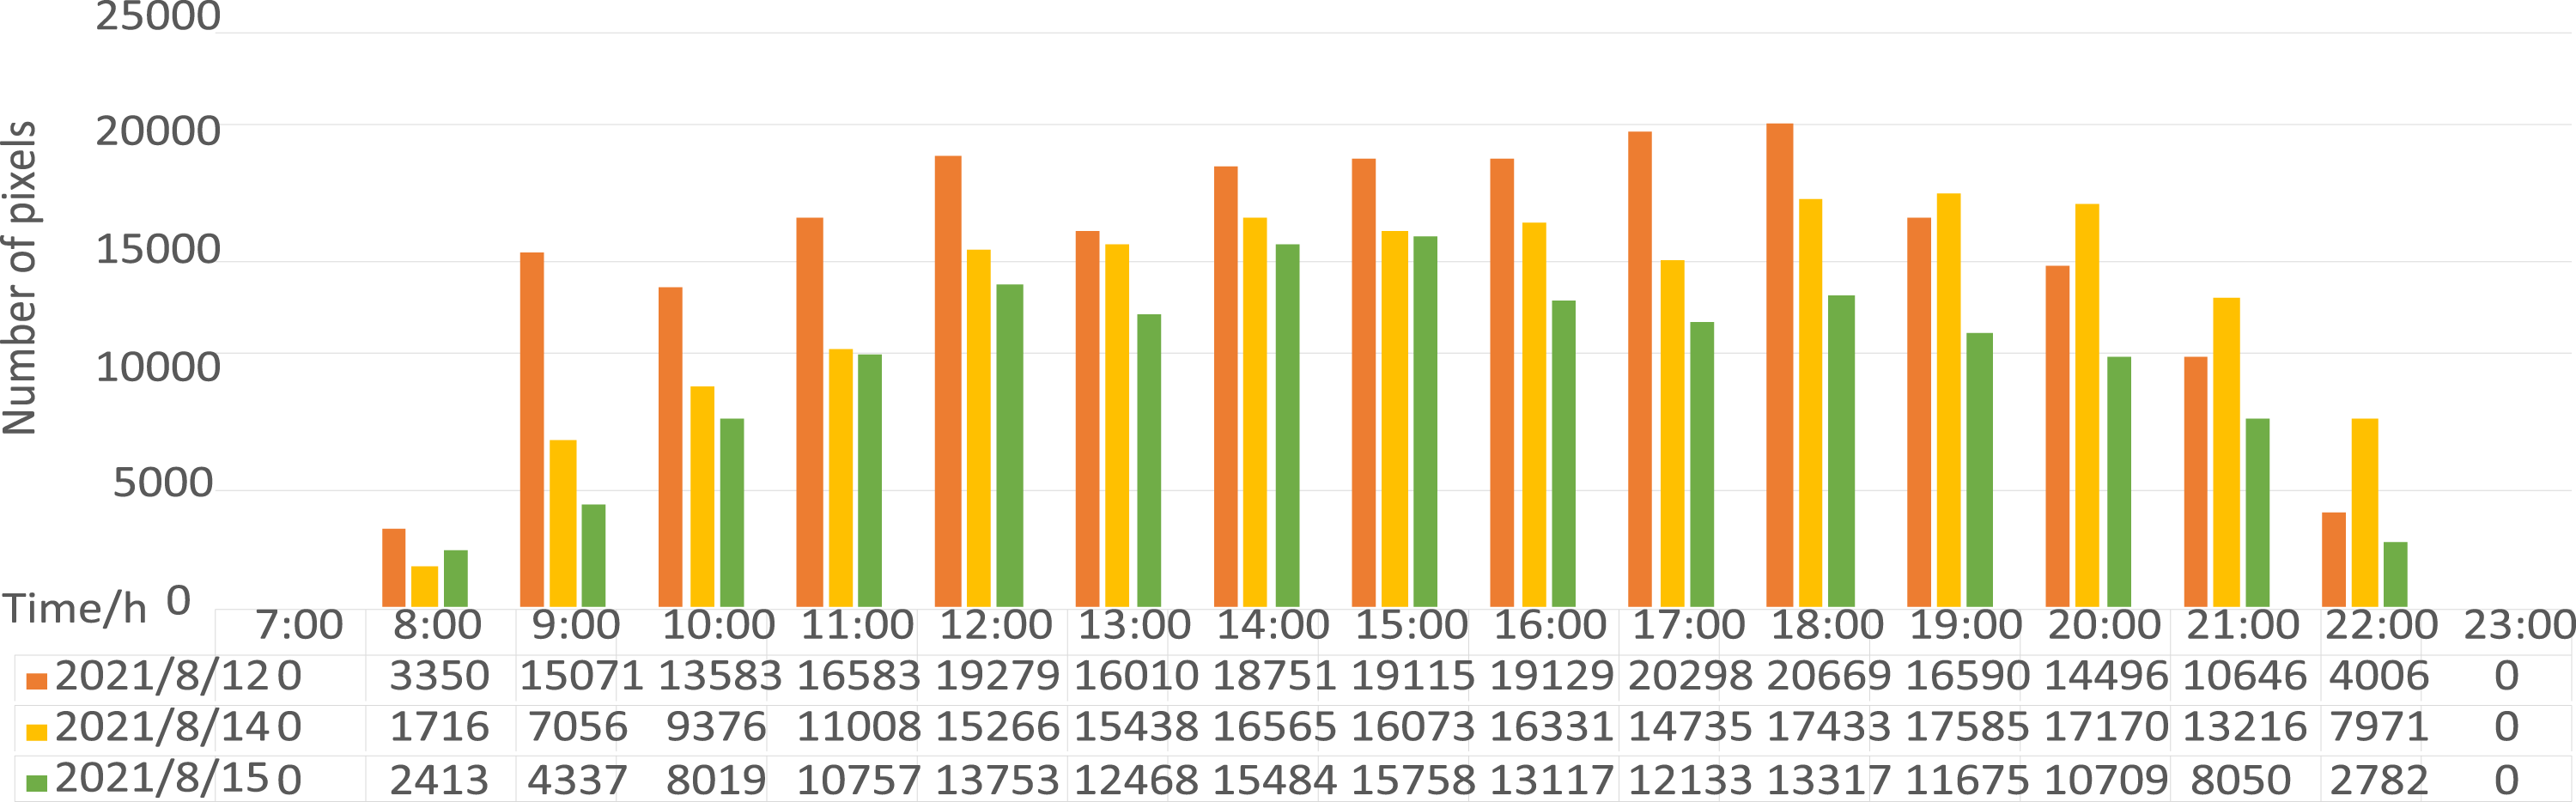
The data and trend analysis results suggest that the changes in high-heat areas are in line with the residents’ daily routines. Comparing the high-heat areas on different days, before 17:00, the crowdedness during the workday was greater than during the holiday or weekend. After 18:00, the high-heat areas on the workday were less than during the holiday or weekend. Fewer people go out for shopping and dinners after work on workdays, and the flow of people after 18:00 on workdays is greater than on weekends or holidays.
Seventeen daily heat maps were superimposed to get the average heat values (Figure 5). The areas with continuous high heat during working days are relatively concentrated, mainly in the western commercial center and the northern school and office buildings. Crowd gatherings during the workday were most likely school and work-related, with the concentration of crowd gatherings in business office areas significantly higher during the workday compared to the weekend. On rest days (holidays and weekends), the areas with continuous high heat are scattered, and there are many crowded centers. We then compared the average heatmaps for different days. The results show that the high-heat area is largest during holidays, followed by working days and weekends. This means that the duration and activity intensity of crowd gatherings is higher on holidays compared to working days and weekends. In addition, the commercial centers on the west and south were all high-heat areas in the average heat maps (mean from the three different dates) and had higher heat intensity than the main pedestrian streets. Average thermal intensity from 7:00 to 23:00 on August 12–14.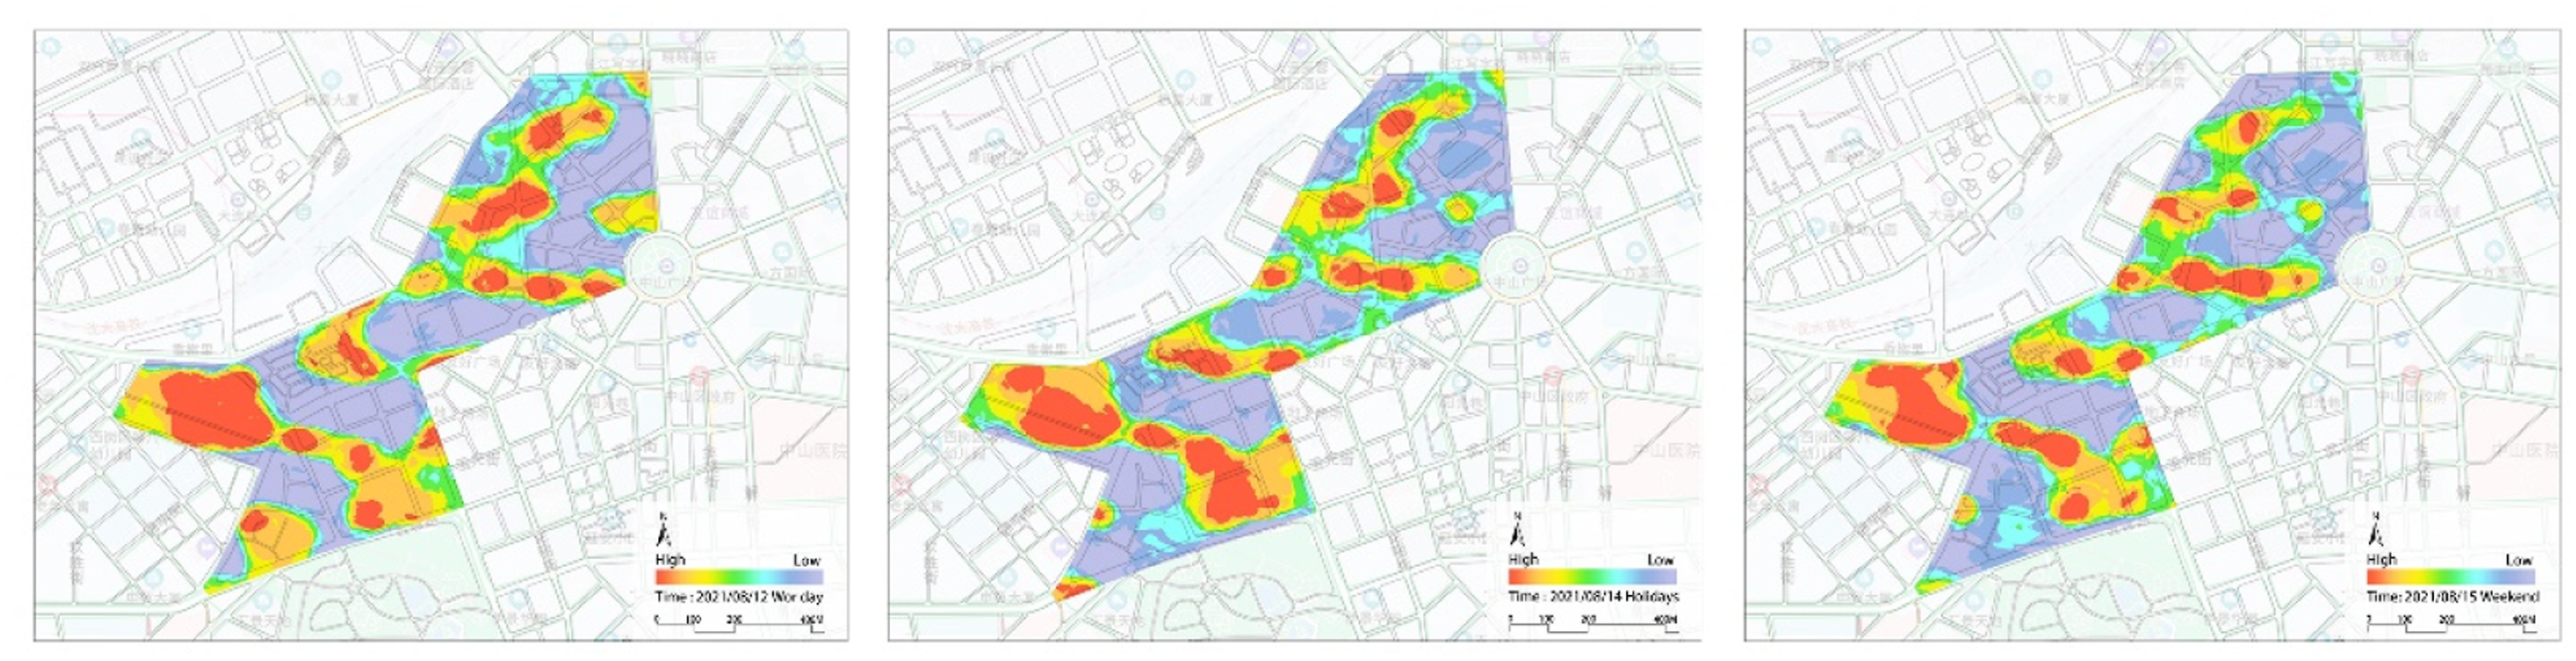
Discussion
Applicability of Isovist in the spatial form of the block
We then used a software to quantify the geometric properties of the block spaces and explore the topological relationship of the spatial form. The block space was found to have poor overall permeability and had high centrality and traffic potential. The average value for choice was 0.25, and 48.99% of the streets were above the average level. Pedestrian section space can attract more people to pass through, providing commercial spaces for staying and selling needs. Using path measurement, we then explored the problems in the spatial form of pedestrian sections. The changing trend in the jaggedness and the area suggest less open space in streets. Except for the main browsing route, no other branch road walking route intersected with the main walking route. The occlusivity and the change trend of the O/P value were comparable. This suggests that the mystery of the main pedestrian street along the tour path was uniform. The O/P value did not exceed 0.6, ensuring that the mystery does not affect the control of other target information and that the route choice was reasonable. The changing trend in the drift and the vista length were all from high to low, indicating that the guidance of the space had been gradually decreasing. It is more likely that people only follow the designed route at the entrance of the block.
The range curve increased as the distance from the starting point also increased. The sudden drop and fluctuation of the curve indicate that this was a space and that detour behavior is likely to occur. The four spatial nodes of A-D did not correspond well to the peak positions of area and jaggedness, indicating that the spatial connection of the nodes is weak and does not have obvious spatial distinction marks. The space node did not spatially correspond well with the wave crests. Ideally, the node space should appear at the large wave crest or large wave trough of jaggedness. The most complex or simple design style can make people clearly distinguish between nodes. There was no obvious relationship between the nodal space and the peak position of the O/P value, indicating that the nodal space cannot stimulate people’s desire for exploration to the greatest extent. The four space nodes all coincided with the peaks of the free distance, indicating that the node space had particular visual appeal.
Applicability of POI and heat map on the spatial structure of neighborhoods
The spatial agglomeration analysis of the different POI types indicates that the southern and central parts of the block are the most concentrated locations for various types of businesses. As the business core of the commercial pedestrian block, the difference in the spatial convergence of the east and the west was relatively large. The low concentration of pedestrian streets on the east side does not provide a strong physical foundation for constructing the neighborhood environment.
Software analysis and simulation can reflect the physical attributes of space but do not reflect people’s behavior and spatio-temporal distribution in the actual process. In this study, the space-time information was provided by the heat map. We found that the duration of the high-temperature area on weekdays is longer than that of holidays and weekends, and the peak start time is earlier. On weekdays, commercial blocks assume significant transportation and economic functions. To a certain extent, the economic and social functions of commercial blocks are more important than their entertainment and leisure functions. In addition, we found that the area of high heat was largest during the holidays, indicating that the holidays have the highest activity intensity and longest duration. According to the distribution of crowd gathering areas, the attraction of outdoor pedestrian streets is lower than that of commercial complexes on the west and south sides.
Case study analysis
We conducted three quantitative analyses on the spatial form and structure of commercial pedestrian blocks and found that the summarized spatial characteristics can be mutually proven. For example, (1) the choice and the integration of the spatial form of commercial pedestrian blocks are at a relatively high level, indicating that the space has a large traffic potential. In terms of the time distribution characteristics of the heat map, we have reached a similar conclusion. The transportation function is greater than the entertainment and leisure function. The perfect road network structure of the block provides higher accessibility for the space, thereby prompting it to assume a higher proportion of traffic functions. (2) The change trend of the measurement index range of the main walking route is consistent with the change of the street function mixing degree formed by the POI point data. The visible range of the area has been increasing, and the street function mixing degree has also increased from low to high, indicating the actual street design makes good use of the characteristics of the spatial form and structure. (3) The value of the range and compactness before and after the sight point 550 drops sharply to 0 and fluctuates sharply. The shopping service and catering service at the POI point have a high degree of concentration and a high degree of street function mixing, and the concentration of people is at three different levels. It is in a high-heat area during the date, which proves that the space structure here is more complicated, and people are easy to stay and detour here, which increases the possibility of buying behavior.
Limitations of the study
There were a number of limitations in this study. First, The Isovist-App software analysis overlooks the building height of the block. When Isovists quantified the spatial form, they assumed that the heights of the buildings on both sides of the street were similar for people’s viewpoints. However, in real life, the building height of the pedestrian block affects the spatial form attributes. Second, the classification of POI facilities lacked weight analysis and category analysis. The classification of POI in our research was limited to major categories. There was limited analysis on the distribution of different types of facilities in the spatial structure and their degree of impact on people. For example, department stores and convenience stores have varying spatial convergence and divergence characteristics, and people have different demand levels for them. This means that different facilities may require different proportions in the physical space structure. Also, we only selected 3 days of heat map data and used a small sample size. However, different seasons and weather patterns and various holidays may affect the travel activities of urban residents, so the limitations in the number of data could have significantly impacted the results.
Our research aims to provide a multi-layered analysis method for the quantification of the spatial form and structure of urban commercial pedestrian blocks. Through the analysis of the existing situation, the methods and tools for quantifying urban street space are summarized. This study verifies the effectiveness of the mutual verification research method and lays a theoretical and practical foundation for subsequent quantitative research on spatial form in other urban functional areas.
Conclusions
We explored the adaptability of the visual domain software in quantifying the spatial form of blocks and the application of big data on the spatial structure. The main conclusions of the study are as follows: (1) The pedestrian axis Tianjin Street has a low spatial permeability, and the corresponding drift is also in a low-value range. Crowds are mostly concentrated in low-heat areas. It shows that the browsing route is monotonous; the outdoor pedestrian space design cannot attract crowds to stop, losing the meaning of the pedestrian street itself. It is recommended to add pedestrian branches, outdoor commercial sales, and leisure and entertainment spaces. The overall centrality of the space was relatively high, and the spatial accessibility was good. The walking route provided for a wide field of vision, stimulating people’s desire for exploration. The space is highly guided, and people can visit according to the designed route. (2) The spatial concentration and dispersion of POI facilities were quite different. The distributions of transportation, sports, and leisure facilities were the most uniform, and the service scope covered the entire block. There were catering and accommodation service facilities. The distribution of shopping and life service street facilities considerably varied, and the high gathering points were mainly concentrated on the south and west sides of the block. The mixed degree of street functions presented a spatial trend of high in the northeast and low in the southwest. Tianjin Street, the main pedestrian section, had the highest degree of street function mix and decreased toward the surrounding area. (3) The period of high-heat areas on weekdays is longer than rest days (weekends and holidays), and the peak time occurs earlier. High-heat areas are relatively concentrated on weekdays, while rest days are relatively scattered. During holidays, the intensity and duration of crowd activities are the largest, followed by working days and weekends. The people in the block mainly gather in the western and southern commercial complexes, and the attractiveness of outdoor pedestrian streets is lower than that of commercial complexes. (4) Node space B (Figure S4) has varying functional mixing degrees, with the north side having lower values than the south side. The free distance of the block spatial form is small, and the average crowd concentration degree can be found in low-heat areas. This means that the spatial interface of the pedestrian street here is quite different and that the visual appeal is not consistent. The current “Tianjin Street” archway sign does not have good spatial guidance. It is recommended to set up a hydrophilic platform or increase the depth of the entrance plaza to enhance visual tension.
This study extends the theoretical applications of the visual domain theory and the commercial pedestrian block space. The Isovist-App software was used to quantify the block space morphology, and the software simulation results were compared with multi-source data analysis. Software simulation allows the research object to be separated from other complex factors, highlighting the reaction force of space to social activities. Our proposed approach avoids the subjectivity of drawing spatial syntax axis diagrams and improves the accuracy of spatial data collection. Our innovative research method for mutual verification proves the importance of spatial form and structure and provides an analysis method combining multiple quantitative tools for the spatial analysis of other functional areas.
Supplemental Material
Supplemental Material - Analysis of spatial form and structure of commercial pedestrian blocks based on Isovist and big data
Supplemental Material for Analysis of spatial form and structure of commercial pedestrian blocks based on Isovist and big data by Ye Sun, Wei Lu and Zongchao Gu in Environment and Planning B: Urban Analytics and City Science.
Footnotes
Author Contributions
Conceptualization, Y.S.; methodology, Y.S.; software, Y.S.; validation, Y.S.; investigation, Y.S.; resources, Y.S.; data curation, Y.S.; writing—original draft preparation, Y.S.; writing—review and editing, W.L. and Z.G.; visualization, Y.S.; supervision, W.L. and Z.G.; All authors have read and agreed to the published version of the manuscript.
Declaration of conflicting interests
The author(s) declared no potential conflicts of interest with respect to the research, authorship, and/or publication of this article.
Funding
The author(s) disclosed receipt of the following financial support for the research, authorship, and/or publication of this article: This research was funded by the National Natural Science Foundation of China, grant number 51808094.
Supplemental Material
Supplemental material for this article is available online.
Author Biographies
References
Supplementary Material
Please find the following supplemental material available below.
For Open Access articles published under a Creative Commons License, all supplemental material carries the same license as the article it is associated with.
For non-Open Access articles published, all supplemental material carries a non-exclusive license, and permission requests for re-use of supplemental material or any part of supplemental material shall be sent directly to the copyright owner as specified in the copyright notice associated with the article.