
Abstract
This paper introduces a joint choice model for travel mode and duration to quantify the mobility impacts of urban design changes on the built environment. The model is formulated as a Random Forest classifier that predicts the mode-duration probabilities of a given trip. A novel series of predictor features are proposed which measure the urban form, demographics, and service densities on different scales of the transportation network. Through a sensitivity analysis and a proof-of-concept case study, we find that a dense, mixed-use environment with good coverage of a multi-modal mobility network can significantly promote active transportation and public transit use. However, we also find that ultra-dense, centralized developments can lead to increased travel time and increased vehicle use in the urban periphery. Our modeling and analysis method provides a simplified and effective way to assess urban design and planning scenarios from different mobility perspectives and facilitates data-driven, mobility-aware urban design and planning that can help identify better solutions more quickly.
Introduction
The global urban population is projected to grow significantly by 2050 (United Nations, 2018), which indicates that existing urban mobility problems like congestion and pollution could be further aggravated in the coming thirty years. It is important for future cities to reduce vehicle reliance and promote alternative transport solutions such as walking, biking, and public transit (Rupprecht Consult, 2019). For example, the California Transportation Plan 2050 envisions reducing total vehicle distance traveled by up to 27% and increasing trips by public transit and active modes by 10% to mitigate congestion, protect the environment, and enhance the quality of life.
Well-informed mobility-aware decision-making in spatial planning and urban design is imperative to realizing these goals. Built environment factors, such as placement of urban services, population density allocation, and network design, have a fundamental impact on human travel behavior, such as mode choice and travel distance (De Vos et al., 2021; Ding et al., 2017; Litman, 2022; Wang and Zhou, 2017). Although these factors are found to have modest significance on their own, typically just a few percent of total travel choices, they are synergistic and therefore have a significant combined effect on aggregate travel behavior (Ewing and Cervero, 2010). Urban infrastructure and spatial patterns are much more costly to change once established than policies like parking pricing or gasoline taxing. Hence, there is a consensus that good spatial planning and urban design is a reliable, long-term, and cost-effective approach to alleviating mobility problems (Ma et al., 2018).
To achieve mobility-aware decision-making in urban design, it is necessary to quantify the built environment’s influence on travel choice behavior. The main approach is to link built environment variables and the travel choice probabilities through statistical models. The commonly used models include discrete choice models (Ding et al., 2018; Yin et al., 2022) and regression models (Berhie and Haq, 2017; Lee et al., 2016). The most analyzed travel choice is the mode choice. In terms of built environment variables, most studies used density, diversity, and design indicators, the so-called 3Ds (Cervero and Kockelman, 1997). Density variables can be population, employment, or activity densities. Diversity variables can be measurements of job-housing ratios or the mix of land use types. Design variables can be descriptions of network characteristics, such as connectivity or street segment length, or street quality, including tree canopy or reported pleasantness. Other variables that are often accounted for in these studies are variables related to self-selection, such as sociodemographic variables and attitudinal variables (Aston et al., 2021).
The existing approach can be developed further. Firstly, there is a growing interest in switching from traditional statistical models to data-driven machine-learning models. Studies demonstrate that machine learning methods are more robust, flexible, and generalizable to be used in mobility modeling because they are purely driven by data and do not introduce predefined utility functions or model structure (e.g., linear or log-linear) (Drchal et al., 2019; Zhang and Zhao, 2022). Evidence also shows that machine-learning classification models have overall higher predictive power than traditional discrete choice models (Cheng et al., 2019; Zhao et al., 2020). Secondly, there is potential for analyzing more integrated mobility metrics rather than just travel modal split. This can be realized using a joint-choice model. For example, previous studies have investigated joint choices of travel mode and travel distance (Ding et al., 2014; Vega and Reynolds-Feighan, 2009). Beyond these studies, this type of model has received limited attention to date. Thirdly, there is room to expand the definition of the built environment variables. The current definitions of the 3D variables are usually restricted by a small spatial range or buffer zone (e.g., density within a walkable distance of 1.5 kilometers or 15-minute walking) (Berhie and Haq, 2017; Gan et al., 2021). These variables may be sufficient for modeling walking preferences. However, in a multi-modal system, different travel modes can be sensitive to varying spatial ranges. It can be beneficial to include built environment variables measured on different scales of the transportation network to comprehensively reflect trade-offs of multi-modal choices. However, there is limited research examining the variability within different measurement scales of the built environment variables.
This paper aims to build on previous studies and propose a data-driven joint choice model of travel mode and duration with a novel set of built environment variables. The joint choice model is formed as a machine learning classifier that predicts the mode-duration probabilities of a given trip. The novel-built environment variables are a series of accessibility (ACC) features that measure the total number of different jobs within different mode-duration levels from the starting location. As a proof-of-concept example, we train the model based on travel survey data and use it to predict the aggregate mode-duration distributions in the City of Los Angeles (LA City) at the Census Block Group (CBG) level. A sensitivity analysis is conducted for evaluating the marginal effects of the built environment features. A case study is used to showcase how the trained model can help answer what-if questions about built environment scenarios.
Data processing and feature engineering
Travel features
Mode-duration choice set.

aTrips that are taken by modes other than walking, biking, vehicle, and transit are dropped (2.5% of all trip records before dropping).
bThe bike mode has the same 40% and 60% quantile duration (i.e., both are 15 minutes) thus it has one less duration level.
cThe duration of the transit trip is derived by subtracting the self-reported waiting time from the total travel duration.
Description of travel features.

aFIPS stands for the Federal Information Processing Standard codes which uniquely identify the CBG.
Built environment features
Description of built environment features.

The ACC features of a CBG are derived by counting the jobs of different categories by mode-duration levels from the CBG. Each ACC feature can be denoted as ACC(X)_m_d (e.g., ACC(EDU)_walk_0-5min) where X is the abbreviation of categories as listed in Table 3. equation (1) defines the ACC features
The duration level between the CBGs is derived through a mode-specific routing process. Figure 1 illustrates the accessible CBG within different walking duration levels from block group A. Note that most CBGs use the geometric center as the router point, while the large ones like block group B ( (a) CBG router points. (b) (c) Accessible CBG within different walking duration levels from A.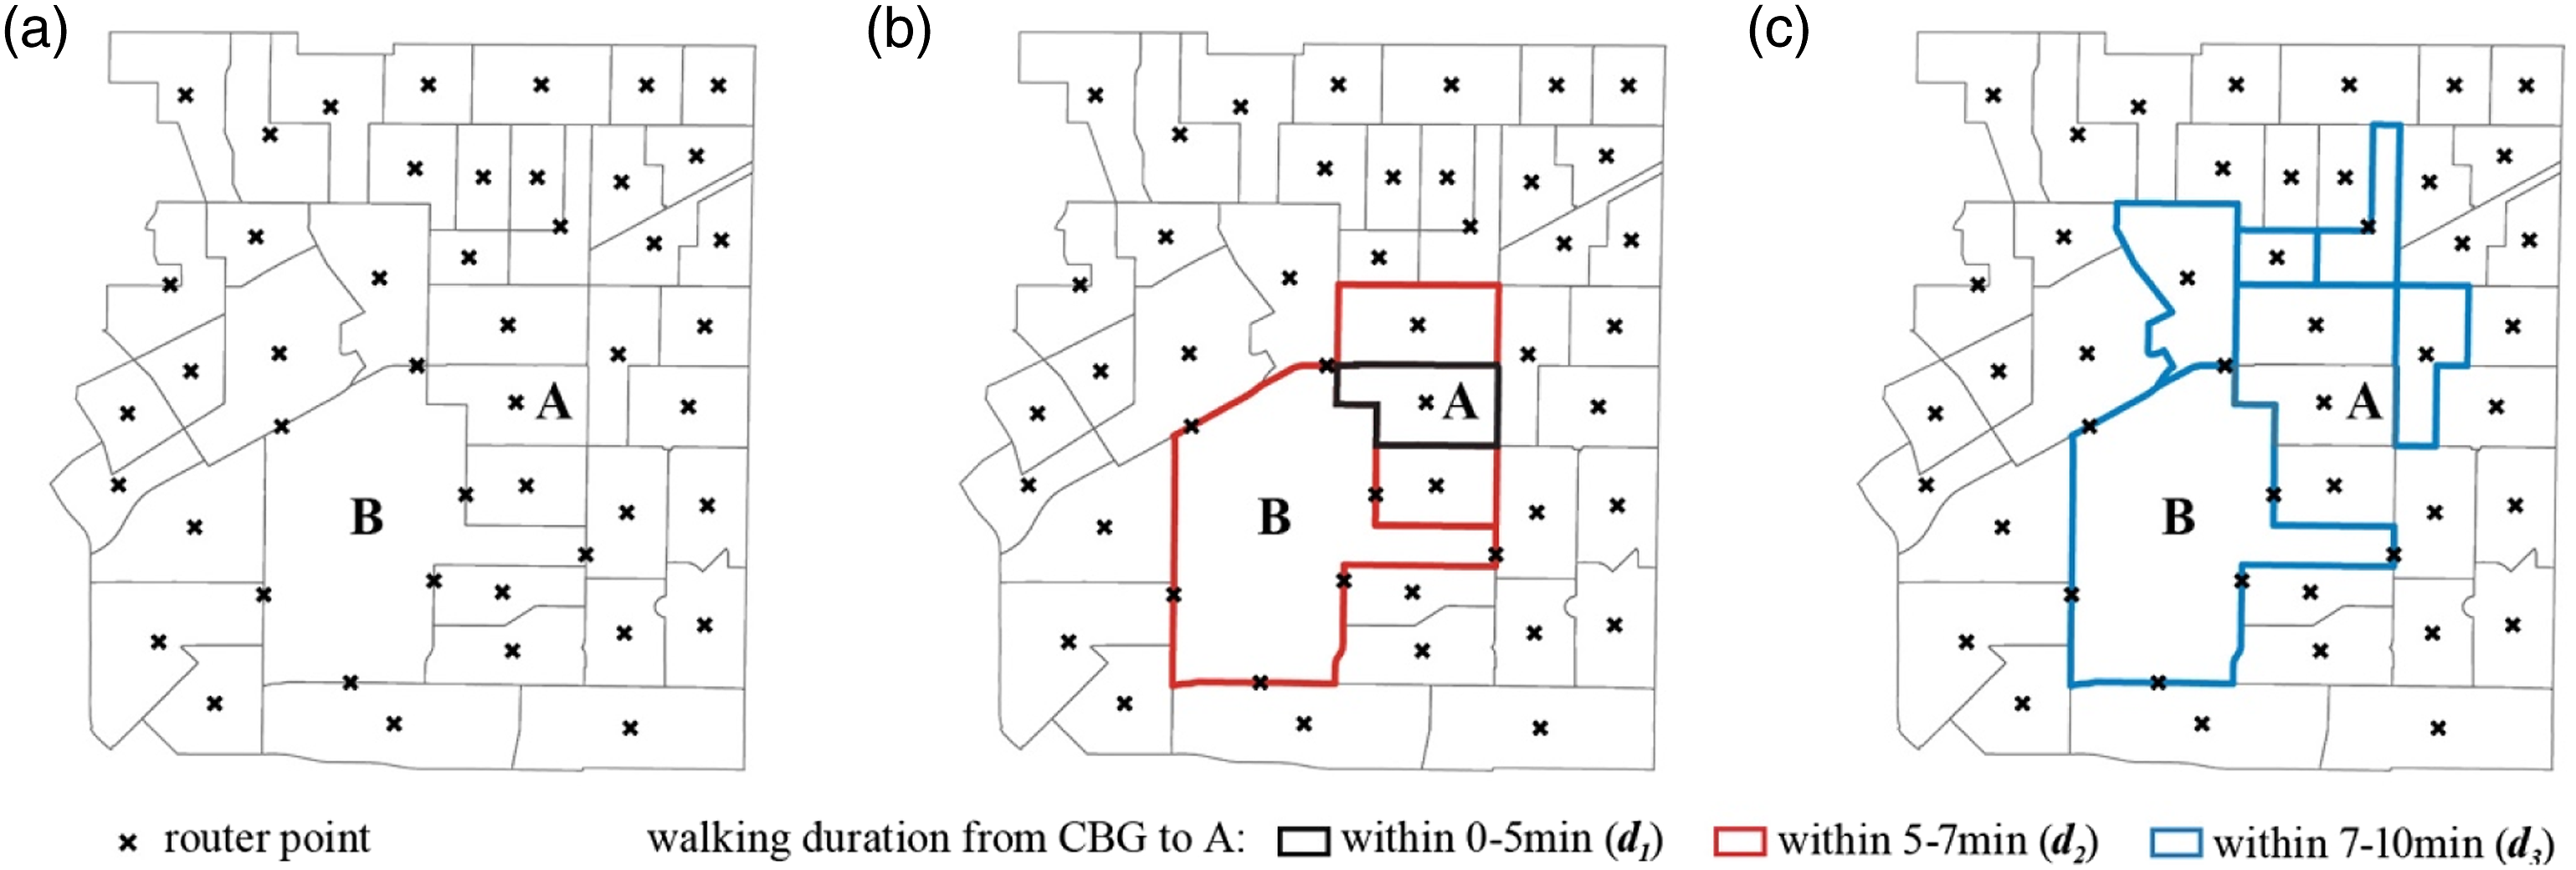
We develop a custom program written in C# for deriving ACC features for any given location across the U.S. The mode-specific routing process is conducted using Itinero (Itinero, 2019), an open-source routing package based on the. NET framework. The walking, biking, and vehicle trips are routed based on the street network, sourced from OpenStreetMap (OpenStreetMap, 2017), with pre-defined mode-specific travel speeds. The transit routing is based on a separate transit network including lines and stops of subways and buses sourced from TransitFeeds (TransitFeeds, 2015). The transit routing allows switching between different lines and accounts for the walking time towards, from, and between different stops.
Modeling and analysis methodology
Mode-duration choice model
For any given trip with travel features and built environment features, a choice model is trained to predict its mode-duration choice probabilities denoted as MD in equation (2)
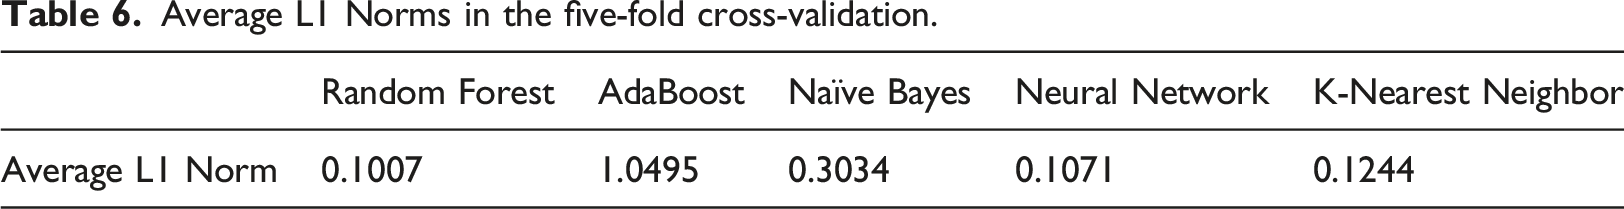
For training, each numerical feature is scaled into the range of zero to one, and each categorical feature is one-hot encoded (i.e., encoded into multiple zero-one features regarding all discretized levels). This process yields 141 final predictor features for the choice model. The classification model is trained through a five-fold cross-validation process during which the dataset is split into a different set of 80% training and 20% testing in each of the five iterations. The aggregate-level goodness-of-fit is measured by L1 Norm as defined in equation (3)
Analysis metrics
With the individual-level MD per trip predicted by the choice model, the aggregate CBG-level MD per trip, denoted as 
Two aggregate-level mobility metrics can be derived. The first metric is the aggregate mode percentage (i.e., modal split, 
The second metric is the estimated duration per trip by mode m, denoted as 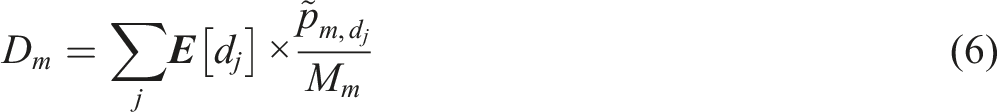
Sensitivity analysis
Feature combinations for sensitivity analysis.
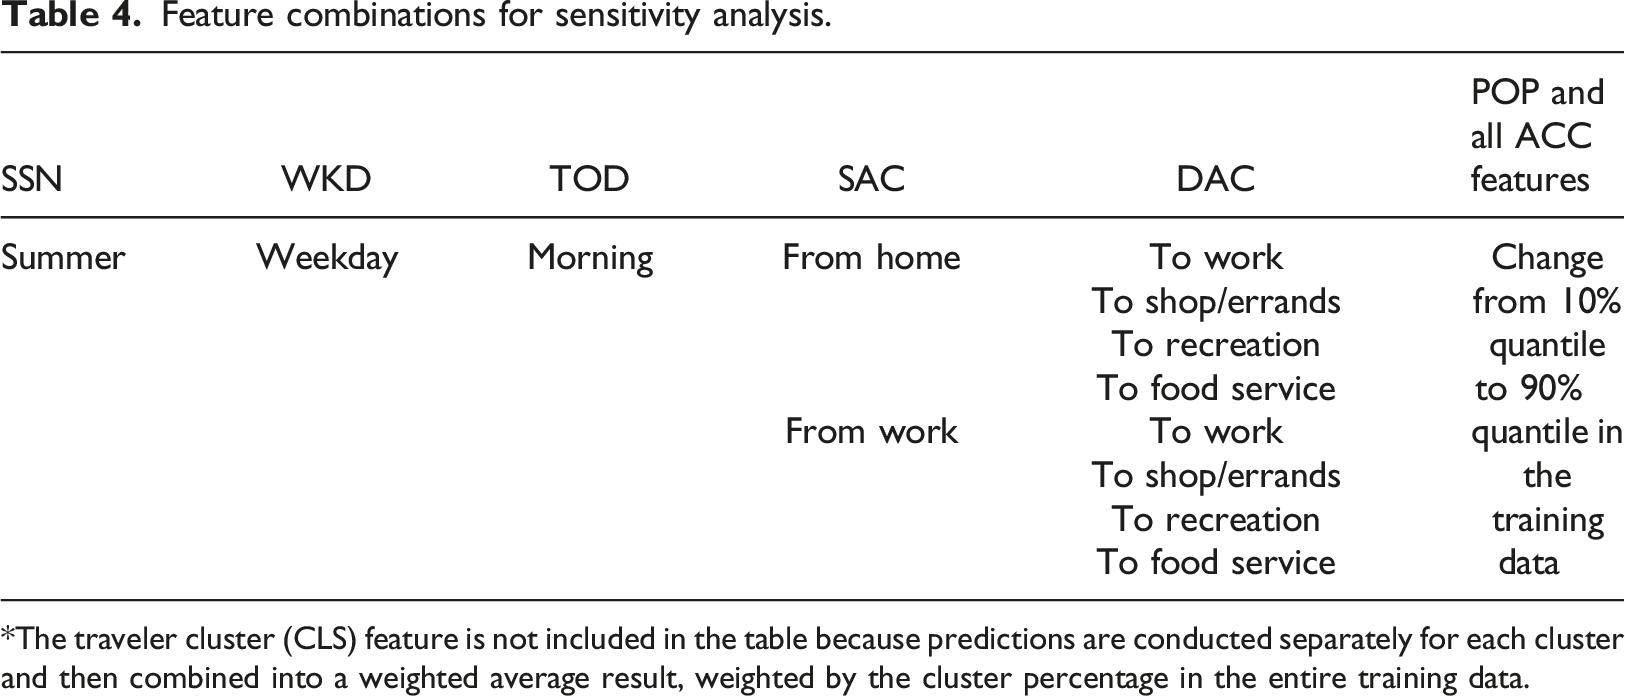
*The traveler cluster (CLS) feature is not included in the table because predictions are conducted separately for each cluster and then combined into a weighted average result, weighted by the cluster percentage in the entire training data.
Case study
A case study is conducted in LA City to show how the model can help answer what-if questions about built environment scenarios. We first evaluate the current mobility environment using the metrics of The spatial context of the LA City. (a) Different levels of geographic boundaries, with the densified neighborhood highlighted in red. (b) Existing transit network, with the added rail line highlighted in red.
Description of hypothetical scenarios in the case study.
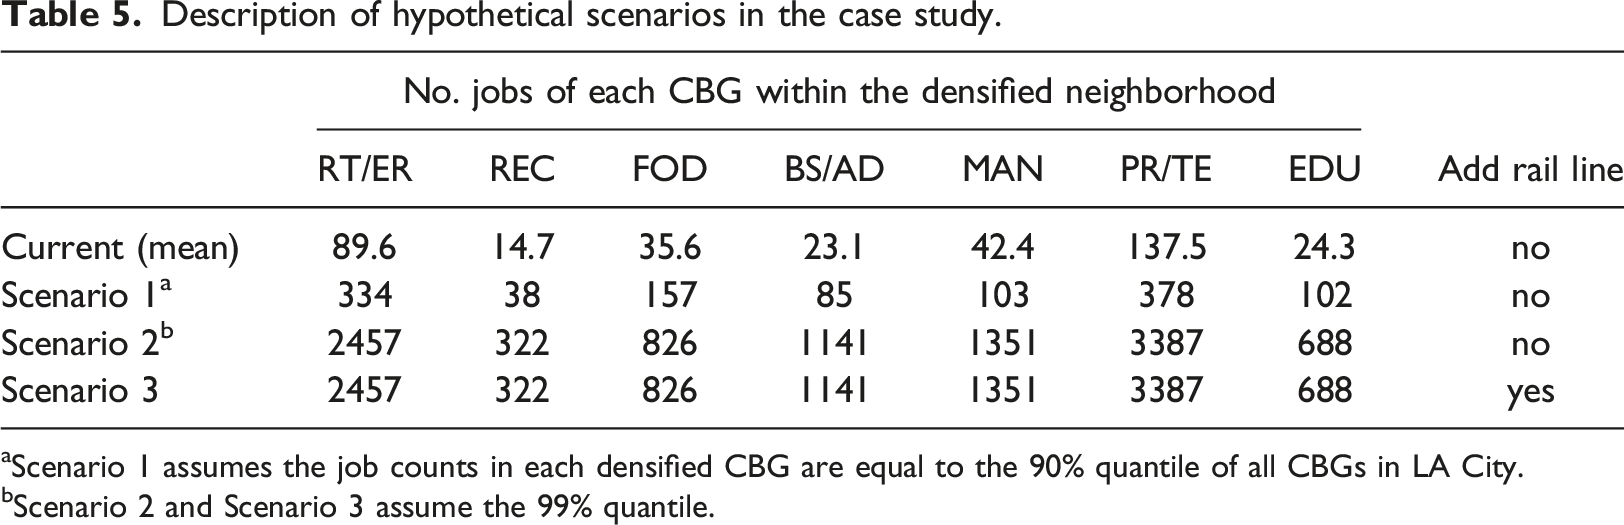
aScenario 1 assumes the job counts in each densified CBG are equal to the 90% quantile of all CBGs in LA City.
bScenario 2 and Scenario 3 assume the 99% quantile.
Result
Choice model training result
Average L1 Norms in the five-fold cross-validation.
The feature importance rank of the Random Forest classifier is used to reveal the most important features that determine the mode-duration choice of a trip. Figure 3 shows the top quarter of the features. The activity type of shop/errands (SAC_4 and DAC_4) and work (SAC_2 and DAC_2) are among the highest-ranking features. Meanwhile, none of the time features (i.e., season, weekday, time of day) enters the top-ranking list. A possible explanation is that the activity features may already have a notion of time embedded, which impairs the significance level of the time features. For instance, trips from home to work may happen mostly in the morning and on weekdays.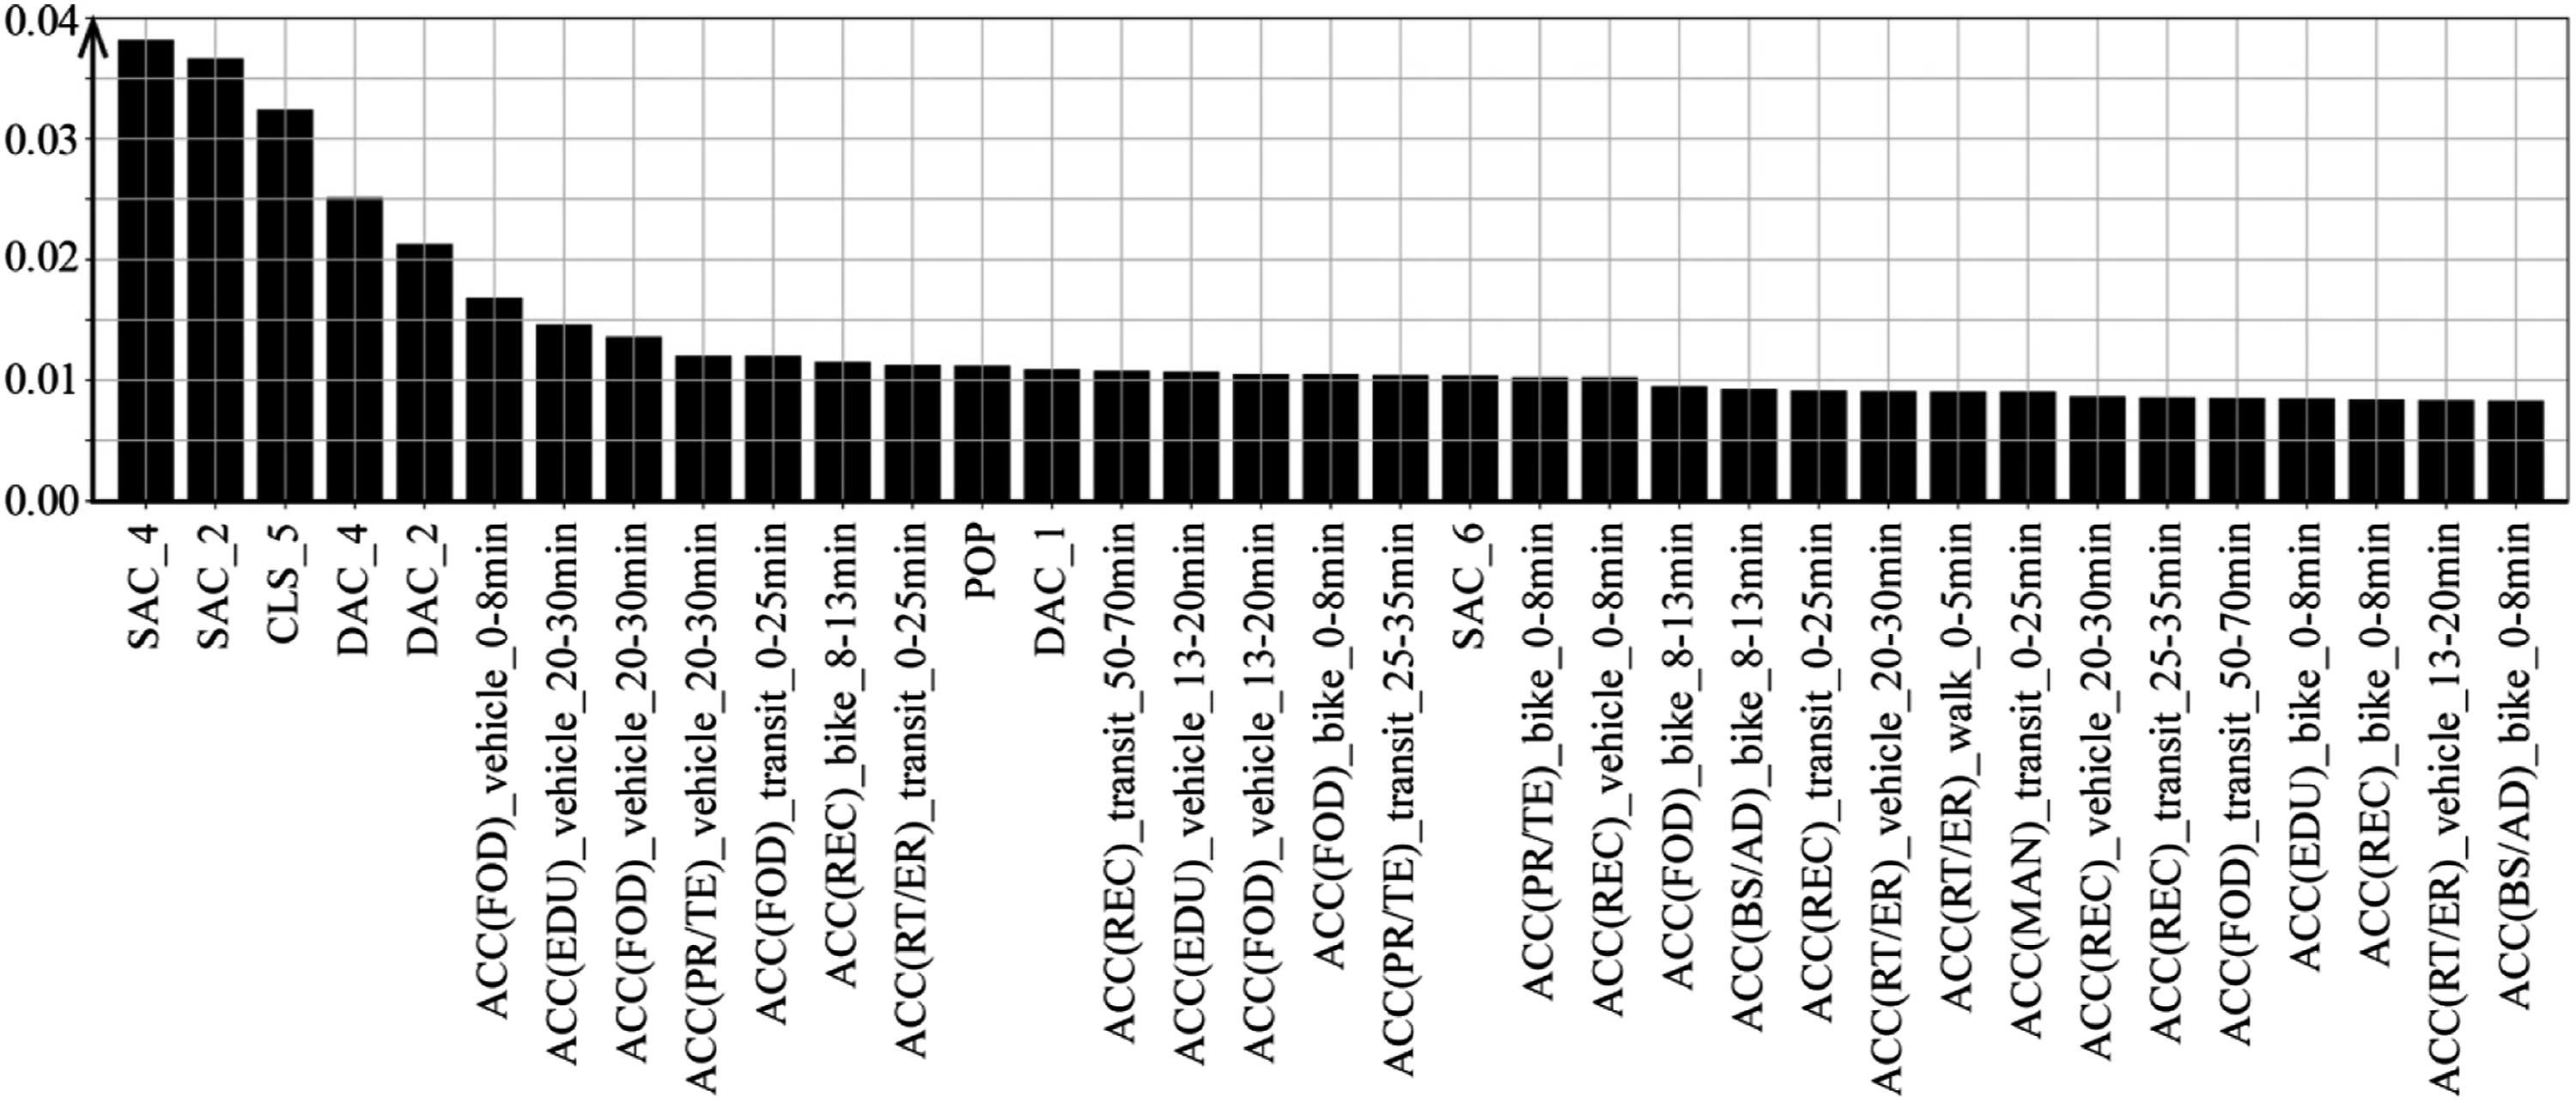
Within the ACC features, we find that the accessibilities for vehicle and transit duration levels are overall more impactful than the ones measured by walking duration levels. The most impactful ACC feature is the food service job density within 0 to 8 vehicle driving distance (ACC(FOOD)_vehicle_0-8min). This provides evidence that only using a walkable distance as the buffer zone for deriving built environment variables, as in most previous studies, may not be sufficient for modeling multi-modal choices.
Sensitivity analysis result
The predicted MD based on all feature combinations in the sensitivity analysis are presented through graphs in Figure 4. The line graphs display how the modal split ( Sensitivity analysis result. (a) (c) (e) (g) (i) (k) (m) (p) are line graphs showing how modal split (y-axis) changes as the POP and ACC (x-axis) increase. (b) (d) (f) (h) (j) (l) (n) (q) are stacked bar charts showing the duration distributions regarding the minimum and the maximum POP and ACC.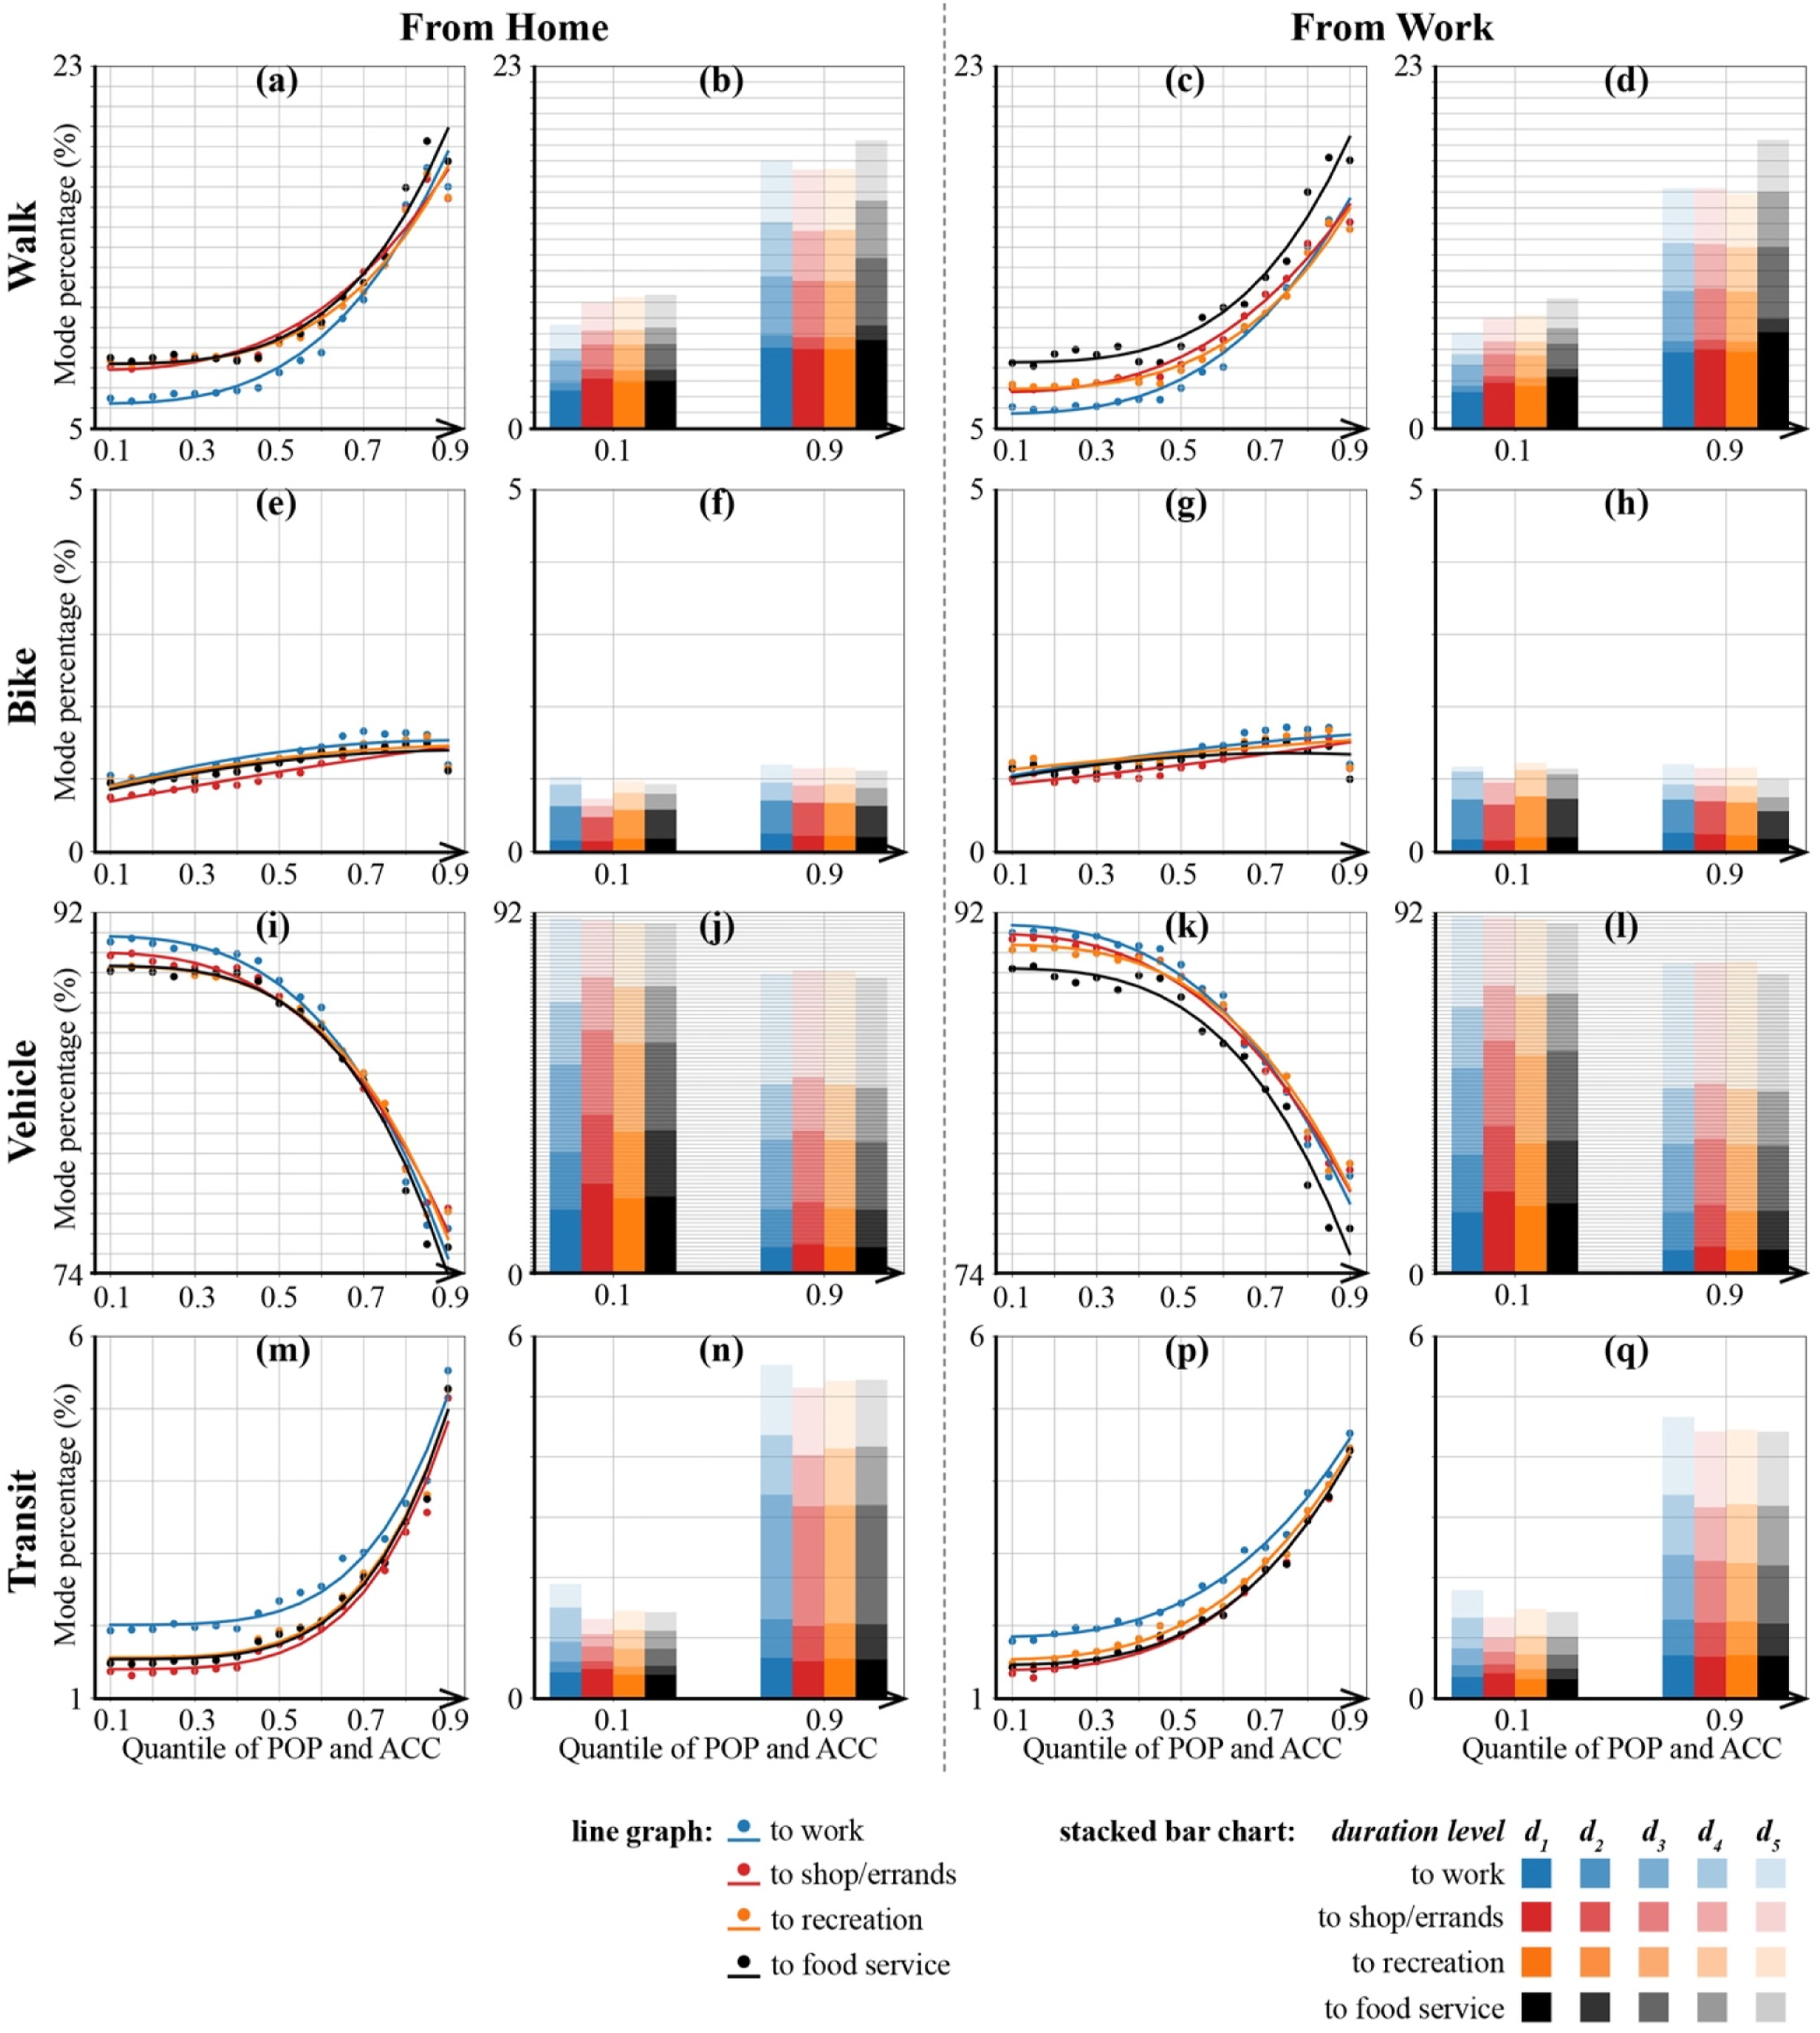
Based on the line graphs, the mode percentages do not change significantly until the POP and ACC features reach around 50% quantile of the data. The non-linear shape of the fitted curve is partially due to the non-linear increase on the x-axis (i.e., the quantiles of the POP and ACC do not increase linearly). But it also reveals that the built environment does not have a significant impact on mobility until it reaches a certain density (the quantile values of POP and ACC on the x-axis are specified in Supplementary Table S1 in the Supplementary Material). Another finding is that the magnitude of changes in modal split varies by mode. For example, the increase in the biking mode is noticeably slower and smaller than other modes.
An interesting finding based on the stacked bar chart is about the vehicle trip duration distribution (j) (l). Although most of the short-duration vehicle trips are replaced by alternative modes, the long-duration vehicle trips (e.g., trips of d 5 ) show an opposite trend which is increasing when the environment is densified. This is potentially due to the impacts of the congestion. In other words, it is likely that the same distance or even shorter trips by vehicle can take more time in dense urban areas with congestion, leading to an increased probability of long-duration driving trips.
Case study result
Figure 5 shows the results of mode percentages Results of mode percentages 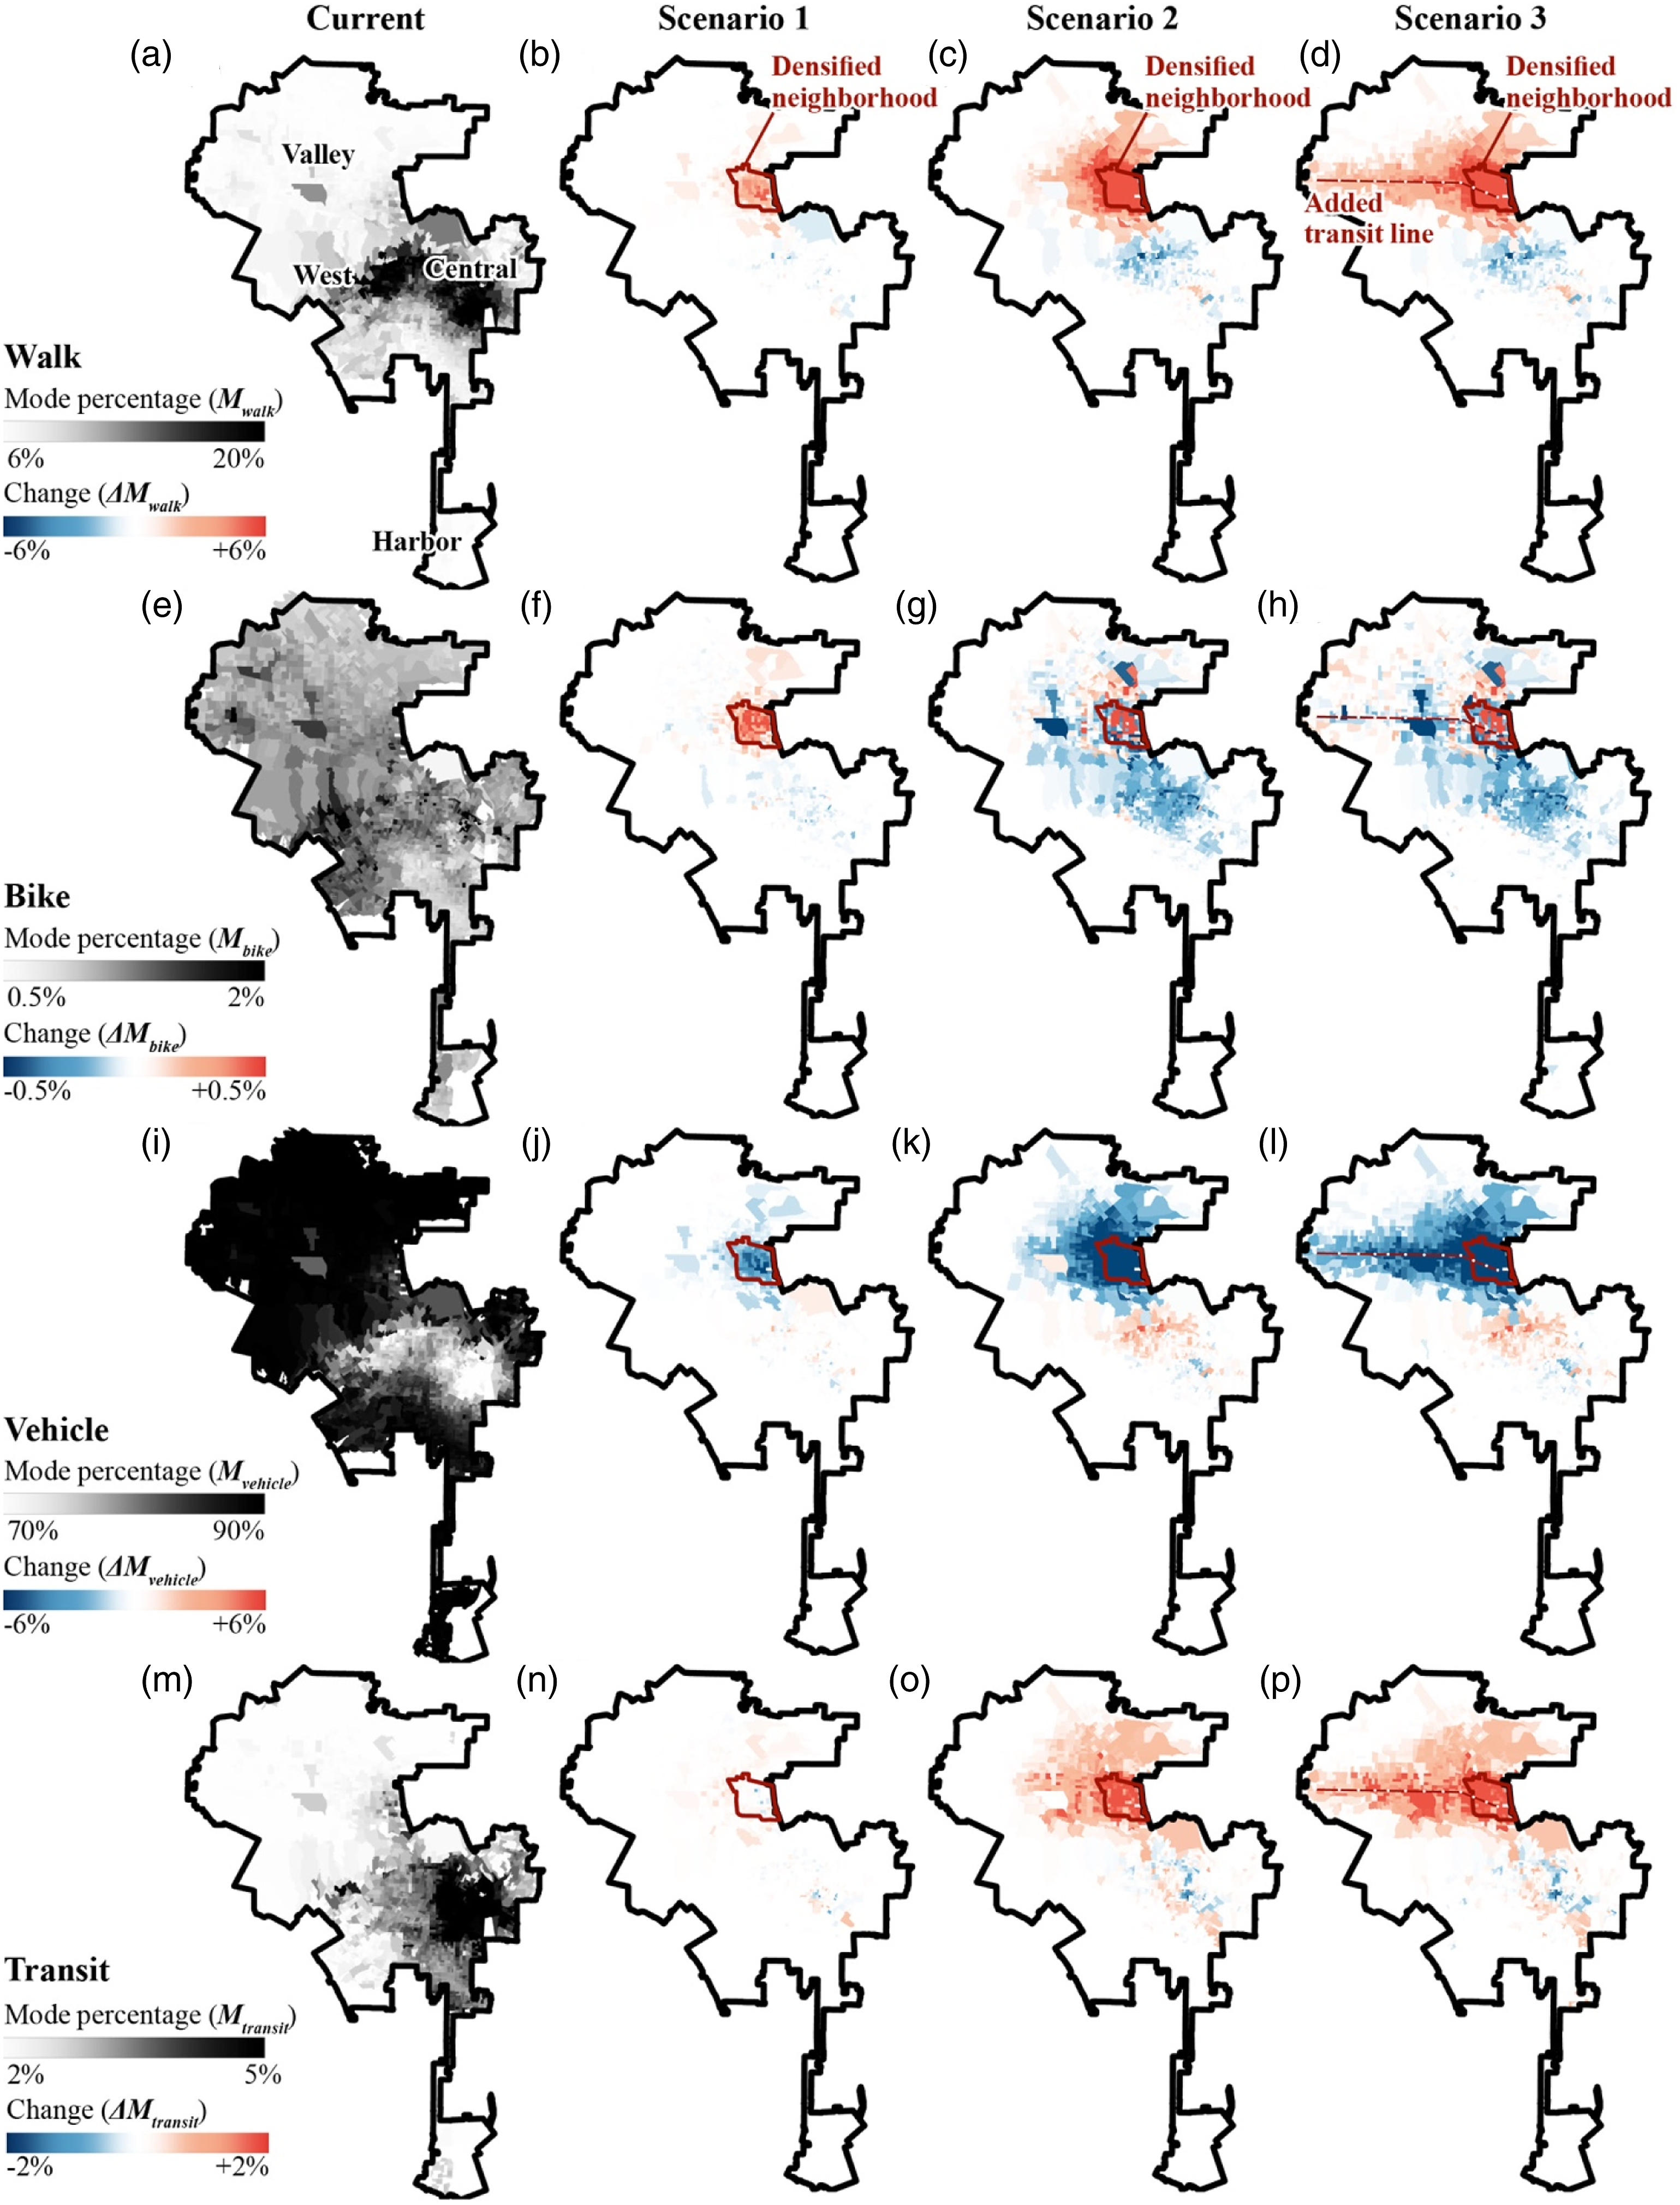
In the three scenarios, areas around the densified neighborhood in the Valley show different levels of decreased vehicle mode percentage and increased use of non-vehicle modes. An unexpected finding is the opposite changes in the Central region, such as decreased
Figure 6 shows the results of Results of duration per trip 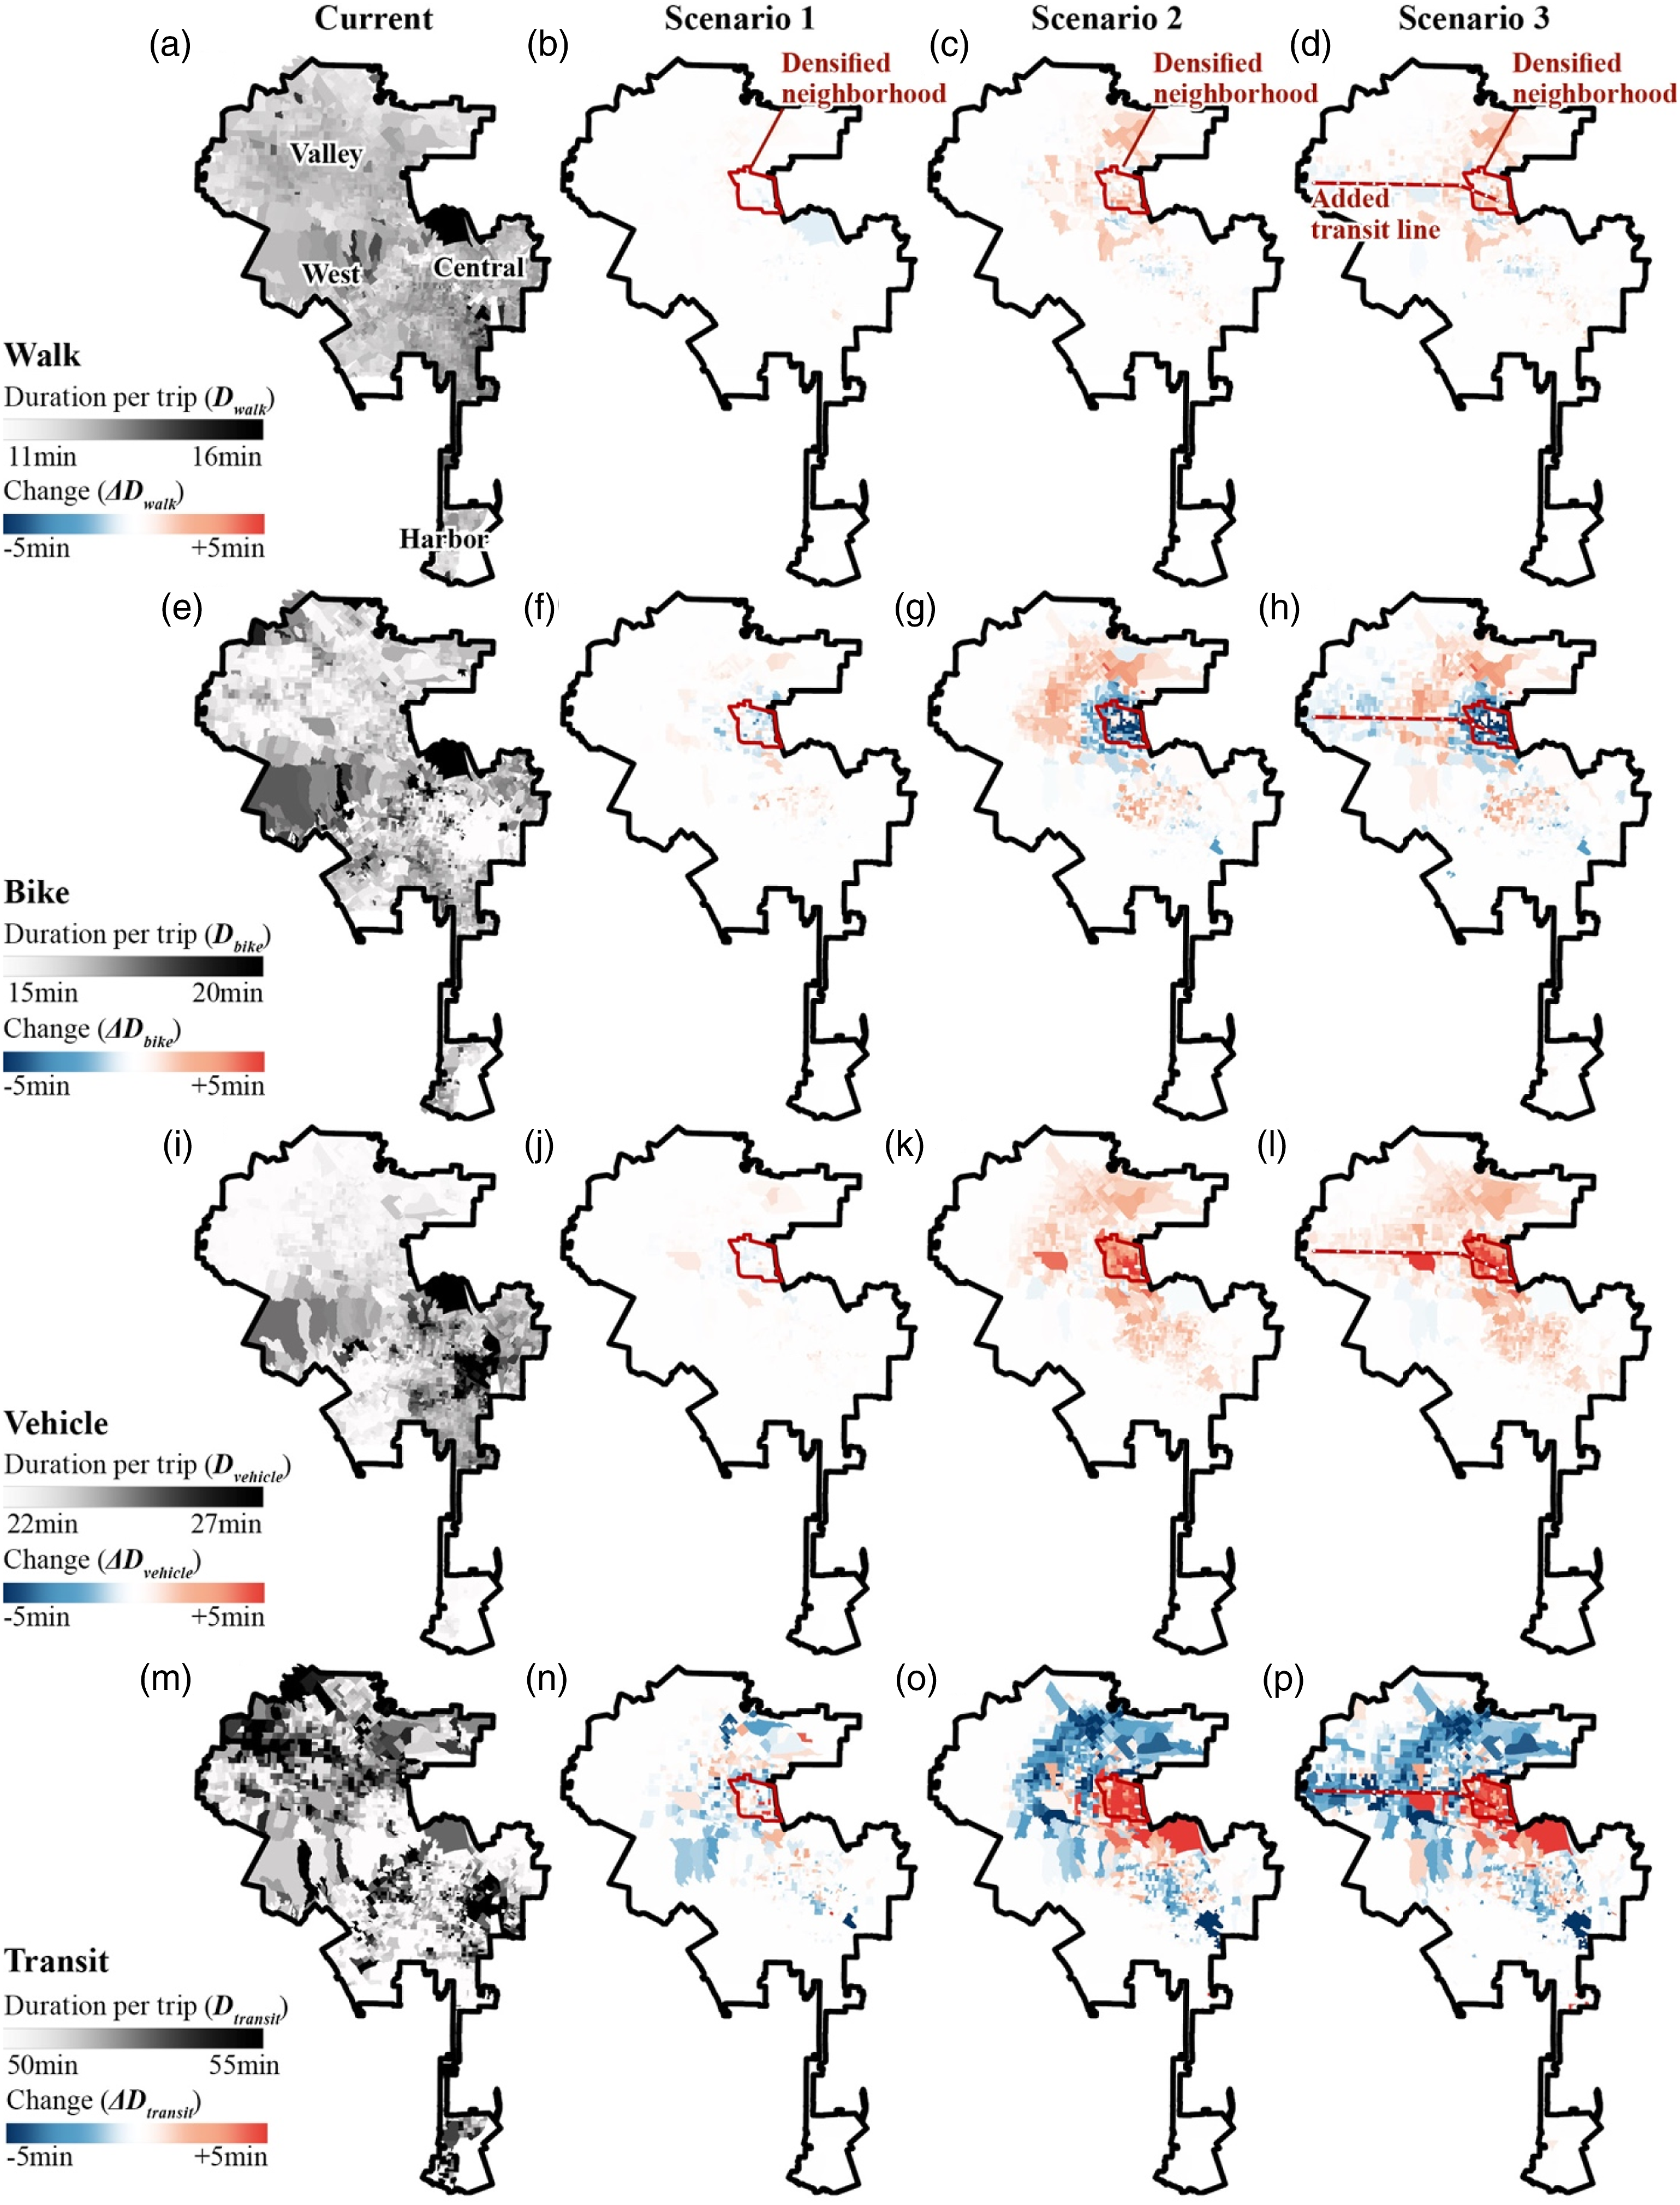
Mean and maximum

Discussion
This paper introduces a data-driven joint choice model of travel mode and duration for quantifying the mobility impacts of changes in the built environment. We introduce a novel set of ACC features that are comprehensive yet straightforward to use in parametrizing the density distribution of urban services on different scales of the transportation network. Various types of urban design interventions can be easily converted into changes in ACC features. For example, network changes such as adding new transit lines can increase the ACC of transit in nearby neighborhoods. Program allocations such as new commercial districts can lead to changes in ACC of retail, shopping, and food services in nearby neighborhoods. Further, the ACC features allow the model to capture the mobility impacts not only within walkable distances but also in distant areas. This leads to some interesting findings in the case study which proves that the mobility impacts of certain built environment scenarios may cover a rather wide spatial range.
Another contribution of our method is to model the travel mode-duration as a joint choice and solve it using a machine learning classifier. This approach significantly simplifies the predictive architecture and brings ease in evaluating more integrated mobility metrics. Not only the modal split can be directly computed from the choice probabilities but also the travel duration by mode can be properly approximated by taking expectations for each duration level. The latter metric is challenging to compute and requires more complex simulation approaches. Previous studies about the joint choice models have only analyzed mode-distance choices with coarse discretized levels (Ding et al., 2014; Vega and Reynolds-Feighan, 2009), none of which used learning-based models. Trip distance in the travel survey data is usually post-processed based on the shortest path between the origin and the destination regardless of travel mode. Therefore, the duration can be a more reliable measurement of trip length, especially for modes like public transit that are prone to significant deviations from the shortest path.
Through a sensitivity analysis and a proof-of-concept case study, we find that a dense, mixed-use environment with good coverage of the multi-modal mobility network can significantly promote active transportation and public transit use. However, we also find that an ultra-dense centralized development could lead to increased travel time and increased vehicle use in some surrounding areas. These results and findings facilitate a deeper understanding of the accessibility-oriented development (Aston and Levinson, 2021) and the importance of the mixed-use neighborhood. Our model rewards a higher level of accessibility to different urban services and employment opportunities. Contrarily, neither increasing the POP feature alone nor increasing the ACC features of any single industry could notably change the prediction outcome. Our model also captures that urban density is a complex factor that comes with both benefits and trade-offs in mobility performance. Numerous researchers (Ewing and Cervero, 2010; Yang et al., 2021) have linked urban density with travel behavior and sustainable mobility. Recent planning strategies, such as “15-Minute City,” advocate for a well-distributed “optimal density” that allows for a sustainable and smart growth (Moreno et al., 2021). However, hardly any existing research has offered an approach to quantitatively define, measure, and analyze the “optimal density.” The two distinctively defined metrics in this paper,
Our approach is limited by the potential urban mobility factors that are not captured by the POP and ACC features, such as microclimate, green space, and transit schedules. These factors can be transformed into new features and added to the training data. They can also be factored into the existing ACC features. For example, parks and green spaces can be used to adjust the number of jobs in the recreational category (REC) to better capture leisure activity densities. Our study is also limited by the survey region, precision level, frequency, and timing of the NHTS data. The trained choice model is only valid for the surveyed region (e.g., LA City in this paper). The spatial resolution of the analysis (e.g., CBG) is constrained by the precision level of the reported trip locations. The potential behavioral changes in the population, such as declined transit ridership caused by the COVID-19 pandemic (Liu et al., 2020), can only be captured and analyzed if new survey data is collected every few years. However, the NHTS data are the only data that provides comprehensive daily travel data nationwide and therefore is a good data source that allows others to reproduce models for their regions of interest. Other popular data sources, including passively generated travel data from GPS or social media, can, in theory, be used to replace or augment the NHTS but these datasets often fall short of collecting crucial information such as socio-demographics, activity, and mode.
Conclusion
We propose a joint choice model of travel mode-duration for quantifying the impacts of the built environment on mobility. The model is formulated as a Random Forest classifier using a novel set of ACC features as predictor features. Our approach is mainly characterized by its simple architecture and generalizability. The data-driven nature allows the method to be deployable to any city around the globe provided that the local data is available for deriving the training data. The analysis metrics facilitate a fast and effective mobility assessment of built environment scenarios from different perspectives regarding aggregate model split and average travel durations. Overall, the results and method in this paper can benefit a better understanding and execution of mobility-aware urban design and planning, which can potentially lead to substantial economic, environmental, and societal gains.
Supplemental Material
Supplemental Material - Assessing impacts of the built environment on mobility: A joint choice model of travel mode and duration
Supplemental Material for Assessing impacts of the built environment on mobility: A joint choice model of travel mode and duration by Yang Yang, Samitha Samaranayake and Timur Dogan in Environment and Planning B: Urban Analytics and City Science
Footnotes
Acknowledgements
We thank the California Department of Transportation (Caltrans) for providing geocoded NHTS travel survey data.
Declaration of conflicting interests
The author(s) declared no potential conflicts of interest with respect to the research, authorship, and/or publication of this article.
Funding
The author(s) disclosed receipt of the following financial support for the research, authorship, and/or publication of this article: This work was supported by The Center for Transportation, Environment, and Community Health (CTECH) and Federal Government CFDA #: 20.701 (69A3551747119).
Supplemental Material
Supplemental material for this article is available online.
References
Supplementary Material
Please find the following supplemental material available below.
For Open Access articles published under a Creative Commons License, all supplemental material carries the same license as the article it is associated with.
For non-Open Access articles published, all supplemental material carries a non-exclusive license, and permission requests for re-use of supplemental material or any part of supplemental material shall be sent directly to the copyright owner as specified in the copyright notice associated with the article.