
Abstract
Flood mitigation governance is critical for coastal regions where flooding has caused considerable damage. Raising the First-Floor Elevation (FFE) above the base flood elevation (BFE) is an effective mitigation measure for buildings with a high risk of flooding. In the U.S., measuring FFE is necessary to obtain an Elevation Certificate (E.C.) for the National Flood Insurance Program (NFIP) and has traditionally required labor-consuming field surveys. However, the advances in computer vision technology have facilitated the handling of large image datasets, leading to new FFE measurement approaches. Taking Galveston Island (including the cities of Galveston and Jamaica Beach) in Coastal Texas as a case study, we explore how these new approaches may inform flood risk management and governance, including how FFE estimates may be combined with BFE estimates from flood inundation probability mapping to model the predicted cost of raising buildings’ FFE above their BFE. After establishing the FFE model’s accuracy by comparing its results with previously validated FFE estimates in three districts of Galveston, we generalize the workflow to building footprints across Galveston Island. By combining the FFE data derived from our workflow with multidimensional building information, we further analyze the future flood control and post-disaster maintenance strategies. Our findings present valuable data collection paradigms and methodological concepts that inform flood governance for Galveston Island. The proposed workflow can be extended to flood management and research for other vulnerable coastal communities.
Introduction
As one of the most common disasters, flooding has posed significant challenges to urban sustainability (Aerts et al., 2013; Aerts, 2018). Taking effective measures to reduce flood-induced economic losses and human casualties has been the focus of urban flood mitigation research (Ye et al., 2021). Hurricane Harvey made landfall in Texas and Louisiana in August 2017, triggering devastating floods and killing more than 100 people (Sebastian et al., 2017). In the wake of this horrible tragedy, various agencies in Texas have made efforts to protect Galveston and the Greater Houston Area against future natural disasters and flooding (CTBS, 2021; Texas-GLO, 2021). First-Floor Elevation (FFE), as a required measurement of the Elevation Certificate (E.C.) used for the National Flood Insurance Program (NFIP), is a crucial indicator for identifying and prioritizing structures and larger areas for mitigation funding allocation, which is essential to minimize flood-related damages and fatalities. For instance, analyzing the distribution of FFEs can be used to evaluate whether a residence is more likely to be flooded. For coastal hazard management, FFE mapping can also be used to monitor the risk of flooding due to rain events or storm surges.
The FFE is frequently used to identify properties for which raising the existing FFE may be a viable flood mitigation strategy. Elevating the FFE of existing houses above the base flood elevation (BFE, the height of surface water caused by a flood with a 1% risk of reaching or exceeding that level in any given year) is recognized as a popular solution for flood protection at the building scale (FEMA, 2010, 2021; Taghinezhad et al., 2021). Despite its efficiency, house elevation is a highly specialized construction technique. Accurate house elevation cost guidance requires consideration of complex combinations of many real-world factors, such as housing material and the required elevation of the houses’ FFE above BFE. While gathering data measuring these factors is necessary to inform large-scale disaster prevention and management, it is time-consuming and expensive to monitor and update such data. This is especially true when determining the ideal elevating height, which derives from FFE and BFE and traditionally requires much manual work to calculate accurately. There is, therefore, an urgent and unmet need to generate a more efficient workflow for censusing FFEs and analyzing the cost of raising the FFE above BFE for each house in a large area without requiring manual field observations. In this case study, we employ deep learning and computer vision techniques to meet this need and discuss their implications for coastal flood mitigation governance.
The rapid advancement of computer vision technology has substantially aided the processing of large image datasets. Such capabilities hold significant promise, especially in monitoring and evaluating building infrastructure. Street view imagery (SVI) has been widely employed to examine urban physical settings. Traditional FFE estimation largely relies on time-consuming and labor-intensive field surveys; FFE estimated by SVIs and computer vision technologies shows high efficiency and can be applied to large areas (Ning et al., 2021). Our research aims to explore flood risk mitigation governance without field surveys. Specifically, we map the estimated FFEs over BFEs and analyze the cost of raising the FFE above BFE for houses in a large experimental area. The necessary data in the cost estimation model are derived from building footprints through deep learning combined with computer vision technology. As the most important factor in the study, FFE is obtained from Google Street View (GSV) and a digital elevation model (DEM), following the principles of tacheometric surveying based on Ning et al. (2021)’s model.
Taking Galveston Island (including the cities of Galveston and Jamaica Beach) as a case study, we propose an automatic framework that draws upon advanced deep learning and computer vision algorithms. We estimate the target building’s FFE via GSV and the corresponding cost to raise the building’s FFE above BFE. FFE measurement in our framework functions reliably and is an advance over prior efforts (e.g., Ning et al., 2021), including better door shape recognition and better FFE estimation in complex settings (achieved by extending the training dataset). Our workflow is resource-effective, straightforward, and time-efficient due to the absence of labor-intensive work compared to methods based on Google Maps and SVI (Needham and McIntyre, 2018) or machine learning models (Gordon & McFarlane, 2019).
Related works
SVI applications in urban environments
SVI has swiftly risen to prominence as a valuable source of geospatial information, allowing for the extraction of insights and the support of informed decisions. The proliferation of large-scale photography service providers, increased computational resource availability, and advances in deep learning have all contributed to an explosion of interest in using SVI for geospatial decision support and modeling.
There are multiple SVI service providers, including GSV, Mapillary.com, Baidu Map, Tencent Map, and Bing Map, among others. Developed by Google Inc., GSV enables users to obtain a 360-degree panoramic view of a location from the perspective of a car driving down the street and has been widely used for research and further understanding of the urban environment (Nesse and Airt, 2017). Observations based on GSV are similar to personal observations, albeit with a degree of closeness that varies depending on the specific surroundings and types of features detected. As a result, GSV-based observations offer scholars in urban data science a new way to better comprehend urban surroundings.
Numerous existing GSV-based urban studies have concentrated on identifying land use and land cover characteristics, such as income and gentrification (Hwang and Sampson, 2014; Bentley et al., 2016; Glaeser et al., 2018) and physical activity (Adu-Brimpong et al., 2017). It is worth mentioning that a great part of the current research related to GSV is combined with deep learning. For example, Ringland et al. (2019) characterized food production along roadways using GSV with a pre-trained model built by a convolutional neural network (CNN). Similarly, Gebru et al. (2017) examined socioeconomic features in 200 American cities using GSV through a CNN model.
Additionally, efforts have been made to connect land use characteristics to navigation (Baltaretu et al., 2015), automobile use (Guo, 2013), and population size (Gordon et al., 2013). Certain efforts have been made to classify or rate places according to their land use characteristics (Ball, 2014; USACE, 2015; Wheeler, 2015). GSV can also be used to rebuild three-dimensional views (Pittam et al., 2016). Additionally, the use of GSV to document street features associated with automobile, bicycle, and pedestrian mobility is becoming more prevalent. The number of lanes, the existence of speed bumps, the quality of the driving surface, and the presence of a parking lane are all considered auto-related qualities (Bader et al., 2017). GSV can also be used to determine pedestrian-related parameters such as the existence or absence of a sidewalk, its width and surface quality, as well as the presence of crosswalks and pedestrian signals (Adu-Brimpong et al., 2017; Ning et al., 2022).
In the GSV application most closely related to our work, Needham and McIntyre (2018) quantified the FFE directly using GSV and satellite imagery provided by Google Earth. They manually measured the length of a roof edge in the façade in meters for each building using Google Earth’s overhead images, then measured the same roof edge in pixels on GSV to establish the conversion formula from pixels to meters, and finally calculated the FFE value from those parameters.
FFE applications in flood mitigation governance
FFE, denoting the lowest enclosed living space in a building that is not part of the building’s access, parking, or storage areas (FEMA, 2010), is essential for the E.C. that has been required by NFIP, which supports insurance agents in evaluating flood insurance policies, as well as Federal Emergency Management Agency (FEMA) and local governments in complying with floodplain management rules. When flooding occurs, the FFE determines the minimum level that flooding must reach before it can inundate a building’s lowest living floor and cause property damage. Consequently, the premium for flood insurance on buildings is calculated using well-documented FFE data (FEMA, 2021). Under FEMA rules, effective prior to 1 April 2022, registration with the NFIP required an E.C. to be completed by a professional surveyor in the field. Subsequent to that date, FEMA has implemented “Risk Rating 2.0: Equity in Action,” under which an E.C. is no longer required to register for NFIP but may be used by a homeowner to more precisely evaluate their risk (potentially lowering insurance costs); E.C.s are still needed to meet floodplain management building requirements related to eligibility for Community Rating System discounts.
To circumvent the time-consuming and labor-intensive field surveys, scholars have attempted to develop scalable methods for determining FFE. For instance, Ashley and McFarlane (2019) applied multivariate regressions to calculate FFE considering many available building characteristics. However, large-scale, accurate FFE identification remains a challenging task, thus demanding the design of approaches with high automation.
In flood mitigation governance, raising the FFE over the BFE has become one of the most common flood protection strategies for existing residential buildings (Bellomo et al., 1999; FEMA, 2010; Taghinezhad et al., 2021). As FEMA (1998a) stated, raising a house to a required or desirable Flood Protection Elevation (FPE) is one of the most popular retrofit solutions available. In the event that a house is sufficiently elevated, the living space is elevated above all but the most severe floods (such as the 500-years flood) (EHMofTexas, 2021). A typical example would be raising the home and creating a new or expanded foundation beneath it, as opposed to retaining the house in its current location and adding a new higher ground floor. Regarding this particular technique, the FPE is typically established by local ordinances as being in line with or slightly above the BFE. According to the Galveston Flood Damage Prevention Ordinance (Williams, 2018), all new home construction and major renovations must have the FFE elevated or floodproofed to at least 18 inches above the BFE. In light of the critical nature of a building’s FFE in determining an appropriate FPE (whether during initial construction or subsequent elevation) and the labor-intensive nature of traditional survey methods for measuring FFE, the primary aim of our work is to develop solutions that combine cutting-edge computer vision technology and deep learning to measure FFE more efficiently.
Methodology
This section describes the proposed workflow to perform FFE estimation and building-scale cost estimation for elevating residential houses at risk of flooding using the latest deep learning-based computer vision technology, which is an advancement over previous efforts (Ning et al., 2021). Using Galveston as a case study, we explore GSV’s vertical dimension to aid in assessing building FFE, an essential factor in flood mitigation governance. Different from traditional field surveys that rely on manual measurements, our measurement from SVI based on computer vision technology is capable of processing enormous amounts of data. Contributing to the generalizability of our research, the initial data for the proposed workflow can be derived either from the building footprints or a single list of addresses of the target area; for instance, the dataset Galveston_FFEData2020 (Diaz et al., 2022), which is used for accuracy validation in this research, identifies unique houses using only street addresses.
To obtain and process target houses’ SVIs, the corresponding altitudes, azimuths, and angles of the field of view (FoV) should be recorded for further door detection and localization. Our proposed workflow to estimate the FFE for individual houses and perform building-scale elevation cost estimation contains the following steps (Figure 1): 1. Obtain the latitude and longitude as input from initial data, which is derived from building footprints or the API provided by Google Map Platform (Geocoding API) based on the known addresses. 2. Collect GSV images of the target area. 3. Determine the camera height from the downloaded depthmaps of each house. 4. Obtain the DEM dataset of the target area. 5. Obtain the BFE dataset of the target area. 6. Add training samples derived from GSVs obtained from the region of the case study to enrich the diversity of the dataset and retrain the model. 7. Detect and determine the location of doors in GSV using a trained object detection model based on YOLO-v5. 8. Calculate the vertical coordinates. Calculate the vertical coordinate of the door bottom to the camera center using its height and apex in the panorama. 9. Calculate FFE. Calculate the FFE based on the predefined general door height and the door bottom elevation, which is obtained according to its vertical coordinate, the extracted roadway elevation, and the height from the camera to the roadway. 10.Determine the desired FFE target to which the house should be raised by mapping FFE results over the obtained BFEs. 11. Estimate the elevation cost. Perform building-scale elevation cost estimation for each residential building. The pipeline of the proposed workflow.

Data collection and preprocessing
Obtaining latitude and longitude from the initial data
The workflow for creating the dataset starts with the collection of the latitude and longitude of each building in the target area. This coordinate information can be obtained directly from building footprints, which are derived from the 2018 LiDAR dataset acquired by Houston-Galveston Area Council, Texas Natural Resources Information System, and United States Geological Survey (USGS) in our case study (Hansen, 2007; Houston-Galveston Area Council, 2018). This LiDAR dataset is also the basis for reconstructing 3D urban models, which allows for better visualization of results in the quality assessment stage. Alternatively, if only the address name is included in the initial data, the coordinate information can also be obtained based on the known address name using the API provided by Google Map Platform (Geocoding API).
Collecting GSV images of the target area
Along with the location and travel direction of the GSV mapping vehicle, GSV photographs are retrieved from the Google Maps Platform utilizing the pre-set program through the Street View Static API. Upon receiving latitude and longitude coordinates specified by the user, the service provided by GSV from Google Maps looks for images within a 50-m radius and returns panoramic photographs recorded by GSV mapping cars. For our case study in Coastal Texas, we set the FoV that specifies the horizontal field view of the target photograph to 30° and download five overlapping thumbnails for each specific target house (described in Section A of the Supplementary Materials).
Determine camera parameters from downloaded depthmaps
Camera height is an important parameter in the calculation of FFE since it represents the vertical distance from the camera center to the roadway surface, as shown in Figure 1. In Google Maps, each panorama corresponds to a depthmap consisting of two important files: the image file and the attribute file. The available depthmaps are downloaded in this step according to the location of each building.
A panorama’s depthmap depicts the distance between the camera and the scene plane, usually used for interactive navigation. In the image file, the center column of the depthmap points to the forward direction of the mapping vehicle in a spherical coordinate system, and the bottom row stores the vertical distance from the center of the camera to the road surface, i.e., the camera height,
Obtain the DEM dataset of the target area
The DEM data for the case study region is obtained from the NOAA Sea Level Rise Observatory (derived from LiDAR data) (NOAA, 2018). The downloaded DEM dataset, which is referenced to the North American Vertical Datum of 1988 (NAVD88, Geoid12 B) with vertical measurements in meters and in accordance with the North American Datum of 1983 (NAD83) in the horizontal dimension, extensively covers Brazoria, Chambers, Galveston, Harris, and Liberty Counties. The vertical accuracy for open terrain is 10 cm based on the metadata.
Obtain the BFE dataset of the target area
BFE, which refers to the height of surface flood waters with a one percent chance of being reached or exceeded in any given year, is indicated on the Flood Insurance Rate Map (FIRM) for zones A1–A30, VE, and AE, etc. The BFE data is obtained from the shapefile downloaded from FEMA’s Flood Map Service Center (FEMA, 2019).
Door detection based on YOLO-v5
For door detection, we adopted the YOLO-v5 (You Only Look Once-v5) model (Jones et al., 2006;Jocher et al., 2020). YOLO-v5 comprises three major components: a backbone that creates features at various granularities, a neck that combines the generated various features, and an output that utilizes combined data to forecast the classes; the detailed structure of the network is illustrated in Section B of the Supplementary Materials.
We followed Ning et al. (2021)’s training procedure but extended the training dataset from 490 to 1134 GSVs, with 908 images used as the training set, and 226 images used as the testing set. GSVs with special cases were selected to enrich the diversity of the dataset, as described in Section C of the Supplementary Materials. During the door detection phase, the argument of object confidence threshold is set to 0.25. In addition, the argument that represents the Intersection over Union (IoU) threshold for Non-Maximum Suppression (NMS) is set to 0.45, which indicates that if the overlapping part of the rectangular boxes of the two detection results is less than 0.45, the two rectangular boxes are preserved. Otherwise, the two rectangular boxes should be one detected result, with only one preserved. The data processing procedure is detailed in Section D of the Supplementary Materials. There is no overlap between the Galveston GSVs in the training set and GSVs used for evaluating the model’s precision. An RTX 2070 SUPER NVIDIA GPU is used to train YOLO-v5 for 100 epochs with a batch size set to 16 and the number of learnable parameters set to large. Notably, compared to the detection results derived from the model trained by the original dataset obtained in Ocean City, New Jersey, U.S., (Ning et al., 2021) which obtained 8473 FFE results in total and 6091 effective results after removing the results related to outdated GSVs, the overall detection rate of the YOLO-model increased by 58.9% and effective FFE detection rate increased by 46%. This demonstrates that retraining the detection model by adding the 540 training samples derived from the special cases of GSVs obtained from the case study region is an efficient method for improving workflow performance.
FFE calculation
As illustrated in Figure 1, the FFE in the case study can be calculated by equation (1). Before calculating the final FFE results, it is also necessary to perform a vertical coordinate calculation which calculates door bottom’s vertical coordinate ( θ𝑡op,

Detailed procedures that convert image coordinates to altitude and azimuth angles in a spherical coordinate system can be found in Ning et al. (2021). The extraction of
Building-scale elevation cost estimation
After the derivation of FFE, we estimate the costs of elevating the FFE of buildings at risk of flooding in Galveston, relying on the FFE values derived from our workflow. Before the final cost estimation calculation, we determine the desired FFE target to which the house should be raised by mapping FFE results over the obtained BFEs.
Considering the generalizability of the workflow and the availability of data (the Section E of the Supplementary Materials), we choose the cost estimation formula of FEMA (1998b) in our case study. The footprint (corresponding to the length of the target building multiplied by its width) is derived from the initial building footprint data for each house in the case study (this value is more relevant than the average floor area in estimating the costs of the actual construction process). As detailed in FEMA (1998b), the cost of raising a residential house can then be estimated using Equations (3) and (4):


Since the cost estimation guided by FEMA (1998b) uses 1998 dollars, the cost must be converted to the corresponding dollar of the current era in the case study area based on changes in the market, economic situation and purchasing power for the result to be instructive.
The cost in the case study can be converted temporally using the Engineering News-Record (ENR) average annual building cost index (i.e., ENR’s average BCI; ENR, 2022), which is widely utilized in the field of building industry research (Touran et al., 2006; Mikhed and Zemčík, 2009; Taghinezhad et al., 2021).
Then the cost is transformed spatially from the national average to the Galveston region using the RSMeans location factors (RSMeans, 2015, 2021), as shown in equation (5):

Evaluation
In this study, we compare the FFE detected via SVIs with the FFE values from two sources: a set of City of Galveston approved E.C.s and the Galveston_FFEData2020 dataset (Diaz et al., 2022). For a detailed description of these comparison datasets, please refer to Section F of the Supplementary Materials. The FFE value derived from our model is termed as

The accuracy of derived FFE is analyzed by calculating the observed level of significance and correlation coefficient. The Standard Deviation (SD) and Root Mean Square Error (RMSE) are also estimated. Meanwhile, the cost estimation is converted to 2015 and 2021 dollars in Galveston to compare with similar building elevation cost data of other regions, which allows us to check the credibility of the cost estimation workflow.
Results
Three neighborhoods were selected to verify the applicability of calculating FFE via GSV for Galveston Island. These neighborhoods have FEMA’s E.C. data and reliable FFE estimates (Diaz et al., 2022) for validation. The samples showed that our workflow is well applicable to Galveston, so we applied the method to all buildings recorded in Galveston Island’s building footprint data. Meanwhile, the results were mapped via a dashboard and compared with published flood data to examine the probability of flood inundation in all areas of Galveston Island. After producing the comparison between the BFE and FFE for each house, the projected cost of elevating the FFE of existing residences in danger of flooding was computed and analyzed.
Verifying the applicability of calculating FFE via GSV in Galveston Island
We selected three neighborhoods in Galveston for comparison of our FFE estimates against the officially validated FFE values from the Galveston_FFEData2020 dataset. This comparison aims to test the applicability of our workflow in Galveston.
There were 672 coordinates of houses in these three neighborhoods after traversing the address names via the Geocoding API; downloading the GSVs of these houses from Google Maps resulted in a total of 3364 images. From Google Maps, a total of 622 depthmaps were downloaded. The decrease in quantity is due to the missing depthmaps or attribute files of some images. We used the retrained YOLO-v5 model to detect doors in these images and obtained 1015 images (belonging to 371 different houses) which were named with coordinate markers.
We calculated FFEs for these detected doors, yielding 371 results containing invalid ones which did not meet the criteria, including side doors that were not displayed in their entirety, images with multiple doors, and images captured before 2014 that do not adhere to the geometric calculation principle of our workflow. Following the procedures outlined in Section D of the Supplementary Materials, we removed the inaccurate and obsolete data prior to 2014 and processed the specific cases to obtain 244 valid results. Since there were five images for each single location, some of the images must have described the same building, so we eliminated the duplicates. After manual inspection, the model mistakenly marked 27 windows, seven garages, eight walls and five fences as doors, and they were removed through manual post-processing. We finally obtained FFE values for 192 houses and compared the results with the validation data to test whether the method was applicable to all areas in Galveston.
We first evaluated the significance and correlation by the CORREL function in Excel and obtained a correlation coefficient of 0.47, and the results are shown in Table S1 (in the Supplementary Material) which indicates the insignificant difference between
Calculating the FFE of all buildings in Galveston Island
After validating the applicability of the calculation method using GSVs for three Galveston neighborhoods, we extended our workflow to all of Galveston Island.
As described in the Section G of the Supplementary Materials, 8897 effective results remained after the entire procedure. From a total of 26,054 building footprints in Galveston, we successfully captured a total of 130,272 GSV images; the overview of the data is depicted in the Section G of the Supplementary Materials, and the interactive dashboard is depicted in Figure 2. Dashboard of the detected FFE results within BFE mapping. (https://experience.arcgis.com/experience/30837ddf6000410a8533140f82ee395c).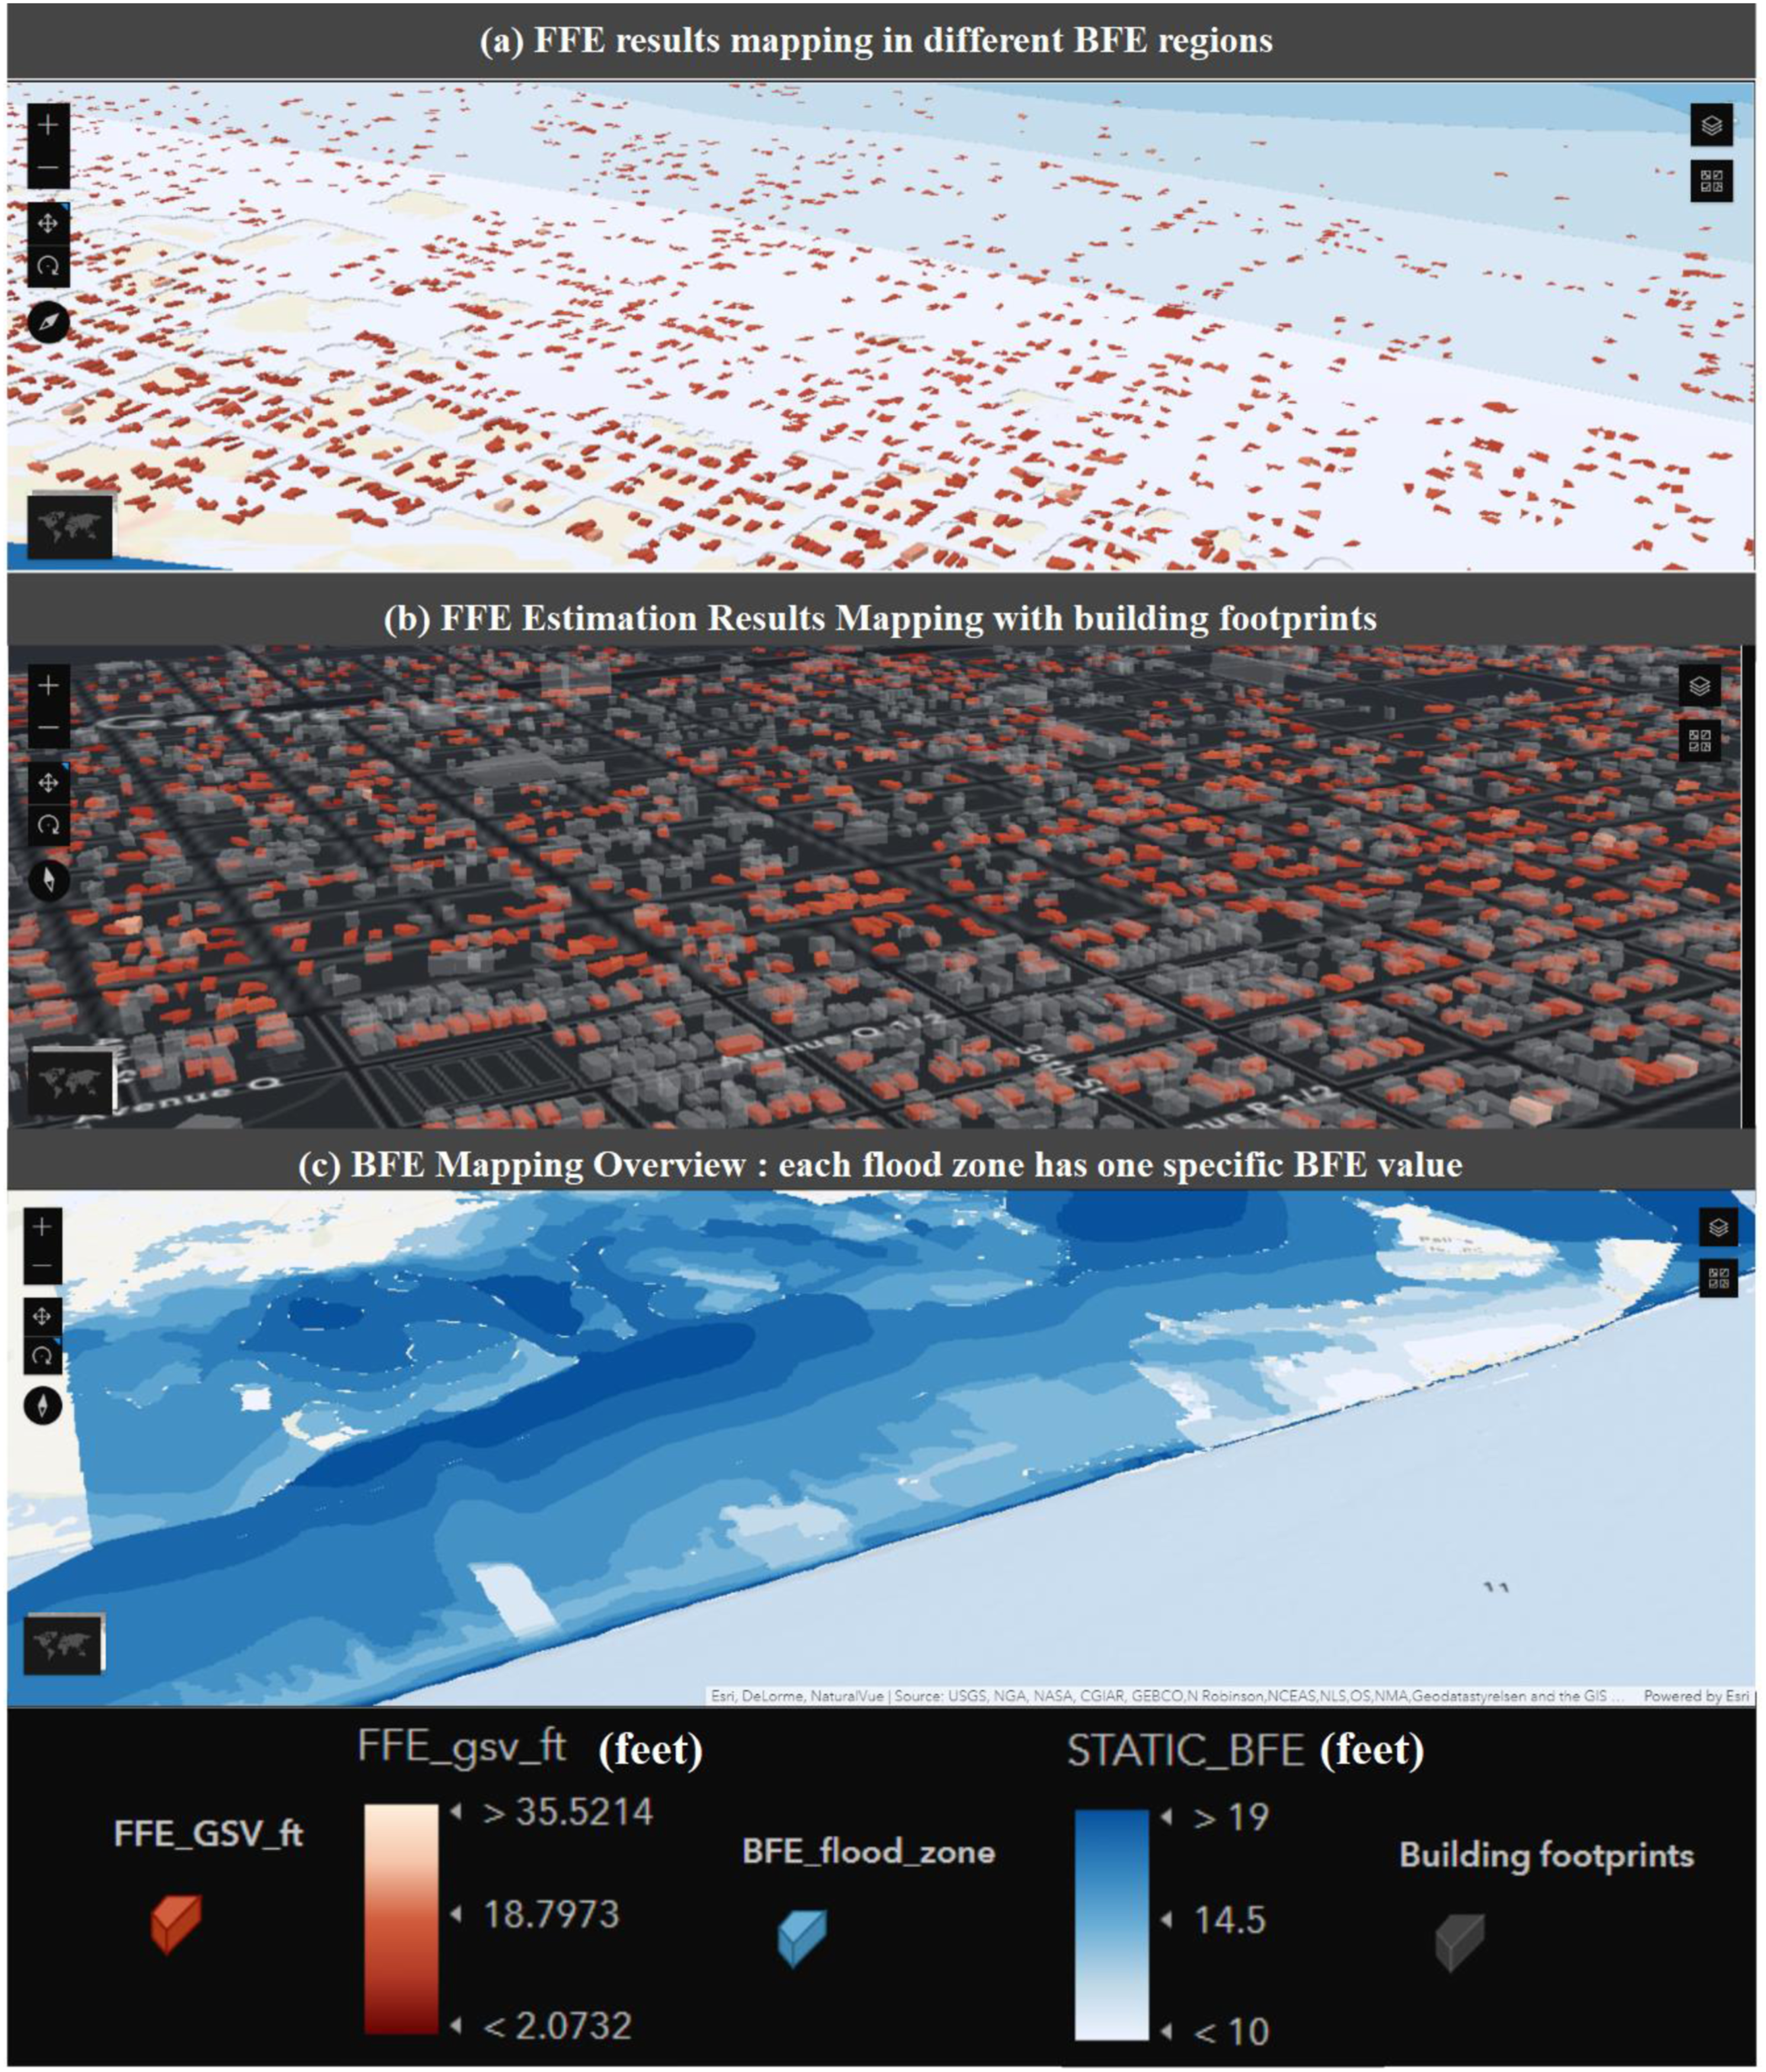
Cost estimation of elevating the FFE of existing houses with potential flood risk
Since the City of Galveston officially requires that new houses and major renovations be constructed with FFE 18 inches (1.5 feet) higher than BFE (Williams, 2018), when considering raising existing houses,
With the variables pre-set as described in the Section H of the Supplementary Materials after data processing, elevation cost estimates for 6015 houses on Galveston Island were conducted to evaluate the credibility of the cost estimation workflow. This calculation also provided valuable data for the further discussion of flood mitigation governance. The cost estimates for elevating existing residential buildings (Table S3 in the Supplementary Material) in the case study are compared to the data from the latest flood adaptation cost estimation review (Aerts, 2018).
Note that our approach considers the footprint of the target house, the construction type, and how much it must be elevated while ignoring the electrical and plumbing adjustments, excavation, permits and insurance. Thus, our results can provide only a rough estimate of elevation costs.
Through comparison, we can conclude that our cost estimation result is considerably close to national averages for similar structures and time periods. Results for the cost of elevating residential buildings to 1.5 feet higher than BFE in Galveston Island are displayed in Section I of the Supplementary Materials.
Discussion
Currently, urban flood damage after a disaster is assessed mostly through self-reporting. Information from accessible and integrated cities combined with GSV data could directly improve current procedures for urban disaster assessment and possibly also prevention. Given the water height of a flood event, a building’s FFE determines whether floods will inundate the lowest living floor and cause property loss. Policies for urban flood prevention may benefit from more fully incorporating the comprehensive and rapid assessment of FFE enabled by our methods. In the case of Galveston, our analysis of FFE above BFE (the Section J of the Supplementary Materials) yields the following policy suggestions.
Based on insights from our analysis of FEMA’s National Flood Insurance Map, the dashboard of the distribution of FFEs in different BFE regions derived from our model, and the weighted K-means clustering results (the Section J of the Supplementary Materials) for houses requiring elevation, we suggest that local governments consider the following flood protection measures to improve the efficiency of flood prevention efforts.
To protect persons and property from flood losses, the K-means results and flood maps and dashboards suggest that volunteer teams for flood emergency response and infrastructure maintenance may be best positioned near the following Galveston Island locations: (1) Intersection of Marine St and Marlin Ave (2) Intersection of Beech St and Airport Blvd. (3) Intersection of 17th St and Harborside Dr. (4) Intersection of Avenue M 1/2 and 35th St (5) Intersection of Winnie St and 13th St (6) Intersection of Basin and Jolly Roger Rd. Meanwhile, to reduce both the elevation costs borne by individual homeowners and societal costs associated with the more extensive and expensive services that the residents of un-elevated properties will likely require during disaster response and recovery, suggestions for building partnerships between government bodies (at local, state, and federal levels) and companies providing house elevation services are raised, along with a building-scale elevation cost visualization demo for the local communities (the Section K of the Supplementary Materials).
In this study, we design a highly automated workflow to collect the required data for automated FFE estimation and building-scale elevation cost calculation. However, manual review and adjustments are still needed for optimal results. For instance, the Geocoding API may not provide a precise latitude and longitude based on a known address name. Thus, after obtaining the GSV, manual inspections are needed to ensure the accuracy of longitudes and latitudes for the investigated houses. The second major limitation is the timeliness of SVI images. The outdated pictures are not suitable for the geometric principle utilized in our workflow and might fail to reflect the current housing status (especially if renovations have been made to mitigate flood damage). Please note that the rate of GSV’s reliability in the City of Jamacia Beach is only 7.5%, which is indicative of the great challenge that the applicability of our method faces in areas with high concentrations of outdated SVI (detailed data are depicted in the Section L of the Supplementary Materials). We encourage future efforts to be made to utilize these outdated GSVs. Moreover, the building types and designs included in our dataset are limited, necessitating additional research on front door detection for diverse structures. Due to their unique architectural designs and flood protection features, a number of Galveston residences are located away from the road and on high ground, diminishing the usability of the images captured by the street view vehicles. If researchers fail to correct errors in latitude, longitude, and GSV update time during data processing, the detected door may not correspond to the front door of the associated house, and the evaluation may contain unexpected uncertainties. If our case study had a larger dataset with more precise vertical dimension information, we could more accurately assess SVI’s vertical measurement capabilities.
Conclusion
In this study, we explore the implications for flood mitigation governance of an automatic workflow to estimate FFE over a large area using the latest computer vision technology based on deep learning. We also create an original dataset that may contribute to further exploration of FFE estimation for structures on Galveston Island. Because low-income communities and marginalized groups disproportionately affected by coastal flooding may not have the financial resources to maintain the FFE information, such a cost-effective method to estimate FFE can ensure that resources are directed towards those areas that are most in need of assistance, helping to address these disparities (Ye et al., 2023). By assessing the extent of flooding risk at a large scale, decision makers can allocate resources to the areas that require the most urgent attention, rather than spreading resources too thin across the entire affected area (Han and Ye, 2022). Additionally, an automatic workflow can help promote transparency and accountability in the decision-making process, which is based on objective data rather than subjective factors, facilitating a fair and just response to flooding events.
Multidimensional building and cost-related information enhanced and extended workflow capabilities. The dataset size and application scenarios, which are much larger and more complex than the scope of prior efforts, are used to demonstrate the ability to apply this workflow to a larger region. Combined with 130,272 GSVs, using 16,464 depth maps and panoramas we successfully calculate the FFE of the front doors of 13,465 buildings in Galveston. After removing unavailable results, such as wrong detections, missing data, and other types, 8897 viable FFE estimation results remained.
We study flood risk mitigation governance by presenting a building-scale elevation cost calculation approach using the acquired FFE data, projected area derived from building footprints, and BFE, among other factors (i.e., considering the local flood mitigation regulation in the case study, the residential buildings are required to be elevated to 1.5 feet higher than BFE in Galveston). We conclude that our cost estimation result is reasonably close to national averages for similar structures and time periods, and the data used in our costing methodology are readily available and suitable for application to large geographical areas.
By comparing the detailed FFE overlaid on the BFE distribution map with a flood map derived from the digital flood insurance map of Galveston Island, we further investigate potential flood-affected locations and determine which buildings or dwellings require additional flood protection measures. We provide a demo in the case study for residents of the local community to check whether their houses need to be elevated and how much it may cost based on their current situation, aiming to help local communities and residents avoid flood losses. Furthermore, to determine the optimal number and location of volunteer emergency response stations for Galveston Island, a weighted K-means clustering algorithm that considers the Haversine distance between these properties as well as weights these distances based on the houses’ level of flood vulnerability (∆FFE) is used to identify sets of homes based on their spatial proximity and relative vulnerability to flooding.
Finally, we expect the data collection paradigms and methodological ideas provided by our study to facilitate future investigations in areas such as disaster control and smart cities, as the management of coastal flooding in other at-risk coastal communities may clearly benefit from the proposed workflows.
Supplemental Material
Supplemental Material - Exploring Flood Mitigation Governance by Estimating First-Floor Elevation via Deep Learning and Google Street View in Coastal Texas
Supplemental Material for Exploring Flood Mitigation Governance by Estimating First-Floor Elevation via Deep Learning and Google Street View in Coastal Texas by Ge Gao, Xinyue Ye, Shoujia Li, Xiao Huang, Huan Ning, David Retchless and Zhenlong Li in Environment and Planning B: Urban Analytics and City Science
Footnotes
Acknowledgments
We greatly appreciate the helpful comments and suggestions from the editor and anonymous reviewers.
Declaration of conflicting interests
The author(s) declared no potential conflicts of interest with respect to the research, authorship, and/or publication of this article.
Funding
The author(s) disclosed receipt of the following financial support for the research, authorship, and/or publication of this article: This work was supported by the National Science Foundation (NSF) under grant SMA-2112356, 2122054, 2232533, Texas A&M University Harold Adams Interdisciplinary Professorship Research Fund, and College of Architecture Faculty Startup Fund. The funders had no role in the study design, data collection, analysis, or preparation of this article.
Appendix
References
Supplementary Material
Please find the following supplemental material available below.
For Open Access articles published under a Creative Commons License, all supplemental material carries the same license as the article it is associated with.
For non-Open Access articles published, all supplemental material carries a non-exclusive license, and permission requests for re-use of supplemental material or any part of supplemental material shall be sent directly to the copyright owner as specified in the copyright notice associated with the article.