
Abstract
A system of cities is morphologically polycentric when its cities are similarly sized and evenly spaced across its territory. In this paper, we adapt established spatial interaction models and entropy-based measures of heterogeneity of weighted networks to the problem of measuring morphological polycentricity. We study the evolution of the morphological polycentricity of the system of English and Welsh towns from 1851 to 1881, a period characterised by rapid urbanisation and expansion of railways. Our approach enables us to account for morphological aspects of the system that are often neglected by existing measures of morphological polycentricity, such as the evolution of transport infrastructure and its impact on travel distances. We show that the trend towards a greater concentration of the population in fewer urban centres in England and Wales was accompanied by a more diverse network of connections and potential intercity interactions.
Introduction
Polycentricity – evolving geographic phenomenon and policy objective
Polycentricity has gained considerable traction in planning but has remained for a long time an ambiguous concept (Meijers, 2008). This vagueness largely derives from its referring to two different aspects of a system of cities: the morphological one, relating to the size and spatial distribution of the cities (Meijers and Burger, 2010), and the functional one, concerning the relations and exchanges between them (Dühr, 2005; Green, 2007). A system of cities is morphologically polycentric when its cities are similarly sized and evenly spaced across its territory (ESPON, 2007; Meijers, 2008). The distance between two cities may be computed as their geographical distance or, more aptly, as the travel time (Dühr, 2005). A system is functionally polycentric when the functional connections between the cities are more balanced and diverse (Green, 2007). Examples of functional connections include migration flows, commuting patterns, material and knowledge exchanges, among others. Real world observations suggest that a morphologically polycentric region is not necessarily a functionally polycentric one (Seymour, 2017). Yet, morphological and functional polycentricity are not independent, as the spatial distribution of cities and their sizes impact the infrastructural linkages between them, and these are indispensable for the creation of functional linkages (Burger and Meijers, 2012; Meijers, 2005).
Another source of ambiguity is that polycentricity has been varyingly treated as an observable geographical phenomenon and as a policy objective to pursue (Green, 2007). Hall and Pain, 2006 described polycentricity as an emergent and ongoing process, discussing the advent of ‘Mega-city regions’: morphologically and functionally polycentric regions clustered around one or more major cities and developed through a process of decentralisation, whereby the cities take advantage of the division of labour and operate synergistically.
When polycentricity is interpreted as a policy objective, the primary aim is often that of analysing the connection between morphological and/or functional polycentricity and economic prosperity. In some cases, the theoretically neutral notion of polycentricity is inflected with the positive connotation of ‘desirable balance’. The European Spatial Development Perspective (European Commission, 1999), for example, maintained that the disproportionate economic and demographic concentration in the core area of the European Union (which they defined as the pentagon with London, Paris, Milan, Munich, and Hamburg at its vertices) hinders the full realisation of the economic potential of its peripheral regions, and stressed the importance of multiplying hubs for accelerating growth and reducing regional imbalance. In other cases, though, the link between polycentricity and economic performance is called into question. For example, Seymour, 2017 discussed the different levels of economic success in similarly functionally polycentric regions such as the Dutch Randstad and German Ruhr, and the greater prosperity in the morphologically centralised South East of England compared to the much more morphologically polycentric North. Goetz et al. (2010) observed that in the United States counties that have high diversity in either their incoming or outgoing commuting flows tend to experience lower per capita income growth. However, counties that show high polycentricity of both their incoming and outgoing commuting flows are associated with higher income growth.
Aims
Whether polycentricity is treated as an emerging geographical phenomenon or as a policy objective, a fundamental problem is that of quantifying it. Most approaches to measuring morphological polycentricity consider cities in a region as existing ‘in isolation’, and focus on one or more aspects of interest, such as their population size, for which several mathematical measures of heterogeneity can then be used. The study of functional polycentricity presupposes instead a network approach (Cardoso and Meijers, 2021), whereby cities are represented as nodes connected by links that correspond to a specific kind of functional relation.
This paper examines the morphological structure of urban systems, focusing on population distribution and travel distances, which can be seen as the main morphological factors impacting the cities’ potential to interact with one another. While real interactions are influenced by the urban system’s morphological structure, they are also influenced by various other non-morphological factors. We adopt an entropy-maximising model to estimate the potential interactions, with minimal assumptions about their specific functional form. We then use established network measures of polycentricity to study the heterogeneity of these potential interactions. Our objective is to shed light on the intricate relationship between population distribution, transport connectivity, and their impact on fostering balancedness of intercity interactions. We do so by examining the system of English and Welsh towns between 1851 and 1881, a period marked by rapid urbanisation and expansion of the railways.
Structure
The rest of the paper is structured as follows. We begin by surveying several indicators of morphological polycentricity of systems of cities and explain why networks should play a role in measuring it. We discuss the important role of Shannon entropy both as an established measure of the functional polycentricity and as the foundation of a statistically grounded spatial interaction model to predict intercity interactions. We combine these two existing approaches, discussing how to connect cities into a network via the entropy-maximisation-based spatial interaction model and travel time distances, and then measure the morphological polycentricity of the system on the basis of the Shannon entropy of these predicted interactions. We illustrate the potential of this network-entropy-based approach by studying the evolution of the morphological polycentricity of the English and Welsh system of cities from 1851 to 1881, at the local level for each city, and for five main regions. We discuss advantages, limitations, and future opportunities offered by this approach and conclude the paper.
Related work: Polycentricity and network entropy
Simple and composite indices
Zipf’s law (Zipf, 1949) is one of the most theoretically researched (Barthelemy, 2016; Bouchaud and Mézard, 2000; Gabaix, 1999) and statistically observed (Pumain, 2018; Batty, 2006) examples of regularity in the distribution of population sizes in system of cities around the world. It suggests a relation of inverse proportionality between a city’s population size and a power of its position in the national population ranking. The exponent in Zipf’s rank-size relation has been used to describe trends in the level of economic and demographic imbalance between one or few major centres in a national or transnational system of cities and the smaller centres in the system. Pumain and Moriconi-Ebrard (1997), for example, remarked that, following the period of increasing centralisation during the 19th and early 20th century described in (Bairoch et al., 1988), a clear evolutionary pattern in national systems of cities did not emerge in more recent years from the analysis of the exponents. Hence, they advocated for more sophisticated methods that did not only take into account city sizes, but also their territorial contexts and spatial locations to quantify how centralised or polycentric a system of cities is. The exponent in the rank-size analysis has since been widely used as a simple measure of polycentricity at the regional scale (Brezzi and Veneri, 2015; Burger and Meijers, 2012; Meijers and Burger, 2010). This method is also mentioned in Hall and Pain, 2006, but the authors stressed therein its crudeness. Indeed, it is sensitive to sample size (different exponents may result if a larger or smaller subset of cities in a region is selected), it is unable to capture spatial information about the cities’ locations and does not apply to systems that do not display a clear rank-size relation.
Composite indices are adopted as more specialised and sophisticated measures of polycentricity, their main advantage being that of merging together information about various attributes of interest, such as employment or population, and the spatial location of the cities. Examples include the ‘polycentricity index’ proposed by (Dühr, 2005), which uses the slopes in the rank-size relations for cities’ population and Gross Domestic Product, the Gini coefficient of the extension of the cities’ service areas and their multimodal accessibility, and the simpler ‘urban centrality index’ (Pereira et al., 2013), which combines inequity in the distribution of jobs with an index of the spatial dispersion of centres based on their geographical distance. Disadvantages of the polycentricity index are its reliance on the rank-size relation and its complexity, as it involves combining several pieces of information that may not be available for all systems of cities. The urban centrality index, on the other hand, uses geographical distance to compute heterogeneity in the spatial distribution, which may not reflect real travel time conditions.
Network theory and polycentricity
Network theory finds extensive application in the analysis of systems of cities, including modelling highway traffic flows between cities (Jung et al., 2008); evaluating railway systems’ robustness (Bottinelli et al., 2019); and reconstructing and tracking the evolution of interactions between settlements (Knappett et al., 2008).
Studies of functional polycentricity invariably adopt a network approach, and explicitly define a network of cities in which the nodes represent cities and the links connecting them represent a functional relation of interest. The link
For morphological polycentricity, the existence of a network is not always explicit. Yet, to account for the spatial distribution of cities, distances between the cities have to be computed, and this defines an implicit network structure where the weight
The sum
First introduced in (Wasserman et al., 1994), the aptly named Polycentricities are a class of network-based measures that make use of the standard deviation of the distributions of link weights and nodes’ strengths, and of the network density to give an indication of how polycentric the network is. Polycentricities were adapted to the urban context by (Green, 2007), who took the nodes in the network to be cities, and the weighted links to be either functional relations between them, or geographical distances.
Green developed Polycentricities with a functional approach in mind, but there have been attempts to apply Polycentricities to urban networks built on morphological properties. For instance, in (Li, 2020; Li and Liu, 2018; Liu and Wang, 2016) the networks were built by connecting the main centre and secondary centres and taking as weights the products
Entropy in urban science: Potential interactions and heterogeneity
Alongside the exponent in Zipf’s law, the Gini coefficient, and the standard deviation, Shannon entropy has been used to quantify heterogeneity and polycentricity in urban systems. In the context of what would become known as Information Theory, (Shannon, 1948) defined the entropy
The Shannon entropy
Batty’s work (e.g. Batty (1974); Batty et al. (2014)) clarified how to effectively adapt Shannon entropy to spatial data as a measure of its heterogeneity and complexity. A similar aim was later pursued in (Heikkila and Hu, 2006). Batty’s approach is prevalent in the field of spatial statistics and has been applied to study the expansion and evolution of urban areas (Altieri et al., 2018, 2019), and the spatial association of employment data (Karlstrom and Ceccato, 2000).
Wilson’s work (e.g. Wilson, 1970, 2008) applied entropy to study the configuration of spending flows
In their study of intercity functional connectivity, Yang et al. (2019) linked cities in a network with weights

they obtained measures of the heterogeneity of the outgoing and incoming connections between a city
Methodology
Network entropy as morphological polycentricity
We combine the entropy-maximisation-based spatial interaction model by Wilson (Wilson, 1970) and the network-entropy-based approach of measuring functional polycentricity (Marin et al., 2022; Yang et al., 2019) in the following method to study the morphological polycentricity of a system of cities.
Consider a region
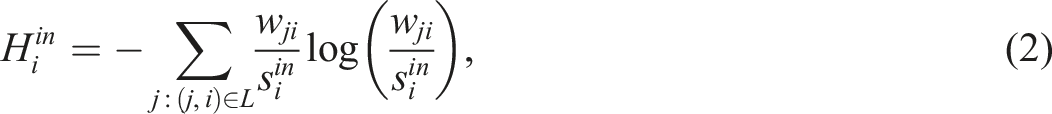
We assume that the total interactions from city
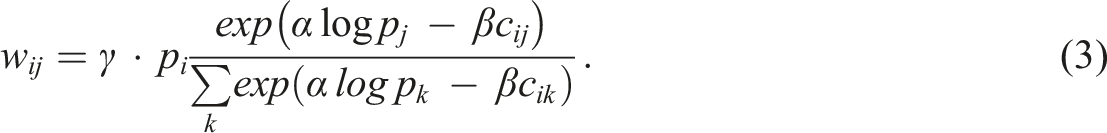
Here γ is a proportionality constant. Since we are interested in the network entropy and thus in
For each city
Entropy normalisation
To be able to compare cities with different number of connections and systems of cities with different number of cities and network topology, we adopt the following normalisation of
Remark that
Equation (3) defines a complete weighted network, connecting each city to every city in the system (including itself). In this case

Dataset
We follow the above-described method to study the changes in the morphological polycentricity of the urban system in England and Wales from 1851 to 1881.
Bennett (2012) collected the population of towns and cities in England and Wales from 1801 to 1911, at 10 years intervals. Not all centres have population data for 1851 and 1881. If the data for a town was not available in 1851 and/or 1881, but it was available at an earlier and at a later date, we estimate the population in the missing year(s) by linear interpolation.
To estimate travel time between localities at different times, we consider the fastest land transport available. We use historic data on railway lines in England, Wales and Scotland (Marti-Henneberg et al., 2021; Satchell et al., 2018), and railway stations’ locations (Henneberg et al., 2021; Marti-Henneberg et al., 2021). The data sets do not explicitly contain data on travel time or speed along the lines. We derive our estimate for average speed along the railway network from the online atlas that accompanies the data (Bogart et al., 2018). The atlas mentions that in 1830 (the year that saw the beginning of the railway era with the opening of the Liverpool to Manchester Railway) the average train speed was 12 miles per hour (mph), or equivalently 19.3 kilometres per hour (km/h). In 1900, the average speed had increased to 40 mph (64.4 km/h). Assuming a linear increase in the transport speed, we can estimate the average speed in 1851 and 1881 to be 20.4 mph (32.8 km/h) and 32.4 mph (52.1 km/h), respectively. This makes railway transport about 2.55 and 4.05 times faster in 1851 and 1881, respectively, when compared to the 8 mph (12.9 km/h) average speed reached by the stagecoach, which was the fastest form of transport available to passengers before the advent of the railways.
Figure 1 shows the distribution of towns, railway lines and stations in England and Wales, as they evolved from 1851 to 1881. In these as in the following maps, we show the boundaries of the historical counties as provided by the Historic County Borders Project.
1
For convenience, we grouped the historical counties into the following five regions: the Greater South East (GSE), that is, the area including the capital London and its surroundings and corresponding to the modern-day regions of the South East and East of England; the Midlands, comprising the modern-day regions of the East and West Midlands, among the heartlands of the industrial revolution; Northern England, with its multitude of booming industrial centres, concentrated in the counties of Durham, Lancashire and around the mountain chain of the Pennines, in the south western corner of the region; the South West (SW); and Wales. For each region, we singled out one main centre: London in the Greater South East; Birmingham in the Midlands, Manchester in the North, Bristol in the South West, and Cardiff in Wales. Towns, railway lines and stations in England and Wales in 1851 and 1881, with historical county boundaries and regions of interest identified by different shades of grey. The number of towns increases from 656 to 811. The size of the symbol representing a town is proportional to its population and shows the remarkable increase in urban population during this period. (a) Several towns remained disconnected from the railway network in 1851, especially in South West England and Central Wales. (b) The railway network became denser and connected the vast majority of towns by 1881.
Network construction
Travel time computation
For each pair of cities Schematic representation of the computation of travel time between two cities 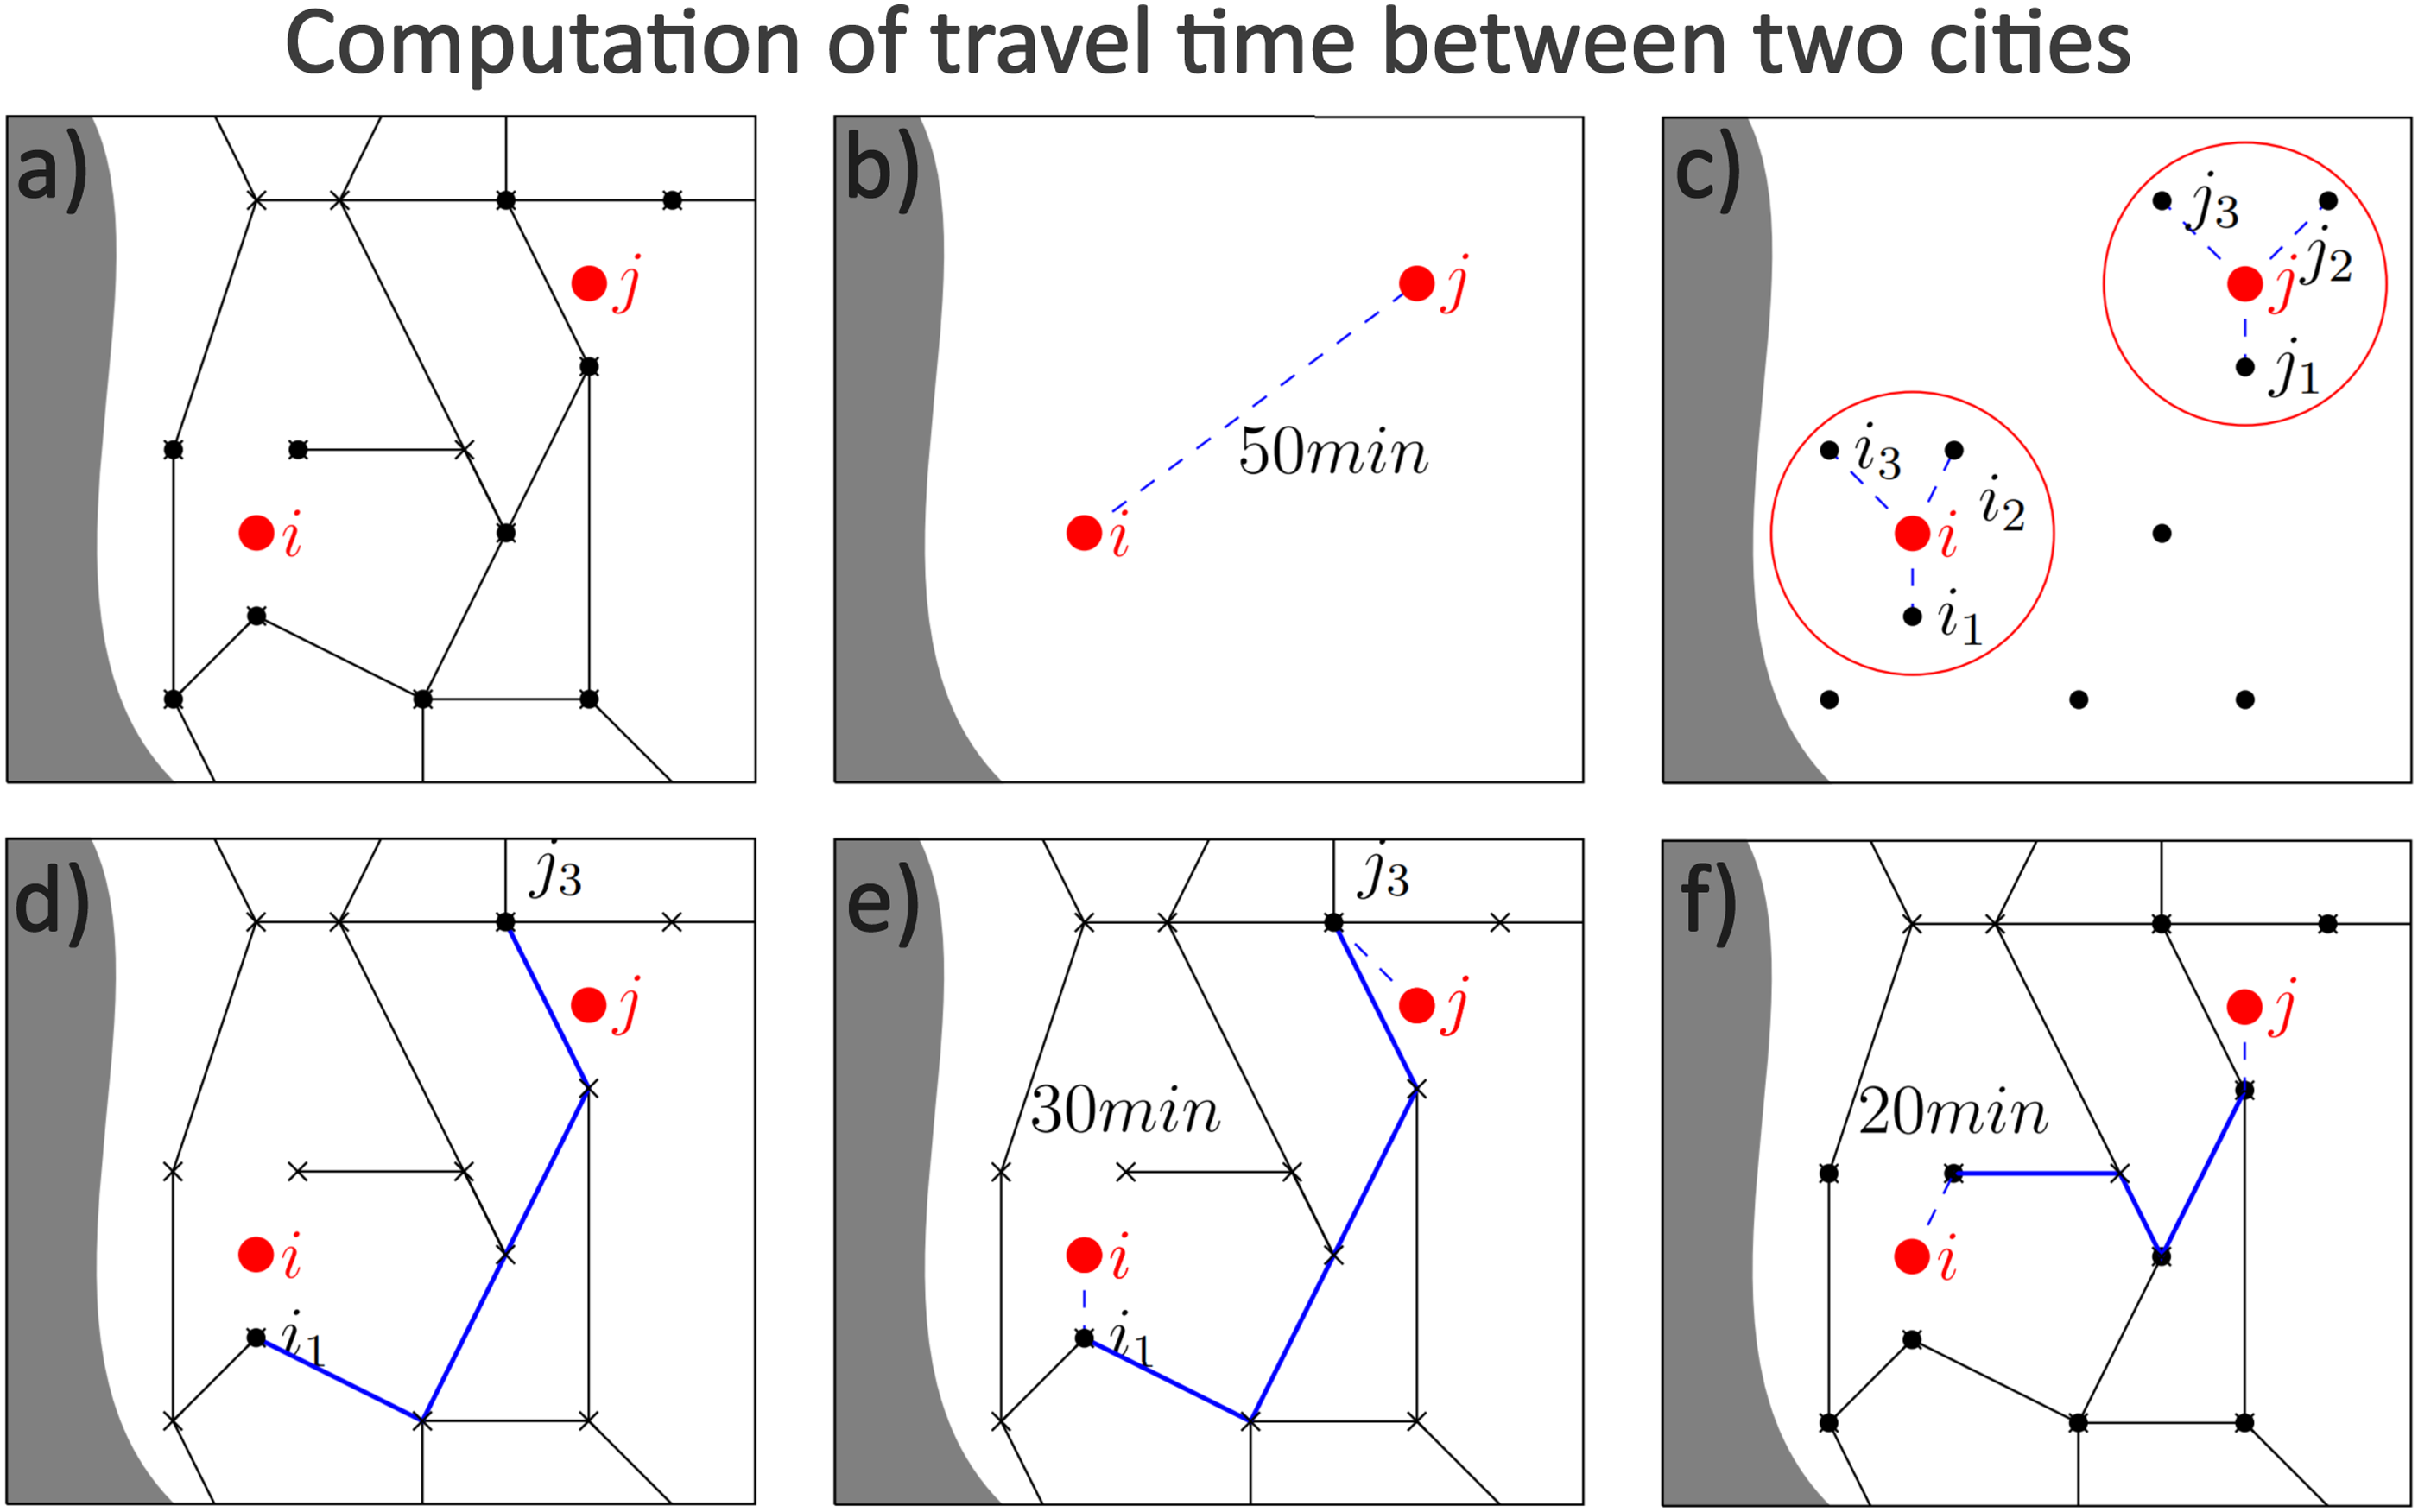
Networks of potential interactions
We combined
Results
Networks
Figure 3 shows the resulting networks in 1851 and 1881. For clarity, only the 600 links with the largest weights are shown for each year. Potential interactions between English and Welsh towns in 1851 and 1881. The thickness of an arrow is proportional to the magnitude of the interaction. Darker arrows represent relatively more intense interactions. For clarity, only the 600 largest connections are shown, but all pairs of towns are connected in the model. (a) In 1851, the majority of the intense links in the South East are directed towards London, whilst the interactions in the other clusters are more polycentric. (b) In 1881, the dominance of London in the South East is reinforced and the urban clusters in the North become more interconnected.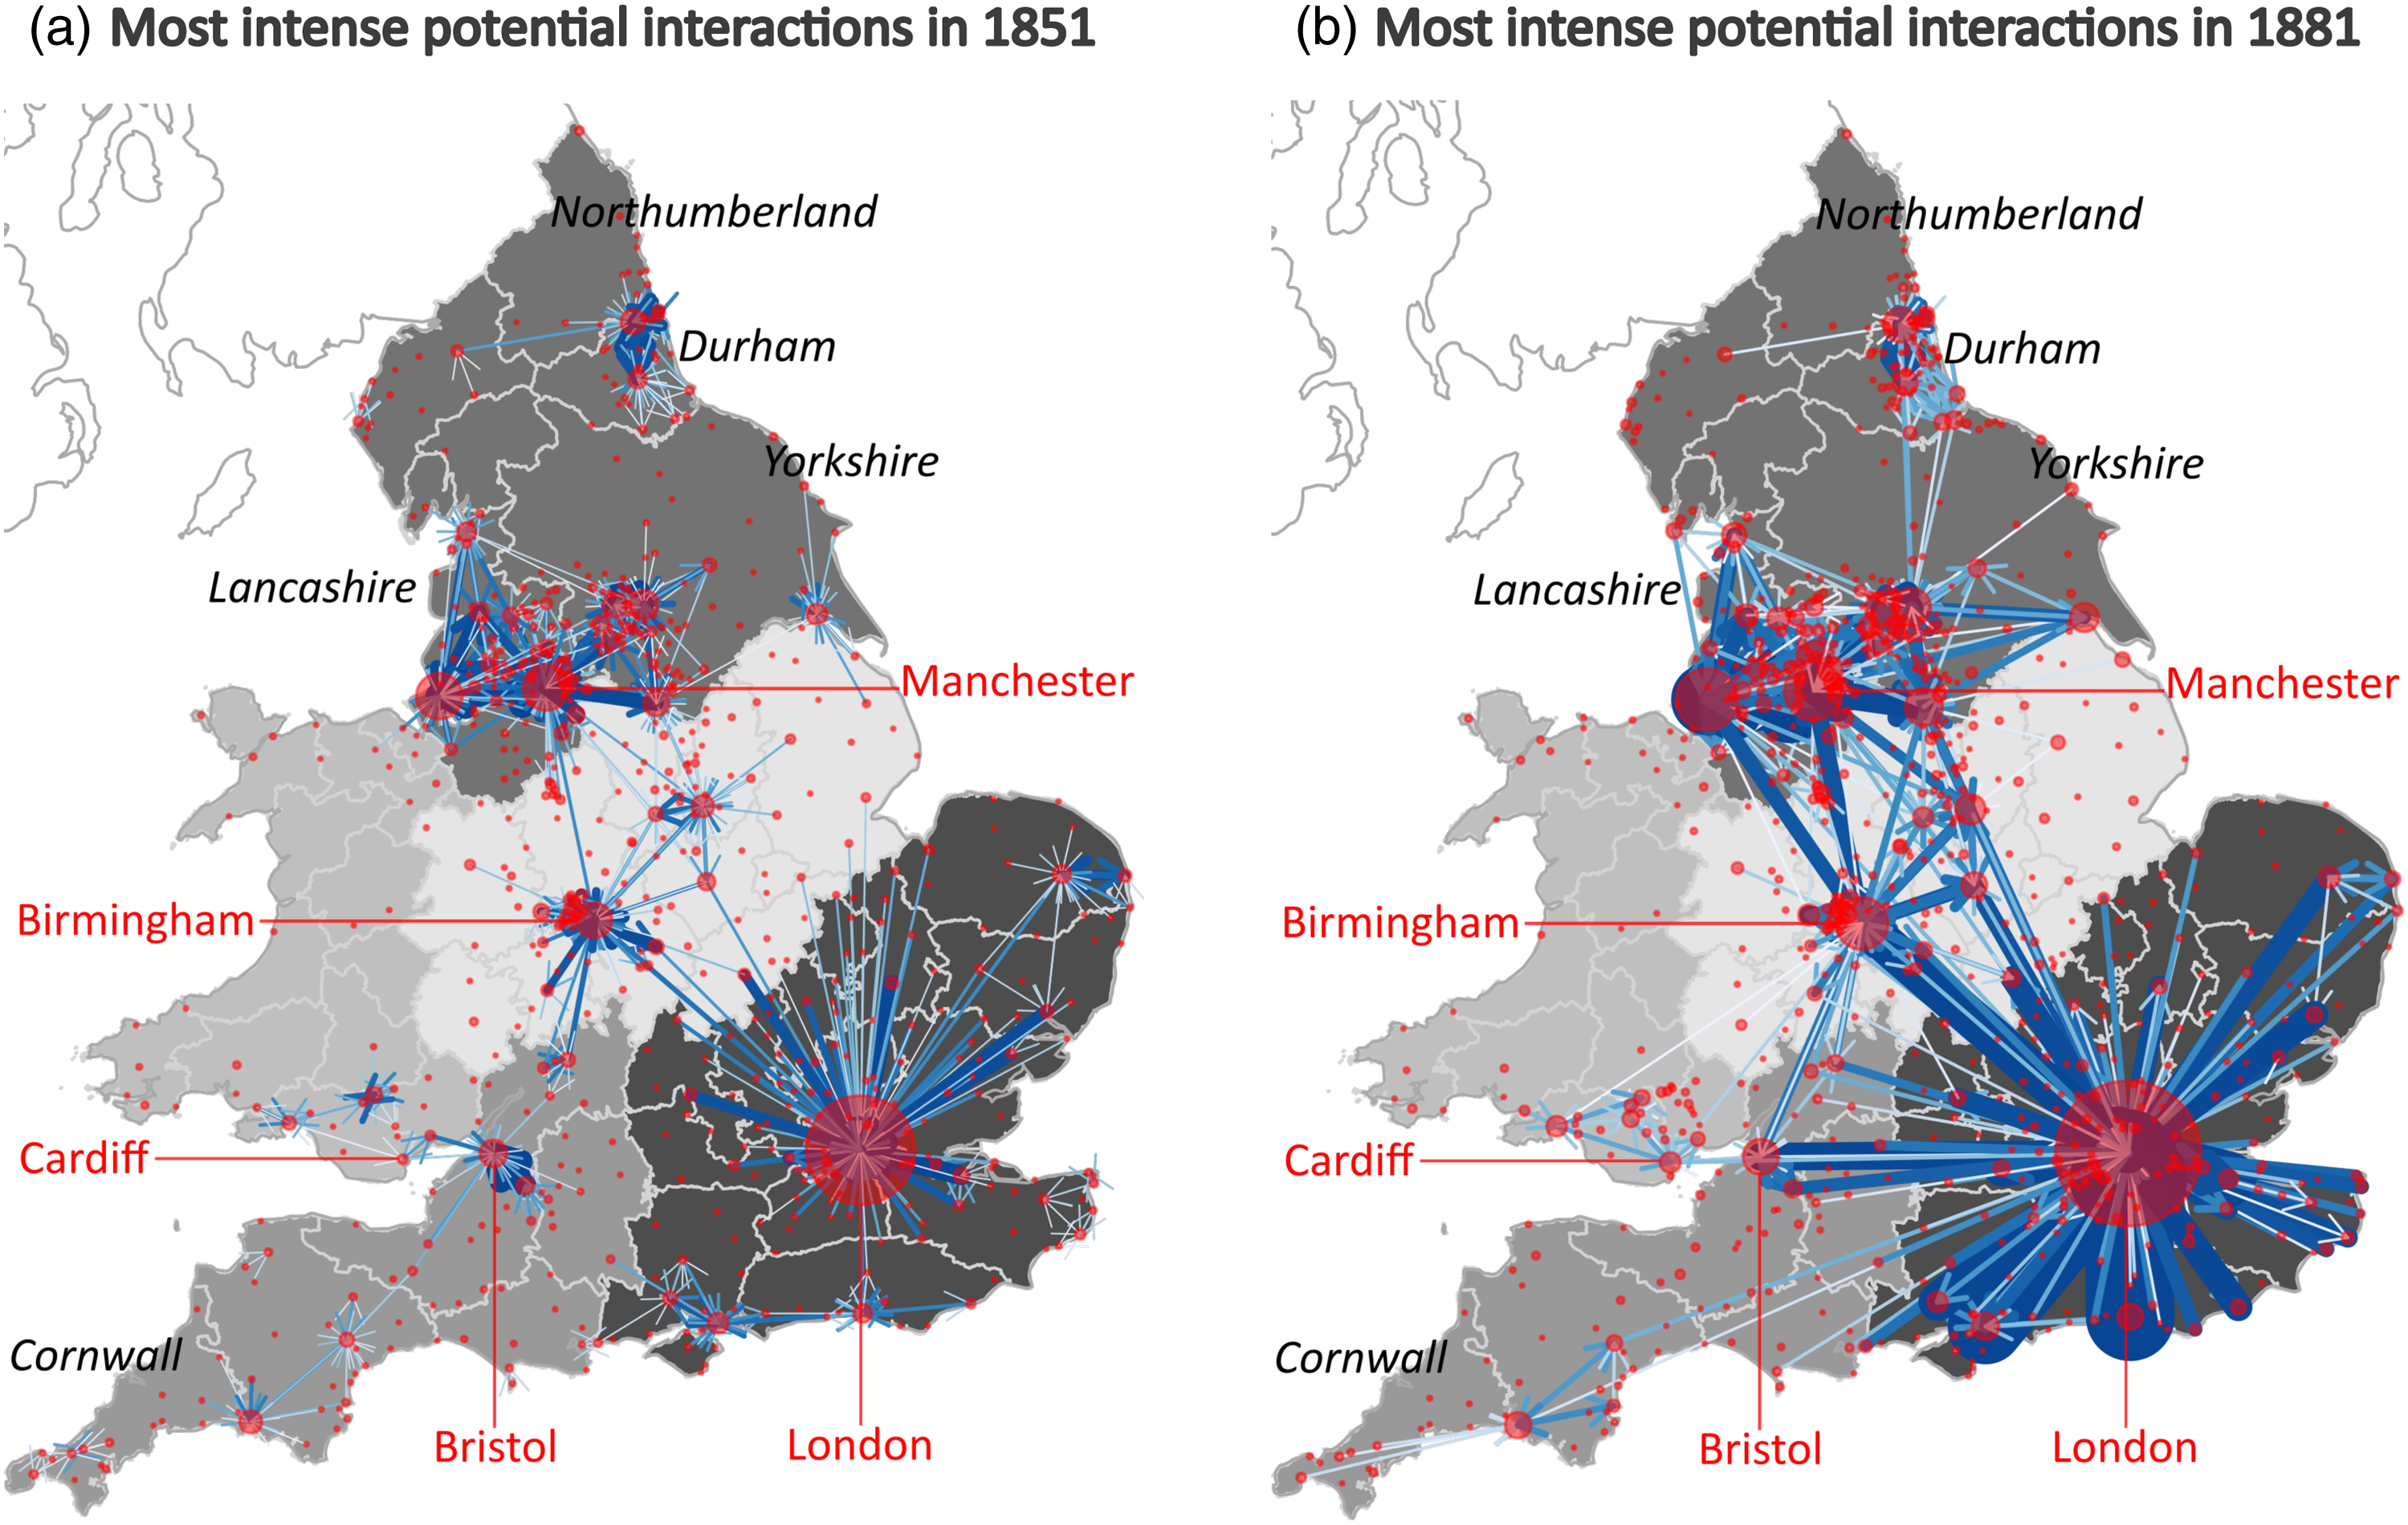
We remark an overall increase in the magnitude of the potential interactions, as a result of the combined effects of population growth, railway expansion and faster railway speeds. In 1851, a number of clusters of intense connections are apparent: a very centralised star pattern centred around London in the South East, a strongly interconnected set of cities in Lancashire and South Eastern Yorkshire, smaller star-shaped patterns in the Midlands that connect the aforementioned two large clusters, and a few small, isolated clusters in Durham, Yorkshire, southern Wales, and the South West. The situation in 1881 sees two major changes. First of all, the London-centred star-shaped pattern expands to the rest of the Greater South East, a sign of the consolidation of London’s preponderance in the region. Secondly, we observe a greater level of integration of the main clusters in the North and in the Midlands with the rest of the country, with the smaller Yorkshire and Durham clusters joining the former, and some centres in the latter being now strongly connected to London and to Southern Wales. This is likely an effect of both population concentration and better rail connectivity, that strengthened potential connections between larger centres even if these are geographically distant. Finally, we see that Bristol joins the main London-centred cluster and the towns in Cornwall reduce their isolation via stronger connections towards the East.
Morphological polycentricity
We computed the entropies Entropy of the outgoing potential interactions 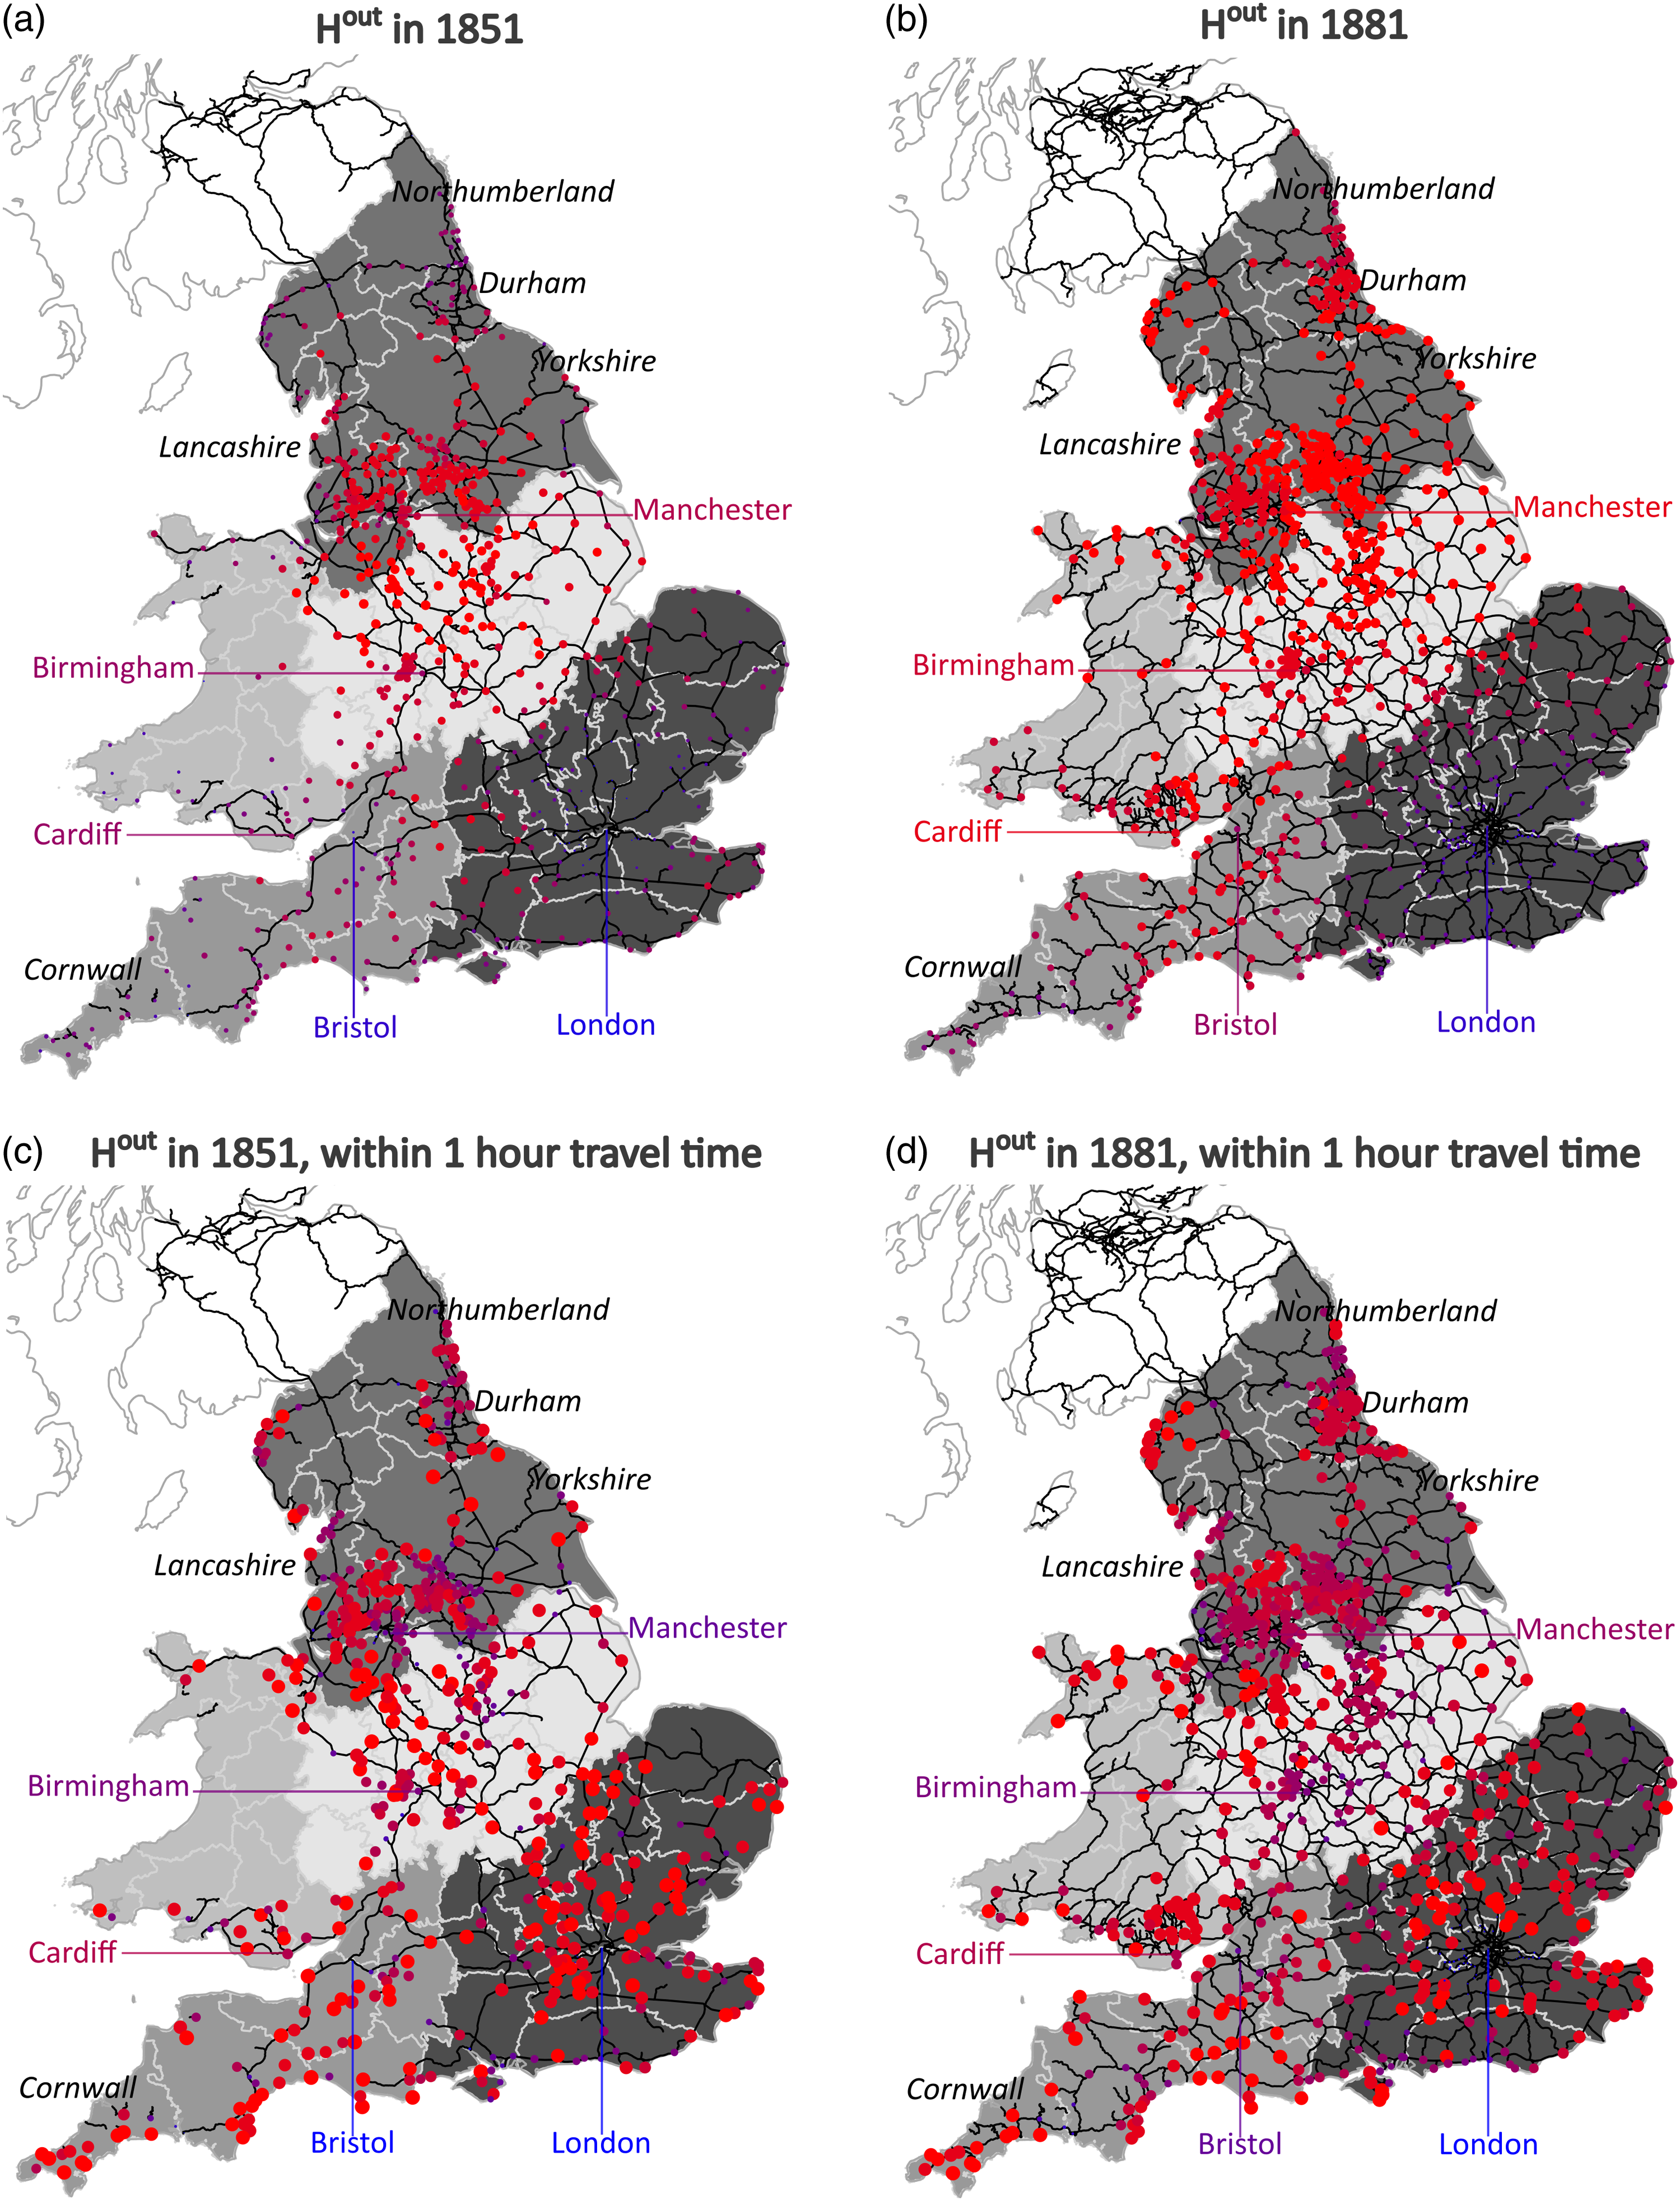
In 1881 (Figure 4(b)), better overall connectivity and faster transport speeds along the railway lines mitigate these effects: the potential interactions of geographically peripheral areas multiply and become more diverse, yielding larger entropy. The largest increase is observed for Aberystwyth, a coastal town in central Wales and one of the most geographically isolated ones in the area of study, whose potential interactions increase substantially after its connection to the railway network. The only centres that retain small entropy are London and those in its immediate surroundings, because of the dominance of the former, and, to a lesser extent, Cornish towns, that remain comparatively isolated.
When a maximum travel time threshold is imposed, the effects of being located at the geographical extremes/centre of the area are mitigated. For a threshold of 1 hour in 1851 (Figure 4(c)), the connections in the South are substantially more polycentric, although still below the values reached in the North. This is because London remains out of reach from most areas of the South East when such a short travel time is allowed, so the towns are expected to have more balanced connections with one another. On the other hand, some towns register zero entropy, as they are further than 1 hour travel time from every other town, and thus all potential interactions are inevitably directed towards themselves. This is the case of several towns in Wales (including Aberystwyth), in Yorkshire, on the coast of Eastern England and, more generally, of most towns that were not reached by any railway line. In 1881 (Figure 4(d)), the entropy values for the potential interactions in less than 1 hour of travel time resemble more closely those of the unconstrained case. In particular, the expected pattern of extreme centralisation re-emerges in parts of the ‘home counties’, 2 from which one could by then reach London in less than 1 hour.
The boxplots in Figure 5 show the median and the upper and lower quartiles of Boxplots of the entropy of incoming and outgoing interactions, by region, with or without maximum travel time threshold. The top and bottom of each box correspond to the 1st and 3rd quartile, respectively, and the horizontal line represents the median value. The lower (resp. upper) whisker extends by 1.5 times the distance from the median to the lower (resp. upper) quartile. Outliers are represented as points. (a) The median entropy of incoming connections increases from 1851 to 1881 in all regions. (b) The median entropy of outgoing connections increases in all regions but the Greater South East. (c-d) Imposing a 1-hour threshold in travel time, the Greater South East and the Midlands show increasing centralisation in the incoming and outgoing interactions.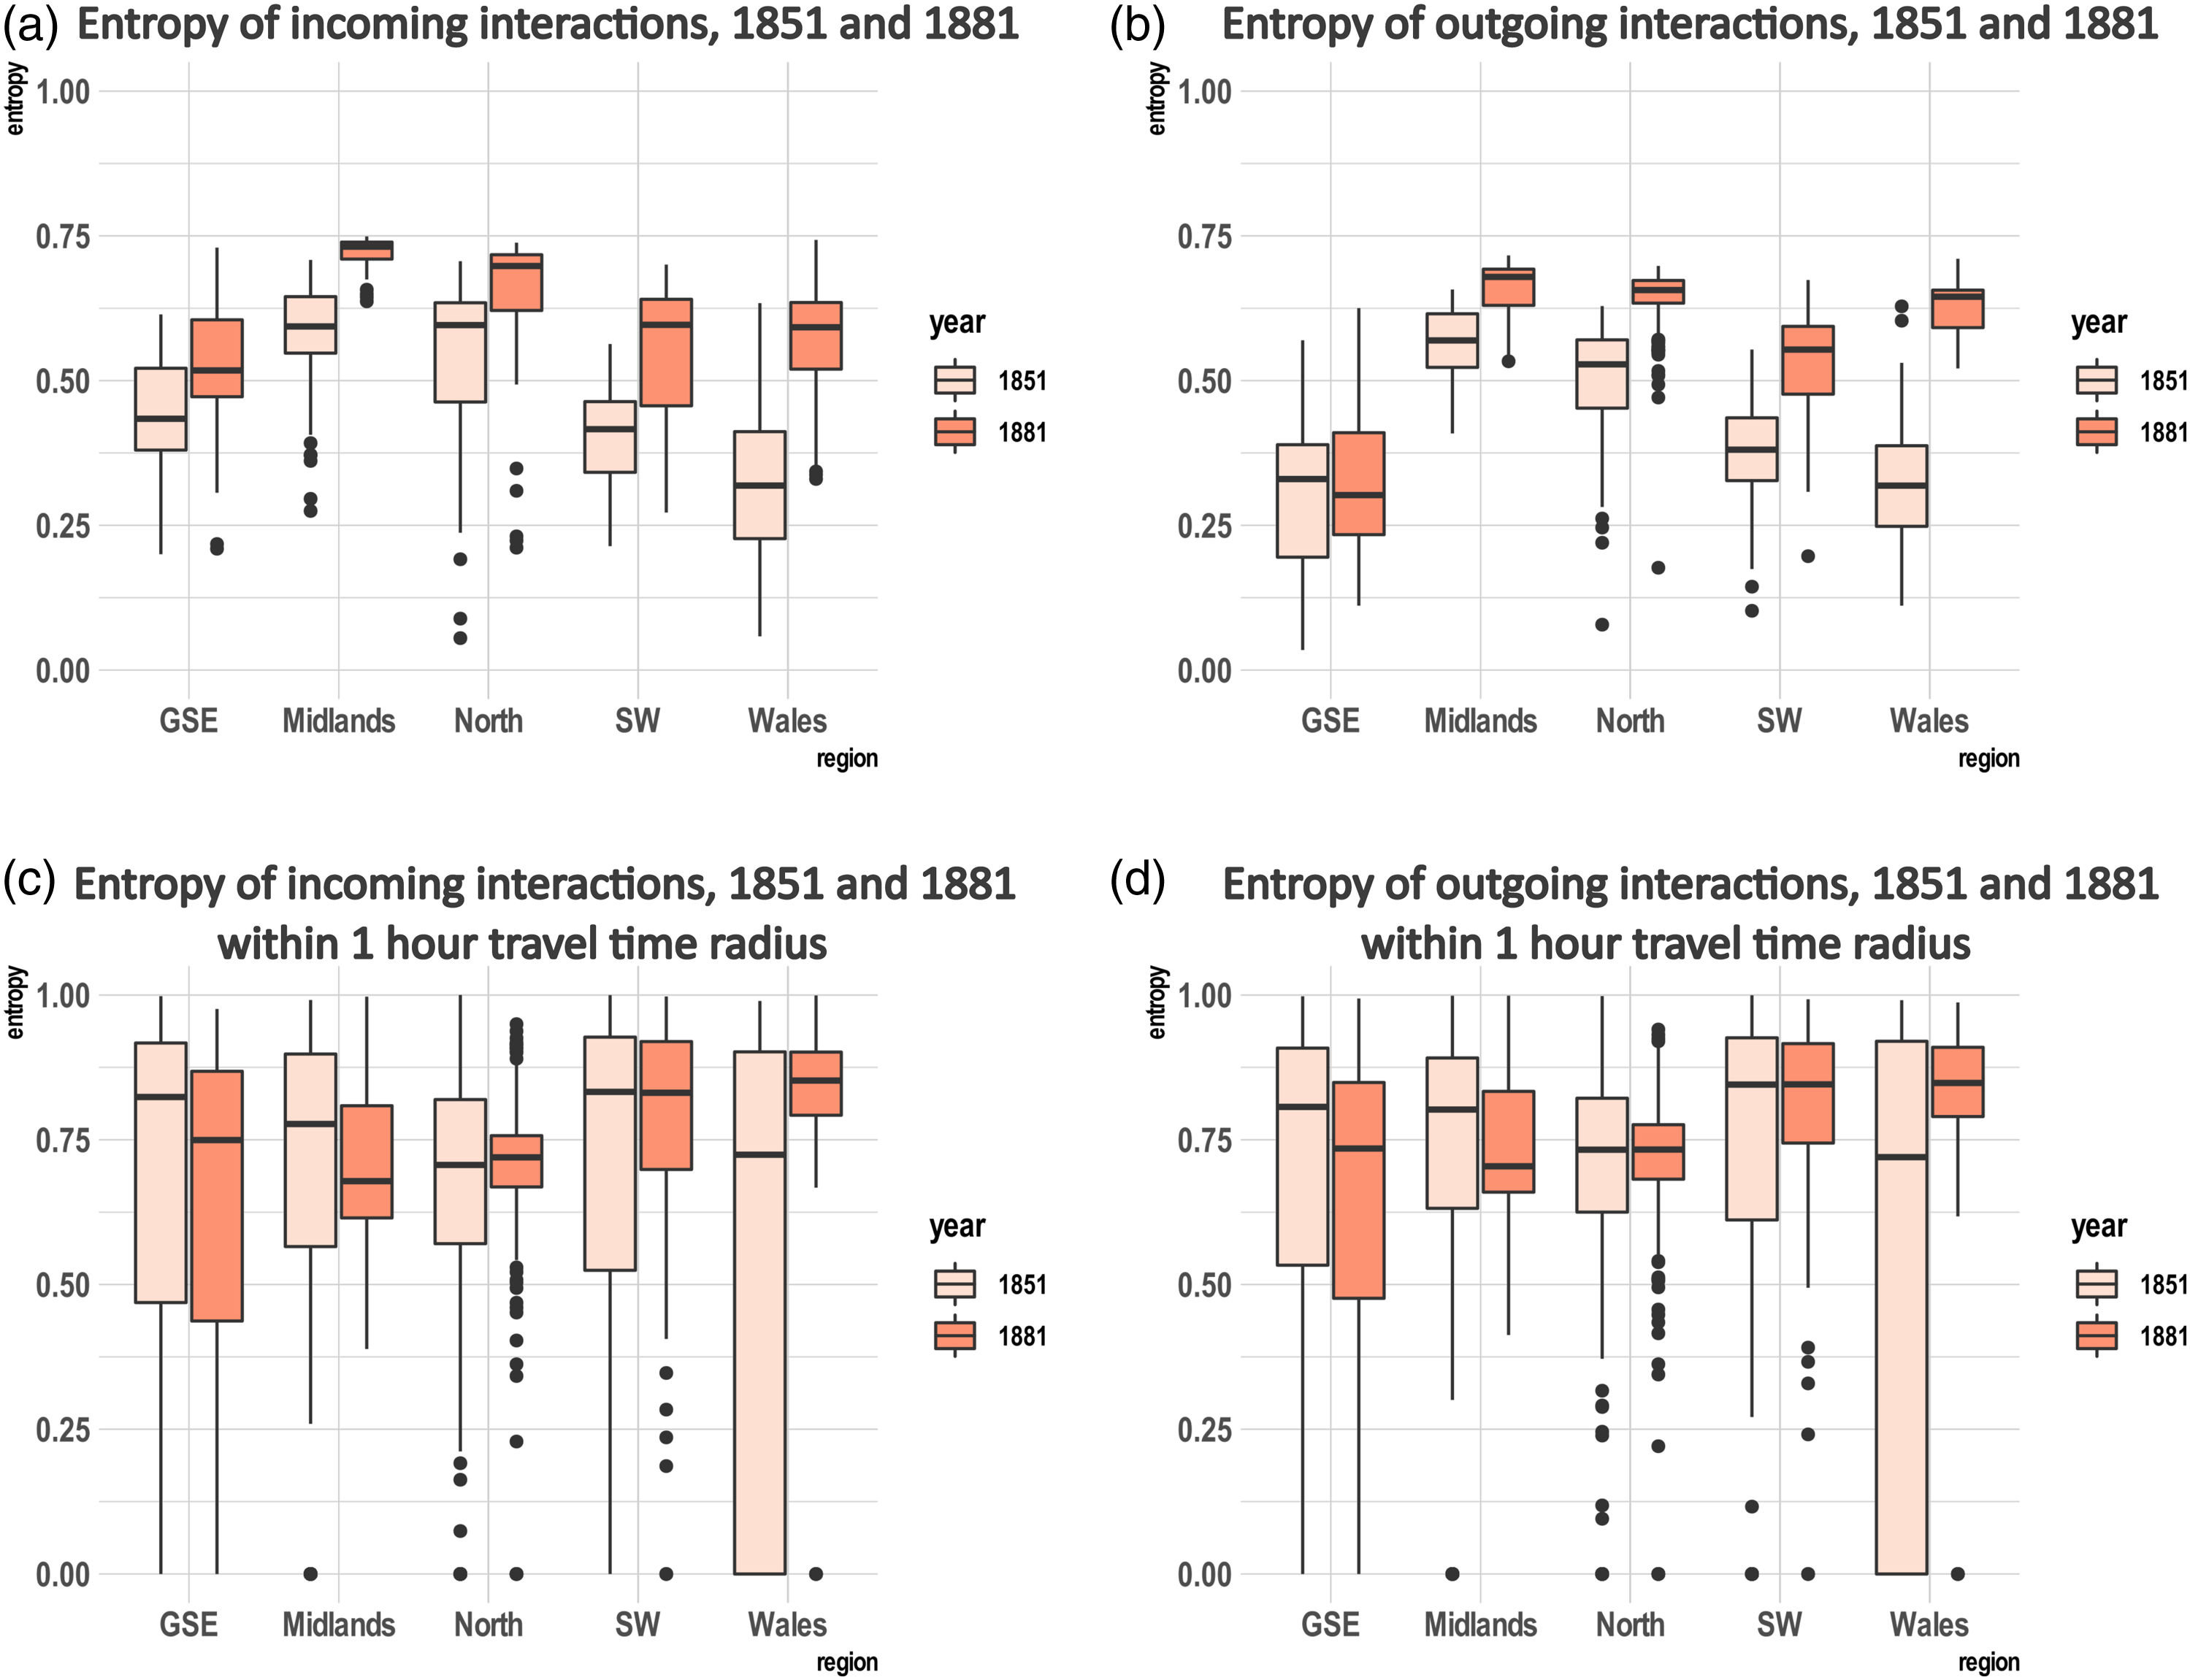
When a maximum travel time of 1 hour is imposed (Figures 5(c) and 5(d)), the picture is more varied. The median, 1st and 3rd quartiles of the entropies of the interactions declined from 1851 to 1881 in the Greater South East, indicating growing local centralisation. In Wales, the median and 3rd quartile greatly increased. This results from the fact that several Welsh cities are geographically isolated and the expansion of the railway in 1881 increased the number of these that were reachable from at least another town in less than 1 hour. The same reason explains the reduction in the interquartile range. Such reduction is also observed for the remaining three regions, which is to be expected given on the one hand the decrease in isolated towns with zero entropy and on the other hand the strengthening of the influence of the main cities that are now reachable by a larger proportion of towns. Remarkable is the decrease in the median entropy values in the Midlands.
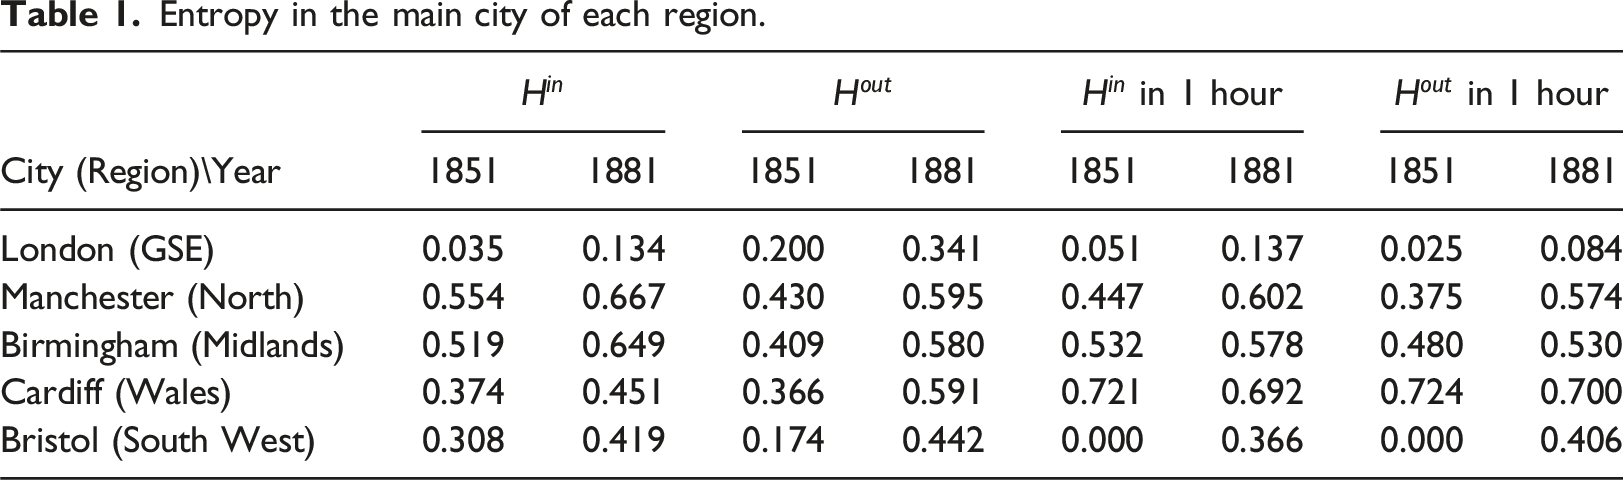
Entropy in the main city of each region.
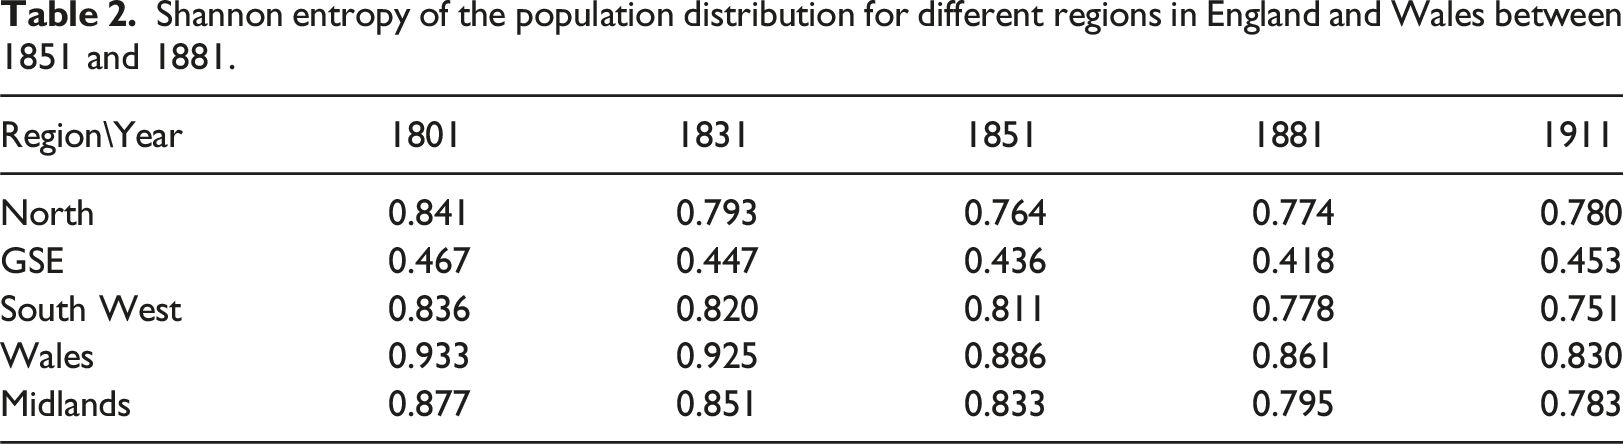
Shannon entropy of the population distribution for different regions in England and Wales between 1851 and 1881.
Discussion
The years between 1851 and 1881 were characterised by rapid urbanisation and industrialisation in Britain, primarily in larger centres (Pooley and Turnbull, 2005; Weber, 1899). They were also decades of major expansion and modernisation of the transport infrastructure. The results of our analysis suggest that while this period witnessed an increased concentration of the population into fewer urban centres, these became better integrated into a more heterogeneous network of connections. The years after 1881 brought on economic restructuring as older industries declined and newer sectors emerged and the growth shifted from large to smaller centres, especially suburban towns (Pooley and Turnbull, 2005). The economic and social factors driving these processes are complex, but certainly the conditions for this decentralisation process were made possible by the capillary expansion of the transport system in previous decades and by the strengthening of connections between larger and smaller centres. Entropy-maximisation models, like the one employed in this analysis, are often used with a dynamical perspective in mind (Wilson, 2008; Wilson and Dearden, 2011). Looking at the greater heterogeneity in population sizes after 1881 in the North and Greater South East (Table 2) suggests that the population growth of cities might eventually have followed the dynamics of their increasingly polycentric most likely interactions. This observation suggests that a network-entropy-based approach to measuring morphological polycentricity might give a complementary description of the state of a region in addition to more traditional methods and shed further light on its subsequent evolution.
Several limitations and opportunities of future expansions emerge from our study. In our computation of travel time, we considered geographical distance divided by the stagecoach speed as a baseline and complemented it with distance along the railway network divided by an estimate of the average railway speed in the year of study. This approach tacitly assumes the presence of direct stagecoach roads between towns and ignores their real conditions (for instance, their steepness). Furthermore, it ignores variations in train travel speed, train frequency, cost, line capacity, line transfer times, and time needed by a typical person to reach a station along the actual street network of the towns. Lastly, it ignores the presence of alternative means of transport, such as ferries or waterway, and thus the effects of multi-modality. Our study aimed to provide a proof of concept, and any improvement in these directions would contribute to strengthen it. The Bradshaw’s Monthly Railway and Steam Navigation Guides provide detailed train timetables for Britain from 1839 to 1961; transforming them into machine-readable data would greatly benefit our study, as well as any other study on historical transport networks and intercity interactions.
Another limitation is that, by drawing a boundary around a set of cities, we isolate them from the rest of the world, which is an unsatisfactory but necessary assumption. In the case of England and Wales, for example, we inevitably neglect the intense international interactions (e.g. migration, commerce) in the 19th century and their impact on inter-county or inter-town interactions.
Finally, the entropy-maximisation principle rests on the assumption that individuals’ interactions at the basis of cities’ interactions can be modelled as those of particles devoid of agency. More realistic models of interactions should attempt to include considerations of individuals’ skills, socio-economic conditions, as well as the complexity of intentionality and decision making, as recently seen in work on cellular automata (Cheng and Masser, 2004).
Conclusion
In this paper, we adapted network entropies as measures of the morphological polycentricity of systems of cities. We analysed in detail the case study of the system of towns in England and Wales and its evolution from 1851 to 1881 and remarked the contrasting pattern of increased population centralisation and growing heterogeneity of potential interactions. We showed how a network and entropy-based approach to morphological polycentricity can account for all the fundamental aspects beyond population size that such measure should capture but are frequently overlooked, including the heterogeneity of space and transport technology, and human-centred notions of distances. It also provides a natural bridge between functional polycentricity and morphological polycentricity, unified through the lenses of network entropy. Future work will aim to improve the framework along the lines mentioned above and adapt the framework to contemporary systems of cities to construct morphological polycentricity measures better suited to a context of increased complexity in physical infrastructure and digital interactions.
Supplemental Material
Supplemental Material - Network-entropy-based morphological polycentricity in 1851-1881 England and wales
Supplemental Material for Network-entropy-based morphological polycentricity in 1851-1881 England and wales by Matteo Mazzamurro and Weisi Guo in Environment and Planning B: Urban Analytics and City Science.
Footnotes
Declaration of conflicting interests
The author(s) declared no potential conflicts of interest with respect to the research, authorship, and/or publication of this article.
Funding
The author(s) disclosed receipt of the following financial support for the research, authorship, and/or publication of this article: This paper is partly funded by: EPSRC Centre for Doctoral Training in Urban Science and Progress (EP/L016400/1), EPSRC DTP (EP/N509796/1).
Data availability statement
Data sharing not applicable to this article as no datasets were generated or analysed during the current study.
Supplemental Material
Supplemental material for this article is available online.
Notes
References
Supplementary Material
Please find the following supplemental material available below.
For Open Access articles published under a Creative Commons License, all supplemental material carries the same license as the article it is associated with.
For non-Open Access articles published, all supplemental material carries a non-exclusive license, and permission requests for re-use of supplemental material or any part of supplemental material shall be sent directly to the copyright owner as specified in the copyright notice associated with the article.