
Abstract
Numerous studies have explored the correlations between house prices and spatial accessibility, but few have delved into the nonlinearities between both. This study uses Cardiff (UK) as a case study and applies interpretable machine learning algorithms, eXtreme Gradient Boosting (XGBoost) and SHapley Additive exPlanations (SHAP), to estimate the nonlinear effects of geometric locational accessibility and street network accessibility on house prices. The findings suggest (1) proximity to the CBD, typically the major determinant of land values in hedonic house price models, does not continuously yield higher prices; (2) street closeness centrality, a network-modelling approach to measuring accessibility, exhibits a more generalised pattern with house prices compared proximity to the CBD regardless of analytical spatial scales. The findings challenge the generalizability of Alonso’s bid-rent theory in accurately portraying the relationship between accessibility and house prices in specific urban contexts, highlighting the importance of re-evaluating classical urban theories in different city contexts using novel measures and modelling techniques.
Introduction
The economic value of accessibility has been a long-standing area of interest for urban and transport researchers (Webster, 2010; Xiao, 2017). Alonso’s bid-rent theory, also known as the bid-rent theory, explains the distribution of land uses and variations in land prices throughout an urban area. As a classic theory in urban studies, it posits that different land uses form concentric circles around the Central Business District (CBD), with land uses that people have a higher willingness to pay for in terms of accessibility situated closer to the CBD (Alonso, 1964; Fujita et al., 2001). This insight has influenced housing research, leading to the recognition that accessibility is a significant factor associated with house prices when using the hedonic price approach. This is generally known as the ‘access-space’ trade-off model, which refers to higher transport costs balancing lower house prices in less accessible areas of the city (Orford, 2000, 2002, Xiao et al., 2016a, 2016b).
In early studies, two types of accessibility measures have been widely used in hedonic house price models. The first one is the conventional planner geometry measure that measures accessibility to specific points of benefits or disbenefits (e.g. proximity to the CBD, parks, hospitals or transit stations). However, the specification of locational measures has been problematic as these locational advantages are often highly interrelated and are defined somewhat arbitrarily by researchers regarding which ones to measure (Xiao et al., 2016a). By contrast, the second measure of accessibility is rooted in street network centrality. This method is based on Space Syntax and addresses the shortcomings of the conventional planner geometry by directly assessing general accessibility, serving as a proxy to encapsulate the various dimensions of human interactions inherent in the urban street network (Hillier, 2007; Hillier and Hanson, 1984). This approach provides a more general understanding of accessibility and its impact on housing prices without prior knowledge of significant locational externalities and effective spatial scales (Xiao, 2017).
Although numerous studies highlight that both geometric measures of specific locational externalities and network-accessibility measures are imperative in hedonic house price models (Chakrabarti et al., 2022; Xiao et al., 2016a, 2016b), one critical question has not been thoroughly investigated: to what extent does accessibility influence house prices? In other words, is there a threshold for accessibility to yield a significant effect on house prices? Intuitively, the effects of spatial accessibility on house prices may differ when it falls into different levels of accessibility, and its effect may be saturated or substantially decayed when it reaches a certain distance. Given the complex geography of locational externalities effect and uneven distribution of local amenities in a contemporary urban context (Batty, 2013), the relationship between accessibility and house prices tends to be nonlinear. However, to our knowledge, no studies empirically investigate the possibility of the nonlinear effect of accessibility on housing prices.
This study aims to bridge the existing research gap by investigating the nonlinear effects of accessibility on house prices in the hedonic house price model using interpretable machine learning approaches. It addresses the following research questions: (1) Do accessibility variables have nonlinear effects on housing prices? (2) Do the effects fluctuate across different analytical spatial scales?
In response, this study first introduces the background of the hedonic house price model and related literature. Then, it describes the methods and analysis results of the study. Finally, it discusses the key findings and concludes the paper with implications and limitations.
Literature review
Hedonic house price model
The hedonic house price model is an econometric method used to estimate the value of a property by examining the different characteristics that influence house prices. This model is based on the principle of hedonic pricing, which suggests that a good or service can be decomposed into the prices of its constituent attributes or features based on the economic principles of utility maximisation (Rosen, 1974). In the context of housing, the hedonic price model considers a wide range of factors that contribute to the overall value of a property (O’Sullivan and Gibb, 2002). These factors can be divided into two main categories: (1) structural attributes: the number of rooms, square footage, age, and overall condition; (2) locational attributes: which refer to a property’s spatial characteristics, such as its proximity to amenities, accessibility to the transportation network, neighbourhood quality, and other environmental factors (Can, 1992; Pope and Pope, 2015; Xiao et al., 2016a). The conventional geometric locational measures in hedonic house price models are often used to represent locational attributes of properties, such as their distance or proximity to specific amenities, accessibility measures to key features of the urban area and local neighbourhood characteristics. These measures typically include Euclidean distances, travel times, or travel costs to various points of interest, such as CBD, schools, parks or public transportation stations. Previous studies suggest that the accessibility to the CBD and the city’s attractiveness contribute to higher house prices (Ahlfeldt and Maennig, 2010).
However, there are several limitations to conventional geometric locational measures. First, the geometric locational measures in the hedonic house price model are insufficient to capture all the effects of location attributes on house prices (Xiao, 2017). Homebuyers have diverse preferences when it comes to locational attributes. Different individuals and households may prioritise and value various aspects of a location, such as proximity to amenities, access to public transportation, school quality and environmental factors (Rodríguez and Mojica, 2009). This heterogeneity in preferences can make it difficult to accurately measure and understand the effects of locational attributes on house prices (Xiao et al., 2016b). Second, Euclidean distances do not necessarily represent the actual travel distances or travel times between locations. They fail to account for the complex street network, topography, and potential barriers, such as rivers or highways, which can affect travel paths (Xiao, 2017). Third, conventional geometric locational measures may not capture the spatial autocorrelation or the dependency between nearby properties. This can lead to biased estimates in hedonic price models, as spatially correlated errors can violate the model assumptions (Orford, 2002).
Street network and house prices
Inspired by Space Syntax, numerous studies have tried to use street network accessibility to understand accessibility-house relationships (Chakrabarti et al., 2022; Xiao et al., 2016a, 2016b). In contrast to conventional geometric locational measures to capture the locational externality effect, Space Syntax focuses on the configuration and connectivity of urban spaces and street networks as a proxy for the multiple dimensions of human interaction that are contained in the urban street network (Hillier and Hanson, 1984). Theoretically, the value of accessibility is itself an aggregation and averaging of many separate sources of negative and positive externalities (Webster, 2010), this suggests that street layout, a product of urban and social development, may serve as a more holistic proxy for spatial accessibility in the context of multi-scaled and multi-centric urban areas (Hillier and Hanson, 1984).
Specifically, betweenness and closeness, as graph-theoretic measures of street network accessibility, are commonly used metrics in investigating the effects of street network accessibility on house prices. Betweenness measures the extent to which a particular street segment or node acts as a connector within a network. It is calculated by counting the number of shortest paths passing through a specific segment or node. A high betweenness score indicates that the segment or node is crucial for connecting different network parts, thereby serving as a critical point for movement and interaction. On the other hand, closeness refers to how easily a location can be reached from all other locations within the network. It is determined by the average length of the shortest paths from a given space to all other spaces in the network. A high closeness score suggests that space is easily accessible from other spaces, indicating a central location within the network. In other words, properties with high closeness values might be more attractive due to their proximity to various amenities and reduced travel times (Xiao, 2017). These two metrics allow for a more comprehensive representation of how people navigate and interact with their environment, accounting for street connectivity, accessibility, and pedestrian or vehicular movement patterns (Hillier, 2007).
A need and opportunity for nonlinear analysis
Since prior studies highlight the complementary role of street network accessibility in correlating the effects of accessibility with house prices, one critical question emerges: to what extent do accessibility factors influence house prices? In other words, are there thresholds for the effect of accessibility on house prices? Previous studies often assume that the accessibility factor has a linear or log-linear relationship with house prices. However, the impact of accessibility tends to be more complex than what is typically pre-defined, with some studies acknowledging the potential for a nonlinear relationship between public transit accessibility and house prices (Jin et al., 2022). For example, an incremental increase in public transit accessibility may not invariably result in a corresponding incremental increase (or decrease) in house prices. Such complexities underscore the need for exploring the potential nonlinear relationship between accessibility and housing prices, given the increasingly complex urban form and uneven distribution of local amenities with respect to multiscaled, multi-centric urban contexts (Batty, 2013).
XGBoost (eXtreme Gradient Boosting), one of the tree-based boosting machine learning algorithms, has gained popularity in recent years for addressing regression problems in various fields, including urban and transport planning (Liu et al., 2023a, 2023b; Zou et al., 2022). In contrast to conventional linear regressions, the XGBoost model can learn complex patterns and relationships from data, making them well-suited for handling nonlinearities and high-dimensional data (Hastie et al., 2009). The XGBoost model offers several advantages over conventional linear regression models. First, machine learning algorithms are known for their excellent predictive accuracy, while the flexible structure of machine learning algorithms allows them to model complex, nonlinear relationships without imposing strict assumptions, leading to more accurate and reliable results in hedonic house price models (Zou et al., 2022). Second, by drawing SHAP (SHapley Additive exPlanations) dependence plots, researchers can identify the most influential intervals in the model, helping to identify the thresholds that have the most significant effects on the target variable (Liu et al., 2023a). Third, the SHAP-explained XGBoost model can estimate spatial effects similar to those in the spatial lag and geographically weighted regression models (Li, 2022). In other words, it is an alternative to spatial statistical models and performs better when considering unknown nonlinear effects. However, to our knowledge, no studies have specifically adopted these techniques to hedonic house price research that considers geometric locational and street network accessibility measures. This study, therefore, aims to fill these research gaps by adopting the XGBoost and SHAP models to explore the nonlinear effects of accessibility variables on house prices in Cardiff, UK.
Methods
Study area and variables
This study focuses on Cardiff, the capital city of Wales, UK, chosen for its data availability and our familiarity with the city’s structure and housing market. As of 2021, Cardiff has a population of approximately 362,310, sharing similar characteristics in size and urban form with other UK cities. This makes Cardiff an apt representation of a British medium-sized town, characterized by a classic concentric urban structure and housing stock. The findings from this study would be indicative of general trends in British cities.
The dataset for this study was sourced from the HM Land Registry for England and Wales, and enhanced with the addition of floor area measures, which have been utilised in prior research (Orford, 2002; Xiao et al., 2016b). The dataset contains the following attributes: property price, floor area, sale year, property type (detached, semi-detached, terraced, flat, or maisonette), new build status, tenure status (freehold or leasehold), and Area Classification for Output Areas (OAC). A total of 16,297 properties sold within the study area between 2001 and 2007 were included in the dataset. The properties selected for this study encompass a representative sample of the Cardiff housing market, including Victorian and Edwardian terraces in the inner city and interwar and postwar semi-detached and detached houses in suburban areas. Due to privacy considerations, the map illustrating the properties under investigation has been consolidated to the Output Area level (as shown in Figures 1 and 2). The closeness of the street network at four different spatial scales. The betweenness of street network at four different spatial scales.
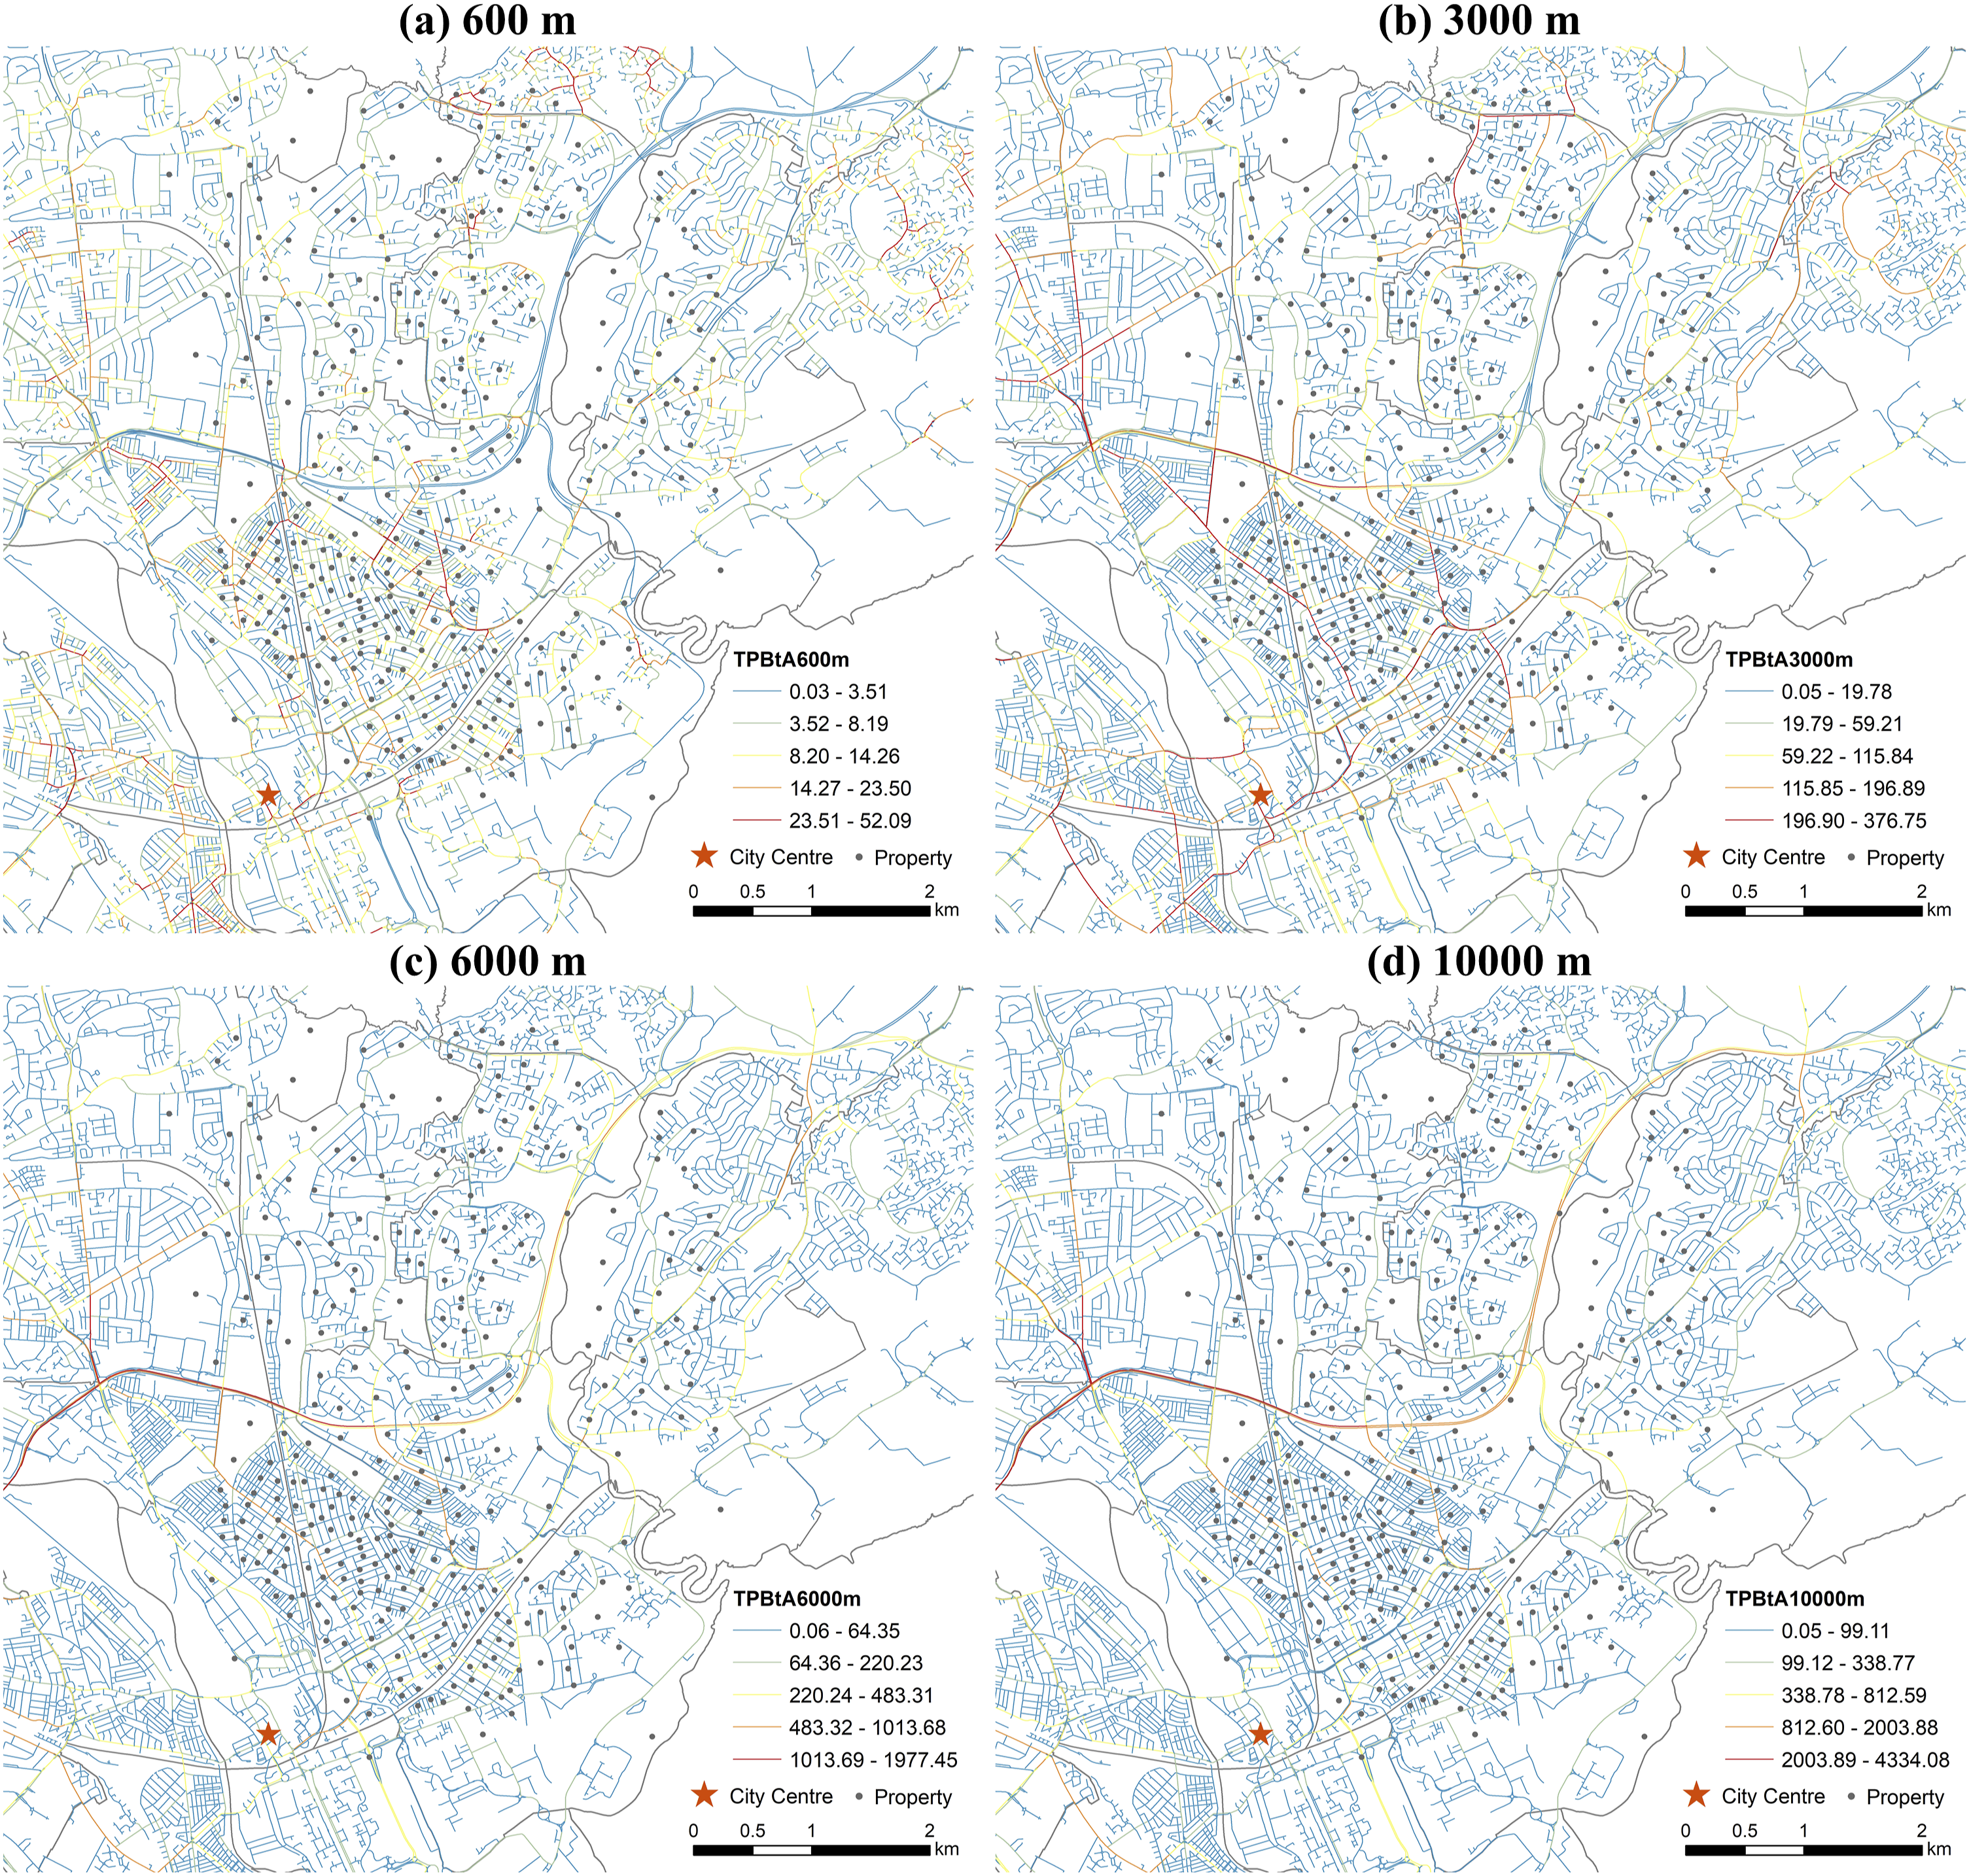
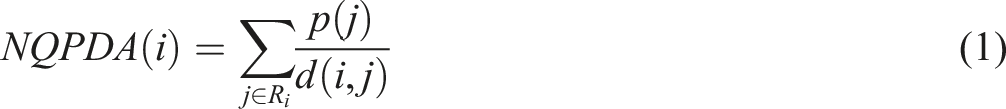
Two categories of accessibility variables were included in this study. The first category refers to conventional geometric measures of accessibility, this was measured using the network distance from each property to the CBD, park, and hospital. The second category refers to street network accessibility metrics measured using Spatial Design Network Analysis (sDNA) based on the street centreline data from Ordnance Survey Mastermap ITN. Similar to Space Syntax, sDNA is a set of advanced spatial analysis tools designed for studying street network in urban research using various graph-theoretic measures such as closeness and betweenness (Cooper and Chiaradia, 2020). In our study, we employ angular distance to assess street network accessibility. Empirical studies have demonstrated that angular segment analysis is efficient and robust in measuring pedestrian movement (Cooper and Chiaradia, 2015; Hillier and Iida, 2005). Closeness and betweenness were calculated by the network quantity penalised by distance in radius angular (NQPDA) as equation (1):

Closeness and betweenness variables were calculated at the following four radii: 600 m, 3,000 m, 6,000 m, and 10,000 m. The choice of four radii as distances corresponding to different human movement scales is based on the idea that people have other preferences and travel behaviour patterns at various spatial scales. These distances are chosen to provide a range of spatial scales that capture the varying degrees of human movement and interaction with the urban environment (Xiao et al., 2016a). By considering these different scales, researchers can better understand how location-specific factors and street network accessibility influence house prices.
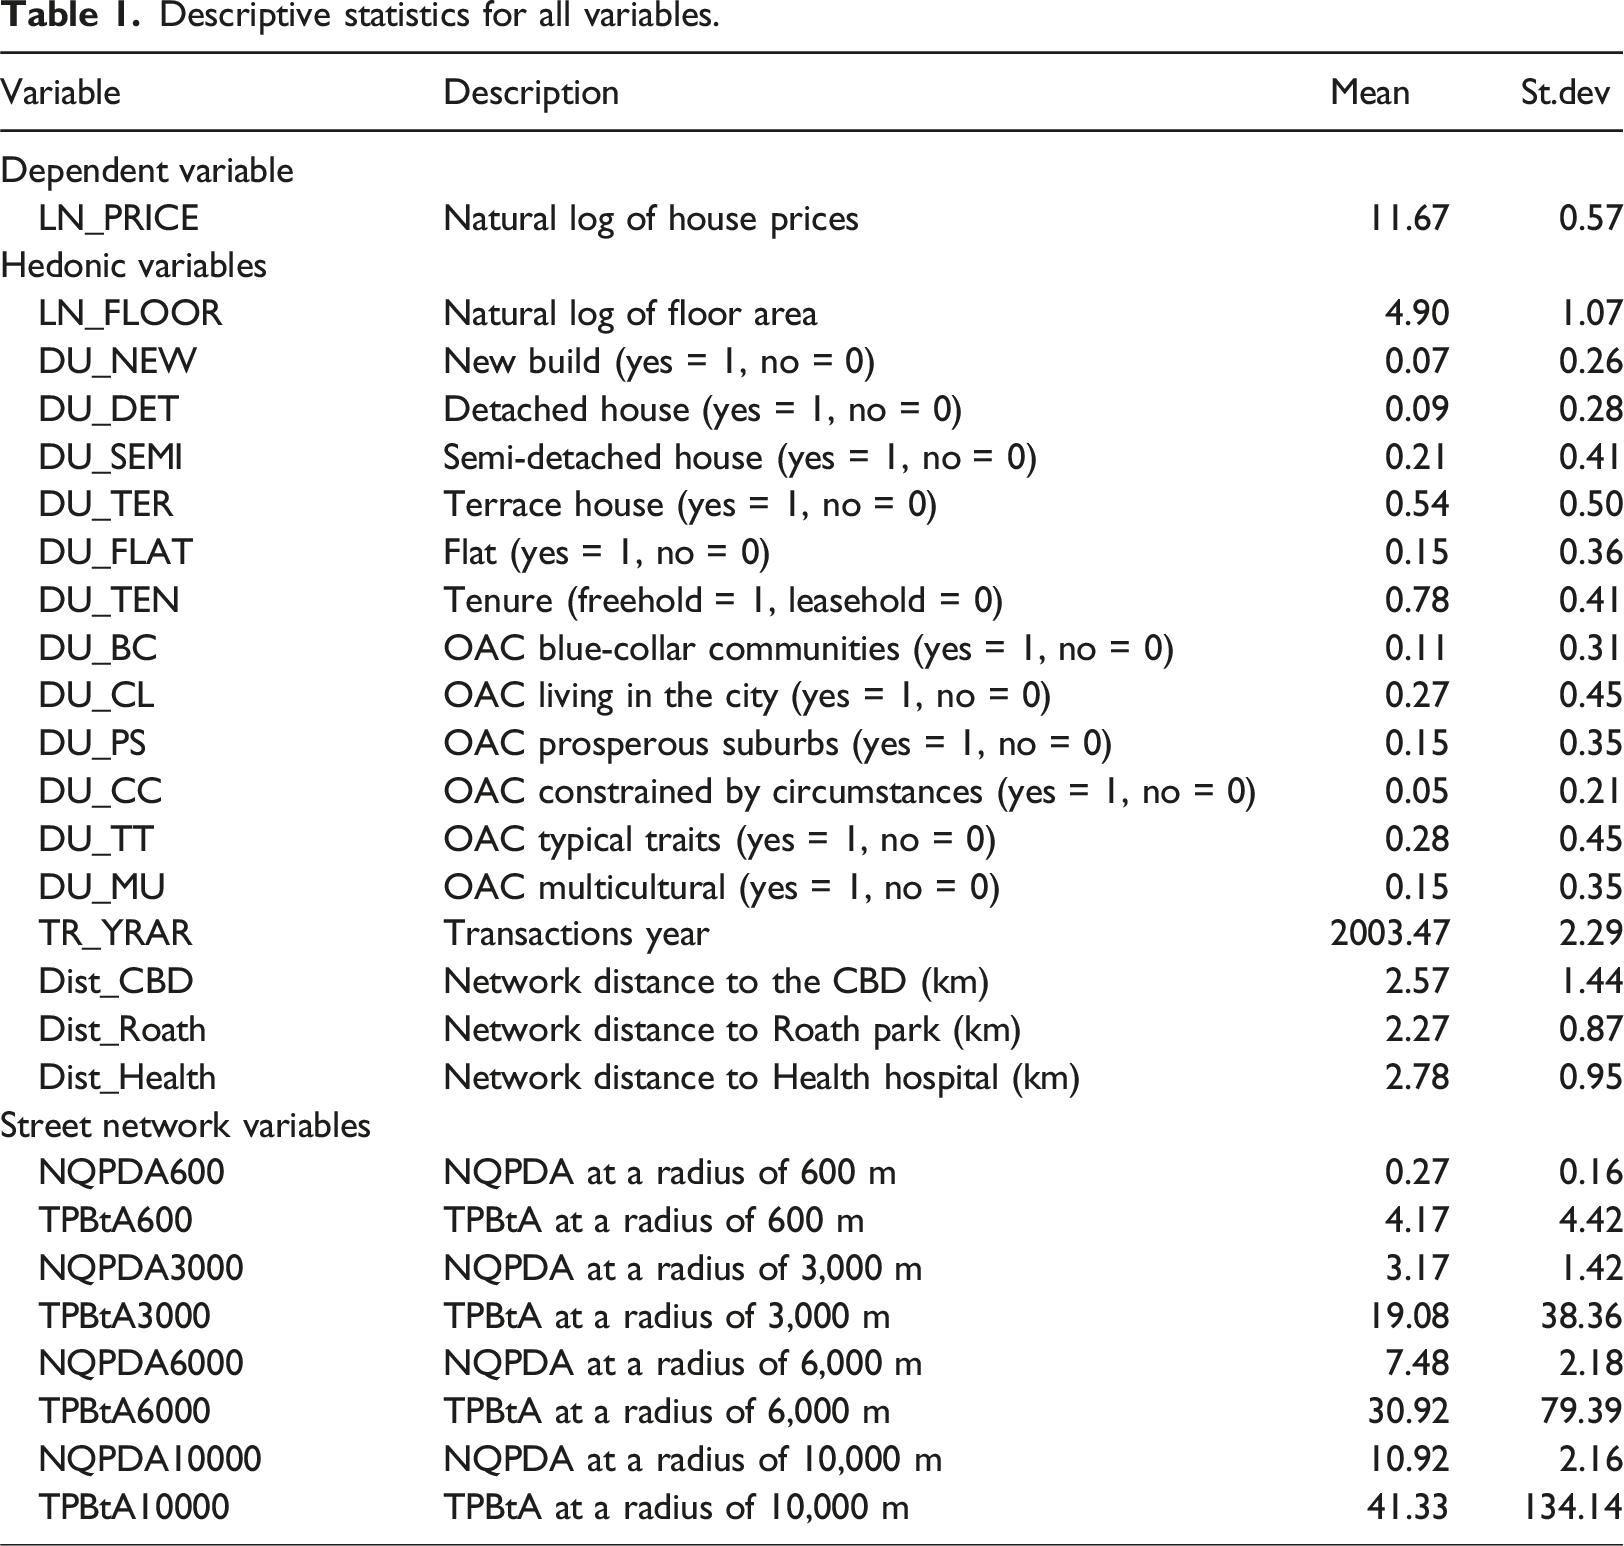
Descriptive statistics for all variables.
Methodology
XGBoost was introduced by Chen and Guestrin (2016), the algorithm was designed to optimise the predictive performance, speed, and scalability of decision tree ensembles, making it suitable for various applications, including regression, classification and ranking problems. This study compared the preliminary XGBoost model results with those obtained with the random forest and gradient-boosting decision tree models. The results confirmed that the XGBoost models outperformed the random forest and GBDT models regarding predictive accuracy and model fit.
In tuning hyperparameters, 90% of the dataset was randomly chosen for training the XGBoost model, while the remaining 10% was reserved for testing purposes. In addition, the study evaluated the XGBoost models with varying values for tree complexity (4, 8, 12, 16, 20, 22) and shrinkage (0.1, 0.05, 0.01) using a fivefold cross-validation procedure. The number of trees was examined by setting the indicator from 5,000 to 50,000 at intervals of 5,000. Ultimately, the XGBoost models gained the best hyperparameters with 50,000 trees, a learning rate of 0.1, and a maximum depth of 22 to prevent overfitting. As the results, the R2, MAE, and RMSE values for the XGBoost model predictions are 0.74–0.76, 0.18–0.19, and 0.28–0.30, respectively.
SHapley Additive exPlanations (SHAP) is one of the methods for interpreting complex machine learning models. SHAP values provide instance-level explanations, meaning they can help explain the output of a model for a specific input. SHAP can offer more local and granular insights into how features impact individual predictions. SHAP values also provide a global measure of feature importance, making it easier to compare the contributions of different features to the model’s predictions (Lundberg and Lee, 2017). Therefore, this study used the XGBoost and SHAP models to investigate the nonlinear effects of street network accessibility on house prices.
Results
Relative importance
Estimation results of the XGBoost models.

RI: Relative Importance.
Nonlinear relationship
Given the focus of this study, we only discuss the SHAP value of the variables of distance to the CBD, closeness accessibility, and betweenness accessibility. Figure 3 depicts the marginal effects of distance to the CBD on predicting house prices across four different spatial scales in the models. All the plots display a nonlinear relationship between the distance to the CBD and house prices, regardless of the spatial scales of analysis. Specifically, SHAP values of house prices decrease slightly as the distance to the CBD increases from 0 to 1.2 km. However, house prices increase within 1.2 km to 2.6 km as the distance to the CBD grows. Then, house prices slightly decrease and are sparse when the distance to the CBD exceeds 2.6 km. This indicates that the effects of distance to the CBD on house prices are not always consistent. The effects of distance to the CBD on house prices.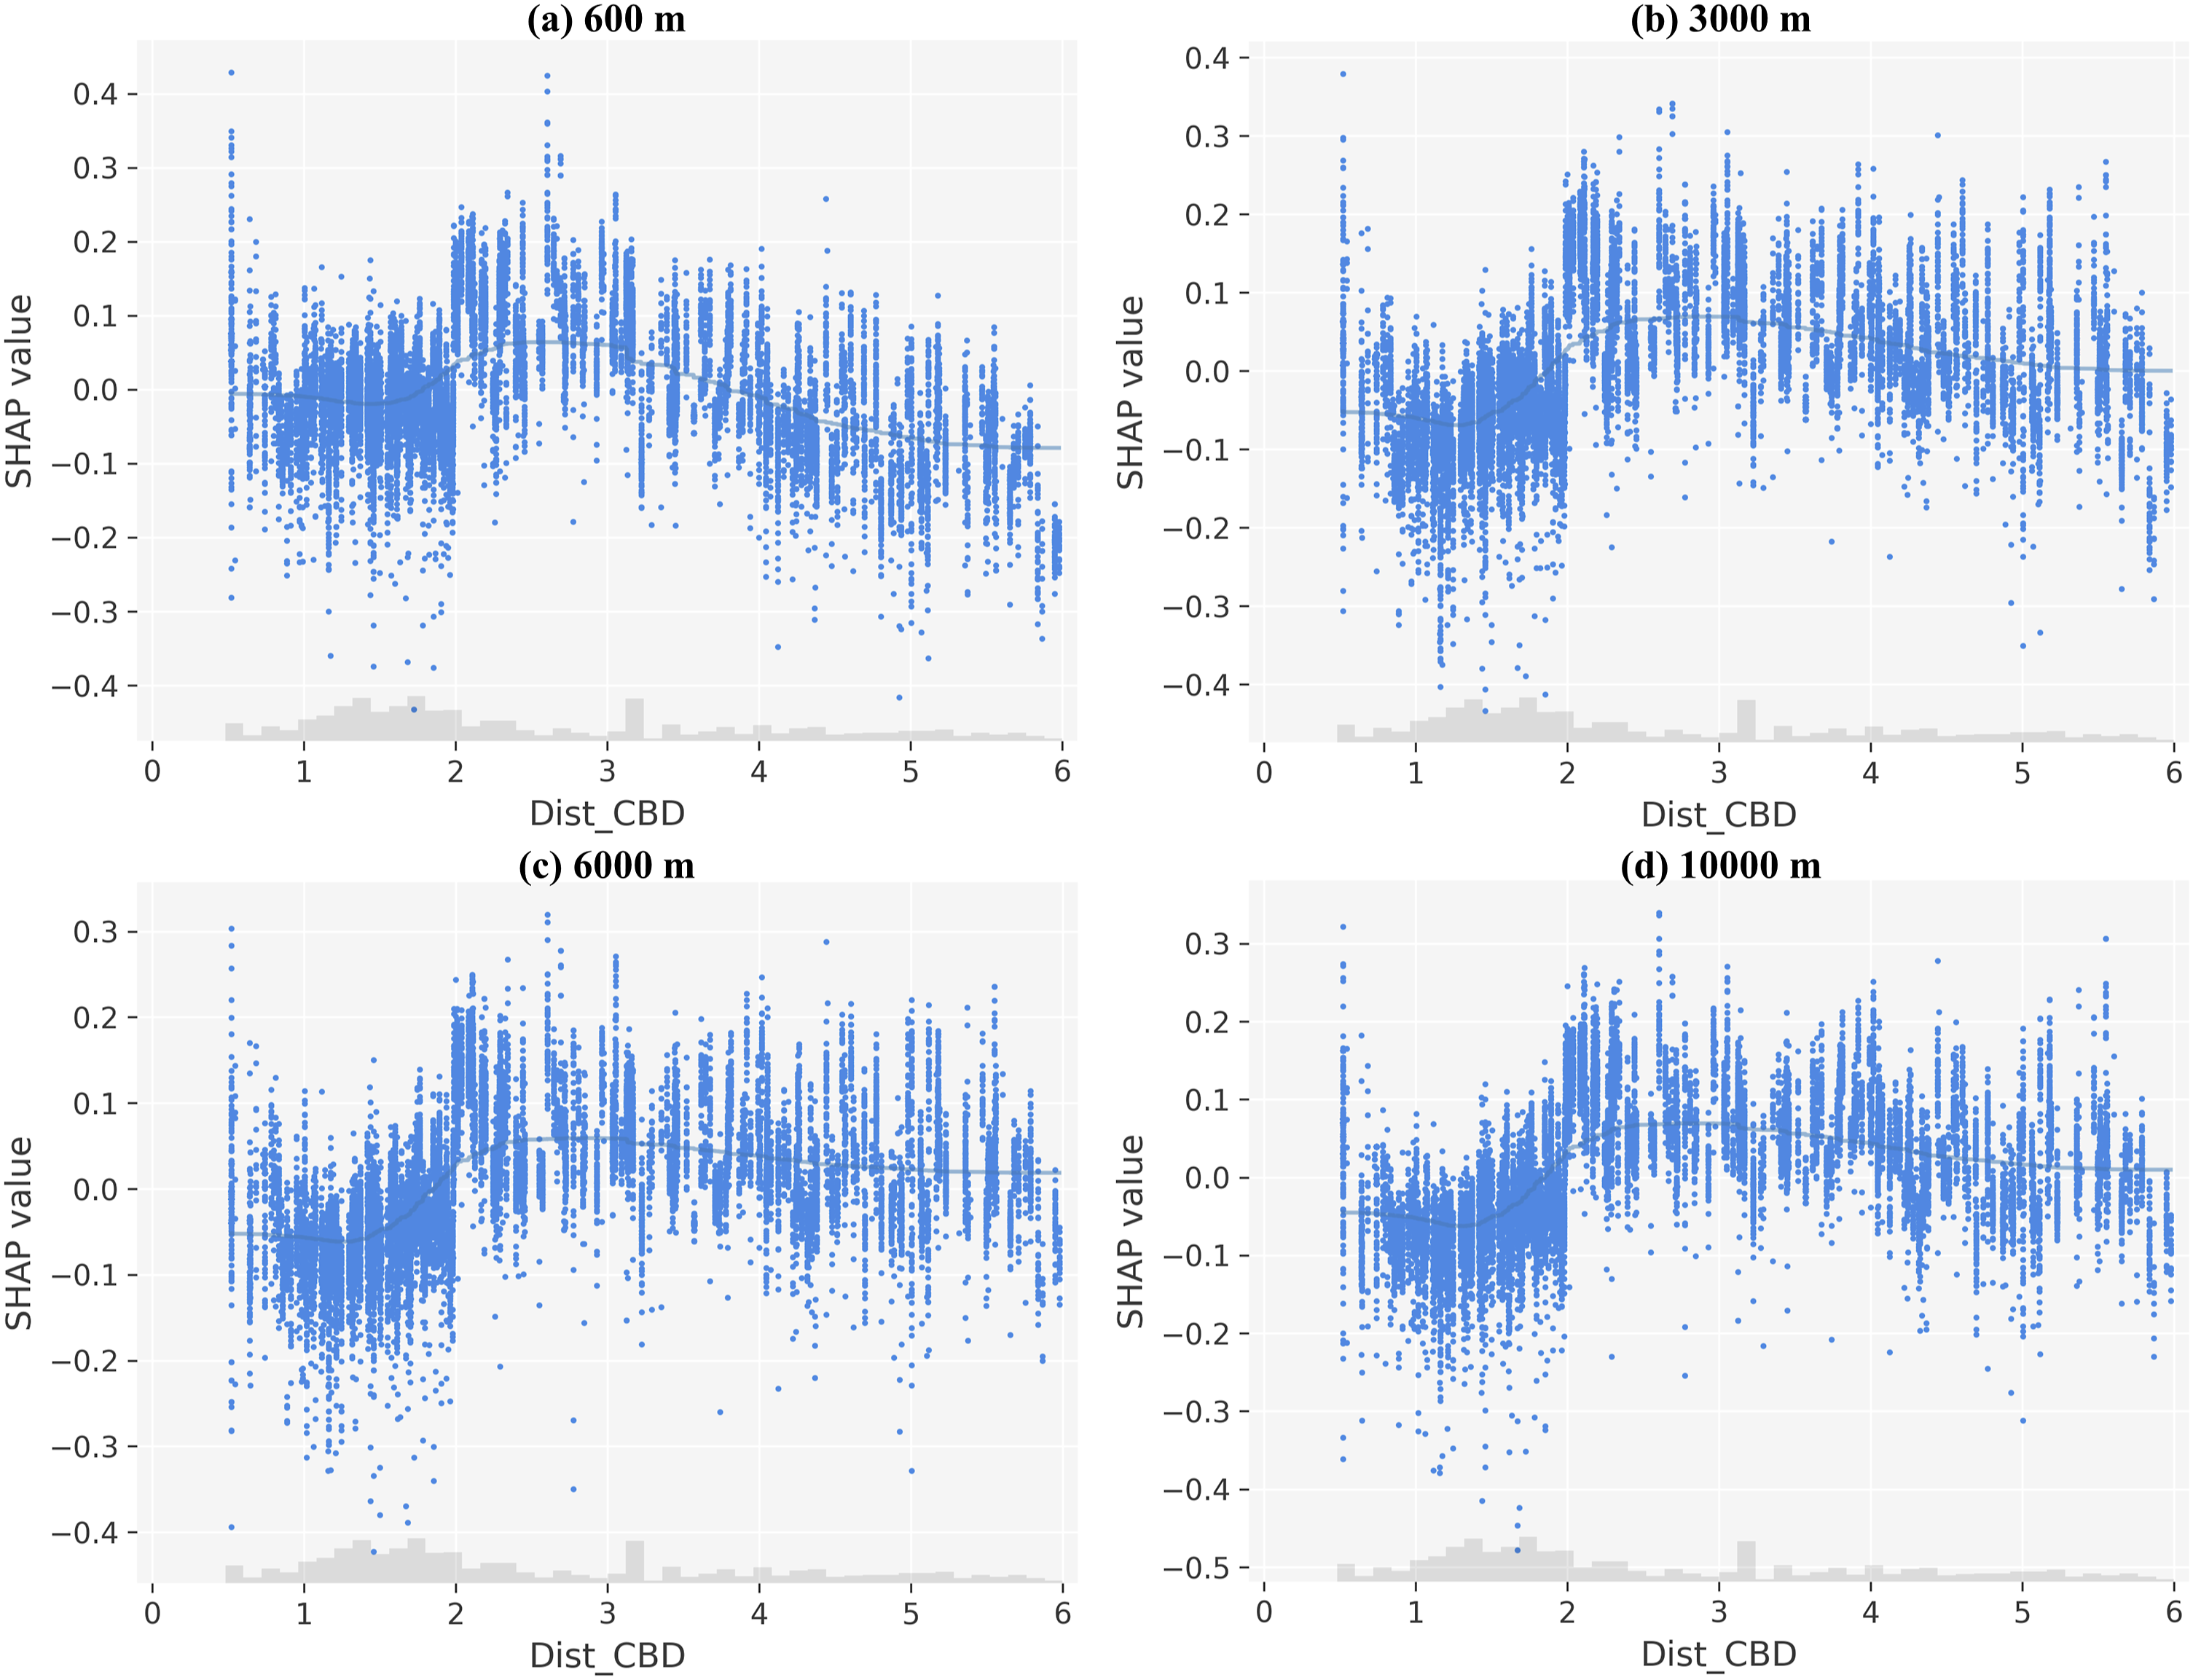
Figure 4 displays the effects of closeness accessibility on house prices across four different spatial scales. All plots indicate a positive correlation between closeness accessibility and house prices for all spatial scales of analysis. This pattern aligns with our expectations and is consistent with Xiao et al. (2016a). Among the four different scales, closeness accessibility within 600 m radii exhibits a more fluctuating pattern compared to the other three models. The results reveal a significant positive relationship between closeness accessibility and house prices from 0 to 0.2. Between 0.2 and 0.5, the curve remains constant. Once it exceeds 0.5, the relationship turns positive again. The other three models share a similar pattern: a generally upward curve with slight fluctuations. Compared with the curves of distance to the CBD, the results suggest that closeness accessibility is a more stable locational attribute factor for capturing locational externalities compared to the distance to the CBD. The effects of NQPDA (closeness) on house prices.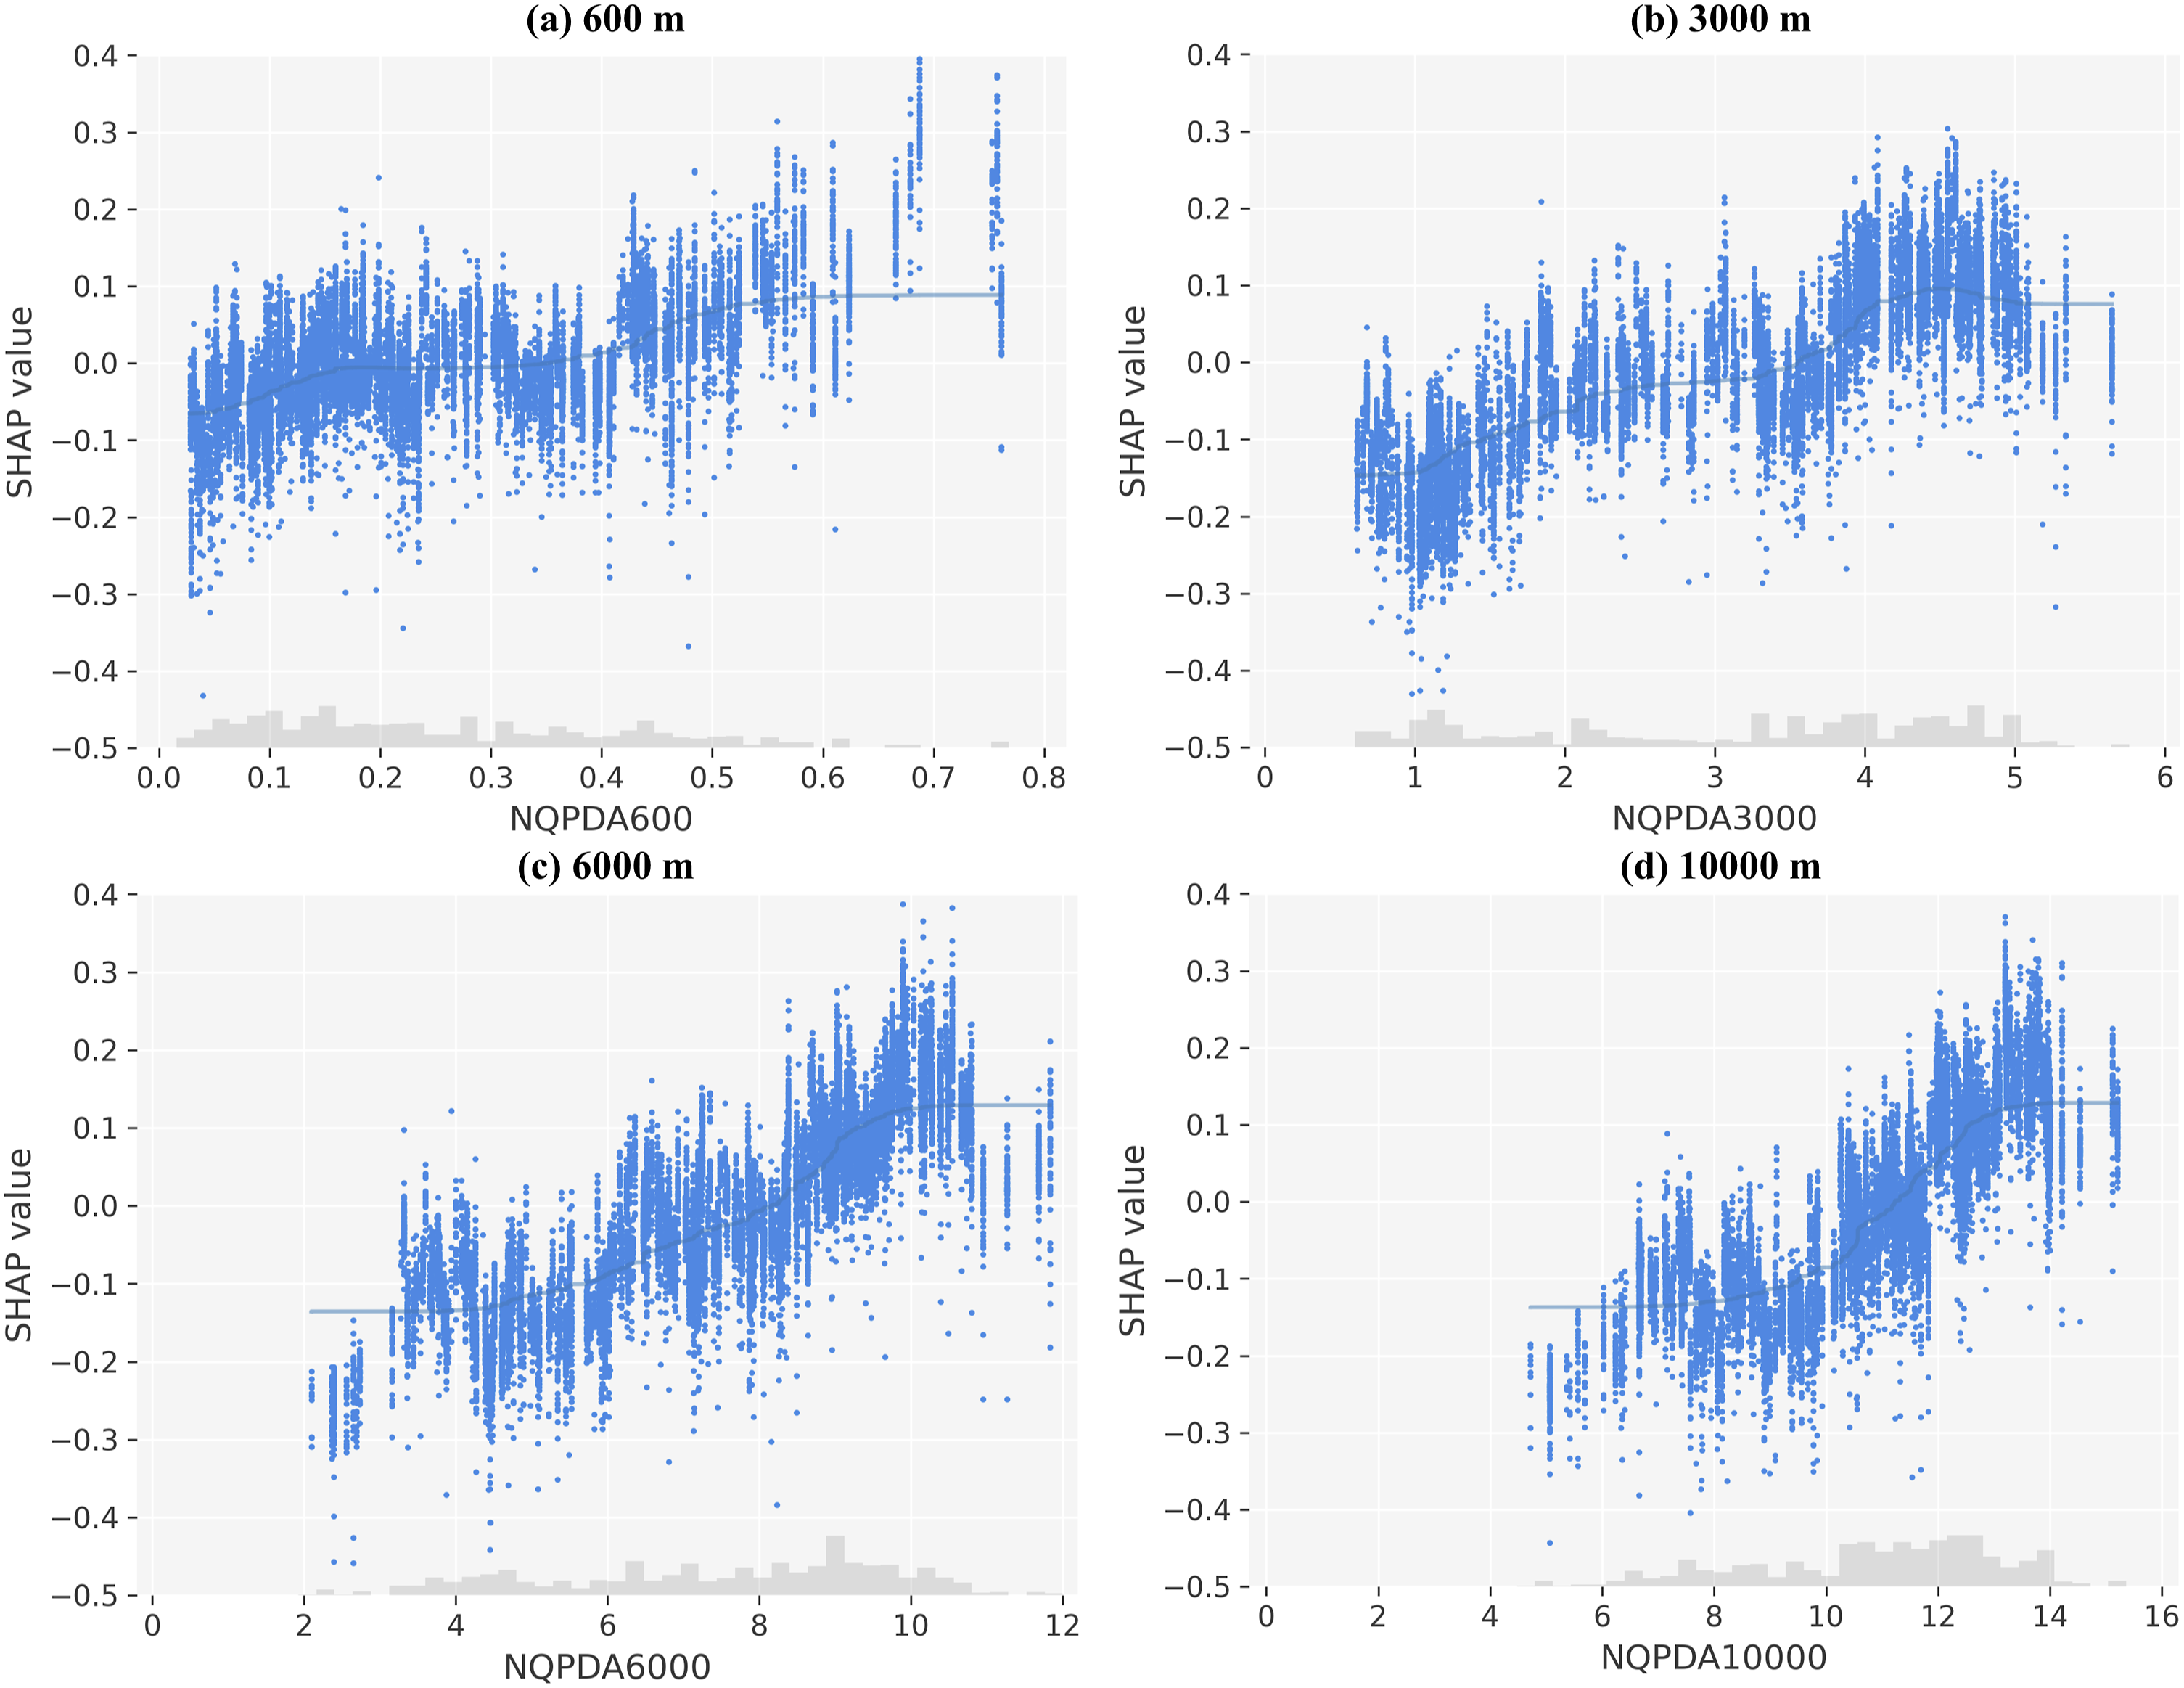
The SHAP plots for betweenness accessibility are shown in Figure 5. The relationship between betweenness accessibility and house prices, as opposed to closeness accessibility, demonstrates a scattered curve with a mild downward tendency across all four different spatial scales. This may explain why betweenness accessibility holds less importance in predicting house prices in Table 2 because the metric tends to indicate the frequency with which a particular street route is likely to be utilised. It is worth noting, however, that the histogram on the horizontal axes reveals many properties with very low betweenness accessibility values, while only a small number of streets are prominent in terms of betweenness accessibility. This indicates significant variation in betweenness accessibility among properties. The effects of TPBtA (betweenness) on house prices.
Discussion
Theoretically, without external influences such as natural environments and government policies, land value is significantly dominated by accessibility. Land value increases for locations where travel costs for access have been reduced (Alonso, 1964; McDonald and Osuji, 1995). This theory has been continuously applied to housing research by incorporating accessibility as a substitute for hedonic factors in predicting house prices. Most literature uses specifications of locational attributes (e.g. distance to the CBD) as a proxy for accessibility in hedonic house price models, yet this measure can be problematic as (1) it is difficult to conceptualise and measure and (2) the effect of this measure tends to be nonlinear.
This study overcomes the limitations by using street-network accessibility measures and machine learning approaches to disentangle the complex relationships between accessibility and house prices. We found that the impact of distance to the CBD on house prices does not always follow a simple linear pattern (see Figure 6), which is somewhat counterintuitive to our expectations and existing theory. Alonso’s bid theory posits a negative correlation between the distance to the CBD and house prices, consistent with the access-space theory of land value. This theory has been empirically found in cities such as Shanghai (Zou et al., 2022), Nanjing (Xiao et al., 2016b) and Seoul (Kang, 2019). The Alonso model and the empirical results.
A possible explanation may be heterogeneous preferences. In developed countries like the United States and Europe, residents prefer living in suburban areas due to the better environment and more spacious living spaces. Suburban areas tend to feature larger homes with more expansive yards than their urban counterparts and often boast abundant green spaces, parks, and outdoor recreational opportunities. This abundance of space and nature, usually lacking in city centres, can contribute to higher housing prices in suburban and rural areas. Thus, the appeal of suburban living may often extend beyond the confines of the home itself, encompassing the surrounding environment and lifestyle opportunities (Clark and Huang, 2003).
Contrary to this, individuals and households residing in China and other East Asian countries typically prefer shorter commuting distances, easy access to public transportation, and proximity to amenities for daily needs (Li et al., 2019; Wang and Lin, 2014). This preference persists despite the negative externalities that high-density living may bring, such as crowded conditions, noise pollution and less appealing natural environments. These conditions have shaped the built environment and urban landscape they inhabit today and have cultivated a greater tolerance for high-density living than their counterparts in Western countries (Wu, 2015).
Additionally, this study finds that street closeness accessibility consistently contributes to increased house prices, demonstrating a stable upward curve. This result substantiates the advantage of using measures of street closeness accessibility as more robust predictors of locational valuations compared to proximity to the CBD (Ozuduru et al., 2021; Pan et al., 2018; Webster, 2010). There are two possible explanations for this outperformance. First, street closeness accessibility often indicates how readily and widely residents can access services and opportunities, including jobs, schools, hospitals, shops and recreational facilities. As a result, increased accessibility to these amenities enhances a property’s desirability, leading to higher housing prices. According to Space Syntax theory, more integrated spaces tend to be more frequently used, which could attract more services and amenities and ultimately lead to higher property values (Hillier and Hanson, 1984). In comparison, the integration of locational attributes into hedonic house price models can be unstable, considering their wide range and the inconsistency in their identification and measurement (Xiao et al., 2016a).
Second, as one of the foundational theories in neo-classical microeconomics, Alonso’s bid-rent theory evolved from von Thünen’s model to emphasise an ‘access-space’ trade-off. This model describes a balance between transportation costs and land rents, developed under the presumption of a monocentric city situated on an isotropic plane with a perfectly competitive housing market. However, this assumption does not fully capture the complexities of cities. The predetermined specification for locations may not adequately represent ‘access’ in the context of urban systems. In contrast, using a closeness street network for accessibility measurements, employing aggregated algorithms to calculate potential opportunities or attractiveness, offers a more appropriate approach. Because this method considers both the ease of interaction and the availability of opportunities (Hansen, 1959: 73), which been intricately woven into the fabric of the urban street network (Hillier and Hanson, 1984).
To validate our main findings, we further utilised direct line distance to measure proximity to the CBD and geometric measures for street network accessibility in our robustness analysis. The analysis revealed consistent nonlinear relationships between proximity to the CBD and house prices, and an upward pattern between street closeness centrality and house prices. This robustness analysis confirms the main findings.
However, while street network accessibility is a useful metric for measuring accessibility, it is crucial to recognise that these metrics may encounter issues related to distance, scale, and the selection of transport networks (Law et al., 2012; Ratti, 2004), which has long been discussed these issues in Space Syntax research (Pafka et al., 2020). Our study attempted to mitigate potential biases using various scales and distance measures. Nonetheless, recognising and addressing these concerns is still crucial, as it greatly determines the effectiveness of this tool in diverse urban planning and analysis contexts.
Conclusions
By utilising the XGBoost and SHAP techniques and taking Cardiff as a case study, this study investigated the nonlinear effects of street network accessibility on house prices across different spatial scales. The study offers two novel contributions to the literature and insights into house policies. First, this study relaxes the assumption of generalised linearity and confirms the nonlinear effects of accessibility metrics on house prices. The results show that the effects of the distance to the CBD on house prices demonstrate a nonlinear relationship regardless of analytical scales. This finding potentially challenges the classic Alonso’s bid-rent theory, which suggests a downward-sloping land value curve with proximity to the CBD. Our findings suggest that homebuyers and developers should not solely focus on proximity to the CBD as the primary determinant of house price evaluation.
Second, this study reveals a more stable pattern in the relationship between house prices and street closeness accessibility compared to proximity to the CBD. The effects of street closeness accessibility on house prices demonstrate a generally upward curve with slight fluctuations regardless of analytical spatial scales. In contrast, the effect of the street betweenness accessibility metric on house prices only shows a scattered curve with a mild downward tendency across all four different spatial scales. Webster (2010) emphasized the concept of ‘capitalized’ accessibility within the street network. Building on this foundation, our study delves deeper, exploring the specific aspects of street network accessibility and the extent to which accessibility contributes to the capitalized value of the street network.
From a policy perspective, the study highlights that enhancing street closeness accessibility in areas inhabited by low-income households could be an effective strategy to address spatial inequality (Jin et al., 2022), local governments could incorporate street network accessibility into their affordable housing initiatives. For example, legislative mechanisms could be employed to encourage developers and investors to construct affordable housing, such as a prescribed percentage of homes or apartments, within areas of high street network accessibility. Another innovative approach could be the introduction of an infrastructure levy (Shanahan et al., 2019), which allows local authorities to impose a tax on development projects that could fund the enhancement of the accessibility of the surrounding street network. This method alleviates the government’s responsibility for funding public projects and provides economic benefits for developers through enhanced accessibility.
Several questions warrant further investigation. First, this study was conducted in Cardiff, a city characterised as monocentric and post-industrialised, the conclusions and findings may primarily apply to cities with similar urban structures, population levels, and household living preferences. To broaden the applicability of our research, future studies are encouraged to utilise the same framework and techniques in larger cities with more intricate urban configurations. Second, this study only considers the relationship between street network accessibility and house prices. It would be interesting to investigate how commercial, industrial, and other economic activities have been affected by street network accessibility, helping update Alonso’s bid-rent theory and other classic urban theories in contemporary cities.
Footnotes
Acknowledgements
The authors thank Levi Wolf (Editor) and the two anonymous reviewers for their constructive comments, which considerably improved the article.
Declaration of Conflicting Interests
The author(s) declared no potential conflicts of interest with respect to the research, authorship, and/or publication of this article.
Funding
The author(s) disclosed receipt of the following financial support for the research, authorship, and/or publication of this article: This research was sponsored by the National Natural Science Foundation of China (No.5207120292) and the International Exchange Program for Graduate Students, Tongji University (No. 2023020023).
Data Availability Statement
The data that support the findings of this study are available on request from the corresponding author.