
Abstract
Recent years have witnessed an increasing interest in large-scale agricultural land acquisitions in developing countries. The accompanying socio-economic implications have been areas of debate among politicians, policymakers and development agents. This paper argues that the traditional way of simulating the impacts of these investments in developing countries is misleading as the approach implies that the new investments are identical to the semi-subsistence way of farming that dominates agricultural practices in the host countries. In this study, we incorporate the peculiarity of large-scale agro-investments into an existing database for economy-wide models, i.e., social accounting matrix (SAM), and capture welfare and distributional outcomes properly. SAM-based multiplier models applied to Ethiopian data justify the need to account for the peculiarity of the investments in terms of production technology and their geographic distribution.
Introduction
Since the global food price shock of 2008–2012, large-scale land acquisitions have been expanding in the developing world, specifically in sub-Saharan Africa (Noltea & Ostermeier, 2017). Increased demand for biofuels (Deininger, 2013), food security concerns in investors’ countries (Hallam, 2009) and growing demand for food and changes in consumption behaviours in most emerging economies (Anseeuw et al., 2012) also contribute to the growing interest on large-scale land acquisitions. Cotula et al. (2009) defined large-scale land acquisition as the purchase of ownership right or the acquisition of use right of agricultural land, for instance through lease or concession, whether short term or long term. According to a report by the International Land Coalition (ILC), large-scale land acquisitions exceeding 200 hectares reportedly approved or under negotiation from 2000 to 2011 alone cover at least 203 million hectares of land worldwide (Vhugen & Gebru, 2012).
Africa is one of the main destinations of large-scale land deals, where land leased away by the four main countries—Ethiopia, Mozambique, Nigeria, Sudan and Liberia—reached over 11 million hectares between 2004 and 2010 alone, excluding the acquisition of land less than 1,000 hectares (World Bank, 2011). This is equivalent to about 20% of the current level of agricultural land under cultivation in these countries. 1 Despite this new influx of large-scale land acquisitions, these destination countries are characterised by prevalently semi-subsistence agriculture and acute poverty and food insecurity. The poorest of the poor in these countries reside in rural areas, depending on land as the basis for their livelihoods.
Owing to the lack of data and the fact that most of the projects are still in the implementation phase, the impacts of these investments on poverty and income distribution are still less understood making the debate of whether large-scale agricultural investments (LSAIs) benefit the host economy and local households to continue to remain a hot topic among politicians, policymakers, development agents and the entire community at large. The proponents of LSAIs stress that these investments have the potential to promote economic activity, create employment and livelihood opportunities (Baumgartner et al., 2015; Kleemann & Thiele, 2015), and enhance access to infrastructure, allow diffusion of skills and stimulate transformations of the local economy (Cotula et al., 2009; Deininger & Xia, 2016). In contrast to this, others fear that large-scale land acquisitions can harm the indigenous people, endanger indigenous farming practices, affect the livelihoods of small-scale farmers (Li, 2011; Kleemann & Thiele, 2015), cause natural resource degradation and exploitation (Porsani et al., 2018), ultimately intensifying domestic food insecurity, fuelling local conflicts. Despite this emerging volume of evidence, our knowledge of the potential benefits and costs of LSAIs is largely at its infancy stage, making the determination of the net effect of these investments an empirical pursuit (Baumgartner et al., 2015; Noltea & Ostermeier, 2017).
Looking at the current nature of the LSAIs and the structure of local economies in the destination countries, two of the side effects are worth elaborating. The investments can provide employment opportunities for the local community, potentially increasing their incomes. This, however, can be translated to increased demand for food driving aggregate demand to move up. Unless domestic supplies of these commodities increase at least proportionately, which may not happen as most of the LSAIs target the export market, too much money will be chasing too few food commodities causing high food prices in the domestic market. Further, the land used for these investments is usually an indispensable source of non-agricultural income for most indigenous people; hence, redistributing the land to investors means the incomes of these people are compromised.
LSAIs can have far-reaching economy-wide and distributional implications as the effects can spread over the whole economy (Femenia, 2010; Larson et al., 2013). In such situations, impact assessment using a computable general equilibrium (CGE) model has long been recommended (Newbery & Stiglitz, 1981). Nevertheless, the application of economy-wide models on the impact of these investments on livelihoods in African economies is currently limited. Most of the existing works are exploratory studies using locality-level case studies. Deininger and Xia (2016), Baumgartner et al. (2015) and De Zoysa (2013) are among the community-level studies in Africa. Meanwhile, Seneshaw (2012), Ferede et al. (2013) and Ardnt et al. (2010) provide a detailed investigation of the social and economic implications of large-scale land acquisition at a country-wide level.
Ferede et al. (2013), Seneshaw (2012), Cororaton et al. (2010) and Arndt et al. (2010) applied models which used social accounting matrices (SAMs) as databases and attempt to analyse the controversial issue of the recent move by multinational corporations’ acquisitions of farming lands in structurally food insecure developing countries. These studies examine the income, distributional, poverty and macroeconomic impacts of these investments at the global and host country level by shocking an existing sector by the level of the planned investment. By doing so, the studies implicitly assume that the new multinational agricultural investments are identical to existing sectors in the host economies in terms of input use, the geographic distribution of the activities, and employment composition.
In reality, existing agricultural activities in most host countries such as those in Africa and developing South Asia are quite distinct from the new large-scale investments in terms of production technology, utilisation of output and geographic distributions, requiring modifications of the existing SAMs before undertaking SAM-based analysis. In contrast to the LSAIs, semi-subsistence agriculture which dominates most destination countries is characterised by low-input, traditional farming the greater share of output is used at the farm household level (Ferede et al., 2013). To this end, this study extends an existing SAM for Ethiopia (Aragie, 2014) by introducing a new hypothetical sector producing a hypothetical commodity. The study goes further and compares multiplier values derived from a SAM that separately introduces the new investments with those derived from the baseline SAM.
The study shows that this approach of introducing a hypothetical new sector in a unique way better reflects the regional differences in the impact of large-scale investments on land on household and factor incomes by fully mapping the geographic distribution of the investments within the country. Analysing the impact of these investments through an existing sector tends to obscure the actual impact on factor and income distribution as the current pattern of production differs from the actual destinations of the large-scale agricultural farms. The comparative analysis conducted shows that modifying existing SAMs is desirable when dealing with the impact of a new sector that will potentially disrupt the existing production relationship, input use and income distribution.
The State of LSAIs in Africa
Trend and Size of Large-scale Land Investments
Although large-scale land transactions are not new in Africa, it is after the 2007/8 surge in international food prices coupled with further stimulating factors such as growth in demand for food by emerging economies and the resurgence of biofuel as a source of energy that these transactions grew in a significant manner leading to a new wave of scramble for big agricultural lands. Africa has been the target of these investments owing to the deep interest of African governments to attract investment and due to a relative abundance of underemployed agricultural land in the continent. Most transactions on large-scale commercial farms involve the distribution of the available land which has been used less intensively mainly for non-farm activities. Nevertheless, this resource incidentally plays a significant role in rural incomes, especially in the absence of sufficient off-farm employment opportunities and insurance against risks (Baumgartner et al., 2015; Porsani et al., 2018).
Analysis of the trend and size of large-scale land investments is still rare. The lack of reliable data is the main reason for this (Baumgartner et al., 2015). Table 1 provides indicative information on the total number of projects and area of land transferred in selected African countries between 2009 and 2010. It should be noted that due to scarcity of data and since investments below a threshold level are not usually reported, the figures could deviate across sources and also understate the real magnitude of large-scale land investments. Over the period, more than 11 million hectares of land have been transferred to the hands of large-scale investors on land in Africa. Of this, about 59% is taken up by domestic investors ranging from 7.3% in Liberia to 97% in Nigeria. The remaining is procured by investors from foreign countries. There were 1,136 projects, of which 70% are in Ethiopia and Mozambique. Seventy-nine per cent of the projects are domestic, indicating that domestic projects are smaller in area size. In this data classification, those joint investments above 50% of holdings by domestic investors are treated as domestic and vice versa.
Land Size and Origin of Investors in Selected African Countries.
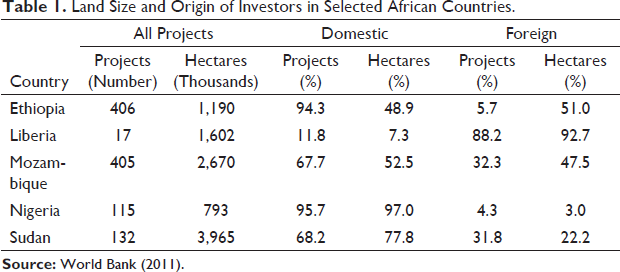
A study by Cotula et al. (2009) on five inventory countries—Ethiopia, Liberia, Mozambique, Nigeria and Sudan—shows that 87% of the capital investment by large-scale investors is used for producing food crops while the net is allocated for biofuel production. The amount of investment capital distributed for food production is as high as 98% in Ethiopia. The same study indicated that about 70% of the land is allocated to produce with the intension of exporting above 25% of the output.
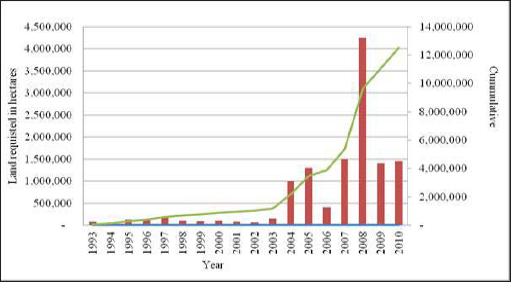
To attract even more investments, the Ethiopian government has recently enacted regulations and provides several preferential treatments such as import and export tax holidays and exemptions, cheap land prices and sometimes extends financial credit. Focusing on the case of Ethiopia for the moment, Figure 1 provides the trend of total land requested by large-scale agricultural investors since 1993. The figure shows that the hectare of land requested for investment starts to increase exponentially since the mid-2000s reaching its maximum in 2008 when a total of close to 4.5 million hectares was requested during the year making the total cumulative amount of land requested for LSAI reach 12 million hectares by 2010. However, in most cases, the amount of land guaranteed to the investors is less than the total amount requested.
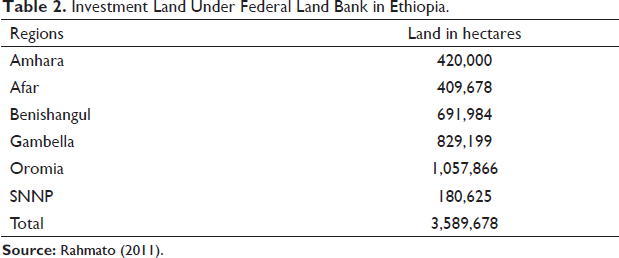
To facilitate large-scale agricultural land transactions, the federal and regional governments in Ethiopia have already identified areas that will be offered to investors. Afar, Amhara, Oromia, SNNP, Benishangul and Gambella regional states are the main destinations of the investments due to a relative abundance of less intensively used land. As of 2011, a total of 3.6 million hectares of land was made ready in the hands of the Federal Land Bank for large-scale land transactions (Table 2). Regional governments also have a stock of land ready for investments as they have the right to transact land if the land area required is less than 5,000 hectares.
Top 20 Most Active Countries Publishing Articles on CGRM, Based on Citations.
Studies on Economic Impacts of Large-scale Land Investments
The continuing trend of LSAI at global, regional and country levels has attracted researchers to investigate the social, economic and environmental implications of the investments. Among the most suitable methods for analysing the impacts of such big investments are economy-wide models, most often built on SAMs. Ferede et al. (2013), Seneshaw (2012), Cororaton et al. (2010) and Arndt et al. (2010) are among the few works that used economy-wide models in this context.
Ferede et al. (2013) studied the impact of biofuel investments on the macroeconomy of Ethiopia and observed that the impact of such investments on the external sector could be negative as the investments could affect the working of the traditional sector that contribute hugely to domestic production and export revenue. While this study considers the real input–output structure of existing biofuel production activities, it only focuses on biofuel production and does not identify whether the investments are targeting the local or the export sector. The destination of outputs from large-scale investments on land has been a point of concern. A similar attempt is made by Arndt et al. (2010) in the case of Mozambique, and the study identified that biofuel investment is pro-poor due to greater use of unskilled labour for biofuel production.
Seneshaw (2012) considered a wider spectrum of LSAIs engaging in both food crop and cash crop production in the case of Ethiopia. However, the study assumes that the input–output relationship by the new episodes of LSAIs is identical to the existing system of production and shocked current production by the level of expected increase in output to examine the macroeconomic impact of the investments. The study indicated that these investments have considerable positive impacts on the national economy. It, however, stressed that the investments can have negative consequences on household incomes if they are accompanied by displacements.
Cororaton et al. (2010) used a global CGE model integrated with biofuels, land-use, and climate change modules and a global income distribution model to simulate the effects over time of large-scale expansion of biofuels on resource allocation, output prices, commodity prices, factor prices and household income across countries and regions of the world. They find that large-scale expansion of biofuels leads to higher world prices of sugar, corn, oilseeds, wheat and other grains, which consequently results in higher food prices. In particular, the study suggests that large-scale biofuel investments can cause an overall rise in world poverty.
As shown, the common features of the approach followed by most of the existing economy-wide studies is that they (i) have not explicitly accommodated the unique production relationship the investments offer to the destination areas and (ii) failed to account for the geographic distribution of the new projects as large-scale agricultural land is not evenly distributed across regions within national economies. The impacts on factor returns and household incomes of the new investments will vary from place to place, especially in developing countries where there is a huge physical and institutional barrier to factor mobility. The SAM constructed in the succeeding section accommodates these unique features of LSAIs in most low-income countries. The same procedure can be followed to develop a tailor-made SAM for studying the micro- and macroeconomy implications of a new and structurally peculiar sector.
Methods
A SAM for Large-scale Agricultural Investment as a New Activity
Structure of a Standard SAM
A SAM provides a ‘consistent’ representation of transactions within an economy during a benchmark year, in an efficient way, while encompassing economic concepts of the circular flow (Defourny & Thorbecke, 1984; Thorbecke, 2000). It presents every economic transaction in the economy in a matrix form which elaborates on the linkages and interdependencies between various agents that are involved in the transactions (Juana & Mabugu, 2005; Kjosev, 2012).
A typical open economy SAM (Table 3) includes commodity, activity, factor, household, government, investment–saving (I-S) and the rest of the world (RoW) accounts. Entries in the cells in Table 3 reflect transaction values. The table provides the structure of a 2-commodity, 2-activity, a household, a factor, a government, an investment-saving and an RoW matrix economy. Each account in the matrix is represented by a row and a column. The values in the rows show incomes (inflows) to the account, and the values in the respective column are expenditures (outflows) from that account.
Structure of a Standard SAM.
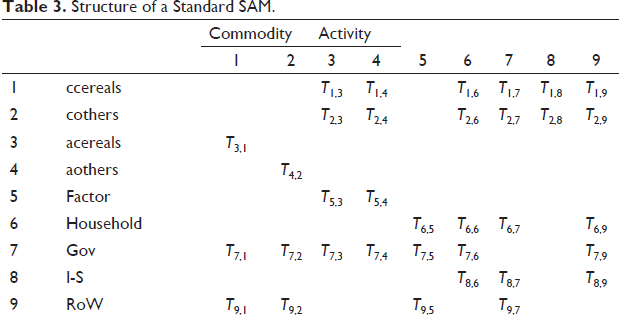
The commodity account represents the total supply and demand for commodities in the economy. The row of the commodity account represents commodity demand as intermediate inputs (T1,3:T2,4), by households (T1,6:T2,6), by the government (T1,7:T2,7), investment demand (T1,8:T2,8) and as export demand (T1,8:T2,8). On the other hand, the column of the commodity account records expenditures on the domestic supply of commodities by domestic activities (T3,1:T4,2) and in the form of imports (T9,1:T9,2). There is also a transfer of funds from the commodity account to the government in the form of sales tax and import duties (T7,1:T7,2). The activity account records the productive activities of an economic system by employing primary factors of production and intermediate inputs. Activities receive payments by supplying their outputs to the commodity market (T3,1:T4,2). The activity account pays direct or production tax to the government (T7,3:T7,4). The account also pays for the use of intermediate inputs (T1,3:T2,4), while the residual is, by definition, distributed to factors of production in the form of value-added (T5,3:T5,4).
The factor account receives income from the use of factors in the production activities (T5,3:T5,4). In turn, these incomes are distributed to households (T6,5) depending on the households’ factor endowments. The factor account also makes payments to the government (T7,5) for government-owned factors and the RoW for foreign-owned factors (T9,5). On the other hand, the household rows represent the sources of income from the ‘sale’ of factors (T6,5), inter-household transfers (T6,6), and transfers from the government (T6,7). Households also receive remittances from the RoW (T6,9). The columns of the household account record expenditures.
The government receives incomes from taxes on household incomes (T7,6), on sales of goods and services (T7,1:T7,2); and value-added tax from the production of goods and services (T7,3:T7,4). Government account also records incomes received in the form of transfers from abroad (T7,9). On the expenditure side, the government buys goods and services from the commodity market (T1,7:T2,7) and makes transfers to households (T6,7), to the saving account (T8,7), and the RoW (T9,7). The S-I account reflects savings by institutional accounts and expenditures on commodities in the form of investment demand. The RoW account records transactions between domestic residents and the RoW. The incomes of the RoW are receipts from the sale of imports (T9,1:T9,2), factor incomes from their involvement in domestic economic activities (T9,5), and transfers from the government (T9,7). On the other hand, the RoW spends on exports (T1,7:T2,9). There are also transfers from this account to domestic institutions: households (T6,9) and the government (T7,9).
A Reformulated SAM
As compared to the traditional farming operations which contribute to a significant share of agricultural production in most developing countries of the world such as Ethiopia, the recent LSAIs on land are by far mechanised and unique in terms of orientation and objectives. This raises the need to introduce these activities as a new sector in SAMs that are eventually used to study the micro and macro impacts of these investments. This requires modifications to the ‘commodity, activity’, ‘activity, commodity’, ‘factors, activity’, ‘household, factor’ and ‘commodity, RoW’ sub-matrices (Table 4). There are, however, some important assumptions that need to be made to make the reformulation of the SAM relatively easier. These include an assumption that these activities are not paying production taxes in the early years of their operation. In fact, this is true since in most cases countries provide tax amnesties to investors to attract investments.
A Reformulated Schematic SAM.*
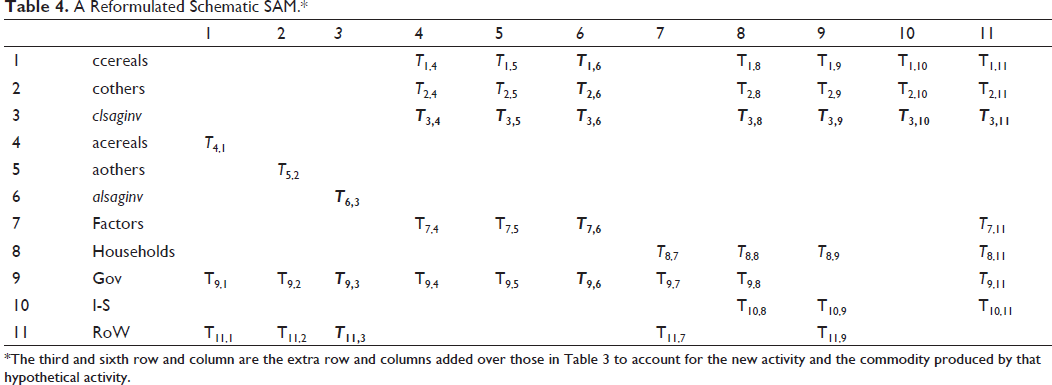
*The third and sixth row and column are the extra row and columns added over those in Table 3 to account for the new activity and the commodity produced by that hypothetical activity.
Although the view that a new SAM that incorporates this hypothetical sector needs to be estimated before making SAM-based analysis is convincing, the fact that in most countries these activities are only in the implementation phase and the lack of information on the transactions they involve within (input uses, factor employment, contribution to domestic consumption) and outside (export share) the economy makes the effort challenging. These challenges can be bridged by introducing the new activity with a scaled-down or small amount of transactions based on which to build model simulations.
Note that the share of this new activity in total production, consumption and factor income is not predetermined and that they are the result of an effort to introduce these transactions in the SAM while assuring that the transactions remain insignificant during the base case. Introducing the new hypothetical sector, however, leaves the commodity, factor and household accounts slightly unbalanced. We rebalance the SAM using a common technique called cross-entropy (Robinson et al., 1998).
A SAM-based Multiplier Analysis
Apart from their data management roles, SAMs also provide important modelling contributions. SAM multiplier analysis has been the most extensively used approach for growth-related (Adelman & Robinson, 1986; Juana & Mabugu, 2005; Tarp et al., 2002) and shock (Nganou et al.,2009; Parra & Wodon, 2008) analysis. Some other notable applications of SAMs as a simpler general equilibrium modelling framework are Pyatt and Round (1979), Defourny and Thorbecke (1984), Roland-Holst and Sancho (1995), Pyatt and Round (2012) and Cardenete and Sancho (2012). In this section, a SAM-based income multiplier approach is used to illustrate the use of the extended SAM for Ethiopia.
A couple of reasons are behind the continued use of SAM-based multiplier models. At the forefront is the extreme flexibility this offer. On the other hand, one of the most obvious limitations of SAM-based multiplier models is their inability to capture the basic behaviours of economic agents such as substitution in consumption and production in response to relative prices. These models assume prices (quantities) to remain unchanged in response to changes in exogenous demand (prices). However, these models provide the necessary capacity to satisfactorily test the use of a disaggregated SAM before it is subsequently fit into complex behavioural models.
The earlier and reduced variants of SAM multipliers are input–output multipliers from input–output models. SAM multipliers are derived in the same procedure as input–output multipliers. An input–output model that is concerned with solving the endogenous vector of sectoral production, 
where
The above equation can be extended to the form of an economy-wide SAM multiplier model by including value-added factors and consumption accounts to the production relationship captured by the input–output table. The extension of the input–output model to an economy-wide SAM-based model adds to the problem of choosing which sector to consider as endogenous or exogenous. Although the choice of exogenous variables normally depends on the nature of the experiment, it is customary to consider the government, capital account and the RoW forming a matrix of exogenous accounts. Considering the 236 × 236 SAM for Ethiopia used for this study (Aragie, 2014), a 10 × 10 matrix of exogenous accounts is formed constituting exogenous variables defined above, which leaves a 226 × 226 matrix of endogenous accounts including commodities, activities, primary factors and households containing all the flows from exogenous to endogenous accounts.
Let the endogenous accounts of the enlarged matrix (SAM) are denoted by 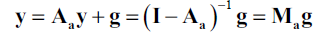
where
Results and Discussion
In this section, we provide a comparative analysis of the impact of LSAIs on production interlinkages and factor and household income distribution using the Ethiopian case under the two types of SAMs discussed above. To this end, we assume that these new investments increase cereal output by 5% of the current level. 2 The baseline simulation is based on the SAM that does not treat separately the new activities from the existing cereal production, i.e., it is assumed that these two activities are identical and the commodities they produce are homogenous. The alternative simulation is based on the SAM that introduces a separate activity and a separate commodity type due to the typical feature of production by the new large-scale investments on land. It is expected that these two SAMs provide different results owing to the difference in which the new activities are understood and assumed to be linked to the rest of the economy specifically in terms of sectoral interlinkages and income formation.
Production Interlinkages
The injection in the economy associated with the LSAIs is expected to affect the entire production system depending on the size of the backward and forward interlinkages across sectors. Table 5 provides the simulated impacts of the investments on various sectors of the economy under a SAM that does not segment production by these investments from the existing cereal production dominated by farm households and compares those with results under an alternative SAM which separates these investments and treats them as unique in terms of production technique, input requirements and factor composition. The result based on the baseline SAM shows that activities by households in Tigray, Amhara, parts of Oromia and SNNP regional states are strongly and positively impacted by the investments. Specifically, moisture-sufficient highlands in Amhara, Oromia and SNNP will experience close to 4.2, 8.3 and 3.5 billion Birr expansions in production in absolute terms. A relatively similar trend is observed when using the alternative SAM in terms of beneficiary regions.
Production Interlinkages (in Billions of LCU).
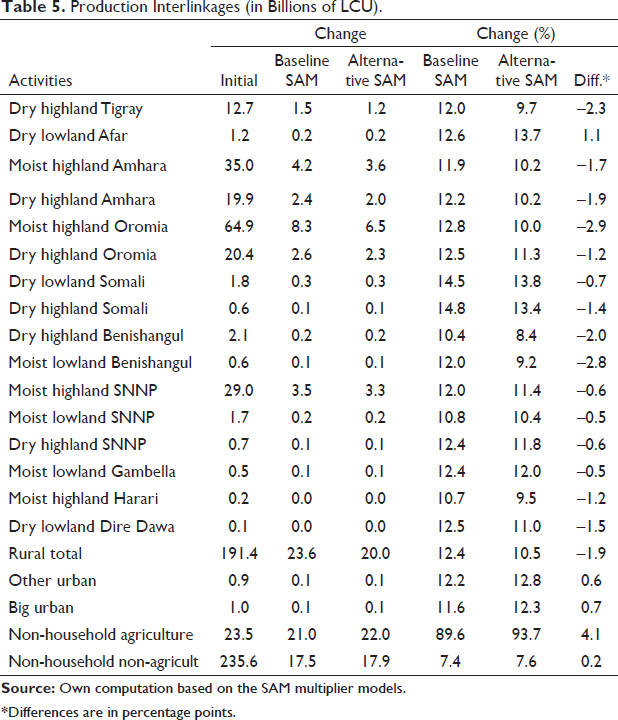
*Differences are in percentage points.
An examination of simulation results on the percentage change in production on the other hand shows that the baseline SAM generally overstates the sectoral interlinkages. The overstatement is severe on activities in Tigray, drought-prone highlands of Amhara, moisture-sufficient highlands of Oromia, drought-prone highlands of Somali and moisture-sufficient lowlands of Benishangul. The result shows that the reformulated SAM properly captures the loose backward and forward interlinkages between the new sector and the rest of the economy. Producers in the Afar region emerge as the main beneficiary under the reformulated SAM as compared to the interlinkages obtained from the baseline SAM since the region is one of the destinations of large-scale investments although it has not been one of the main producer regions.
Effects on Factor Returns and Household Incomes
Table 6 presents two scenarios on the factor and household income effects of the LSAIs. The two SAMs provide competing evidence. Things to note are the impact of the shock on incomes to capital and labour factors. As compared to the SAM without a separate account for the new activities, i.e., the baseline SAM, the alternative SAM overstates the growth rate of factor payments to capital and understates the growth rate of factor payments to labour. Under the baseline SAM the injection causes the returns to labour and capital to expand by 19.2% and 8.7%, respectively, while the alternative SAM reveals that the expansion is rather lower by 1.7 percentage points for labour and higher by 3.4 percentage points for capital than what is predicted by the baseline SAM. The return to land also grows at a considerably higher rate under the alternative SAM. The result indicates that the SAM that introduces large-scale commercial farms as separate activities with unique value-added composition as compared to the existing agricultural practice in developing countries provides a result unrelated to the SAM that does not differentiate these two groups of activities.
Factor and Household Incomes (in Billions of LCU).
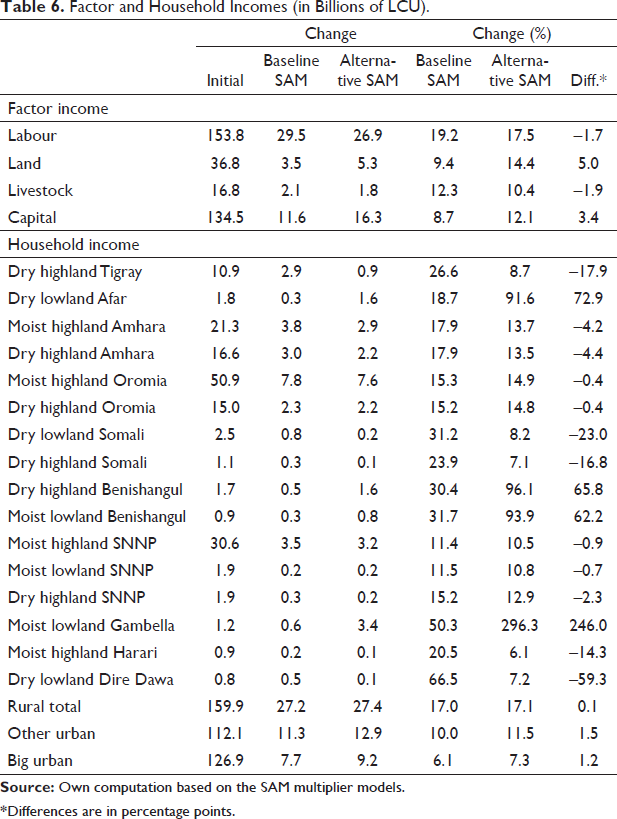
*Differences are in percentage points.
A clear and significant disparity between results from the two SAMs is witnessed when the impact of the injection to the economy associated with the large-scale investments on the incomes of households is examined. The income effect is high for households in Afar, Benishangul and Gambella regions when LSAIs are treated as unique and separately. What is common to these groups of households is that they are in regions where a considerable amount of land is dedicated for the investments; hence, they are affected more directly by the investments in the form of return to labour, land, livestock and capital inputs they offer. This is typically true given the sluggish movement of factors across regions and the political motive that these investments will need to benefit the local community more.
Households in Tigray, Somali, Harari and Dire Dawa regional states are among the households that have shown a significant drop in the income effect of LSAIs when these investments are considered separately in the SAM. What is common to this set of households is that there is no adequate land that can be dedicated to LSAIs in the regions and that shocking the entire cereal sector by some amount to account for the new big investments in the country can only inflate production in these areas proportionately without capturing the actual contribution of each region as a destination to the new investments. Accounting for the new investments by introducing a hypothetical sector can, on the other hand, help to properly trace the destinations of the investments by allowing identify the regional land, labour and capital markets that are involved in production. Overall, the production shock can increase the incomes of rural households considerably (by about 17%) followed by ‘other urban’ (by about 10%) and ‘big urban’ households (by about 7%). 3
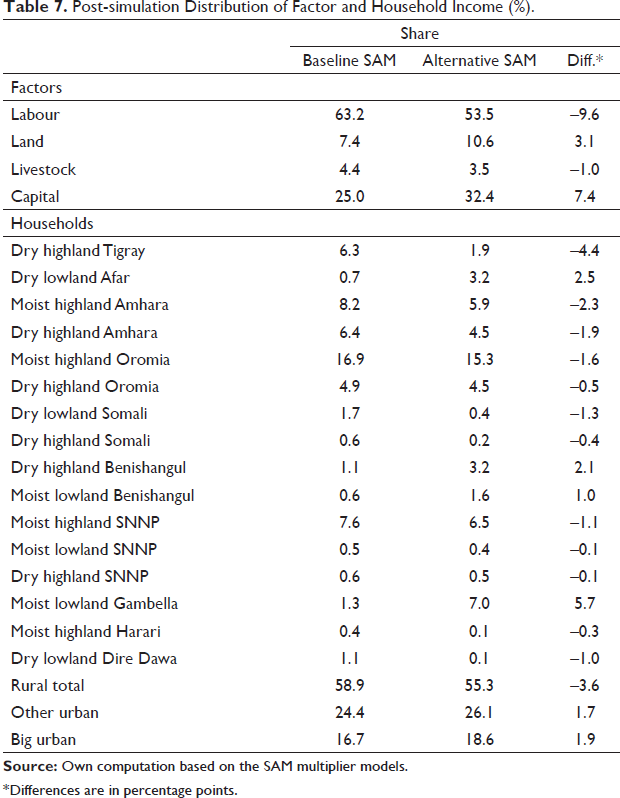
The post-simulation distribution of income provides an interesting insight into the importance of generating a SAM with an appropriate structure. As the share of factors from value-added income shows (see Table 7), the SAM that separately accounts for the hypothetical sector reveals the relatively capital-intensive nature of the new activity. While the share of capital from total value added after the shock is just 25% based on the baseline SAM, it turns out to exceed by 7 percentage points under the alternative SAM. The share of labour is less by about 10 percentage points under the SAM that separates the new investments in agriculture from the similar but largely traditional farming. The failure to properly account for this dimension of the income distribution impact of large-scale commercial farms in economies dominated by small-scale semi-subsistence operators will result in misleading policy prescriptions and unlikely expectations from the investments.
Post-simulation Distribution of Factor and Household Income (%).
*Differences are in percentage points.
How does the distribution of the extra income generated by the policy shock differ under the two SAMs? The answer to this question also helps to answer whether the choice of SAM structure matters for policy analysis related to the controversial issue of whether LSAIs benefit low-income countries. It can be seen from Table 7 that the SAM without a separate account for the new large-scale investments tends to overstate the relative share of the additional income that flows to households in Tigray, Amhara, Somalia and parts of Oromia. On the other hand, compared to the alternative SAM, this SAM understates the benefit to households in regions where these new investments are being undertaken (those in Afar, Benishangul and Gambella regions). Note also that the share of income by urban households is higher under the SAM with a separate account for the new investments than the post-simulation shares under the baseline SAM. This is explained by the relatively strong contribution of capital in these activities as captured by the alternative SAM. In summary, the difference in the distribution of income illustrated by the two SAMs again shows the importance of the SAM structure for policy analysis.
Conclusions
Recently, there has been a new phenomenon of a scramble for large-scale agricultural land in developing countries, mainly by international investors. This is causing a growing debate in the area of development policy-making by both national and international development agents. Some argue that these investments will help the countries secure adequate domestic food supply, create new dynamics of employment and generate the highly needed foreign currency for exports. By contrast, others claim these investments are displacing a large number of indigenous people from their livelihoods with several consequences on the ecosystem, making the analysis of the net costs and benefits of the investments empirical pursuit.
To contribute to this heated debate, researchers and academicians are undertaking studies using a variety of techniques. One approach for studying the economy-wide and distributional implications is SAM-based CGE modelling. Nevertheless, the vigour of the results of such models depends on the quality of the data contained in the SAM. The tradition so far has been to shock an existing sector so that the macro, micro and distributional consequences of LSAIs in the host countries are analysed. This paper, on the other hand, argues that this traditional way of simulating the impact of these investments in low-income countries is misleading as the approach basically implies that the input–output relationships and the techniques of production by these new big agricultural investments are identical to the semi-subsistence way that dominates agricultural operations in the host countries. We can incorporate the peculiarity of LSAIs in existing SAMs for case countries by assuming a new hypothetical activity that engages intermediate inputs and factors of production in a unique way to produce a new hypothetical commodity. This is done by assuming insignificant transactions related to the new activity in the base SAM as shown using the case of Ethiopia.
Our comparative analysis using two competing SAMs—one without the new hypothetical sector and the other with a separate sector representing the LSAIs—indicate different results on (i) sectoral interlinkages and (ii) factor and household income distributions in response to the same level of simulated expansion in production associated with the large-scale investments on land. The SAM that separately accounts for LSAIs reflects the geographic distribution and the relatively capital-intensive nature of the investments. The result implies that existing studies on the economy-wide, poverty and distributional impacts of LSAIs using SAM-based simulation models are unreliable and miss the most proximate impacts of the investments on the host economies. However, the multiplier analysis employed in this study is only used for illustration purposes to identify a better way of studying the impacts of LSAIs in developing countries. The way forward should be to examine the implications of these investments on the macroeconomy, income distribution and domestic food security using (i) a more robust behavioural model calibrated on the reformulated SAM generated in this study and (ii) several scenarios on the rate of export-orientation of the investments.
Footnotes
Declaration of Conflicting Interests
The author declared no potential conflicts of interest with respect to the research, authorship and/or publication of this article.
Funding
The author received no financial support for the research, authorship and/or publication of this article.