



Abstract
Historically, the Scheduled Tribe (ST) community is deprived of primary education and suffers from a lower literacy rate in India, particularly in West Bengal. From this perspective, the study aims to find the trend of the primary gross-enrolment ratio (PGER) of 7–14 years aged children and the overall literacy rate in the ST community as compared to its non-ST counterpart. The study also focuses on gendered literacy disparity in ST and non-ST communities. Gendered literacy disparity is measured using modified Sopher’s disparity index of Kundu and Rao (Educational planning: A long term perspective, 1986 [pp. 435–466], NIEPA). Besides, paired sample t-test is applied for the empirical result. Apart from this, a comparative analysis of rural and urban Bengal is made. The study reveals that in India as a whole and particularly in West Bengal, the literacy rate and PGER have yet not achieved its desired goal. The condition was worse in the ST community in the previous census and has created a wide PGER and literacy gap with the non-ST community. Gendered literacy disparity exists in both the communities, though the level is very high in the ST community.
Introduction
Education is the door of knowledge that helps to nourish our thoughts, and being literate is the first step to getting the key to the door. It is the foremost quality to improve human capital and social equality (Katiyar, 2016). For the development of humans as a resource, education plays a crucial role (Chaudhry & Rahman, 2009). It helps to develop our sociocultural perception for the betterment of society. A person above6 years of age who can read and write is considered literate in India (Census, 2011). In general, people become literate at the stage of primary schooling education. From this perspective, primary education is essential to build a nation by making human capital (Arif et al., 1999; Brahmanandam & Basu, 2016; Haq & Haq, 1998). Sarva Shiksha Abhiyan (SSA) is an educational programme taken up by the 86th amendment of the Indian constitution, aiming to educate all the children of the age group of 6–14 years by providing free and compulsory education. It is a fundamental right ensured by the Indian constitution for every child in this age group (Article 21A). That is why the primary gross enrolment ratio (PGER) is necessary to determine the proportion of children enjoying this right and making it successful. However, in all the censuses after the independence, GER in primary education in the Scheduled Tribe (ST) community is lower than all other social groups at the national level and in West Bengal. In tribal society, a large proportion of children are used to do various economic activities instead of attending school (Vidyarthi, 1972). They are mainly engaged in different occupations from childhood to assist the family’s financial needs; as a result, most of them are not enrolled in the school (NSSO, 1990; Sujāta, 1987). They mainly possessed their indigenous knowledge, which is oral, informal and not institutional (Mishra, 2010). From this perspective, this study focuses on its first objective, that is, to find the trend and gap of PGER in ST and non-ST community since 1991 census in the districts of West Bengal.
The literacy status of any society is an important indicator to measure the socio-economic development (Azim, 2005). Most of the tribes live in rural areas and have lesser access to education (Dunn, 1993), and the dropout rate increases with the higher level of education. As a result, the educational achievements are only 5.8% in higher secondary, 1.8% in graduate and 0.2% in postgraduate courses (Appendix 4; Rana & Sarkar, 2020). They are lagging in the field of literacy in comparison with the other community, even from the Scheduled Cast (SC) community (Maharatna & Chikte, 2004). It has also been found that the deprivation level in literacy is very high among the ST community. From this perspective, the study’s second objective aims to reveal the trend and gap of overall literacy rate in ST and non-ST communities for every single district as a whole and particularly for rural and urban areas.
On the other hand, improving the female literacy rate can be more effective as a social indicator than income (McDougall, 2000). When female literacy increases, the disparity reduces more significantly. It means there is a correlation between the female literacy rate and the gender literacy disparity (Raju, 1988). Gender equality is the way to diminish the gender gap. It leads to any community’s well-being and overall development (Islam & Siddiqui, 2019). This equality can be achieved through universal primary education (Bhat et al., 2011). However, it has been found that the gender gap in literacy has increased in low-income countries (King & Mason, 2001). In South Asian countries, females receive less education than males because they get less importance than men in society (King & Hill, 1993). Dunn (1993) has found that tribal women are more backward than tribal men. It has come to light that the gender gap in literacy is a major issue in the tribal community and an essential dimension of gender inequality (Ghosh, 2007). Lack of environmental set-up decreases the number of girl child participation in the school, especially in the tribal community (Ghosh, 2007). As a result, the lowest literacy in India is recorded among the tribal women (Maharatna & Chikte, 2004), and it is also the same in West Bengal (Jana, 2018). Because of that, a broader gap in literacy exists between the male and female population, which creates gender disparity. From this perspective, the last objective of the study is focused on the trend of gender literacy disparity in the ST and non-ST communities.
Database and Methodologies
This is a macro-level study and entirely based on secondary quantitative databases collected from India’s different series of census. The Census of India provides the community-based database, that is, total of SC and ST. Because of that, the non-ST database has been calculated by deducting the ST database from the total. Based on the available data set, descriptive statistical techniques have been applied for the empirical result. Apart from this, an appropriate parametric test, that is, paired sample t-test has been run.
In this study, PGER has been measured only for children between the ages of 7–14 years enrolled in primary education in every single district as a whole and also particularly for rural and urban areas by using the following formulas:



The literacy rate has been measured by applying the formula used in Census 2011:
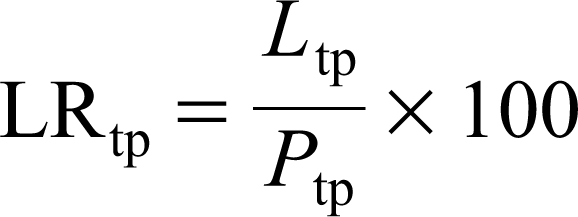
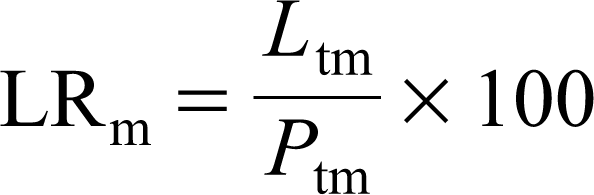
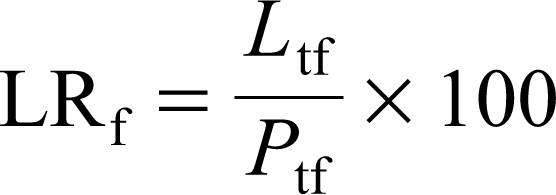
where LRtp = total literacy rate, Ltp = total literate population, Ptp = total population (excluding 0–6 years), LRm = male literacy rate, Ltm = total male literate population, Ptm = total male population (excluding 0–6 years), LRf = female literacy rate, Ltf = total female literate population and Ptf = total female population (excluding 0–6 years).
Modified Sopher’s disparity index of Kundu and Rao (1986) has been applied to find gender literacy disparity in the ST and non-ST community for the different census years.

where x2 is the male literacy rate and x1 is the female literacy rate.
Study Area
West Bengal is a state on the eastern side of India. The Bay of Bengal covers the southern part of this state, and in the north, there is the Himalayas. This state shares an international boundary in the east with Bangladesh. On the state’s western side, there is Odisha, Jharkhand and Bihar. About 88,752 km2 area is covered by this state, which is 2.7% of the total geographical area of India. Until the 1991 census, both the Uttar and Dakshin Dinajpur were undivided. West Dinajpur district was divided in 1992. As such, the total number of districts up to 1991 was 17. On the other side, until 2001, there were 18 districts in West Bengal. Both the Purba and Paschim Medinipur were undivided Medinipur district divided in 2002. After the division, the number of districts raised to 19, and till the 2011 census, the figure was unchanged. Based on the total ST population (5,296,953 persons) as of Census 2011, this state ranked nineth in India. About 5.07% of the ST population of India lived in West Bengal (Census, 2011). Out of the total ST population in the state, the share of the rural population was 91.66%. At the state level, the proportion of the ST community in the entire population was 5.80%. The decadal growth rate of the ST population from 2001 to 2011 was 20.20%.
Results and Discussion
In general, people become literate at 7 years during their primary education. This age has been considered to demarcate a person’s literacy status in India since the Census 1981 and onwards. However, the age of 5 years and above had been considered the literacy status of a person until the 1971 census. The census database reveals that the overall literacy rate of all the social groups, particularly the ST, has increased in each census year than its previous one at the national level and in West Bengal. Till the census year of 1981, about half of the Indian people were illiterate. A similar result also had been recorded in this state. Though for the ST community, the result was quite different. More than half of the Indian and West Bengal people became literate in 1991. However, the same result has been achieved in the 2011 census for the ST community. Table 1 shows that even after two decades of independence, till 1971, more than 90% of the ST population was illiterate in West Bengal. The literacy rate achieved its highest level at the national and the state level in 2011 as compared to all the previous census years. However, it is not promising after 70 years of independence, especially for the ST community. In the twenty-first century, when the world is living in the digital age, the literacy rate in the ST community stuck below 60% at the national level as a whole, particularly in West Bengal. It proves they are socially backward and have become an educationally backward community.
Trend of Literacy in India and West Bengal.
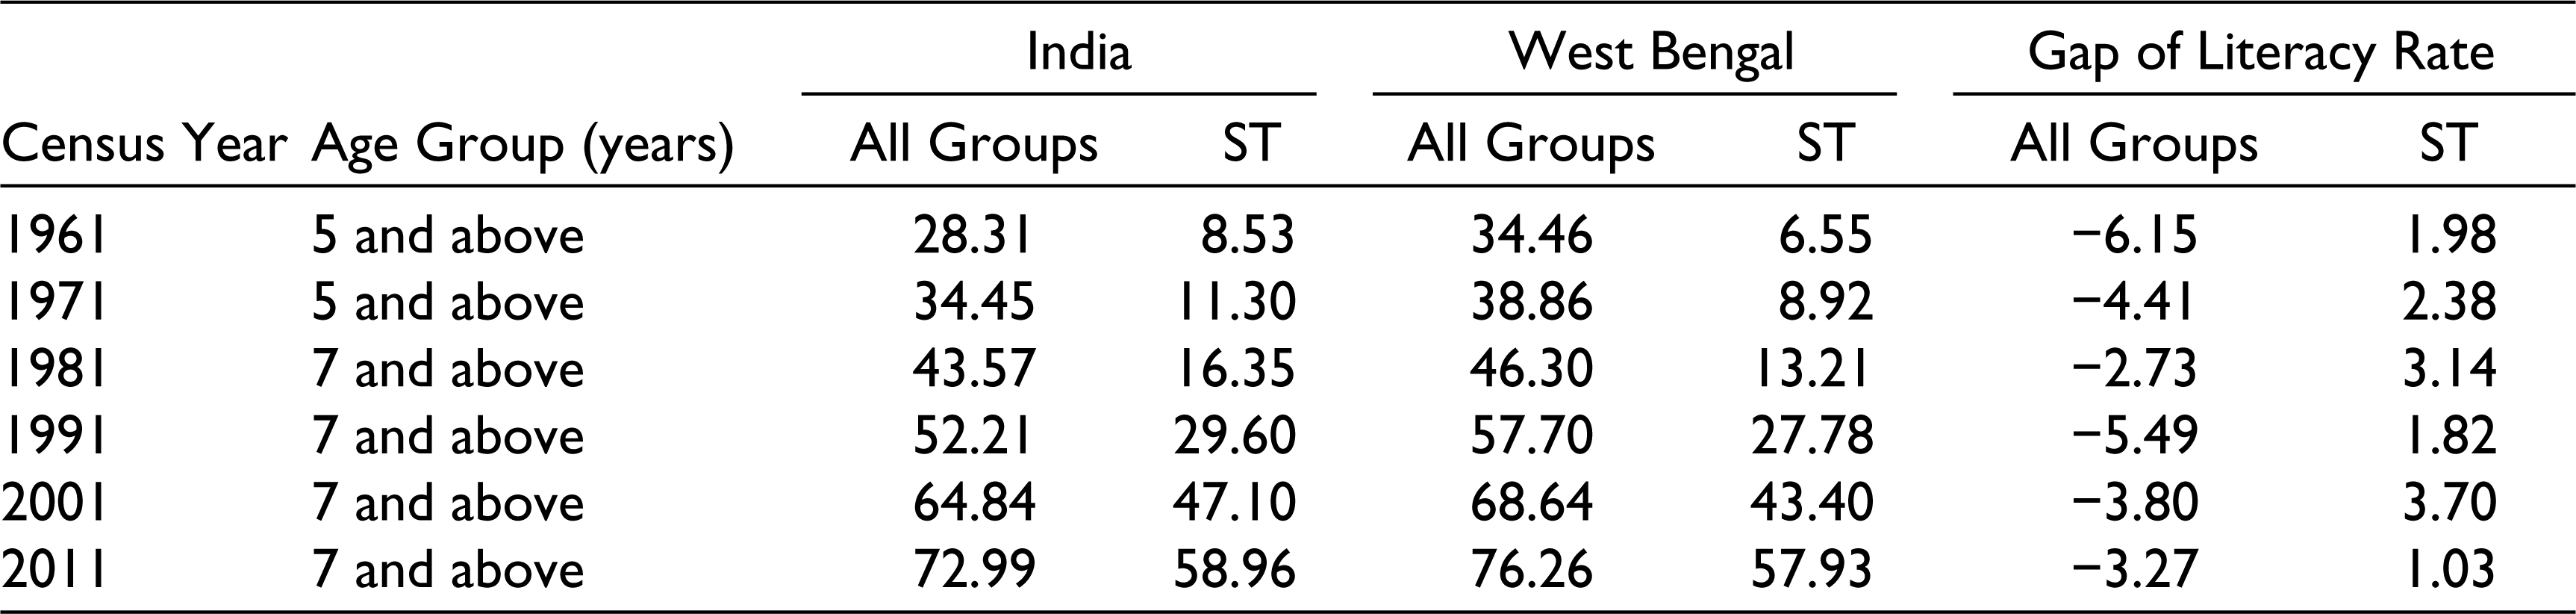
More than two-thirds of the total population were illiterate in India until the 1961 census. In West Bengal, the overall literacy rate was 34.46% in 1961; India as a whole country reached the same level after 10 years, that is, in the census of 1971. The database also shows that the overall literacy rate in West Bengal was higher than the national level in all the census years after independence. The gap in the overall literacy rate between the national and state level was maximum in 1961; after that, it had a declining trend until the census of 1981. In that census year, the gap was the lowest. In the 1991 census, the gap had risen; from Census 2001, it started narrowing down again. On the other hand, the scenario was utterly its opposite for the ST community. In the field of ST literacy rate, West Bengal lagged far behind the national level since independence. It means the literacy rate of STs in this state was lower than the average literacy rate of the ST community at the national level for all the census years. It clearly shows that the ST community has less accessibility to primary education in West Bengal as compared to the country level.
Trend and Gap of PGER in ST and Non-ST Community
PGER plays a crucial role in the overall literacy rate. Higher enrolment in primary education leads the country to be more literate. PGER is the proportion of children enrolled in primary education out of the total child of that age group. From another angle of view, it reveals the proportion of children left out from being literate. In this study, the ratio of the school attendee out of total children between 7 and 14 years has been considered for measuring the PGER.
In 1991, more than two-thirds of the ST children (69.08%) in West Bengal were not enrolled in the school. Though for non-ST, the result was relatively better; about two-thirds (64.02%) came under the umbrella of primary schooling education, which was more than double of the ST community (Appendix 1; Figure 1). However, the proportion of school attendees for two different communities was not uniformly distributed in the districts. In all the cases, the PGER was higher in the non-ST community. In the 1991 census year, only in Kolkata, the state’s capital had recorded that more than half of the children (62.76%) from the ST community had got school education. In the rest of the districts, the ratio was very low. As of the 1991 census, in Murshidabad, the ST PGER was the lowest (15.60%), followed by Malda and Birbhum. On the other hand, in all the districts, except West Dinajpur, Malda and Murshidabad, the primary school attendees in the non-ST community were more than half of the respective age group. This result indicates a wide gap in PGER between ST and non-ST communities at the state level and particularly in the districts (Appendix 1; Figure 2). In West Bengal, the gap of PGER between these two communities was 32.10%. However, the magnitude differed among the districts, that is, the highest gap had been recorded in Bardhaman (41.94 %), followed by North 24 Parganas, Hugli and Birbhum. Even in Kolkata, the gap was 19.49%.


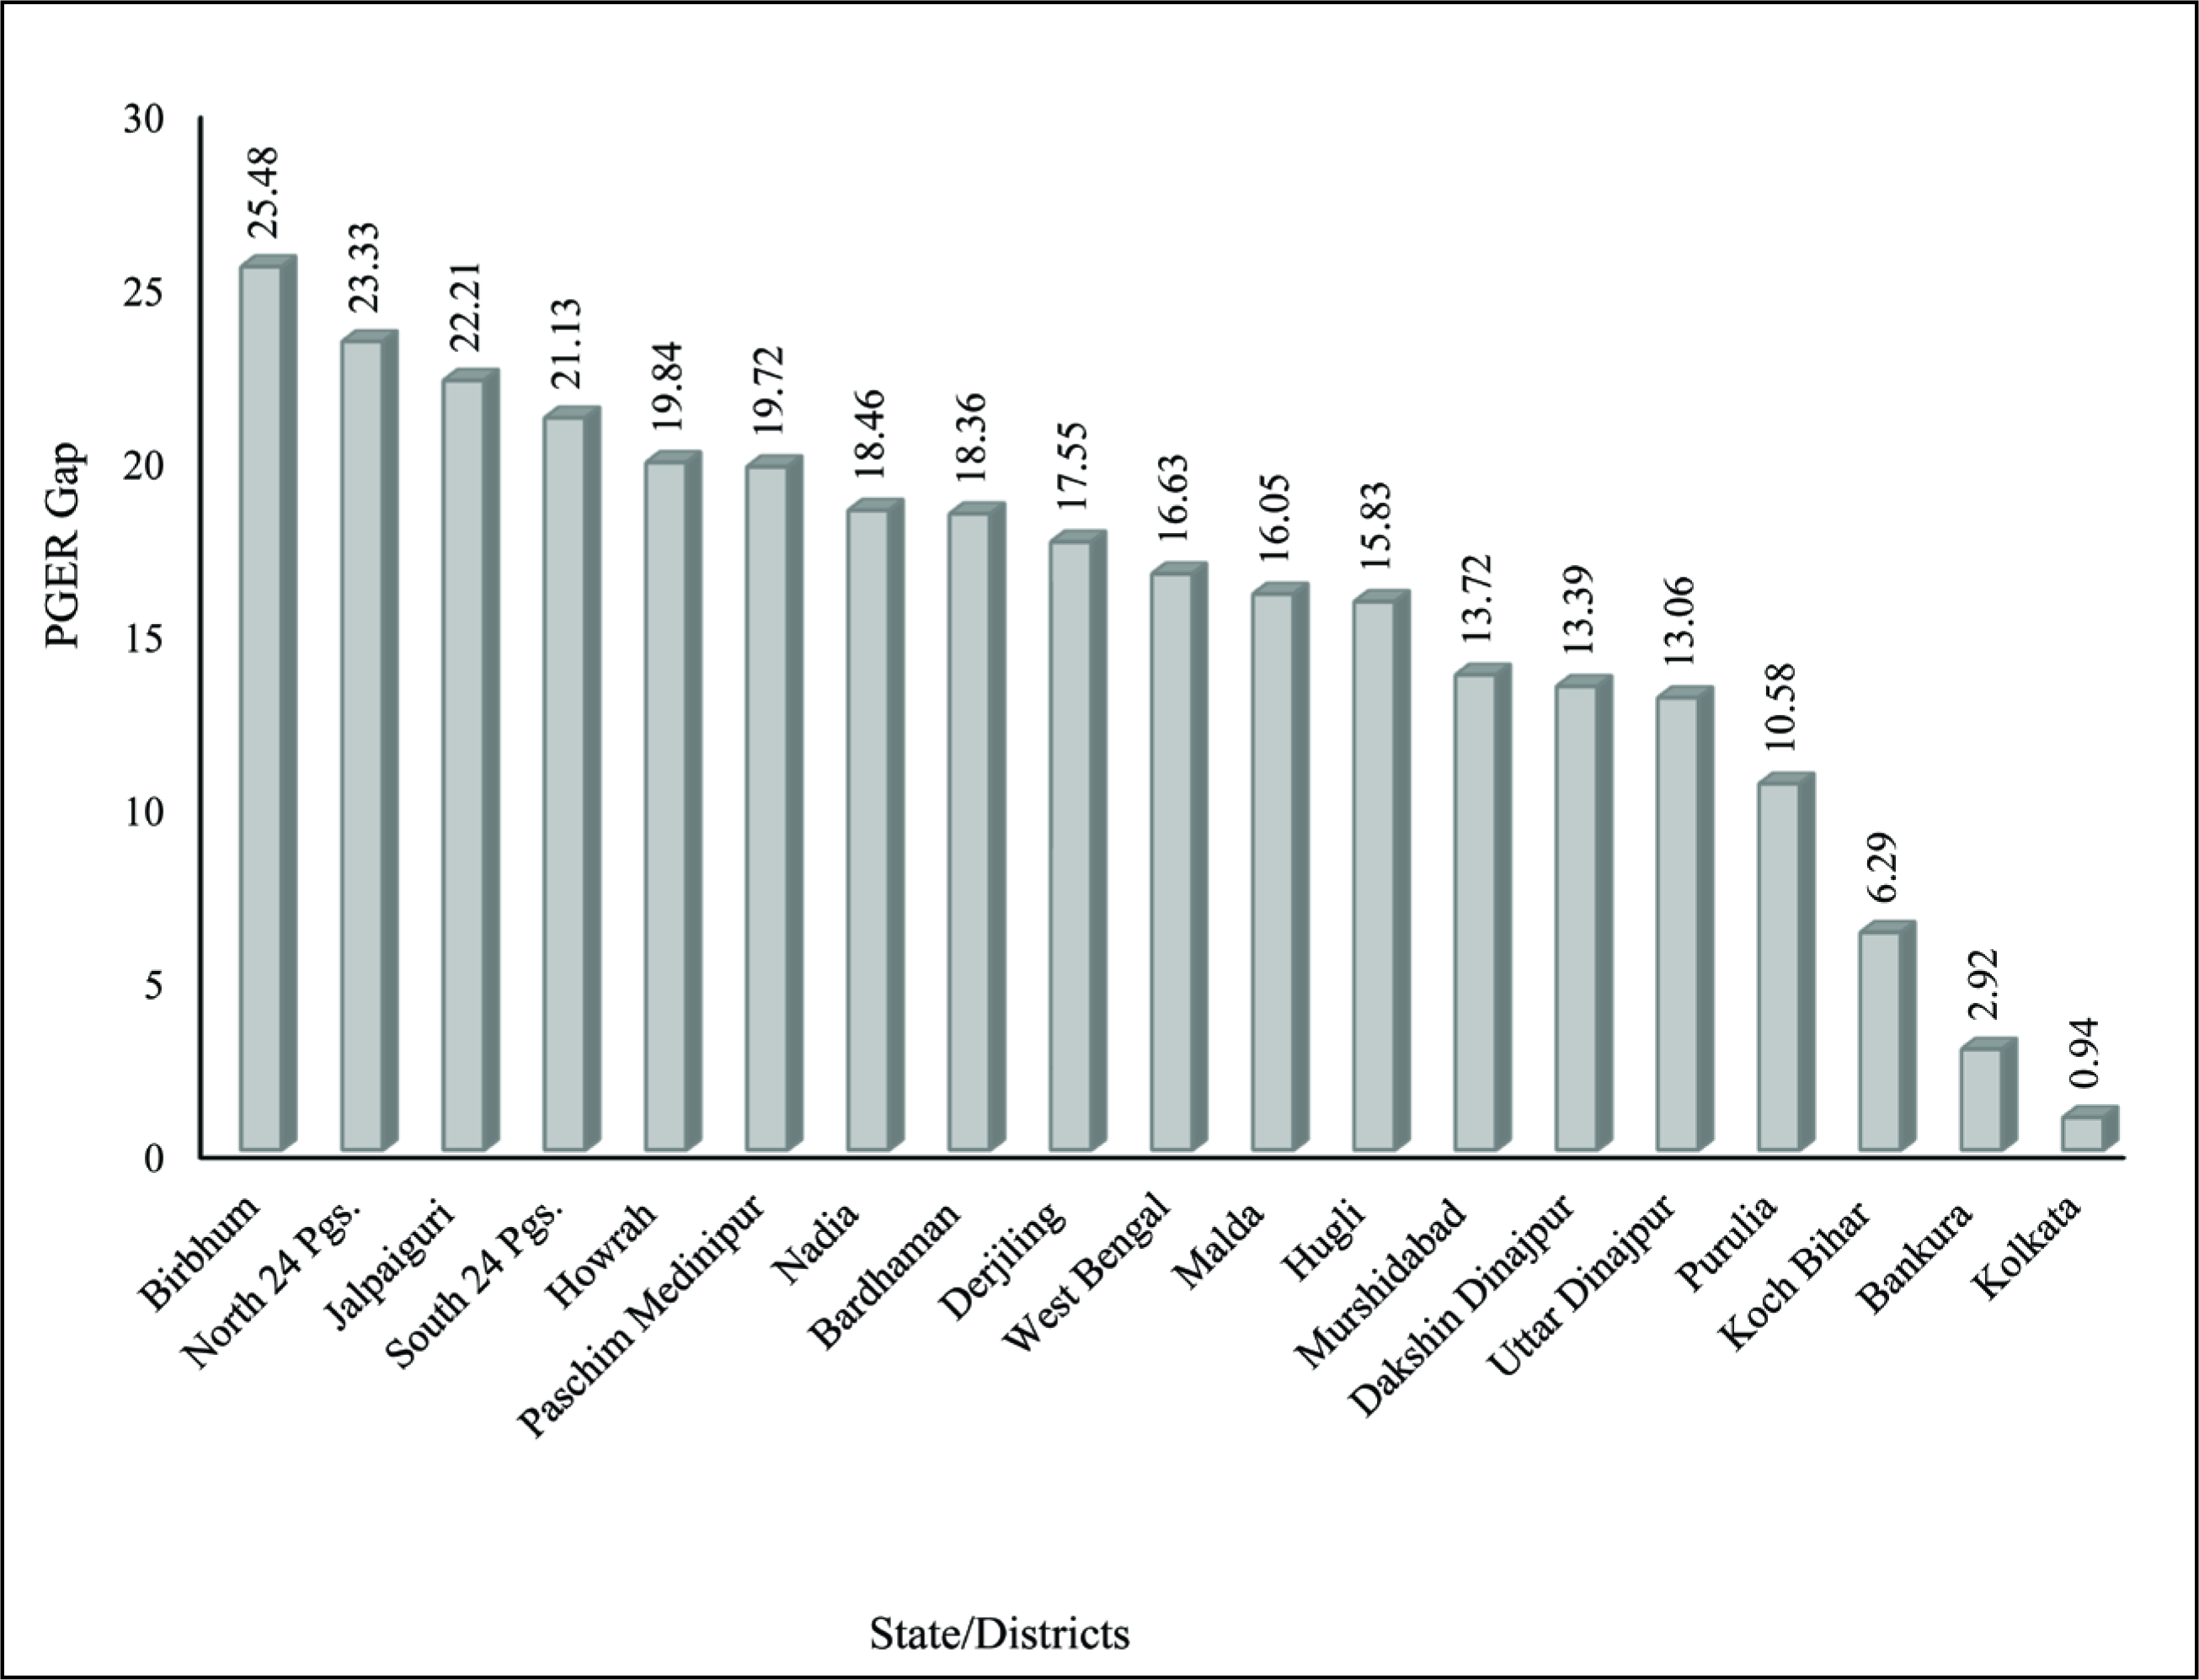
The scenario had quite changed in the 2001 census year for both the communities. However, ST children were still far behind when compared to the proportion of non-ST children enrolled in primary education (Appendix 1; Figure 3). At the state level, PGER in the ST community was 63.07%, whereas for the non-ST community it was 79.71%. Like the previous census, in 2001, the PGER of the ST community was highest in Kolkata (82.96%). However, maximum PGER for non-ST was recorded in undivided Medinipur (86.61%), followed by Hugli and North 24 Parganas. In Uttar Dinajpur, the PGER was lowest for both communities, followed by Malda. Even more than half of the ST children aged between 7 and 14 years were left out to come under the umbrella of primary education in these two districts as of the 2001 census. Like the 1991 census, in the 2001 census, none of the districts showed a higher PGER in ST than its non-ST counterpart. This year, the PGER gap at the state level was 16.63% (Appendix 1; Figure 4). Birbhum (25.48%) was the district where the PGER gap between these two communities was maximum, followed by North 24 Parganas, Jalpaiguri and South 24 Parganas. On the other hand, in Kolkata (0.94%), the lowest gap was followed by Bankura and Cooch Behar.
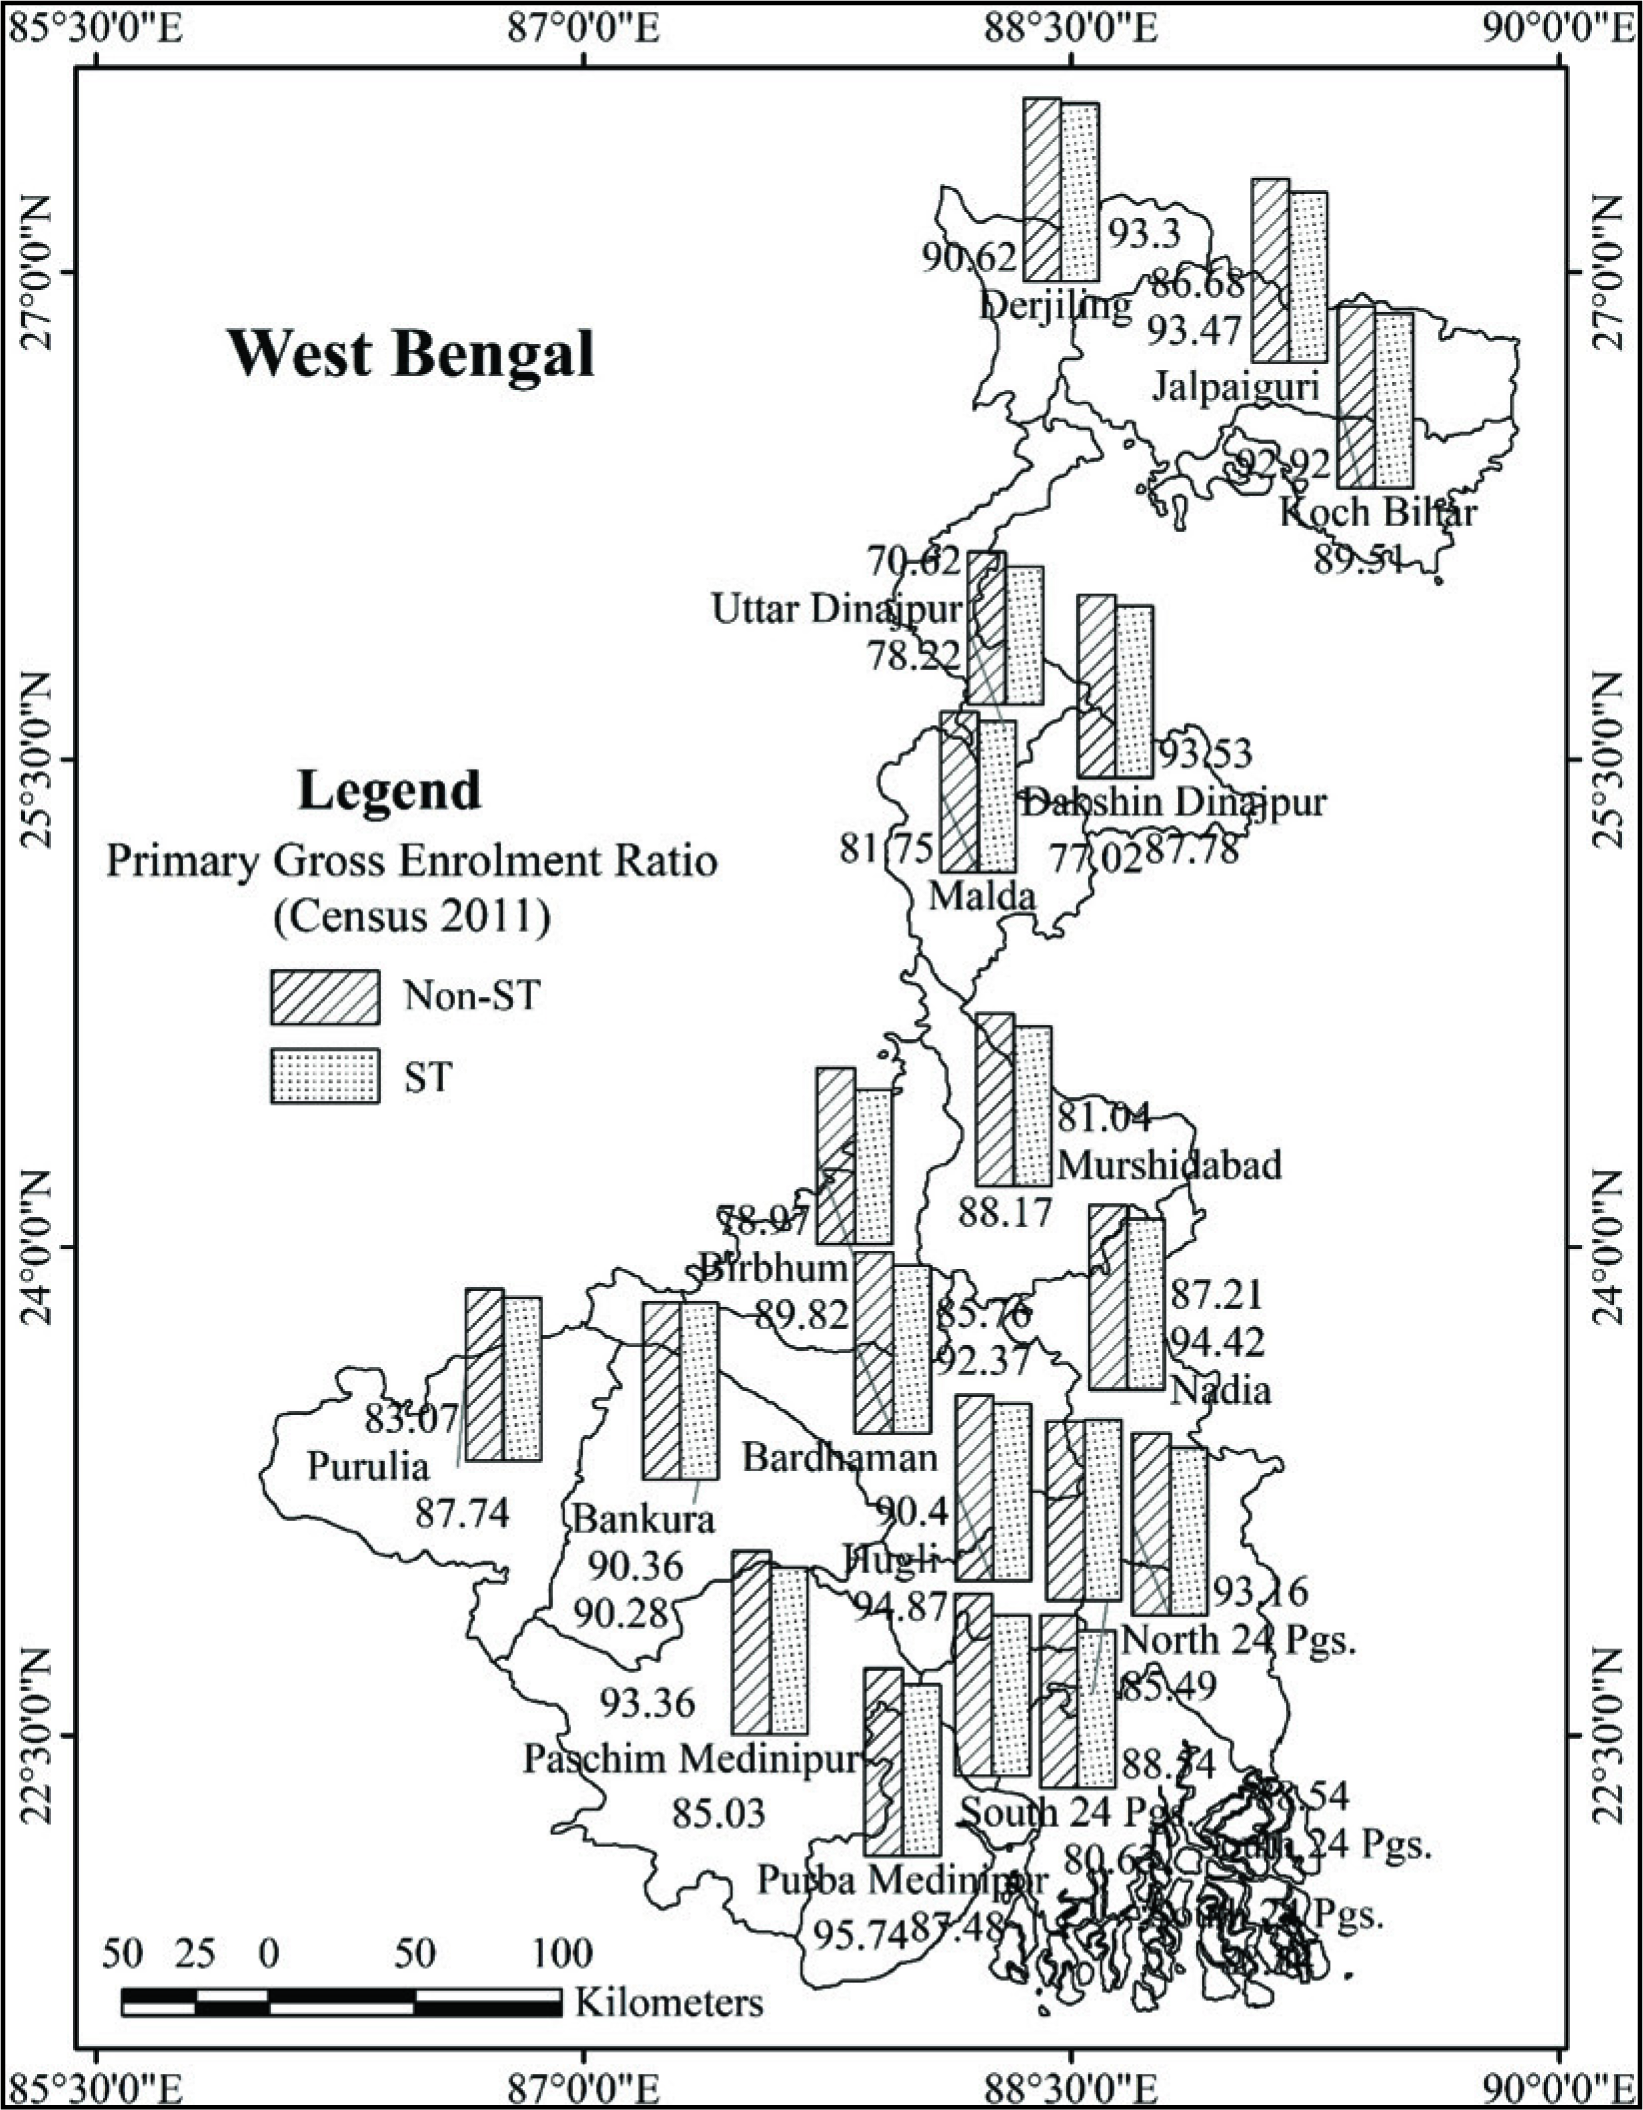

Primary survey-based work on Adivasis (tribals) of West Bengal found that within tribals, the literacy rate varies among different communities. In some of communities, the literacy growth rate was negative (Rana & Sarkar, 2020). In the 2011 census, for both the ST and non-ST communities, the PGER figures were in a relatively better position at the state level as a whole, particularly in most districts (Appendix 1; Figure 5). A primary survey-based study has found that the tribal parents are enthusiastic to send their children who are in the 6–14 age group to primary schools, and because of that, the school enrolment is higher (Rana & Sarkar, 2020). Although the ST PGER was lower than the non-ST PGER in all the districts, except Kolkata, in the past two decades, the enrolment rate in primary schooling education was higher in the ST community, which is a positive sign for the overall ST literacy rate. As of the 2011 census year, more than two-thirds of the ST children aged between 7 years and 14 years have come under primary education in all the districts. Like the two previous censuses, in Kolkata (92.27%), the ST PGER was highest, even more than the non-ST PGER of that district. For the non-ST, Purba Medinipur (95.74%) held the highest position. On the other hand, it was lowest in Uttar Dinajpur for both communities. The database also reveals that the PGER improved for the ST and non-ST community, though the gap still exists between them in all the districts of different magnitudes (Appendix 1; Figure 6). At the state level, the PGER gap was 5.90%. The gap was maximum in Howrah (11.03%), followed by Birbhum, Paschim Medinipur and Purba Medinipur. On the other hand, the minimum gap was recorded in Bankura (0.09%). Kolkata (−0.89%) was the single district where the PGER gap was negative.

Paired Sample t-test
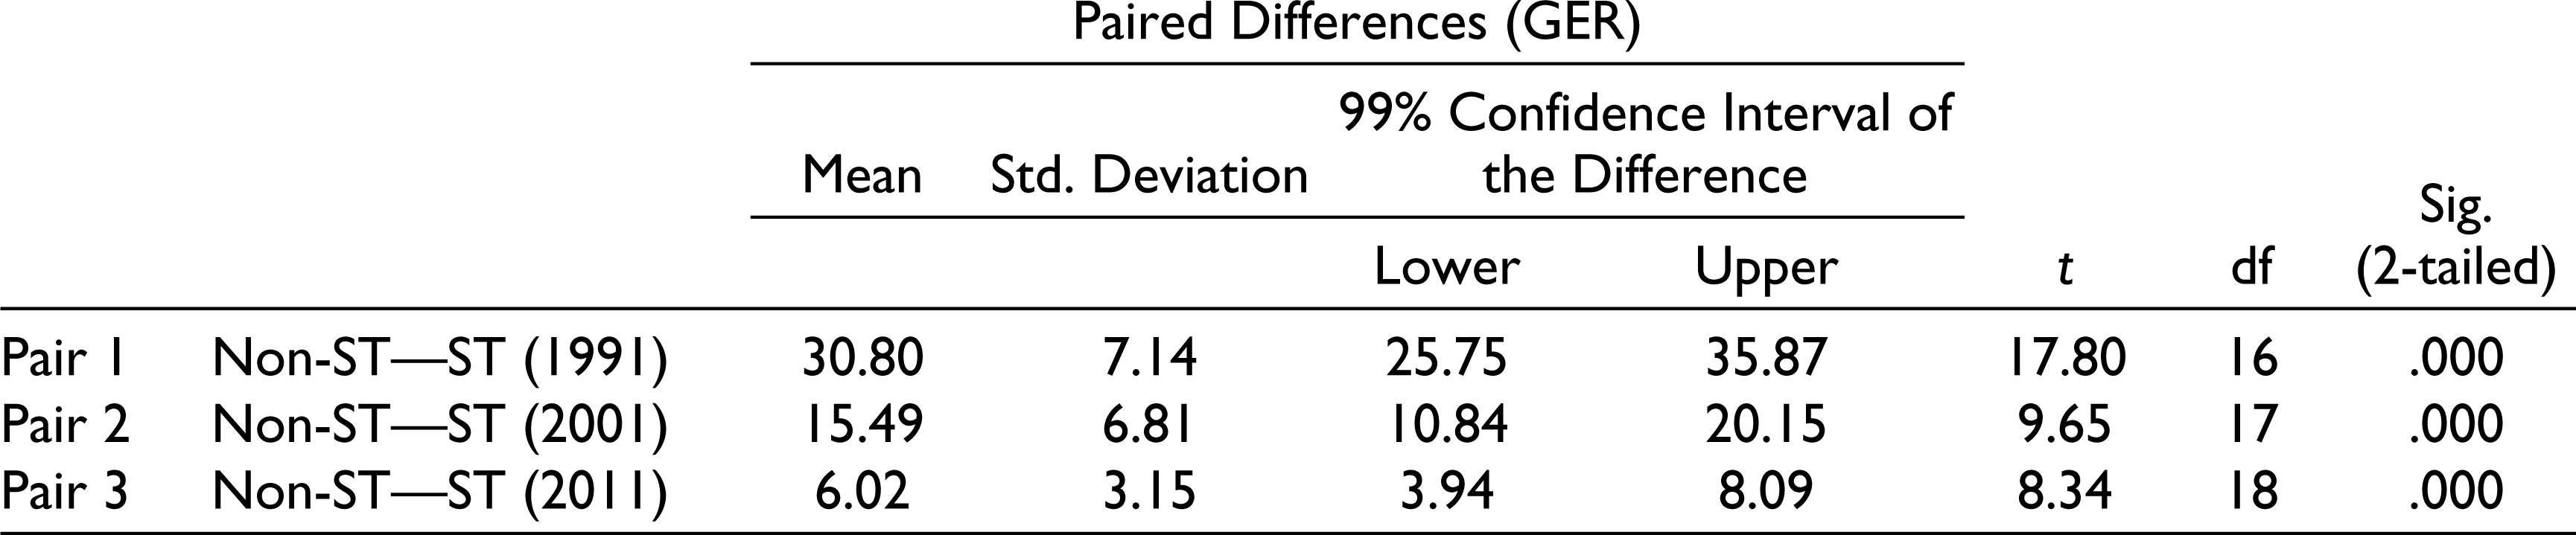
The PGER of the ST and non-ST communities have been compared using a paired sample t-test (Table 2). The test found a statistically significant difference of PGER in all the census years between these two groups, as the p-value is <0.01 (two-tailed). The statistical outcome reveals that the mean PGER of the non-ST community was higher than the mean ST literacy rate for all the censuses in West Bengal. This result proves that the GER in primary education was more excellent in the non-ST community than in its ST counterpart.
Paired Sample t-Test of PGER Between ST and Non-ST Community.
Changing PGER Gap Between ST and Non-ST Community in Rural and Urban Bengal
PGER also measured for the rural and urban regions in the districts of West Bengal based on cast groups. It helps to find the unequal enrolment ratio in primary education among the cast groups in two different environments. In the study, the changing gap of PGER has been measured by deducting ST from non-ST for different census years. The positive gap indicates that the PGER in non-ST is higher as compared to the ST community, and a negative value indicates its opposite. The database reveals that in the 1991 census, the PGER gap between non-ST and ST communities was lower in the rural region of Bengal than the urban region at the state level (Table 3). Though the gap was very high in both the areas, that is, 27.42% and 32.54%, respectively, in all the districts, the ST community lagged far behind the non-ST community to access primary education. As a result, all the gap values are positive for both rural and urban areas. In this census year, the maximum gap in rural areas had been recorded in Howrah (45.20%), followed by Bardhaman, Birbhum and Hugli. On the other side, the gap was highest for urban Birbhum (57.96%), followed by Bardhaman and Hugli. The lowest gap for the urban area had recorded in Darjeeling (6.28%), and for the rural area, it was in West Dinajpur (15.95%).
Changing PGER Gap Between ST and Non-ST Community in Rural and Urban Bengal.

#Till 2001, both East and West Medinipur were undivided Medinipur District, which was divided in 2002. As such, these figures are common for both the districts up to Census 2001.
In the 2001 census, the gap of PGER between two communities had declined at the state level as a whole and particularly in rural and urban areas of all the districts (Table 3). The minimum gap had been recorded in Bankura (2.29%) for the rural area, followed by Cooch Behar and Purulia. Like the 1991 census, in 2001, the highest GER gap was found in Howrah (31.92%), followed by Birbhum and North 24 Parganas. On the other hand, the lowest gap was recorded in South 24 Parganas for the urban area (0.94%) and highest in Birbhum (34.49%). An interesting fact came to light that in Darjeeling, for the rest of the two censuses, that is, 2001 and 2011, the gaps were negative for urban areas, that is, −3.48% and −1.86%, respectively, which means the proportion of ST children in the 7–14 years age group in the urban area had enrolled more in primary school education as compared to the non-ST children. As of last census year, that is, 2011, the PGER gap in primary education still exists between ST and non-ST communities, though the magnitude was lowest when compared to all previous census years. In Murshidabad, a negative gap has been recorded in this census for the urban area. On the other hand, in 2011, Bankura was the only district where both the rural and urban gaps were negative, that is, −0.03% and −1.71%, respectively. It means the proportion of children enrolled in primary education in the ST community was higher than the non-ST community for rural and urban areas.
Trend and Gap of Literacy in ST and Non-ST Communities
The study has focused on the literacy rate in the ST community as compared to the non-ST community in West Bengal from the last three census years since 1991. The result shows the different trends of the literacy rate of these two communities, which creates a wide gap of literacy between them in every census. The database reveals that the literacy rate was more remarkable in the non-ST than in the ST community for all the censuses in the districts of West Bengal. The improvement of literacy rate was more significant in the ST community for every decade than the non-ST community, though they still lagged far behind the non-ST counterpart (Appendix 2). Studies have also found that in some tribal areas, the distance of secondary and higher secondary schools is more than the normal distance, that is, 5 km for one-fourth and one-third of tribal students, respectively. To acquire higher education, there is no option for most of the Adivasi (tribal) students other than going outside of their locality; however, most of them could not afford the cost of accommodation (Appendix 4) (Rana & Sarkar, 2020).
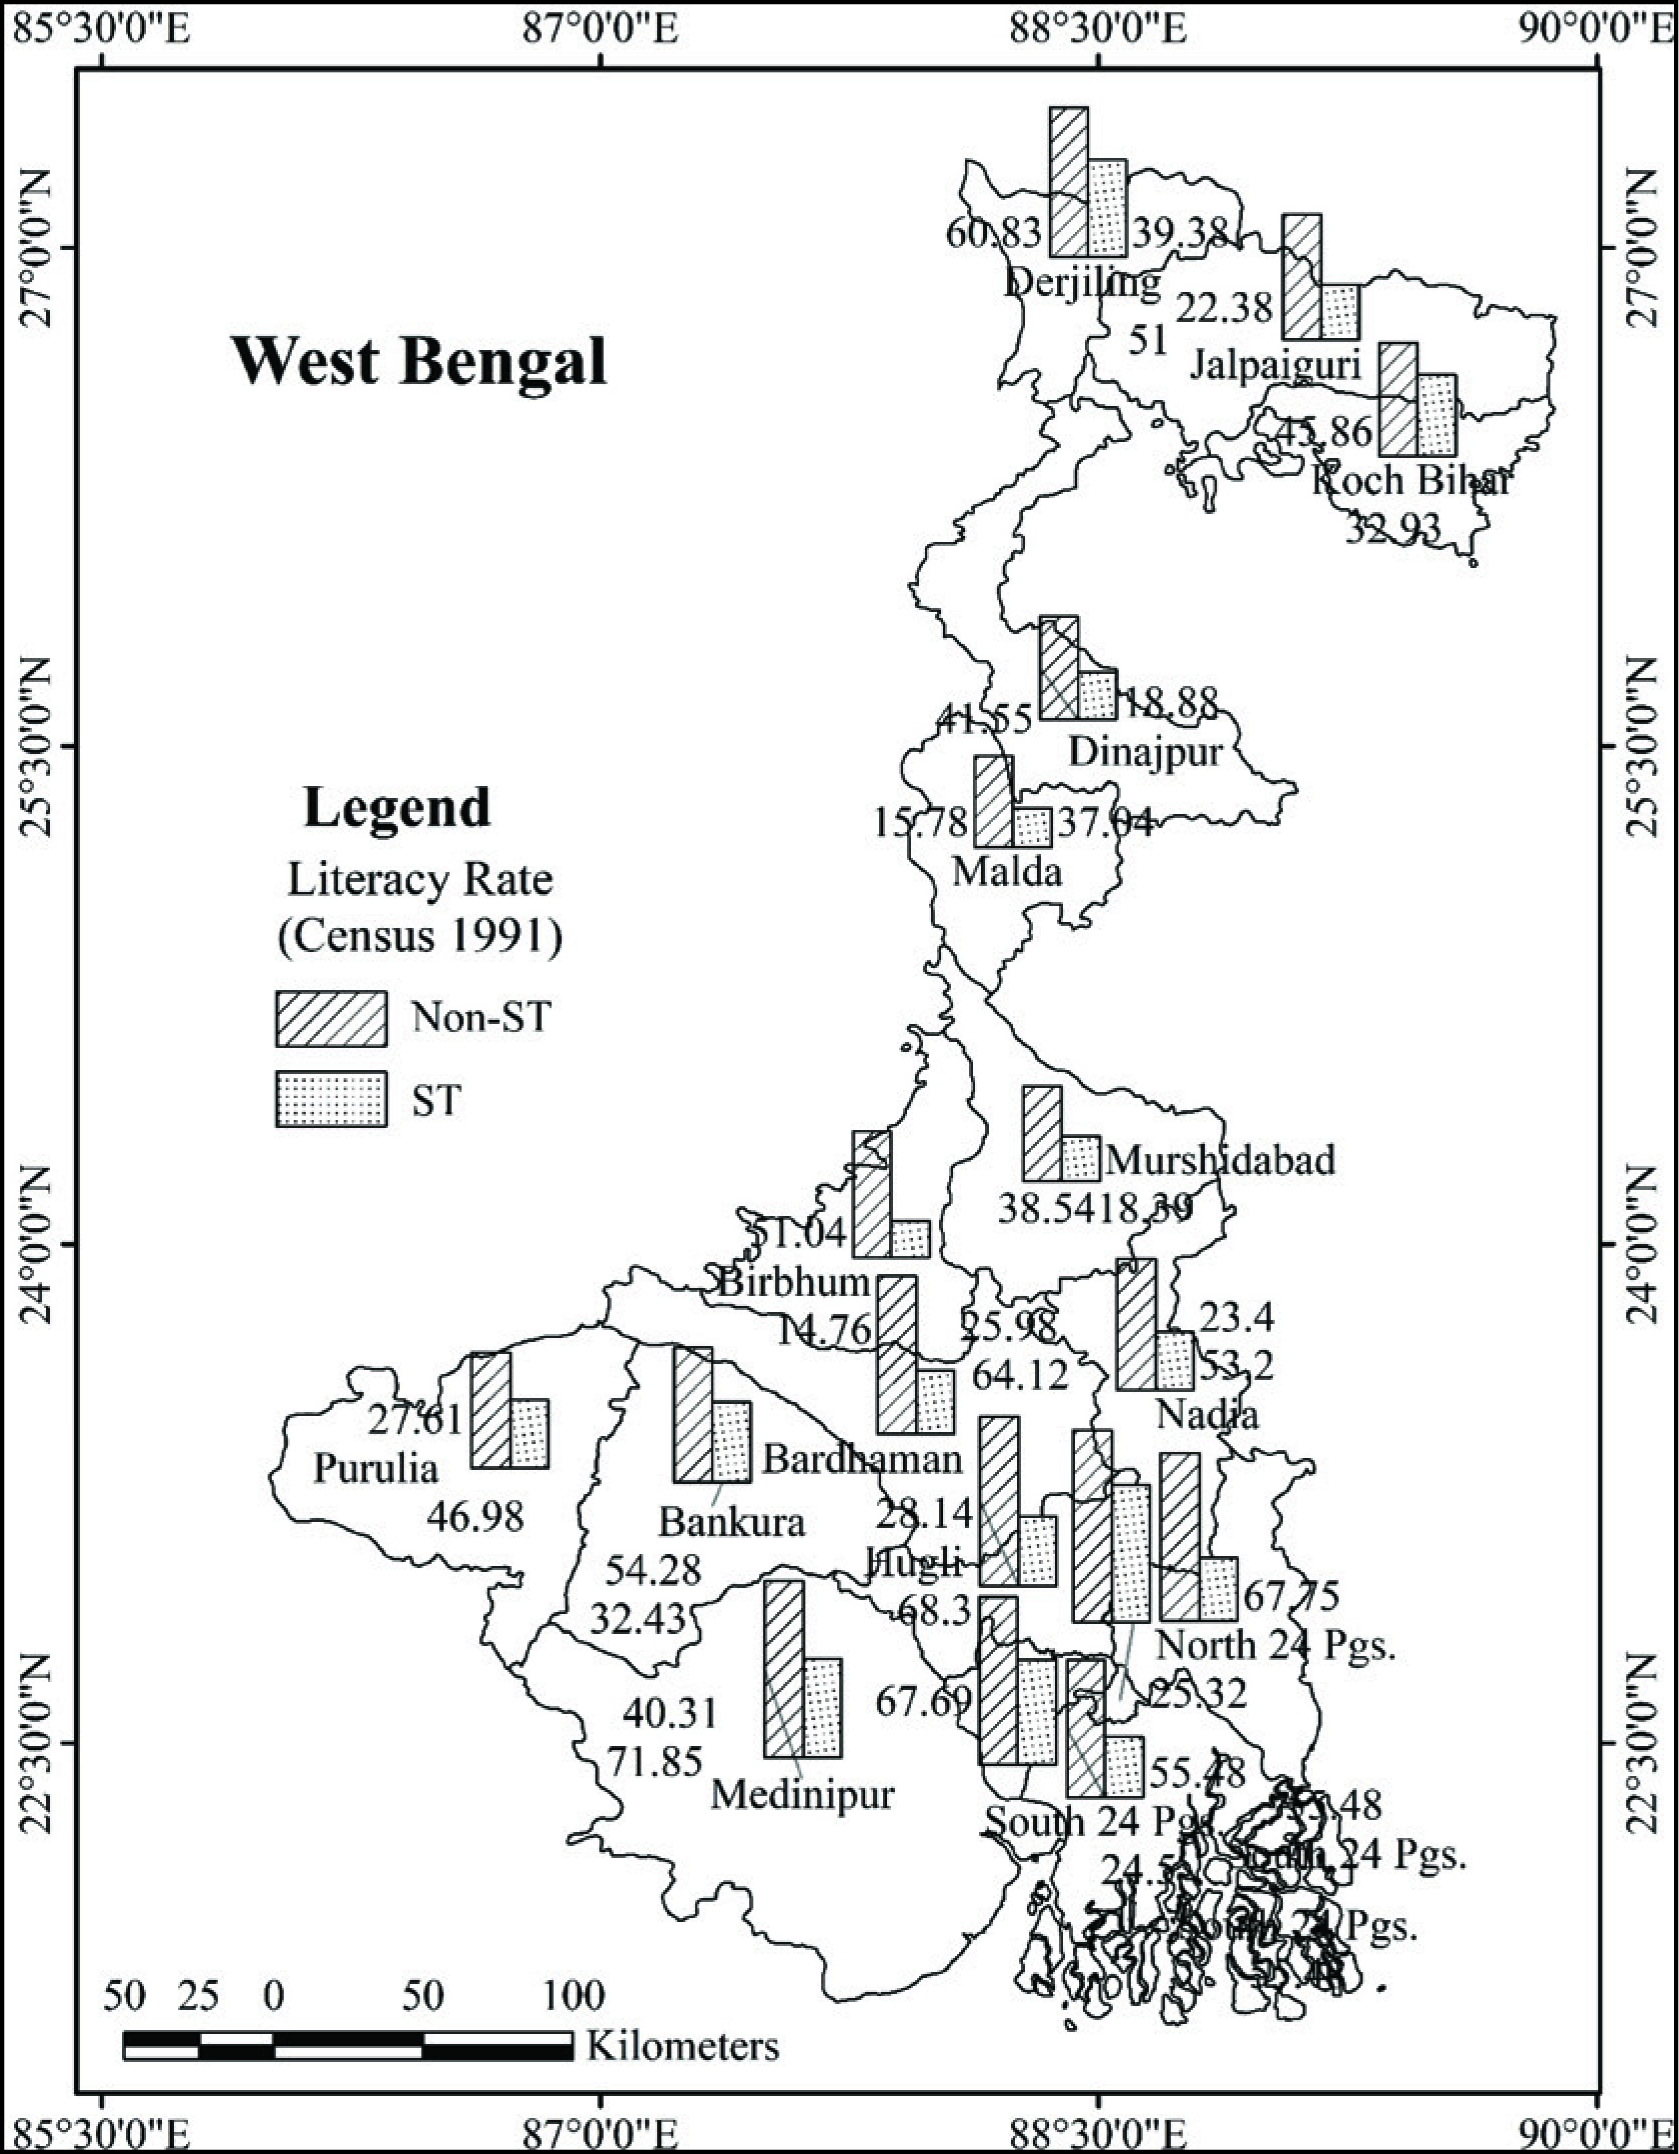
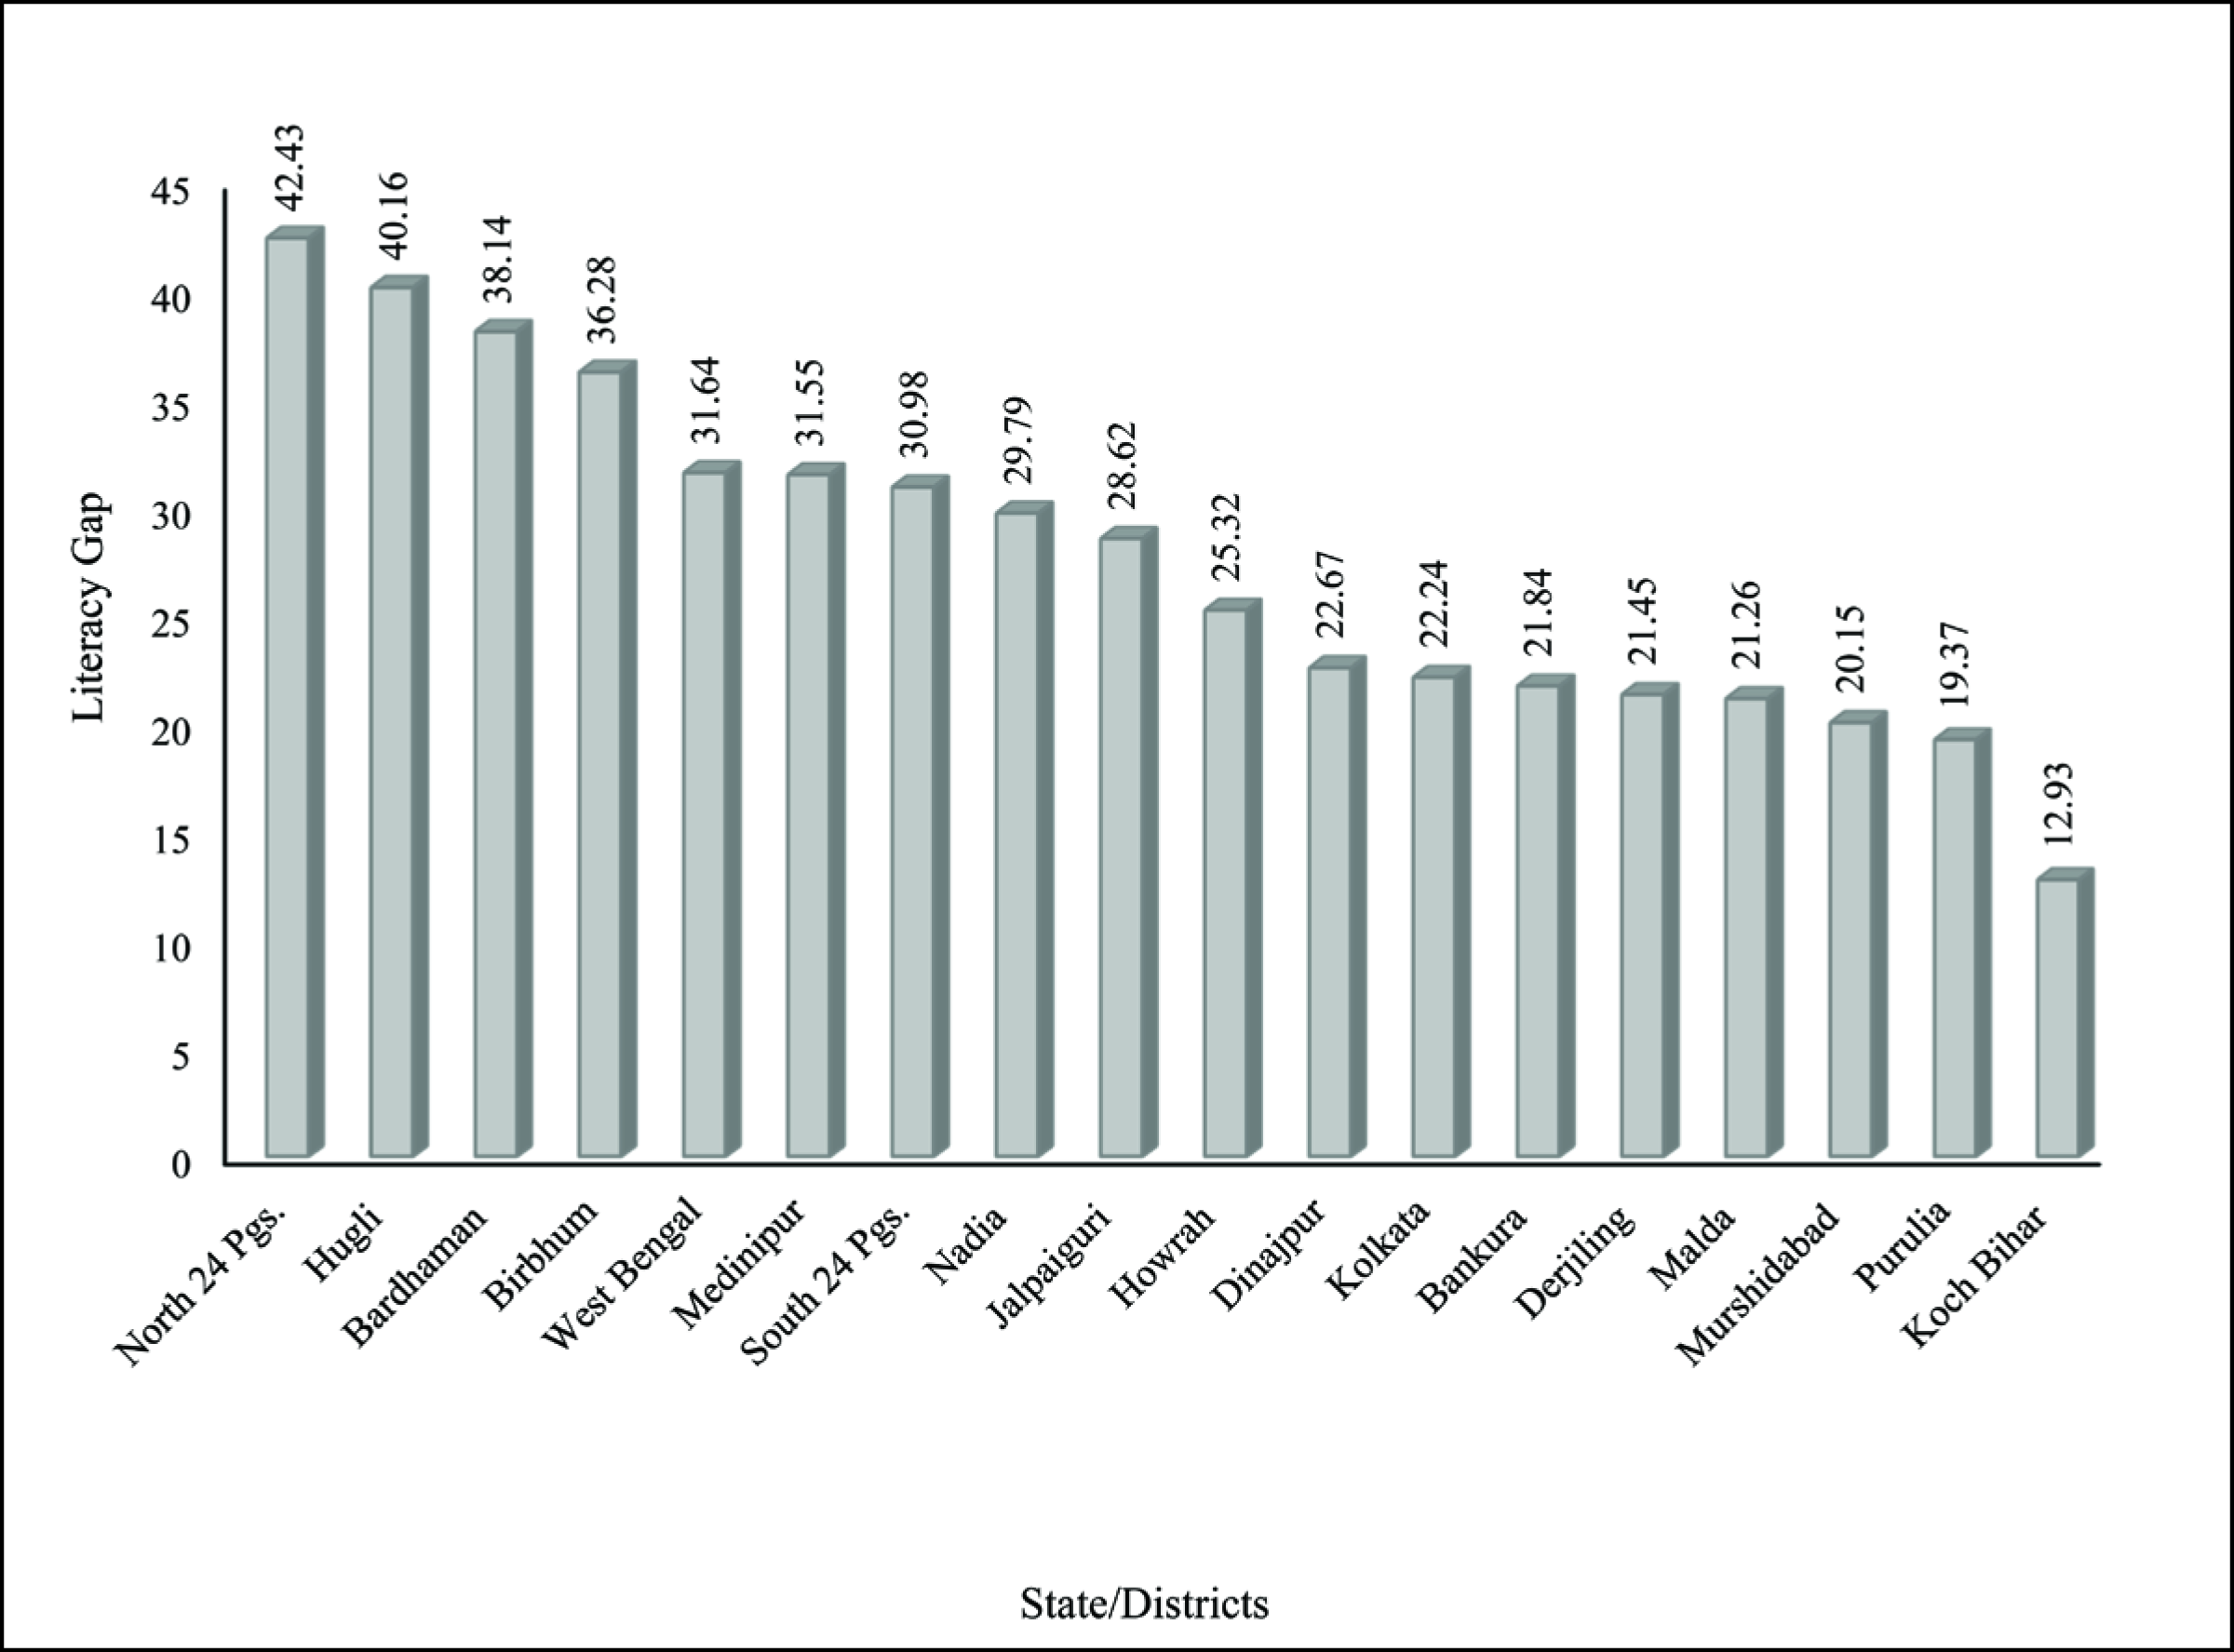
In Census 1991, the state average literacy rate in the ST community was very low, that is, 27.78%, which was much lower than its non-ST (59.42%) counterparts. However, the result was not equal for all the districts in the state (Appendix 2; Figure 7). The range of literacy rates in both communities was very high, that is, more than 40%. There were seven districts, namely Darjeeling, Bardhaman, North 24 Parganas, Hugli, Howrah, Kolkata and Medinipur, where the non-ST literacy rate was more significant than the state level. Malda (37.04%) held the lowest literacy for this community, followed by Murshidabad, West Dinajpur and Cooch Behar. There were only seven districts for the ST, namely Darjeeling, Cooch Behar, Hugli, Bankura, Howrah, Kolkata and Medinipur, holding a higher literacy rate than its average state literacy. In this census year, Birbhum (14.76%) had the lowest literacy rate for ST, followed by Malda, Murshidabad and West Dinajpur. On the other hand, in Kolkata, the literacy rate was highest for both the communities. It also has found that except for Kolkata, Howrah and Medinipur, in the rest of the districts, more than 60% of ST people were illiterate until the 1991 census. The state-level literacy gap between these two groups was 31.64% and varied among the districts (Appendix 2; Figure 8). In Cooch Behar, the gap was lowest (12.93%), followed by Purulia, Murshidabad and Malda. On the other hand, the highest gap was recorded in North 24 Parganas (42.43%) followed by Hugli and Bardhaman.
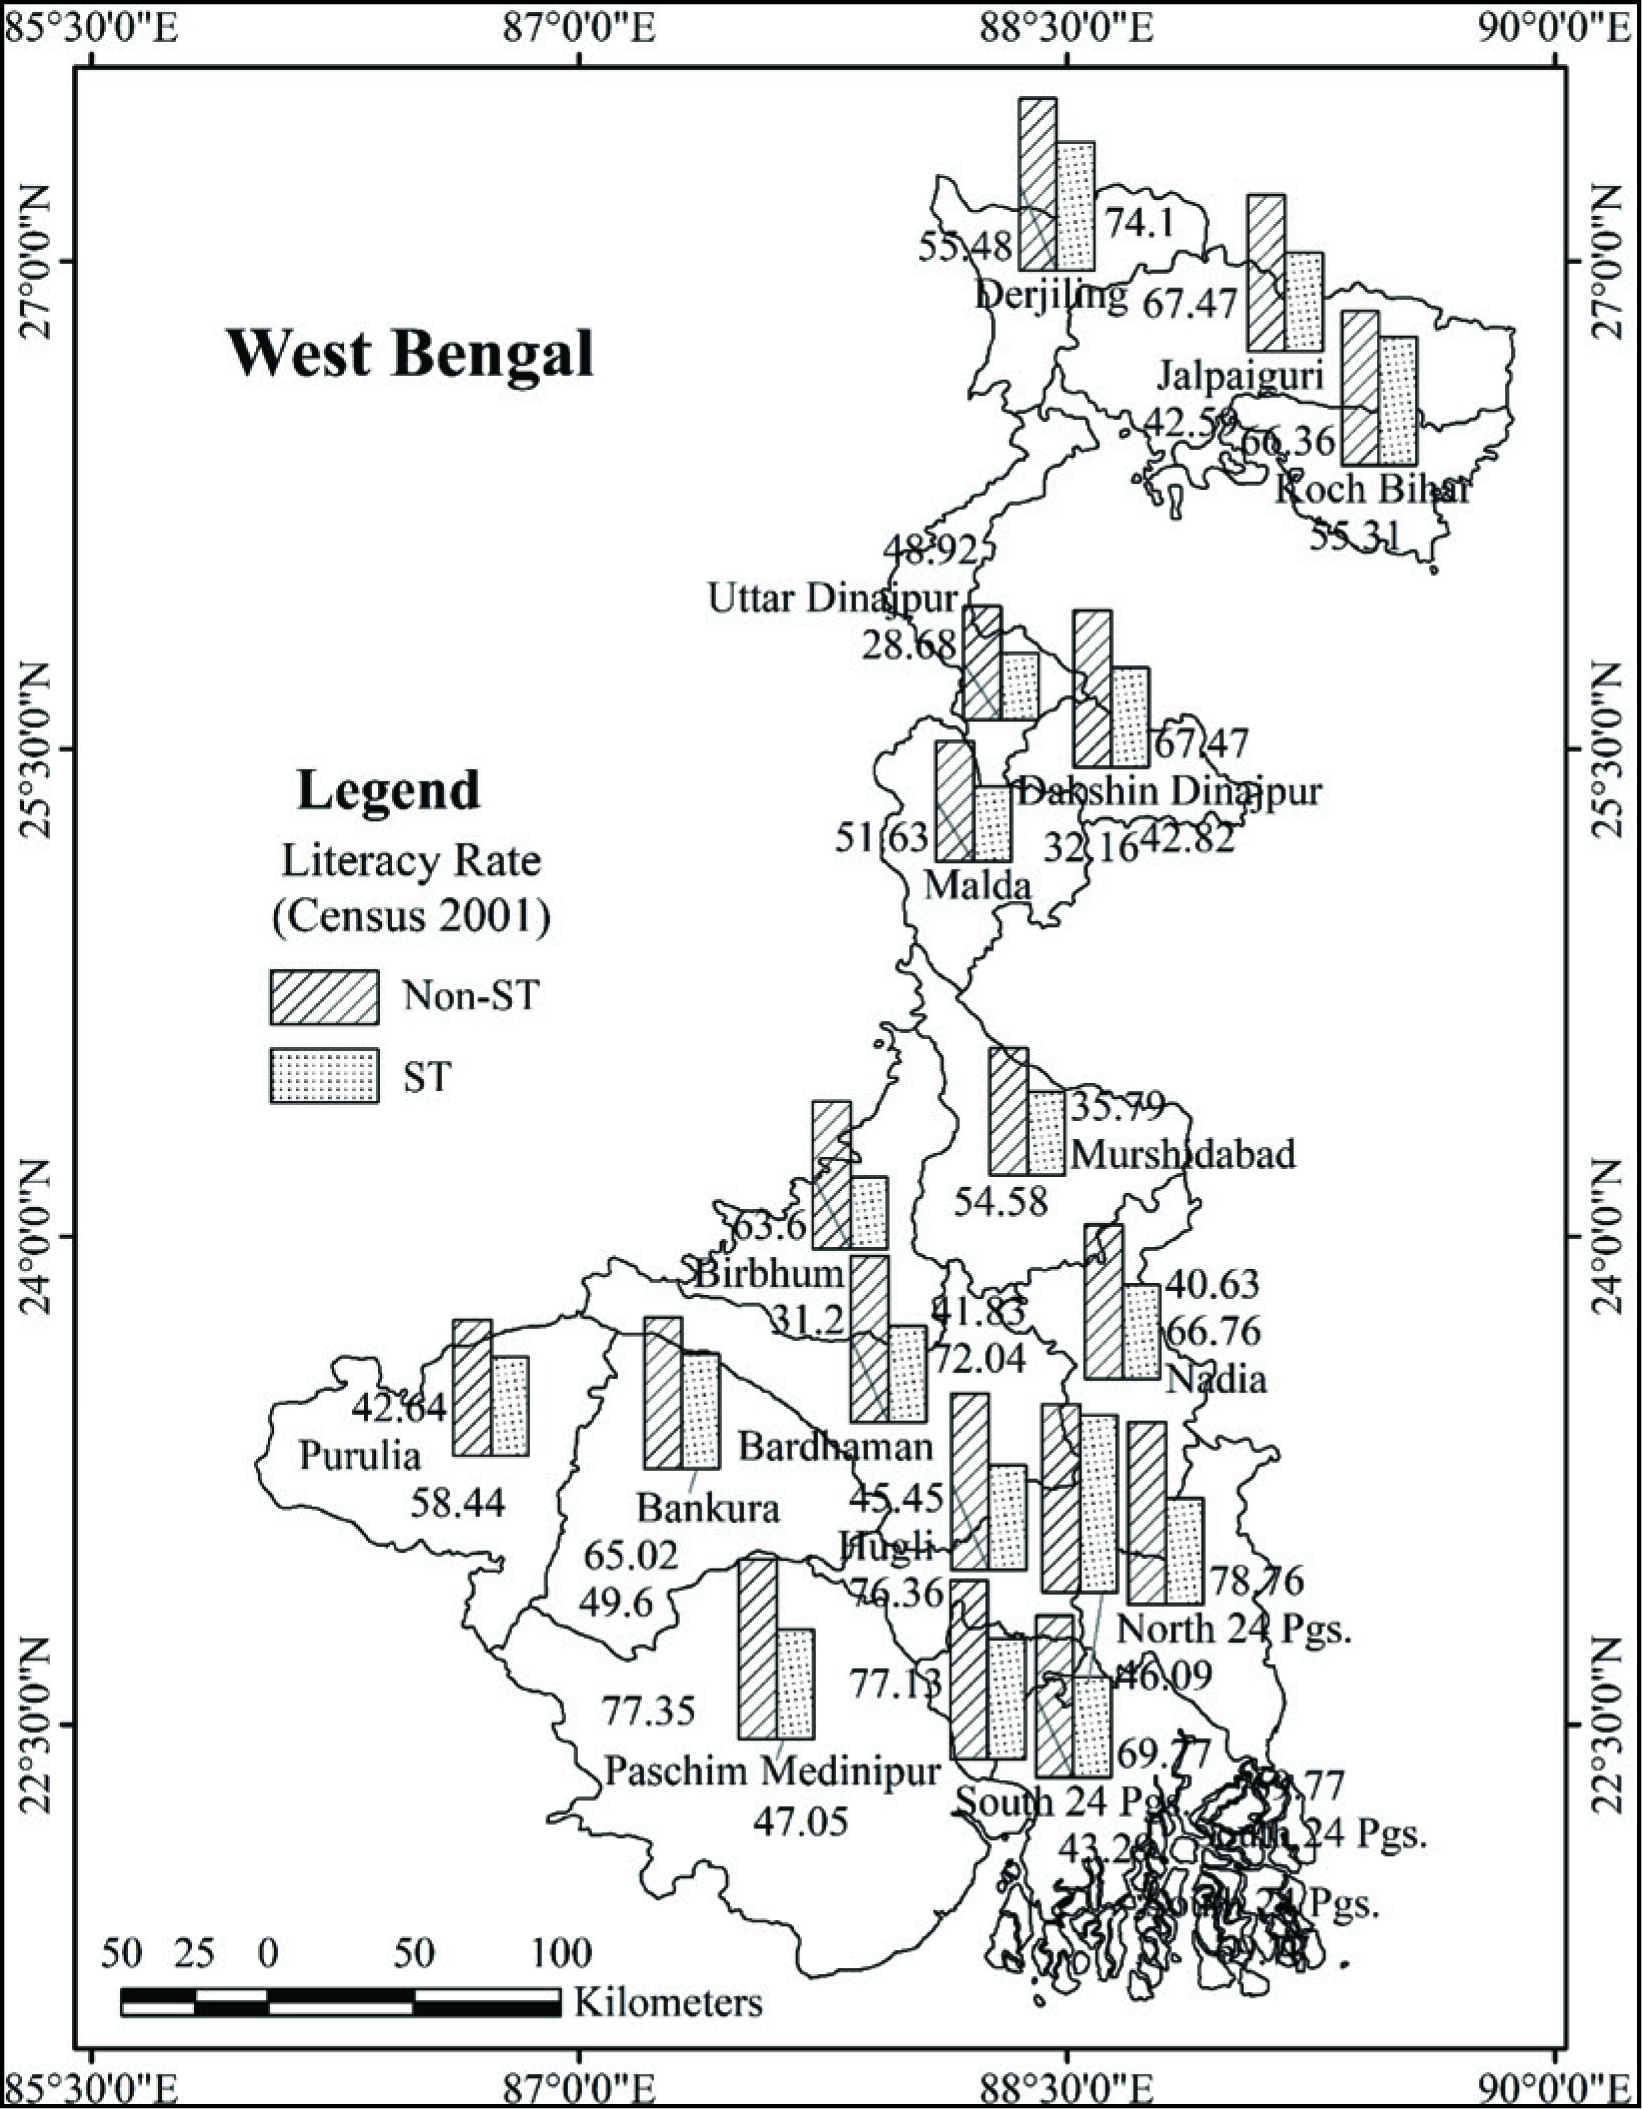
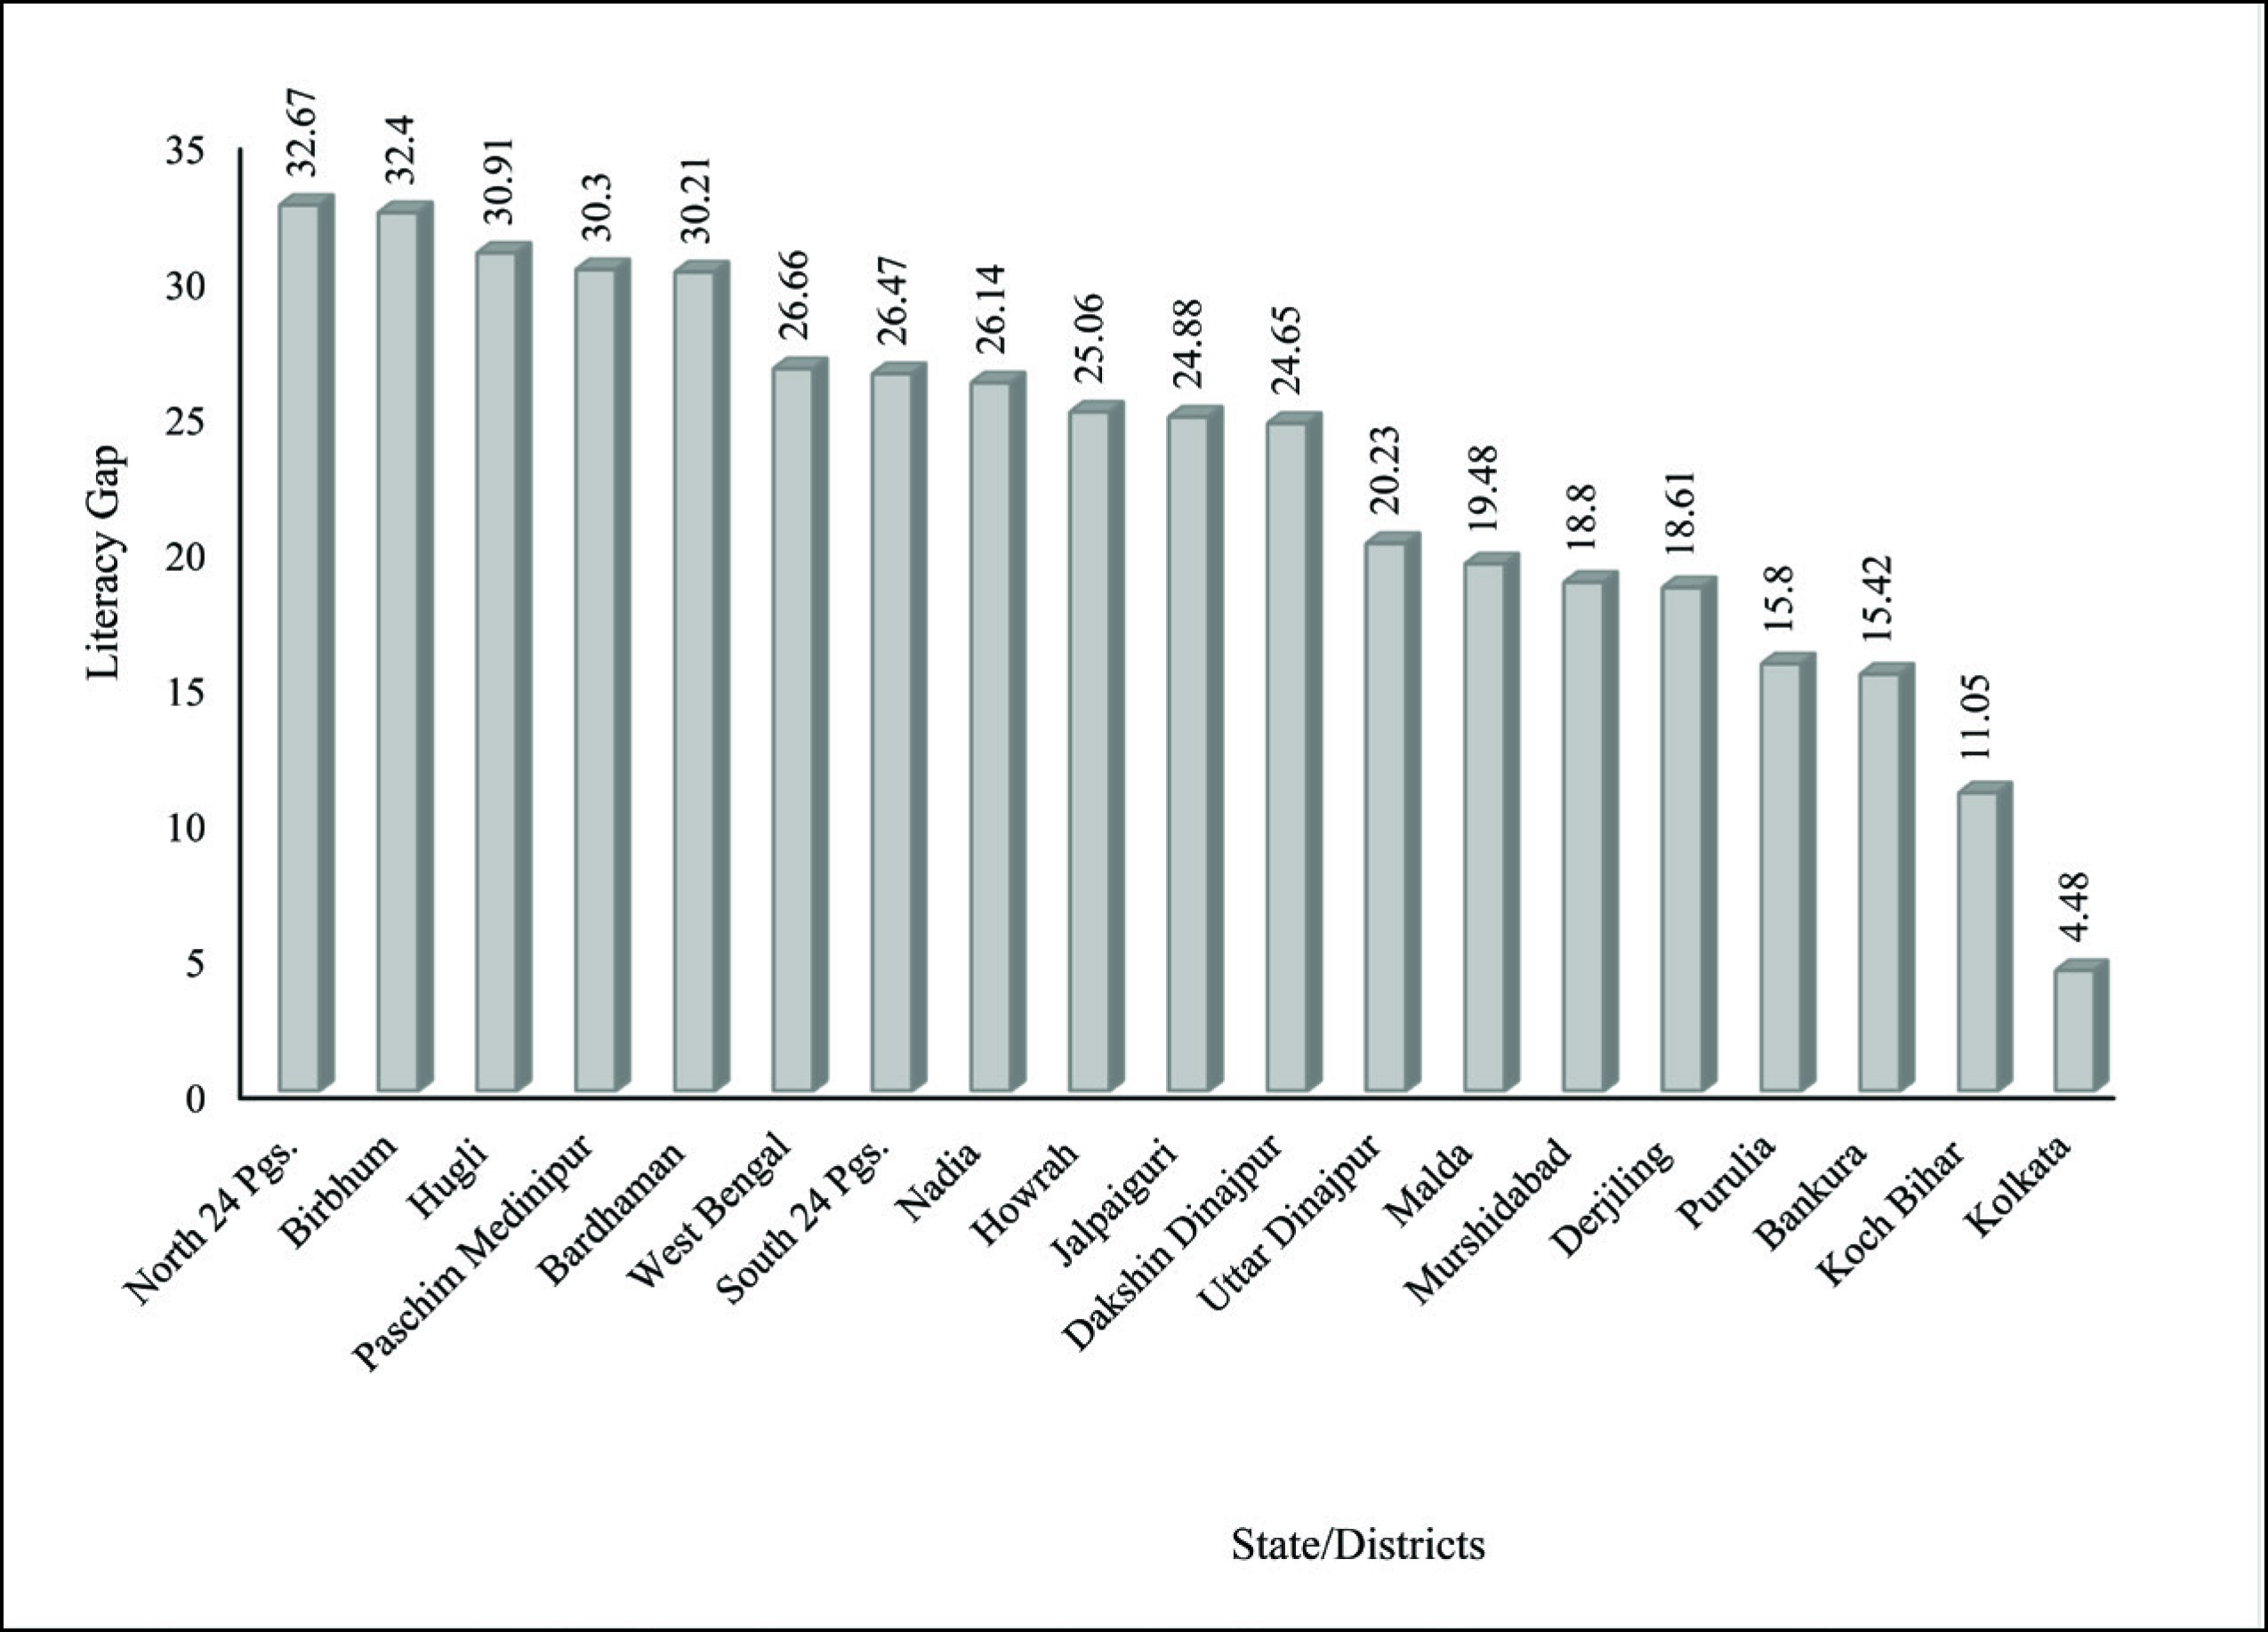
In Census 2001, at the state level, the literacy rate for the non-ST community was significantly improved to 70%. However, at the same time, half of the ST people were still illiterate, that is, 56.60% (Appendix 2; Figure 9). Because of that, the gap between these two communities was very high—about 27%. An impressive result was found that only those districts holding greater than the average literacy rate in the state level for non-ST communities in 1991 were on the same list for Census 2001. No other district had been added to it. However, for the ST community, two new districts, North 24 Parganas and South 24 Parganas were added to the list holding higher literacy rates than the state level of ST literacy and the other six districts included in the 1991 census. As the previous census year in Kolkata, the literacy rate was highest for both the communities in 2001. In this district, the ST literacy rate was 76.39%, which was even more significant than the average state literacy of the non-ST community. In 1992, West Dinajpur was divided into two districts, that is, Uttar and Dakshin Dinajpur. That is why in the 2001 census, the figures were different for both the districts, and Uttar Dinajpur came out as the most backward in the field of literacy. In this district, the literacy rate was lowest for both the ST and non-ST communities holding 28.68% and 48.92% literacy rates, respectively. Another fact was that more than half of its non-ST people came under the umbrella of literacy in the 2001 census in all the districts of West Bengal, except Uttar Dinajpur. However, for the ST community, it was woeful that even after 50 years of independence, there were only four districts, namely Darjeeling, Cooch Behar, Howrah and Kolkata, that came under the same. From another point of view, it has been revealed that the decadal growth of literacy at the state level was more remarkable in the ST community (15.62%) than in the non-ST community (10.64%). The highest decadal growth of literacy rate from 1991 to 2001 had been recorded in Cooch Behar for both the ST and non-ST community, that is, 22.37% and 20.50%, respectively. A positive result that was observed in all the districts was that the improvement of literacy rate was higher in the ST community than in the non-ST community. In the capital of the state, that is, Kolkata, the decadal growth of literacy of non-ST community was 3.22%, while it was 20.98% for the ST community. The literacy rate gap between these two communities based on the census of 1991 and 2001 shows different results (Appendix 2; Figure 10). However, ST is still lagging behind in all the districts of the state. Though the gap had declined, it was still very high in all the districts, except Kolkata. As a result, the highest literacy gap had been recorded in North 24 Parganas (32.67%) followed by Birbhum, Hugli and undivided Medinipur.
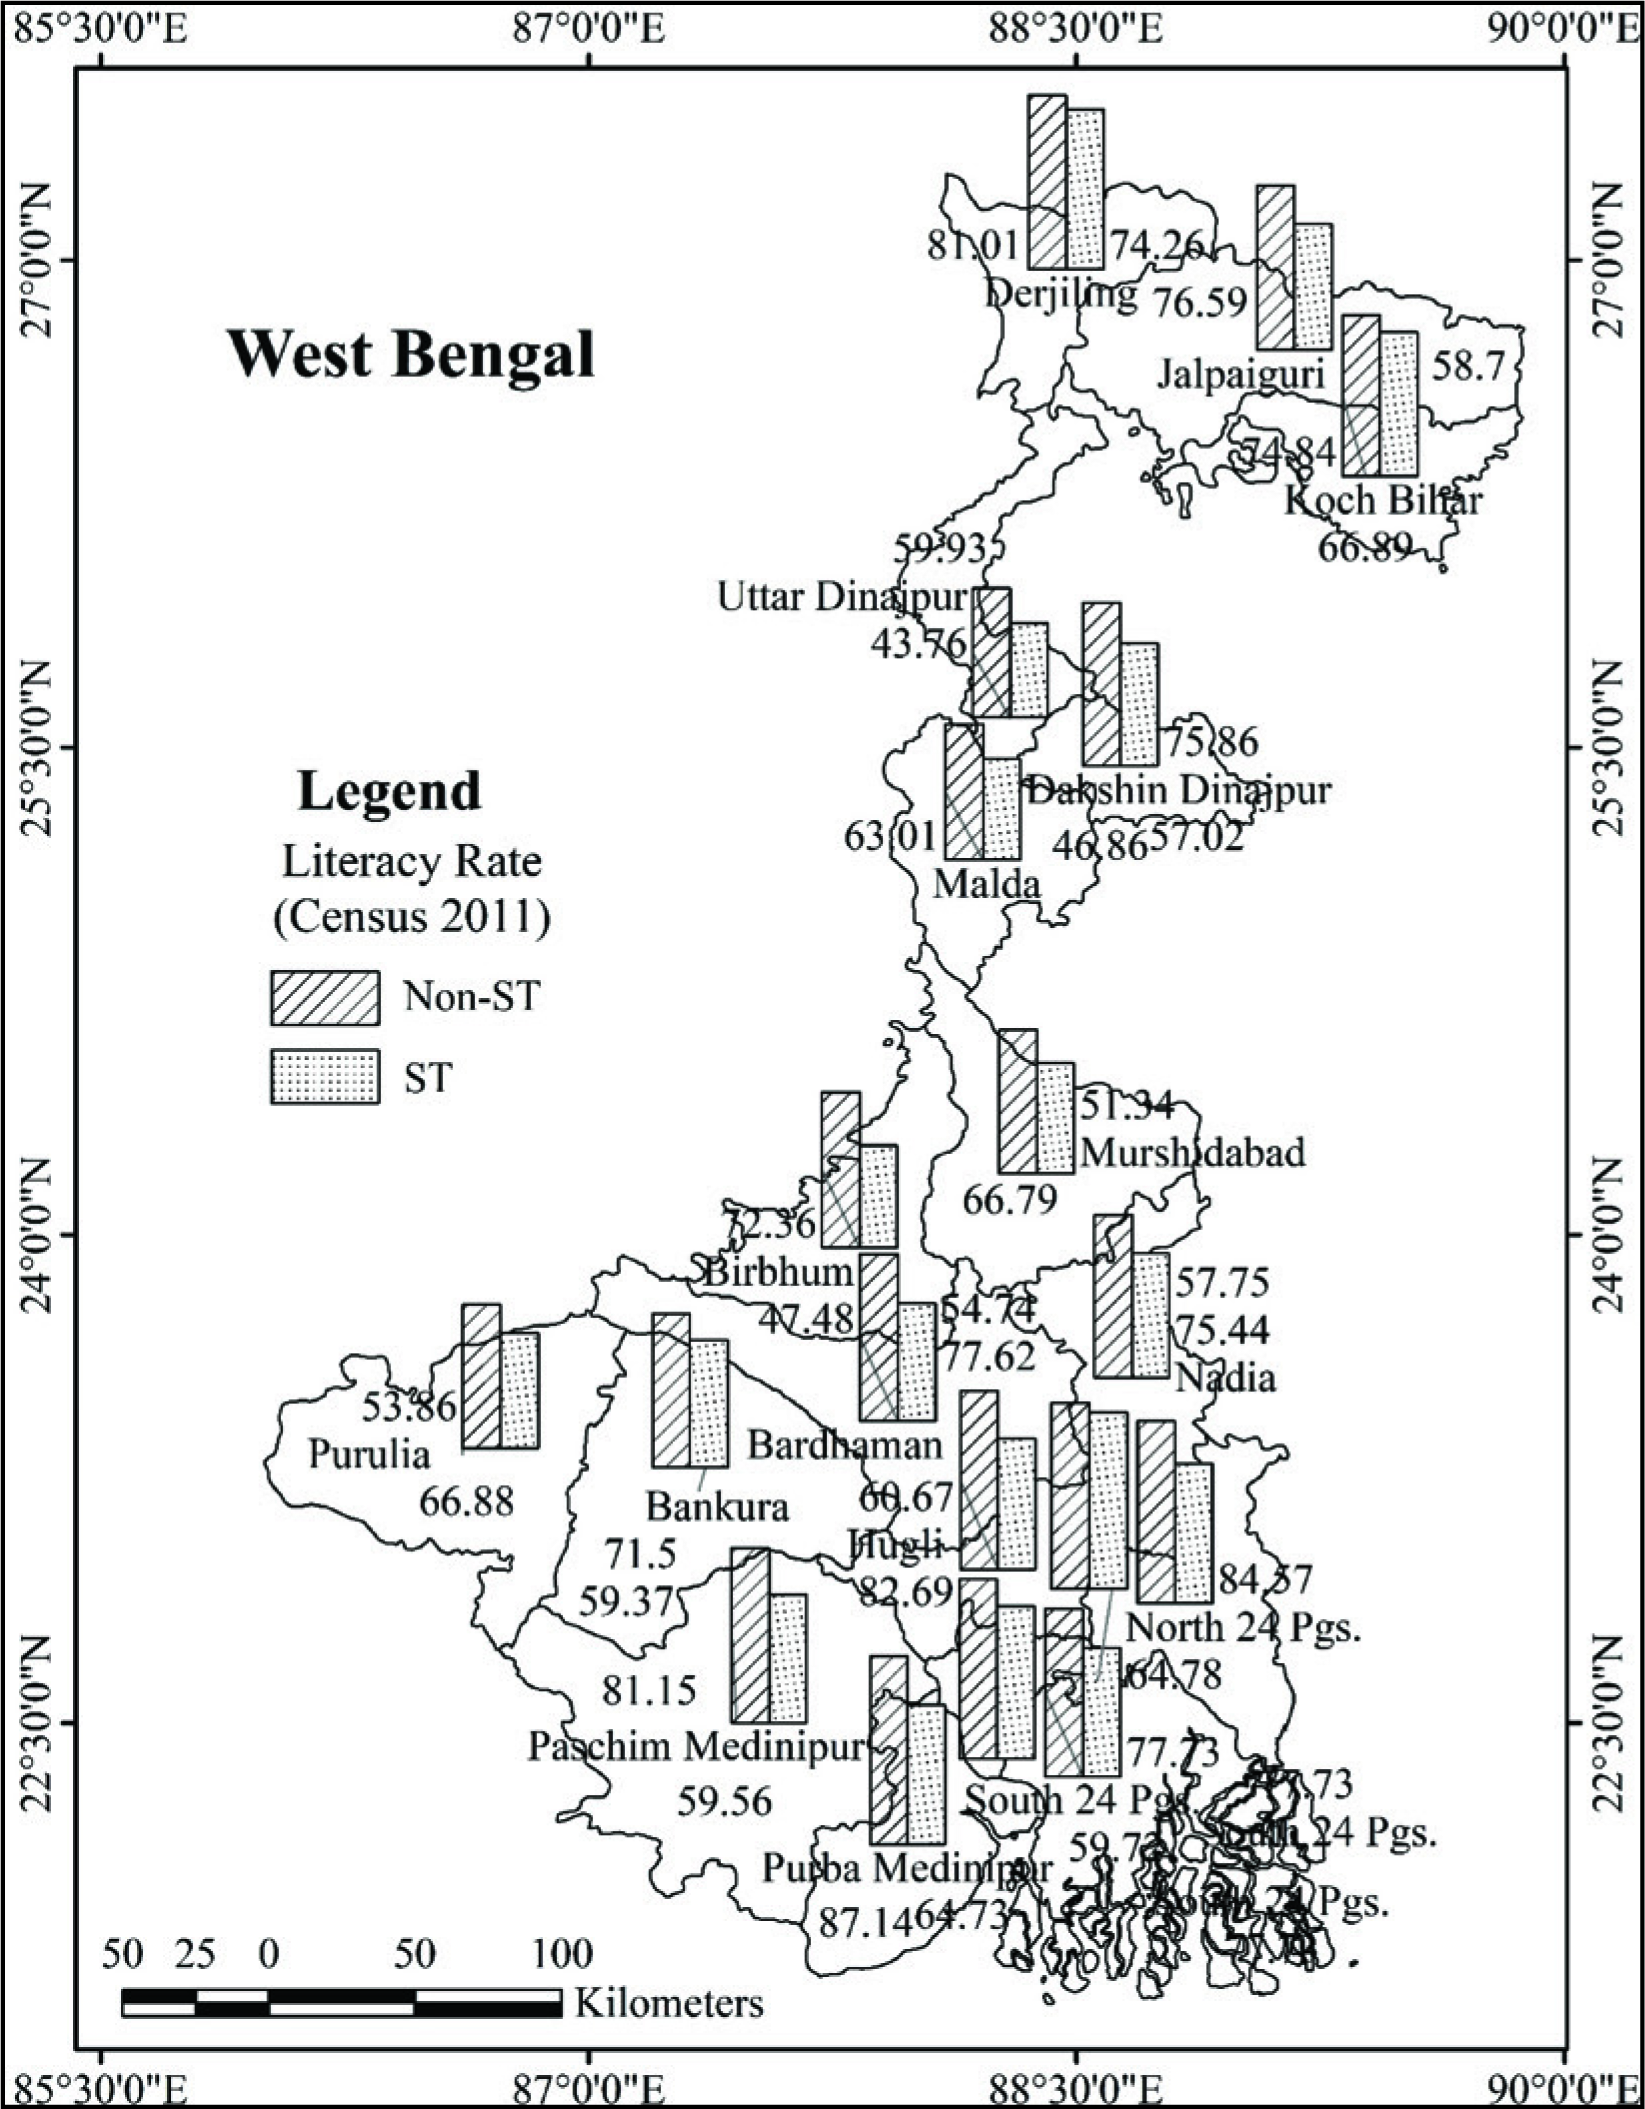
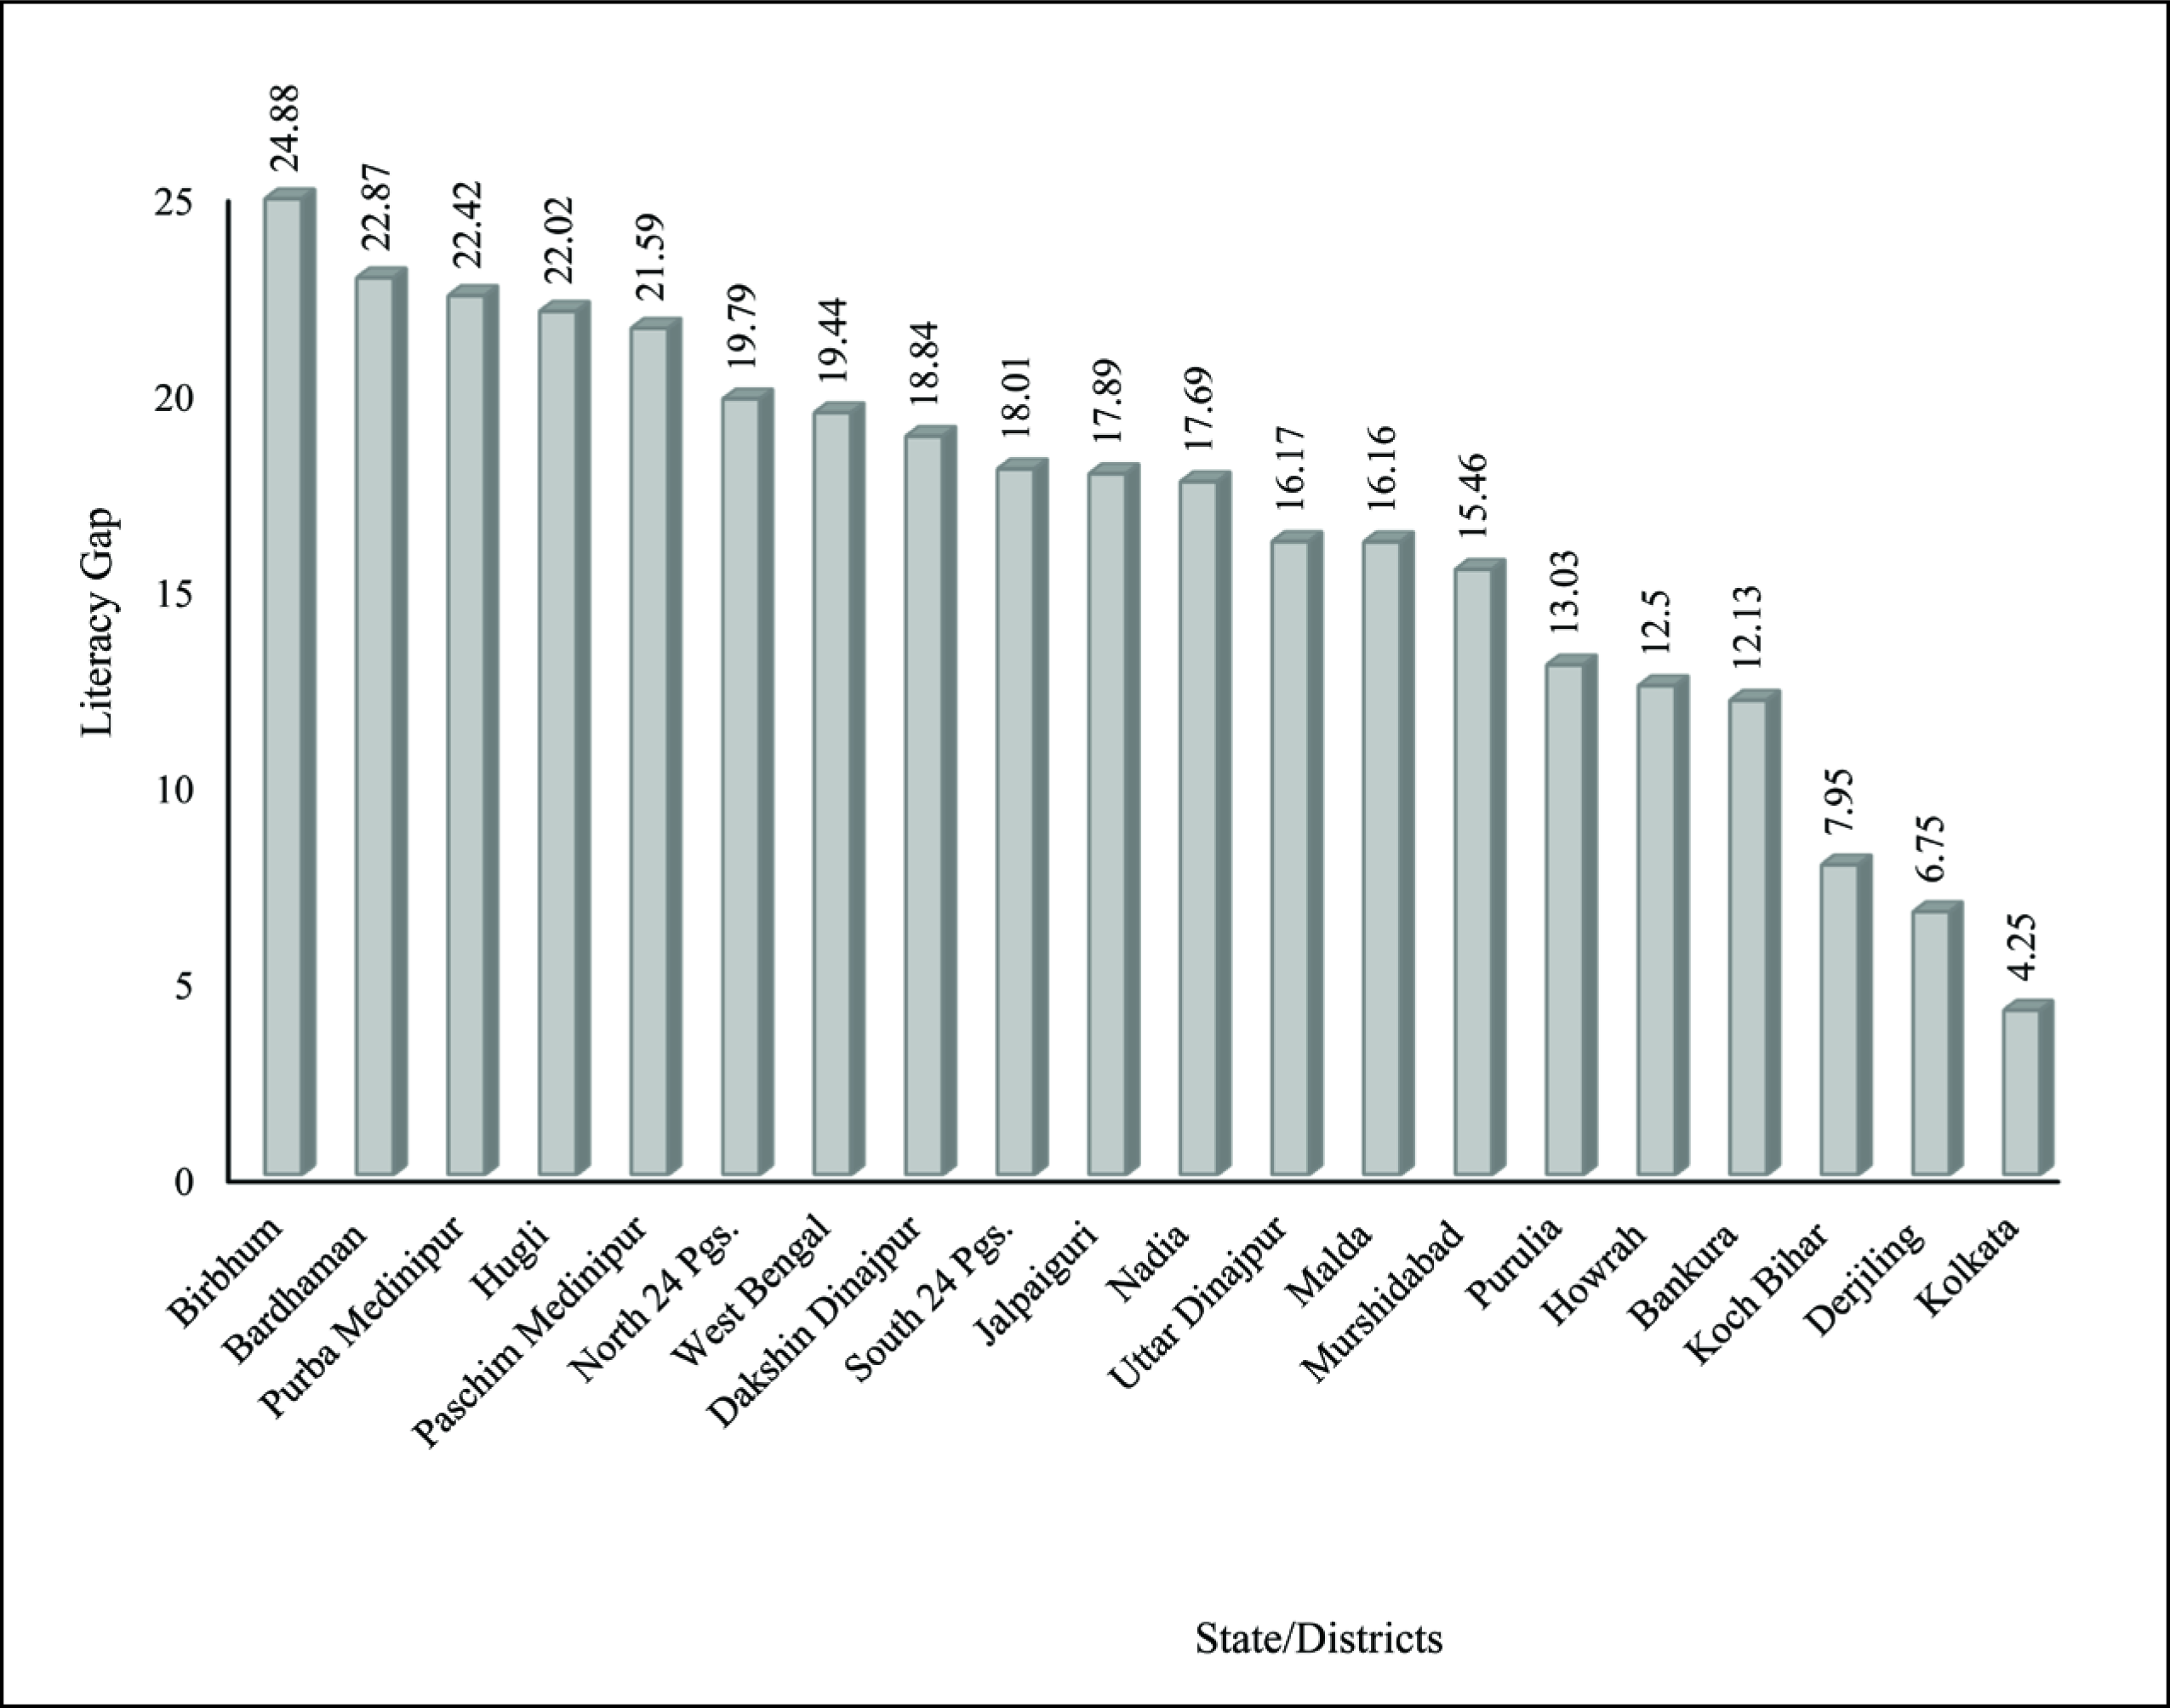
As per the last census of India, that is, 2011, the figure has entirely changed, and the ST community has shown much improvement (Appendix 2; Figure 11). At the state level, the average literacy rate of the ST community was 57.93%, which was more than double of the 1991 census. In Uttar Dinajpur, the literacy rate was lowest (43.76%) in the ST community followed by Malda and Birbhum. Except for these three, the rest of the 16 districts have recorded that the literate ST persons are more than half of their total ST population. In this census, the literacy rate of the non-ST community was 77.37% at the state level. Only in four districts, namely Uttar Dinajpur, Malda, Murshidabad and Purulia, the literacy rate was less than 70%; for the rest of the districts, the rate was more than that level. Medinipur was divided into two districts, that is, Purba Medinipur and Paschim Medinipur, in 2002, and because of this, individual literacy rate has been recorded for each in the last census year. As of Census 2001, undivided Medinipur held 77.35% literacy rate for non-ST, which was increased to more than 80% in Census 2011 for both the separated Medinipur district. Like the other census year, the highest literacy rate of the ST community has been found in Kolkata (82.06%). However, for the non-ST community, Purba Medinipur (87.14%) held the top position. From Census 2001 to Census 2011, the decadal literacy growth for the non-ST community was 7.31%, and for ST, it was double, that is, 14.53%. The highest decadal growth has been recorded in Murshidabad (12.21%) followed by Malda and Uttar Dinajpur for the non-ST community. On the other hand, for the ST community, the maximum growth has been observed in Howrah (18.79%), followed by Darjeeling and North 24 Parganas. The lowest literacy growth has been found in Kolkata for both the communities. From another point of view, the literacy gap between these two communities was 19.44% at the state level (Appendix 2; Figure 12). The highest literacy gap between these two groups was recorded in Birbhum (24.88%) and the lowest in the state’s capital, that is, Kolkata (4.25%).
Paired Sample t-Test
In this study, a paired sample t-test was applied to compare the literacy rate of the ST and non-ST communities (Table 4). The test found a statistically significant difference in literacy rate between these two groups in all the census years as the p-value is <0.01 (two-tailed). The statistical outcome reveals that the mean literacy rate in the non-ST community was more significant than the mean ST literacy rate for all the census years. This result proves that the literacy rate was much better in the non-ST community than its ST counterpart in West Bengal.
Paired Sample t-test of Literacy Between ST and Non-ST Community.

Changing Literacy Gap Between ST and Non-ST Communities in Rural and Urban Bengal
The community literacy gap between these two groups in the rural and urban areas has been calculated by deducting the ST community’s literacy rate from its non-ST counterpart. A positive gap indicates that the literacy rate is higher in the non-ST community as compared to its ST counterpart, and a negative gap indicates its opposite. Table 5 shows the literacy gap between two communities in rural and urban areas in all the census years. There is no population living in rural areas in Kolkata, and that is why the literacy gap has been shown only for the urban area of the district for all the census years. In the rural area, the non-ST community was better for all the districts than their ST counterpart in every census. The same result also has been found in the urban, except for Darjeeling (Census, 2001, 2011) and Murshidabad (Census, 2011).
In the 1991 census, the literacy gap in the rural and urban areas was very high, that is, 25.38% and 33.07%, respectively, at the state level (Table 5). Like the state average, in most districts, the literacy gap in the rural area was lower than the urban area. There were only four districts: Darjeeling and Jalpaiguri from North Bengal; Bankura and Howrah from South Bengal. The literacy gap was lower in the urban area than in its rural counterpart. The lowest literacy gap for the rural area had been recorded in Cooch Behar (11.46%), and for the urban area it has been recorded in Darjeeling (0.98%). It means that Darjeeling’s urban area literacy rate was similar in both groups. On the other hand, the highest literacy gap was observed in Howrah (42.65%) for the rural area and Birbhum for the urban area (48.36%). Even in Kolkata, the urban literacy gap between these two communities was relatively higher as of this census database. An interesting fact comes to light that, in undivided Dinajpur, the gap was about two times greater in urban areas than its rural counterparts. Its opposite result has been found in Howrah, where the literacy gap in the rural area was more than two and a half times greater than its urban counterpart.
In Census 2001, the scenario had quite changed. At the state level, for both the rural and urban areas, the literacy gap between these two communities had declined, though the declining rate was higher in the urban area as compared to the rural area (Table 5). In this census year, there were only five districts, namely Uttar Dinajpur, Birbhum, Bardhaman, Nadia and Hugli where the literacy gap was lower in the rural area than the urban area. However, in the rest of the districts where the rural literacy gap was lower than the urban area in Census 1991, they have fallen in the list of higher literacy gap in the rural area as compared to their urban counterpart in 2001. It proves that in rural areas of those districts, the literacy programme has failed to achieve its goal at the ground level to reach all sections of society, especially in vulnerable rural pockets. Though it was pretty successful in urban areas, the literacy gap declined in urban regions of these districts. On the other side, in Kolkata and Bankura, the literacy gap declined most when compared to all other districts of the state. In this census year, Howrah (38.84%) held the maximum literacy gap for the rural area, while it was Birbhum (42.56%) for the urban area. It also has revealed that in Darjeeling’s urban area, the literacy rate in the ST community was higher than the non-ST community and created a negative gap (−1.49%).
Changing Literacy Gap Between ST and Non-ST Community in Rural and Urban Bengal.

#Till 2001, both East and West Medinipur were undivided Medinipur District, which was divided in 2002. As such, these figures are common for both the districts up to Census 2001.
As of the database of the 2011 census, it has been recorded for the first time that in urban areas, the literacy gap (13.77%) was lower as compared to the rural areas (16.75%) at the state level (Table 5). It also came to light that the literacy status was quite well off than all the previous censuses for both the communities; however, ST literacy lagged far behind when compared to its non-ST counterpart. This year, Darjeeling and Murshidabad were added to the negative literacy gaps. In these two districts, the literacy rate was higher in the ST community than in the non-ST community. Like all the previous censuses, the maximum literacy gap in rural and urban areas was held by Howrah (26.22%) and Birbhum (32.27%), respectively. This census also reveals that the declining literacy gap between ST and non-ST communities is prolonged, particularly in rural Bengal. However, the result is quite good in urban Bengal, though literacy inequality exists between these two communities. The result clearly shows that even in the twenty-first century, a large proportion of the ST community is under the darkness of illiteracy. It also proves that India’s most disadvantaged caste group, that is, ST, is socially backward in West Bengal and educationally lagged far behind its non-ST counterparts.
Changing Gender Literacy Disparity in ST and Non-ST Community
Disparity mainly shows the level of inequality between the two groups. Here, literacy disparity has been measured between the male and female populations of ST and non-ST communities. In this study, a higher disparity value indicates a wide gender gap of literacy, and a lower value is the opposite. From Census 1991 to Census 2011, it was found that in all the districts, the percentage share of male literacy was higher than female literacy for both the social groups. Because of that, in all the cases, disparity has been recorded, though its magnitude was not the same (Appendix 3). As of Census 1991, at the state level, the literacy disparity between males and females in the ST community was more than double (0.49) with respect to the non-ST community (0.22). Even in the first two census year of the twenty-first century, that is, 2001 and 2011, the gender literacy disparity in the non-ST community has recorded less than half of the ST community. However, the gap of literacy disparity between these two social groups has a declining trend. An exciting result can be observed for Census 2011—the disparity in ST community was 0.22 in the state, which is the same as the non-ST community in the 1991 census. It indicates that in West Bengal, the gender disparity of literacy is continuously narrowing down in the ST community. However, females from the ST community are still lagging far behind—about two decades— when compared to their non-ST female counterparts.
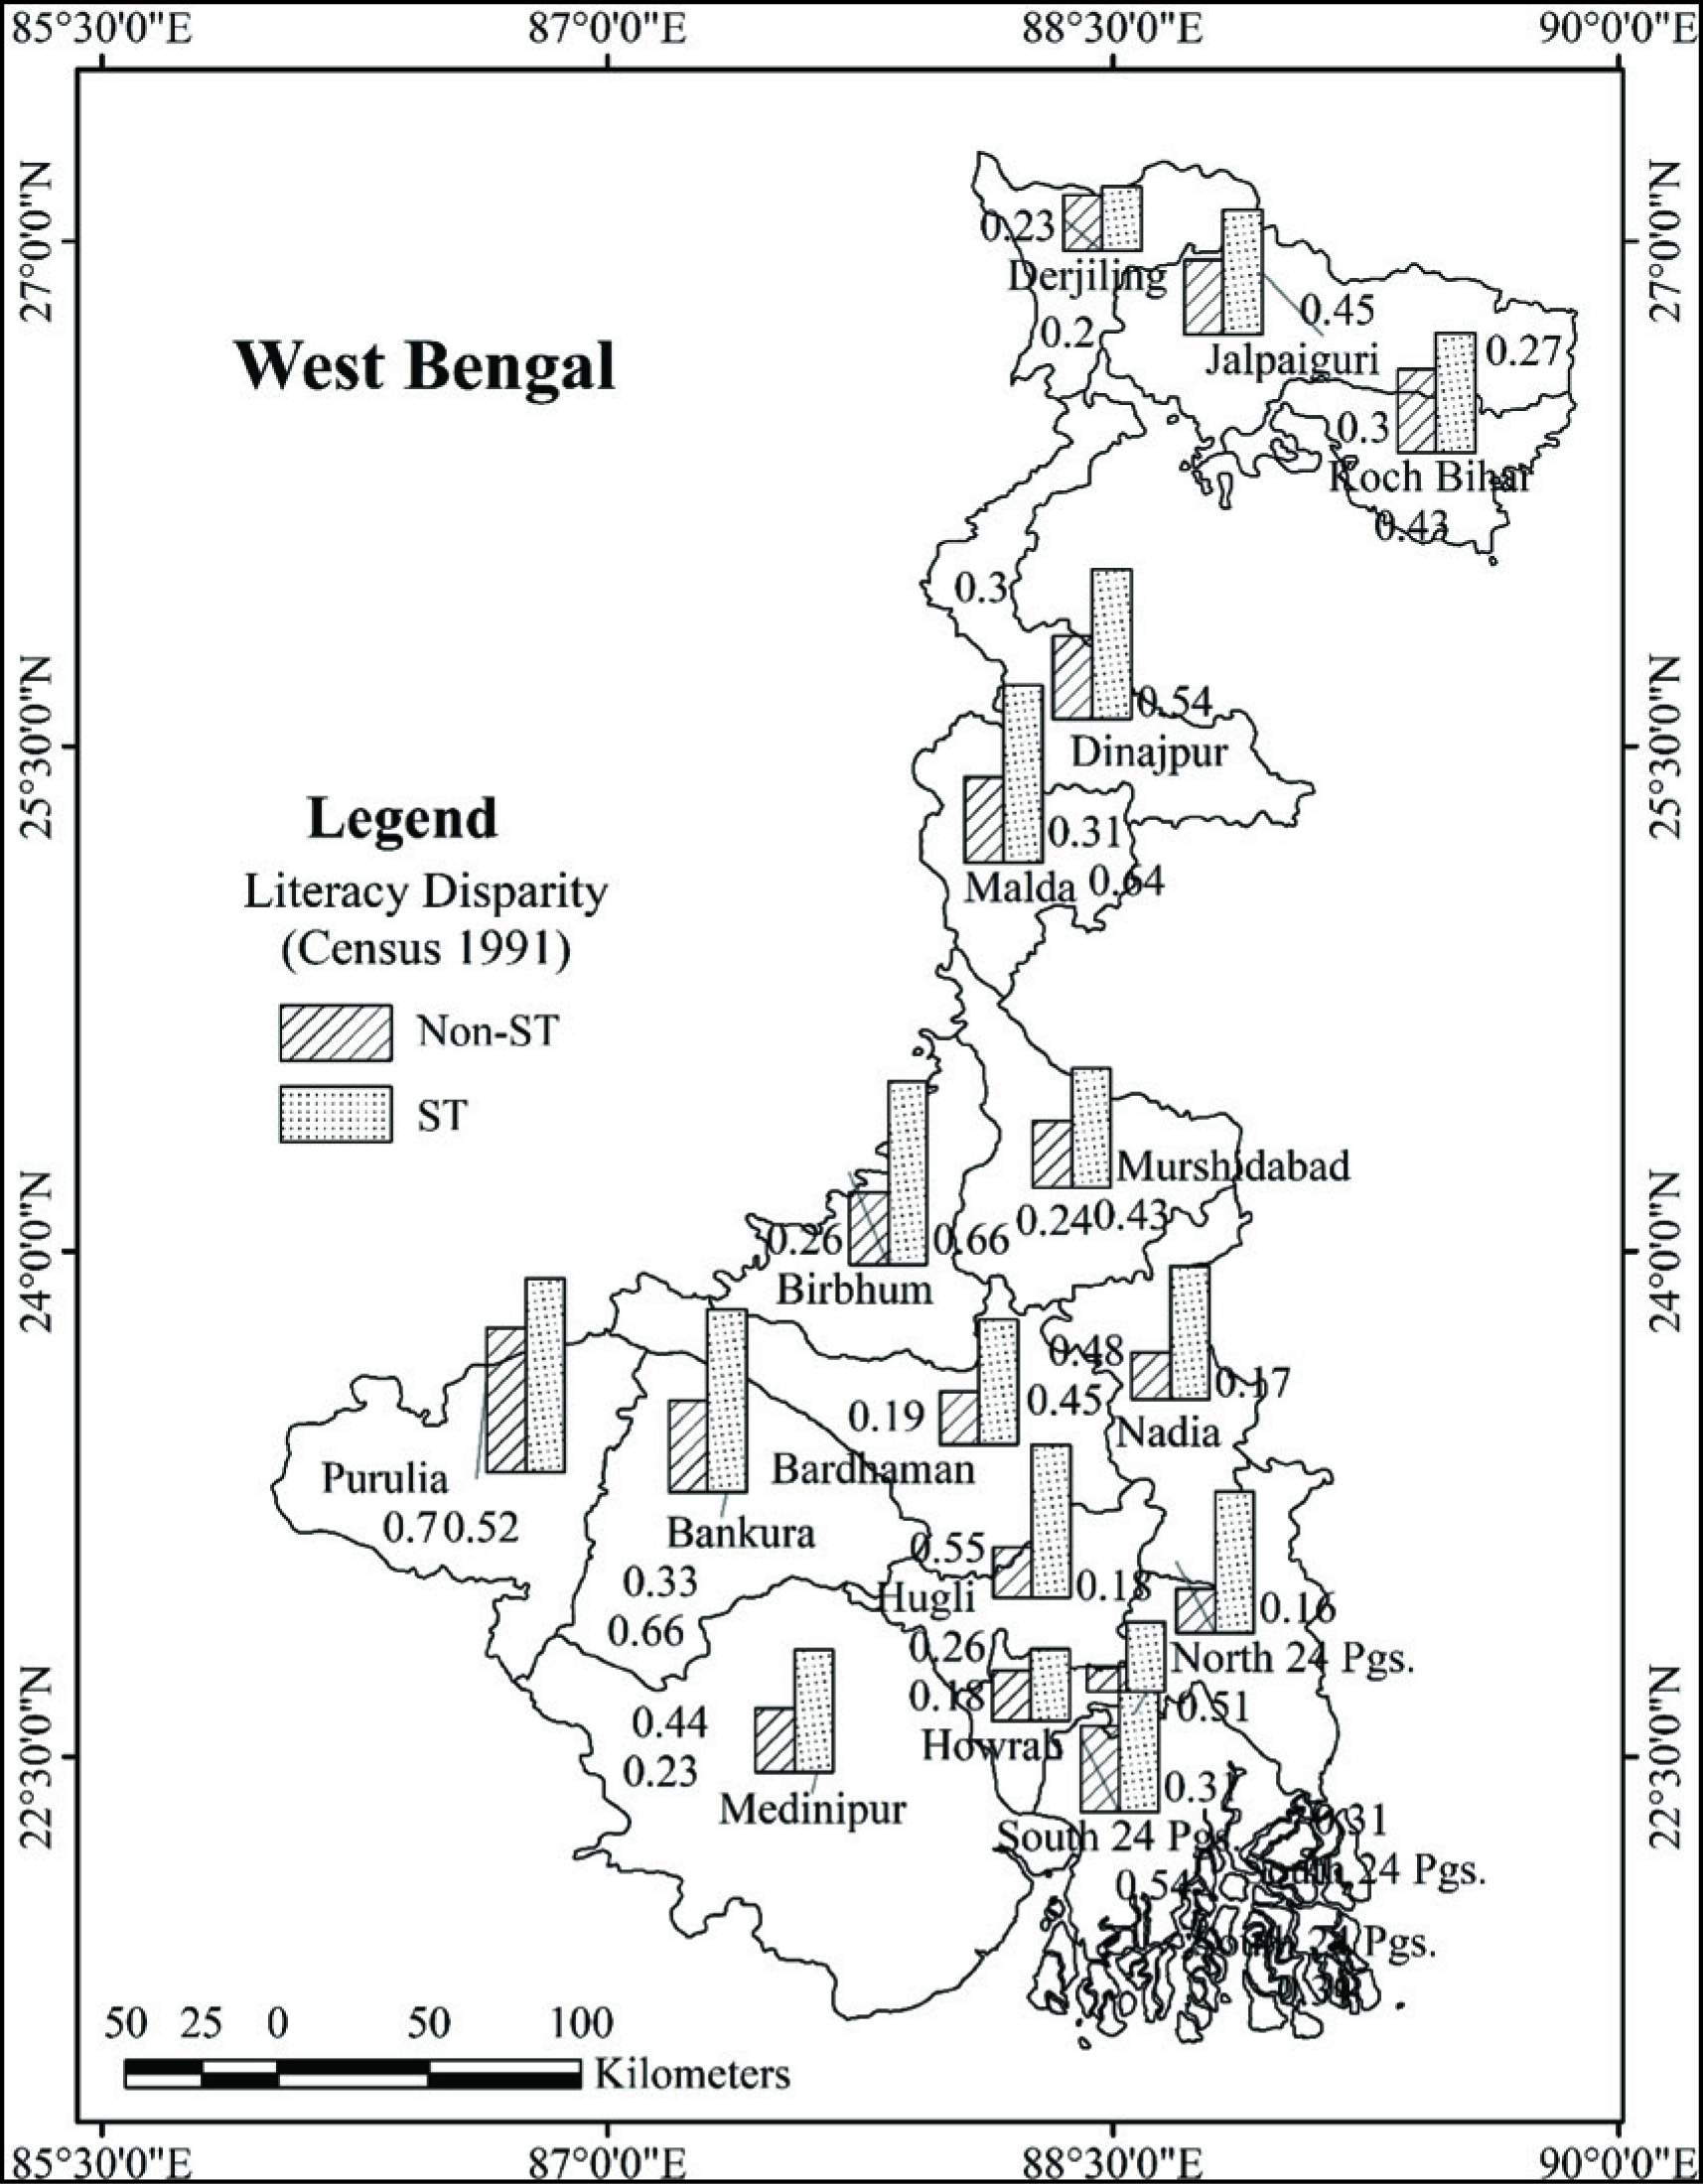
Database of Census 1991 reveals that in ST community, the disparity level was higher than the non-ST community in all the districts of the state, even more than the state average disparity level of non-ST community (Appendix 3; Figure 13). It shows that ST females are more illiterate than their male counterparts than non-ST community. The literacy disparity in this community was highest in Purulia (0.70%), followed by Birbhum, Bankura and Malda. The disparity was lowest in Darjeeling (0.23%), followed by Kolkata and Howrah. For the non-ST community, Purulia (0.52%) held the maximum literacy disparity value, followed by Bankura and South 24 Parganas. The minimum was in Kolkata (0.09%), followed by North 24 Parganas and Nadia. Ten districts out of 17 held a higher level of disparity than the state average for the non-ST community, and for the ST, the number was only eight. In two districts, that is, Hugli and North 24 Parganas, the disparity level in the non-ST community was lower than the state average, though for ST, it was the opposite. On the other hand, in Jalpaiguri, Cooch Behar, Murshidabad and Medinipur, the literacy disparity in the non-ST community was greater than the average state level; however, for the ST community, the condition was better than the state level. From another angle, in this census year, the gap of literacy disparity between these two communities was minimum in Darjeeling (0.03%) and Howrah (0.08%), and the maximum was in Birbhum (0.40%), Hugli (0.37%) and North 24 Parganas. (0.35%).
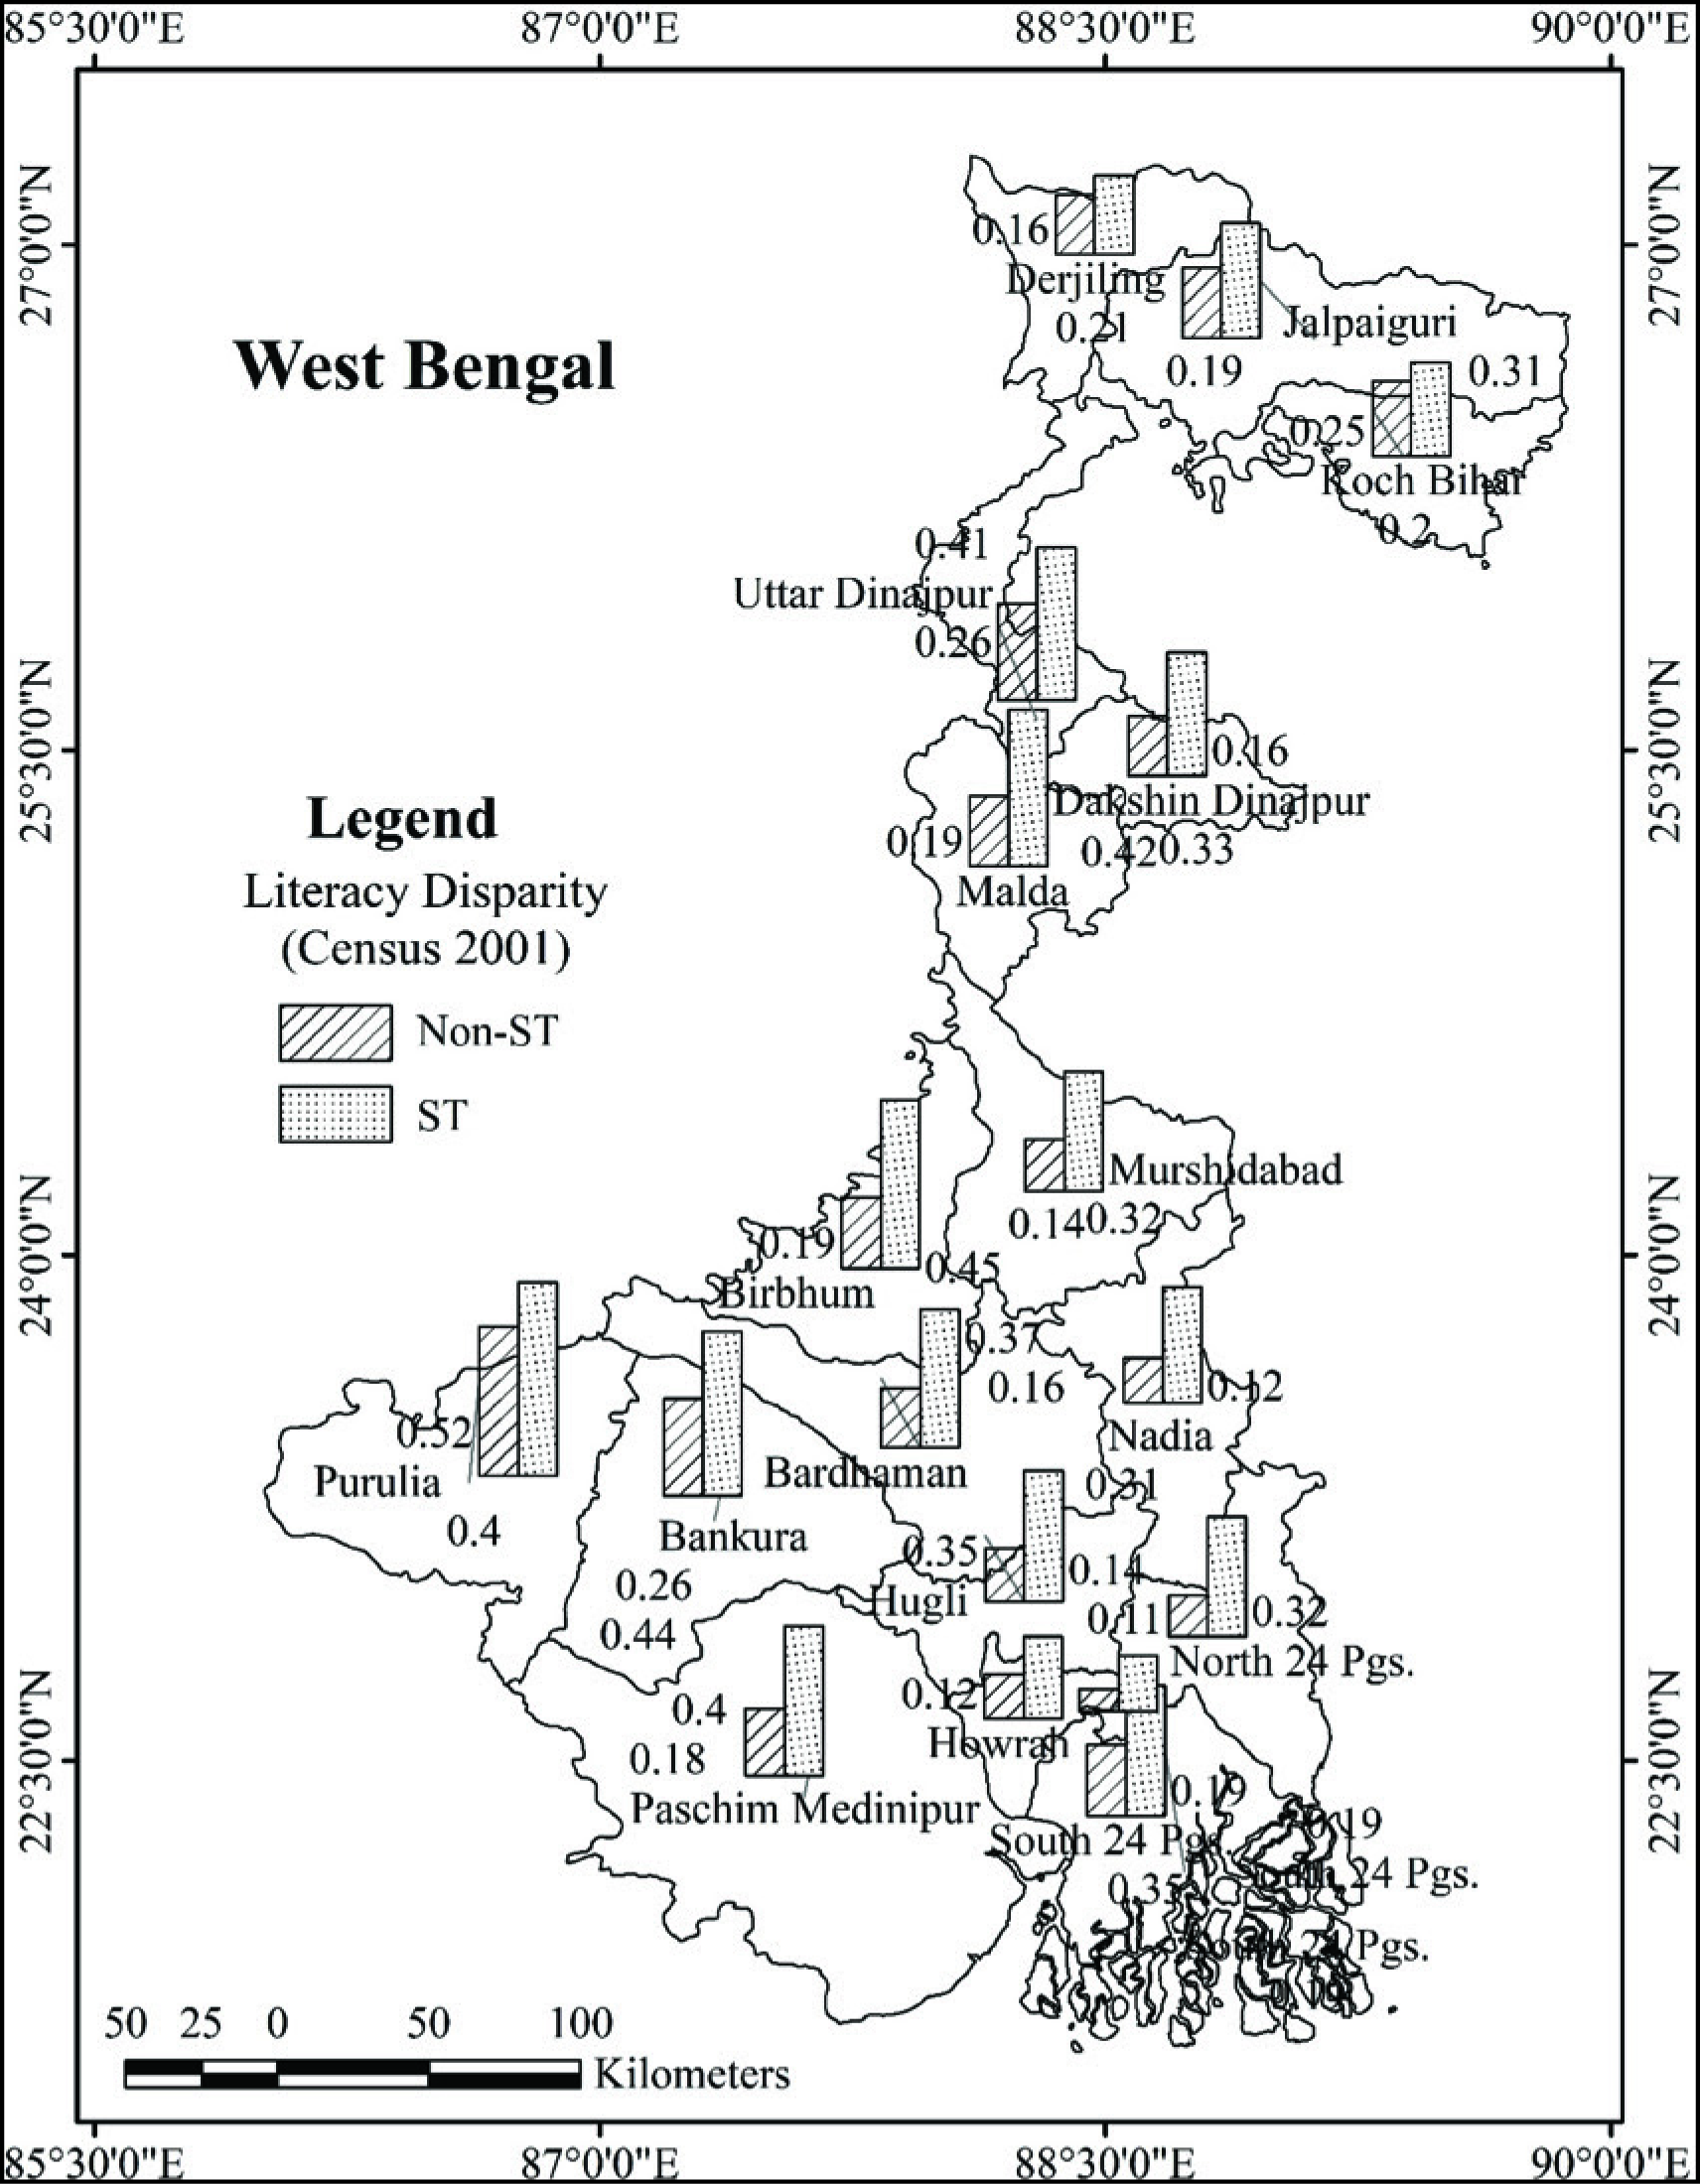
The literacy disparity had declined in Census 2001 for both the communities and its previous census (Appendix 3; Figure 14). However, the disparity had been recorded as very high in the ST community (0.37%). Like the earlier census in Purulia, the disparity was maximum for both communities. The results of the study also reveal that in all the districts, the literacy disparity was lower in the non-ST community. However, the declining trend of literacy disparity was higher in the ST community when compared to its non-ST counterparts. This census also reveals that in Uttar Dinajpur, the literacy disparity was more remarkable for both the communities than the average state level of the respective categories. However, in Dakshin Dinajpur, it was equal to the state level in the non-ST community; for ST, this was lower than the state average. In Birbhum, a higher literacy disparity gap still existed in this census year. On the other hand, the minimum gap had been recorded in Darjeeling (0.05%) and Cooch Behar (0.05%). Birbhum was the single district holding an equal disparity value to the average state level in the 2001 census. It also has come to light that all the districts had a lower disparity value for the non-ST community than the state average disparity of the ST community in this census year.
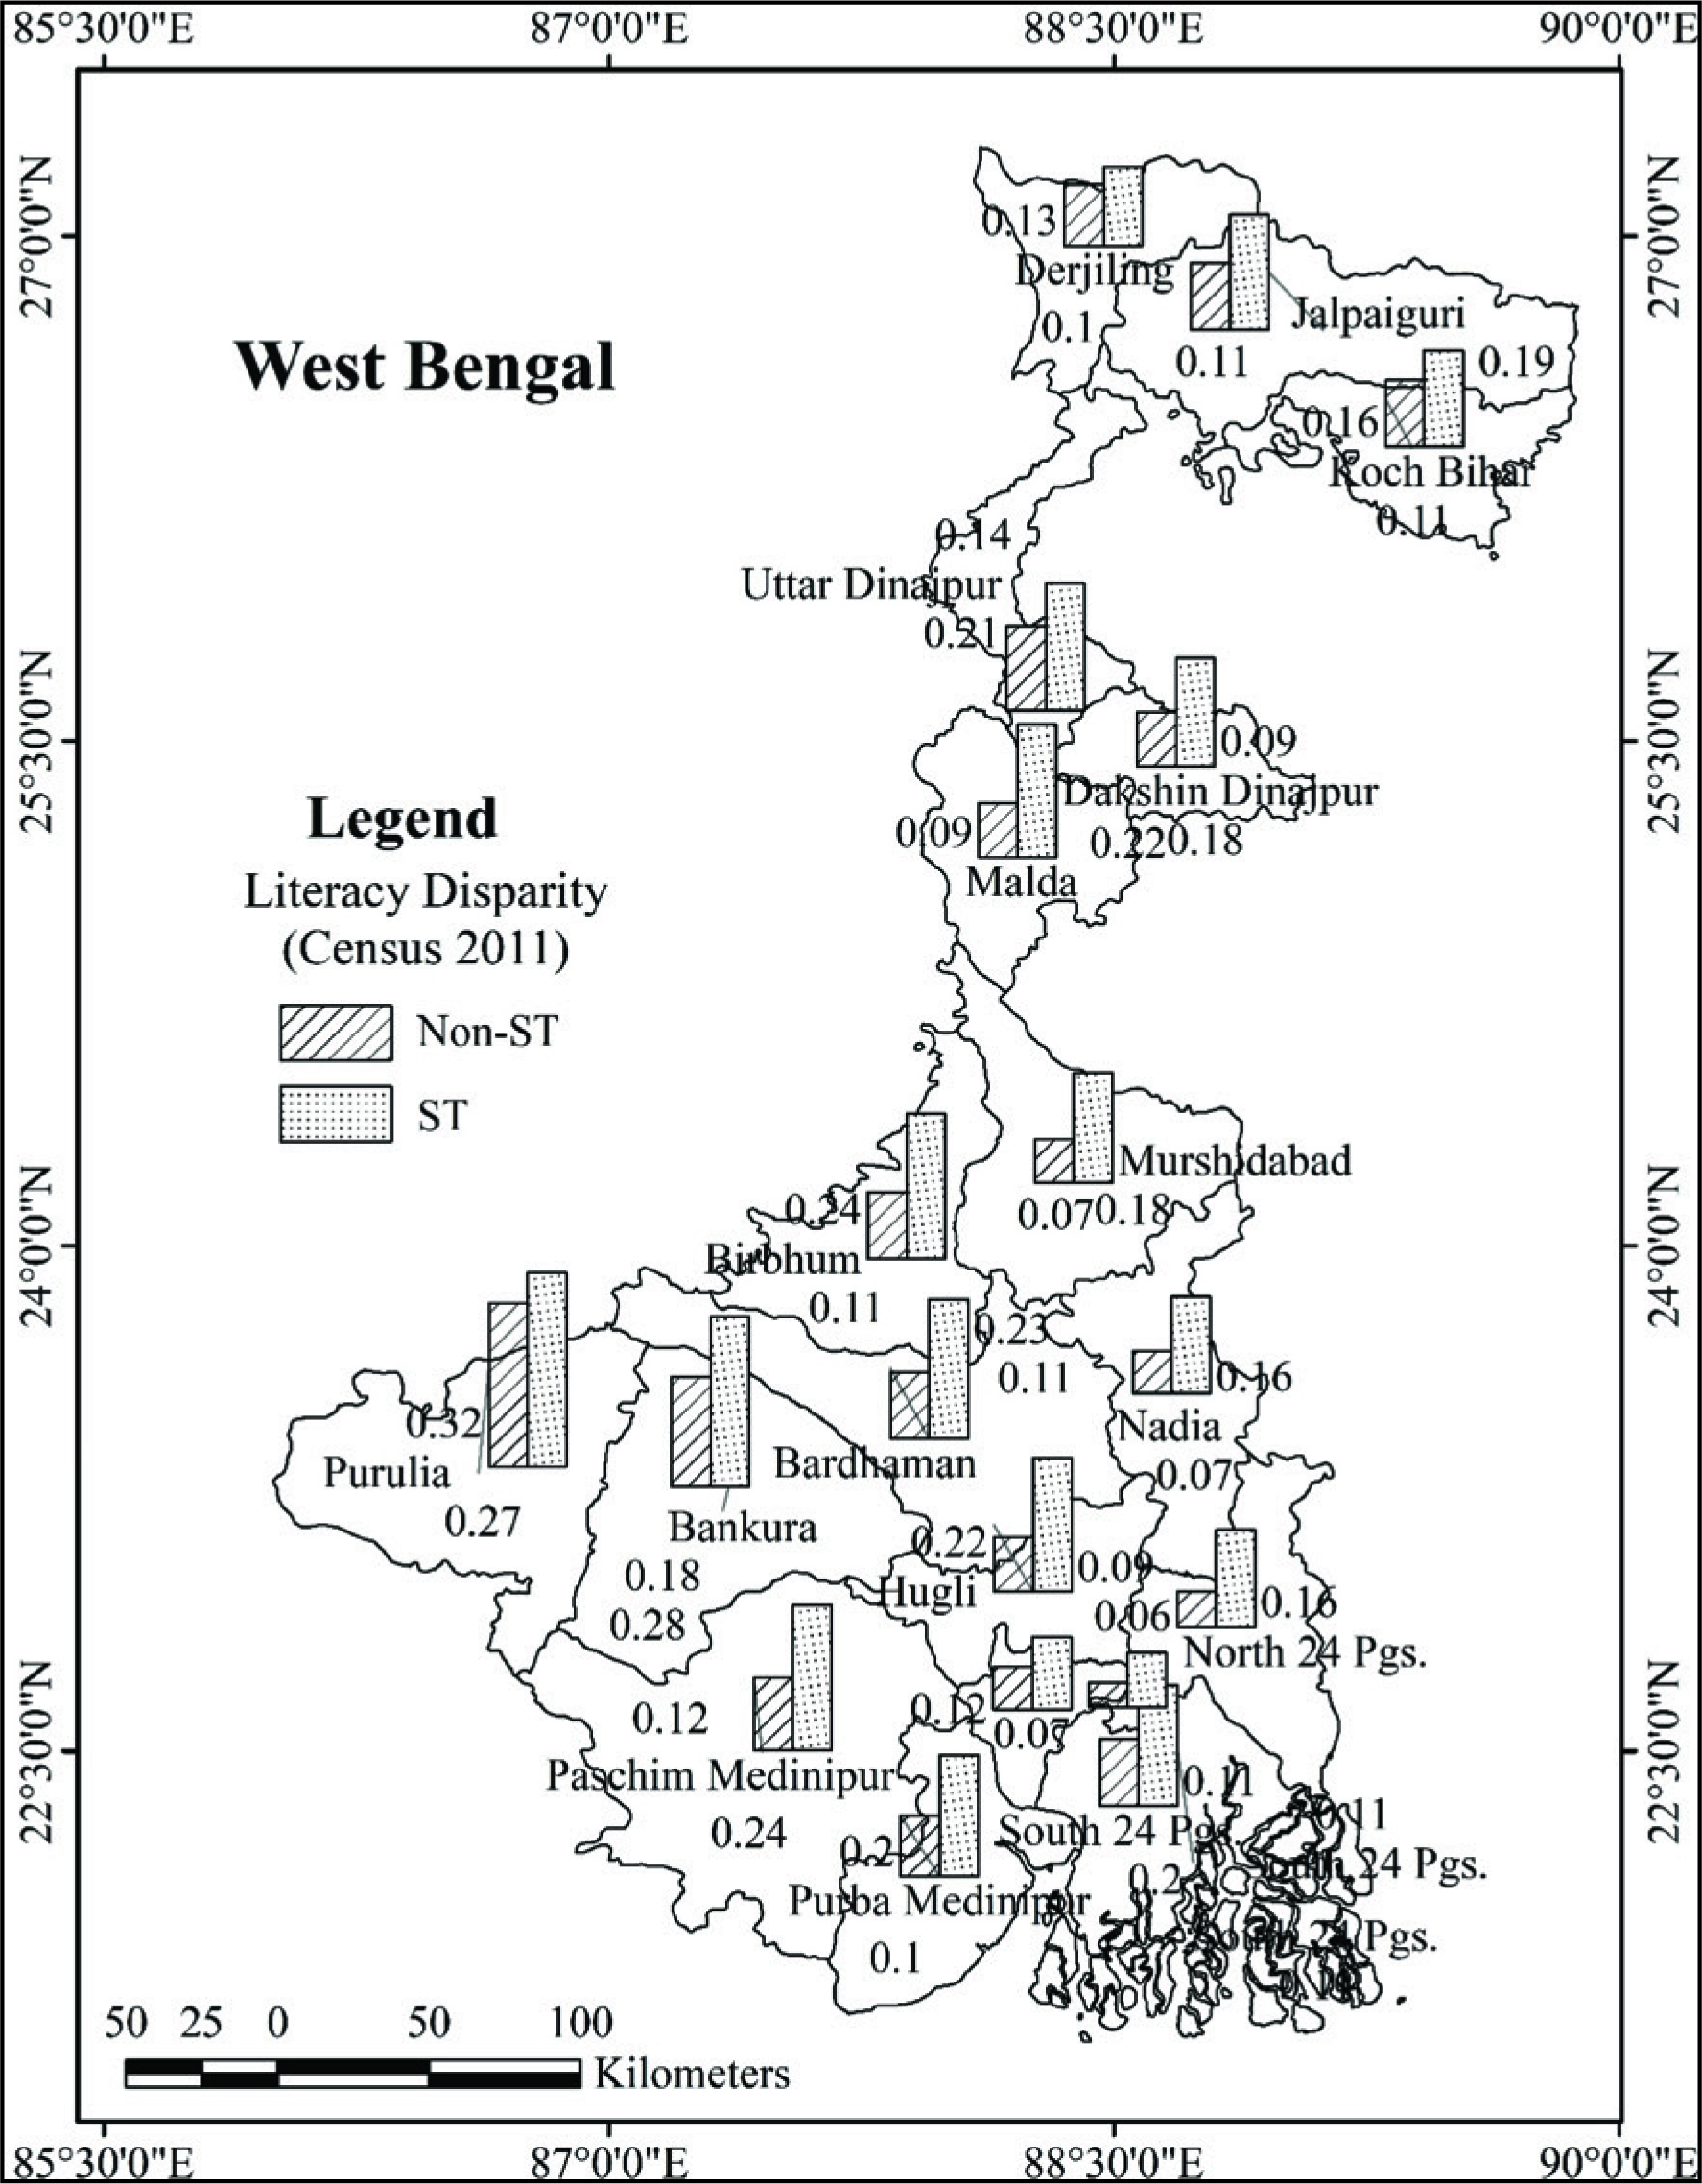
As of 2011, the gender literacy disparity was relatively low for both communities (Appendix 3; Figure 15). However, the ST community’s disparity level was more than double its non-ST counterpart. The database also reveals that the gender literacy disparity was highest in Purulia district for both the community as like another previous census year. After the division of Medinipur district, in Purba Medinipur, the literacy disparity of the non-ST community was equal to the average state level, although it was lower for the ST community. However, in Paschim Medinipur, literacy disparity was higher than the state average for both communities. Like the 2001 census, in 2011, the gap of literacy disparity between these two communities was lowest in Darjeeling. On the other side, the gap was highest in Malda (0.13%) and Hugli (0.13%) followed by Bardhaman.
Conclusion
This is a macro-level comparative study and reveals the reality of community-based literacy rate and primary schooling in West Bengal from a spatio-temporal perspective. The study found that, like other development indicators, the ST community lagged far behind in education than its non-ST counterparts, and paired sample t-test has statistically proved this. For all the census years, the PGER in the non-ST community was much higher than the ST community in all the districts, except Kolkata for the 2011 census. As a result, the PGER gap still exists between these two communities, creating social inequality. In this backdrop, it is important to ensure that primary education, especially for the ST community, is available to maintain social balance in the state as a whole and particularly in the districts. Higher participation in PGER can be achieved by promoting integrated child development service (ICDS) programme primarily for the ST community because it is the pre-stage of primary education. If the child’s participation increases in ICDS, it will automatically lead to a greater chance of enrolling those children in primary education. Besides, at the gram panchayat (GP) level, a social awareness programme should be introduced to motivate the parents to send their children for schooling, especially girls. It will have to set up a familiar environment for girls in schools to demolish the gender disparity in literacy by promoting female literacy.
The study also reveals that both ST and non-ST communities have not achieved the desired goal of literacy in West Bengal even after seven decades of the Indian independence. The situation is worse in the ST community as the illiterate population is much higher in this social group. From this point of view, it is necessary to increase their involvement under the umbrella of literacy by introducing effective strategies. There is a popular phrase that there is no age to learn; if it is true, then it also can be said that age does not matter to be literate. In this perspective, the local authorities should initiate aged literacy programmes in their locality, especially among the ST community, particularly in vulnerable rural pockets where many people are illiterate. Local unemployed educated youth from their respective community should teach their people. It would be an innovative way to generate employment as well as the improvement of overall literacy.
Apart from this, the findings of this study will play a significant role in implementing the New Education Policy (NEP) 2020 at the ground level in West Bengal. The policy can achieve its goal when all the sections of society will get equal opportunity for education and come under one umbrella. Before implementing this policy, it will have to find vulnerable areas and rural pockets at the micro level that deserve more attention. From this point of view, the study recommends conducting primary survey-based research in those districts to identify the more vulnerable pockets, more precisely where the literacy in ST is lower than the satisfactory level. It will help determine the sociocultural, economic and other independent variables, which determine their vulnerable situation. Faculties of the local universities would be an option for the administration to conduct the short-term project work in this field, especially to find the causes of unequal literacy among the social groups and find the obstacles that hinder sending their child for primary education, particularly the ST community. It will be an effective strategy for the better implementation of NEP 2020, particularly in West Bengal and India as a whole.
Supplemental Material
Supplemental material for this article is available online.
Footnotes
Declaration of Conflicting Interests
The authors declared no potential conflicts of interest with respect to the research, authorship and/or publication of this article.
Funding
The authors received no financial support for the research, authorship and/or publication of this article.