




Abstract
This article presents an indicator system called Low-Carbon and Green Index for Cities (LOGIC) that evaluates the performance of Chinese cities in terms of low-carbon development and identifies areas for improvement. This system issues a score ranging from 0 to 100, with a higher score indicating a better performance in lower carbon growth within a specified time period. LOGIC was applied to a sample of 115 Chinese cities representing a diverse range of population sizes, income levels, geographies and stages of economic and urban growth between 2010 and 2015. The results of this study indicate that these cities have made progress in green and low-carbon development. In addition, more than 90 of the 115 sampled cities experienced GDP growth alongside LOGIC score growth over the selected period, showing that green and low-carbon goals are not antithetical to good economic performance. The average overall index score for all 115 Chinese cities in 2015 was 44.9 out of 100, reflecting China’s heavy reliance on coal and its energy-intensive economy. Low-carbon pilot cities had an average overall index score of 47.0 in 2015 compared to an average of 42.9 for non-pilot cities. These LOGIC results suggest that transforming city economies away from energy-intensive towards high-tech and service industries could facilitate their low-carbon and green growth. This article uses the city of Wuhan as a case study to illustrate the application of LOGIC and its utility in assessing city-level low-carbon efforts.
Introduction
Cities have emerged as major centres of climate action and low-carbon policy. An increasing number of cities are showing leadership in combating climate change by seeking to become ‘low’ or ‘zero-carbon’ through ambitious carbon reducing actions, both on their own and through partnerships with their respective national governments. The motivation for low-carbon city action is twofold: first, the economic and environmental footprints of cities are significant. The world’s largest cities have combined GDPs larger than many individual countries (Hoornweg, 2012). Their importance will also only continue to grow, with projections of population growth and urbanisation suggesting that another 2.5 billion people could live in urban areas by 2050 (UNDESA, 2018).
Second, cities are often well-positioned to pursue climate action and low-carbon development agendas. They control a wide range of local assets and policy tools, have a concentration of ground-level expertise and authority, and often have relatively pragmatic policy positions with officials more directly accountable to local constituents. These features combine to make cities more nimble than national governments while still being able to take actions that make an impact at scale (Bulkeley, 2010; Hsu, Weinfurter, & Xu, 2017). The 2018 United Nations Environment Programme Emissions Gap Report identifies actions by non-state actors, including municipalities, as playing an important role in fulfilling national carbon reduction goals (UNEP, 2018).
China’s cities have become a major locus of economic activity and source of greenhouse gas (GHG) emissions, accounting for 75 per cent of the country’s total GDP and 80 per cent of its national energy consumption (Liu & Cai, 2018). Against this background, the Chinese government has established a series of policies to promote green growth in cities by transforming local economies, improving local environments and piloting low-carbon innovation. China has set targets to reduce the intensity of carbon emissions in its five-year plans at the national level and specified these targets by provinces.
The country has also launched pilot schemes to encourage policy innovation in provinces and cities. In 2010, the National Development Reform Commission (NDRC) launched a low-carbon pilot programme to implement national carbon reduction policies and encourage subnational low-carbon initiatives. As of 2018, China had announced three batches of low-carbon pilot projects, involving 81 cities and 6 provinces. Under this programme, all pilots are required to set low-carbon plans, promote a low-carbon industrial structure, conduct a GHG inventory and develop complementary policies (NDRC, 2010). Pilot city selection is based on local government leaders’ familiarity with low-carbon development policies and eagerness to participate in the pilot scheme, the need to have balanced regional representation and the city’s potential to serve as a good example (Wang, Song, He, & Qi, 2015). Given the diversity of China’s cities, there is a need for a holistic assessment to measure and track the extent to which these efforts have shaped Chinese cities’ low-carbon and green performance. The Low-Carbon and Green Index for Cities (LOGIC) measures cities’ progress, evaluates their performance and identifies areas for improvement in green and low-carbon development.
This article is organised as follows. First, it reviews different indicator systems used to track Chinese cities’ green and low-carbon development. Second, it describes the design of LOGIC and how it evaluates cities’ low-carbon and green progress. Third, the article analyses Chinese cities’ overall low-carbon and green performance based on the LOGIC indicator system. Fourth, the article uses the city of Wuhan to illustrate how LOGIC functions and to understand whether it has made progress in its transition towards green growth.
Literature Review
The last decade witnessed the production of numerous indicator systems that measure cities’ green and low-carbon performance (Arcadis, 2016; Economist Intelligence Unit, 2012; Tan et al., 2016). These indicator systems are designed to measure the performance of a city against different sets of metrics related to infrastructure, environment, climate, business and/or liveability. There is variation in the selection of metrics under each indicator system. They may focus on a specific geographic region, a specific level of economic development or on a single sector such as energy. Indicator systems may also vary in terms of the kind of data they assess.
To take two examples, the Sustainable Cities Index, developed by the design consultancy Arcadis, examines the social, environmental and economic sustainability of 100 cities across the world (Arcadis, 2016), while the Green City Index, developed by the Economist Intelligence Unit (EIU) and Siemens, measures urban environmental sustainability in 120 cities worldwide (Economist Intelligence Unit, 2012). Both indicator systems provide a multi-dimensional assessment of cities’ green efforts in different sectors including energy, air quality, transport, buildings and waste management. But these indicator systems have two limitations in evaluating the performance of Chinese cities. First, neither is designed specifically to assess the carbon-reducing performance of urban economies in transition. Second, neither includes robust assessments of industry—a sector that plays a central role in the economies of many Chinese cities.
Chinese government agencies have also developed indicator systems to assess city-level efforts to improve environmental quality and reduce carbon emissions. The former Ministry of Environmental Protection (MEP) 1 developed the National Ecological Civilisation Construction Indicators System to assess progress in overall environmental quality, reduction in air pollution levels, protection of water resources and waste management (MEE, 2018). Like the sustainable cities and green city indexes described above, this system also fails to account for the industry sector, a key source of GHG emissions in China. Other indicator systems include the Ministry of Transport’s public transport metropolitan pilots indicator system for low-carbon transport development in urban areas, and the national energy administration’s new energy city pilots indicator system for urban energy efficiency (Ministry of Transport, 2013; NEA, 2012). While these indicator systems provide useful information about specific sectors, they do not provide a holistic assessment of cities’ overall performance in low-carbon development.
Green or low-carbon city indicator frameworks have also been developed by Chinese research institutions (Shi & Liu, 2013). The Chinese Academy of Social Sciences has a city-level low-carbon development evaluation system with four key categories: low-carbon production, low-carbon consumption, low-carbon resources and low-carbon policies (Zhuang, Zhu, Yuan, & Tan, 2014). This evaluation system aims to capture cities’ low-carbon efforts in terms of both production and consumption by assessing only carbon emissions per unit of GDP and per capita. However, it does not look deeply at sectoral performance within cities. While its category of low-carbon policies that includes five qualitative yes-no indicators encompasses sectoral policies, it does not accurately quantify cities’ efforts in sectoral policy implementation.
The Chinese Academy of Sciences developed a green city indicator system to assess 83 cities’ green development (Shi & Liu, 2013). This indicator framework examines urban green development based on four categories: environmental health, resources conservation, low-carbon development and city liveability, which are further divided into 14 indicators. The framework details cities’ efforts in improving environment quality but pays less attention to low-carbon development, with only two indicators focusing on carbon emission reduction.
Building on previous research, LOGIC delivers a composite and integrated indicator framework that not only evaluates cities’ efforts in green and low-carbon development but also benchmarks their progress against both international and domestic good practices, and helps cities identify areas of improvement.
Methodology
LOGIC tracks progress in the area of green and low-carbon development of China’s cities. This section describes the structure and the development of LOGIC. As Chinese cities are undergoing processes of industrialisation and urbanisation, economic performance and urban growth are key considerations when pursuing low-carbon and green development.
Indicator Categories
LOGIC includes four primary indicator categories, one of which has four subcategories. These primary categories and subcategories are further defined by a total of 23 indicators that are commonly used in China’s policy context for tracking cities’ green and low-carbon progress (see Table 1 for detailed information).
Energy and carbon: This category focuses on the performance of cities in energy consumption and carbon emissions, which are two key factors that can reflect low-carbon efforts. This category is divided into four subcategories which cover the main sectors of energy use and carbon emissions in a city.
Energy and power: A city’s total energy consumption and its efforts to decarbonise it.
Industry: Energy intensity of the industrial sector and cities’ reliance on heavy industries.
Buildings: Energy consumption in the building sector and a city’s efforts in promoting construction of green buildings.
Transport: Availability and use of public transit in a city.
Environment and land use: This category captures cities’ efforts in improving urban environmental quality, particularly in terms of air and water quality, waste management and maintenance of urban green spaces. This category tracks city governments’ spending on the environment.
Economic dimension: This category reflects cities’ efforts in reducing the energy and carbon intensity of economic activities such as increasing the share of the service sector in a city’s GDP.
Policy and outreach: This category focuses on policy efforts made by cities in the low-carbon space during the 12th Five-Year Plan period (2011–2015). All indicators under this category are qualitative.
All categories, subcategories and their indicators are graded for relative importance based on an expert review and are then combined to calculate an overall index or LOGIC score for each city. The primary categories—economy, energy and carbon, environment and land use, and policy and outreach—hold weightages of 20, 50, 20 and 10 per cent, respectively, based on policy priorities and expert interviews. The subcategories under energy and carbon—energy and power, industry, transportation and building sectors—hold weightages of 36, 36, 12 and 16 per cent, respectively, based on the share of each sector’s final energy use in the national total in 2015 (Khanna, Fridley, & Hong, 2014).
LOGIC Framework
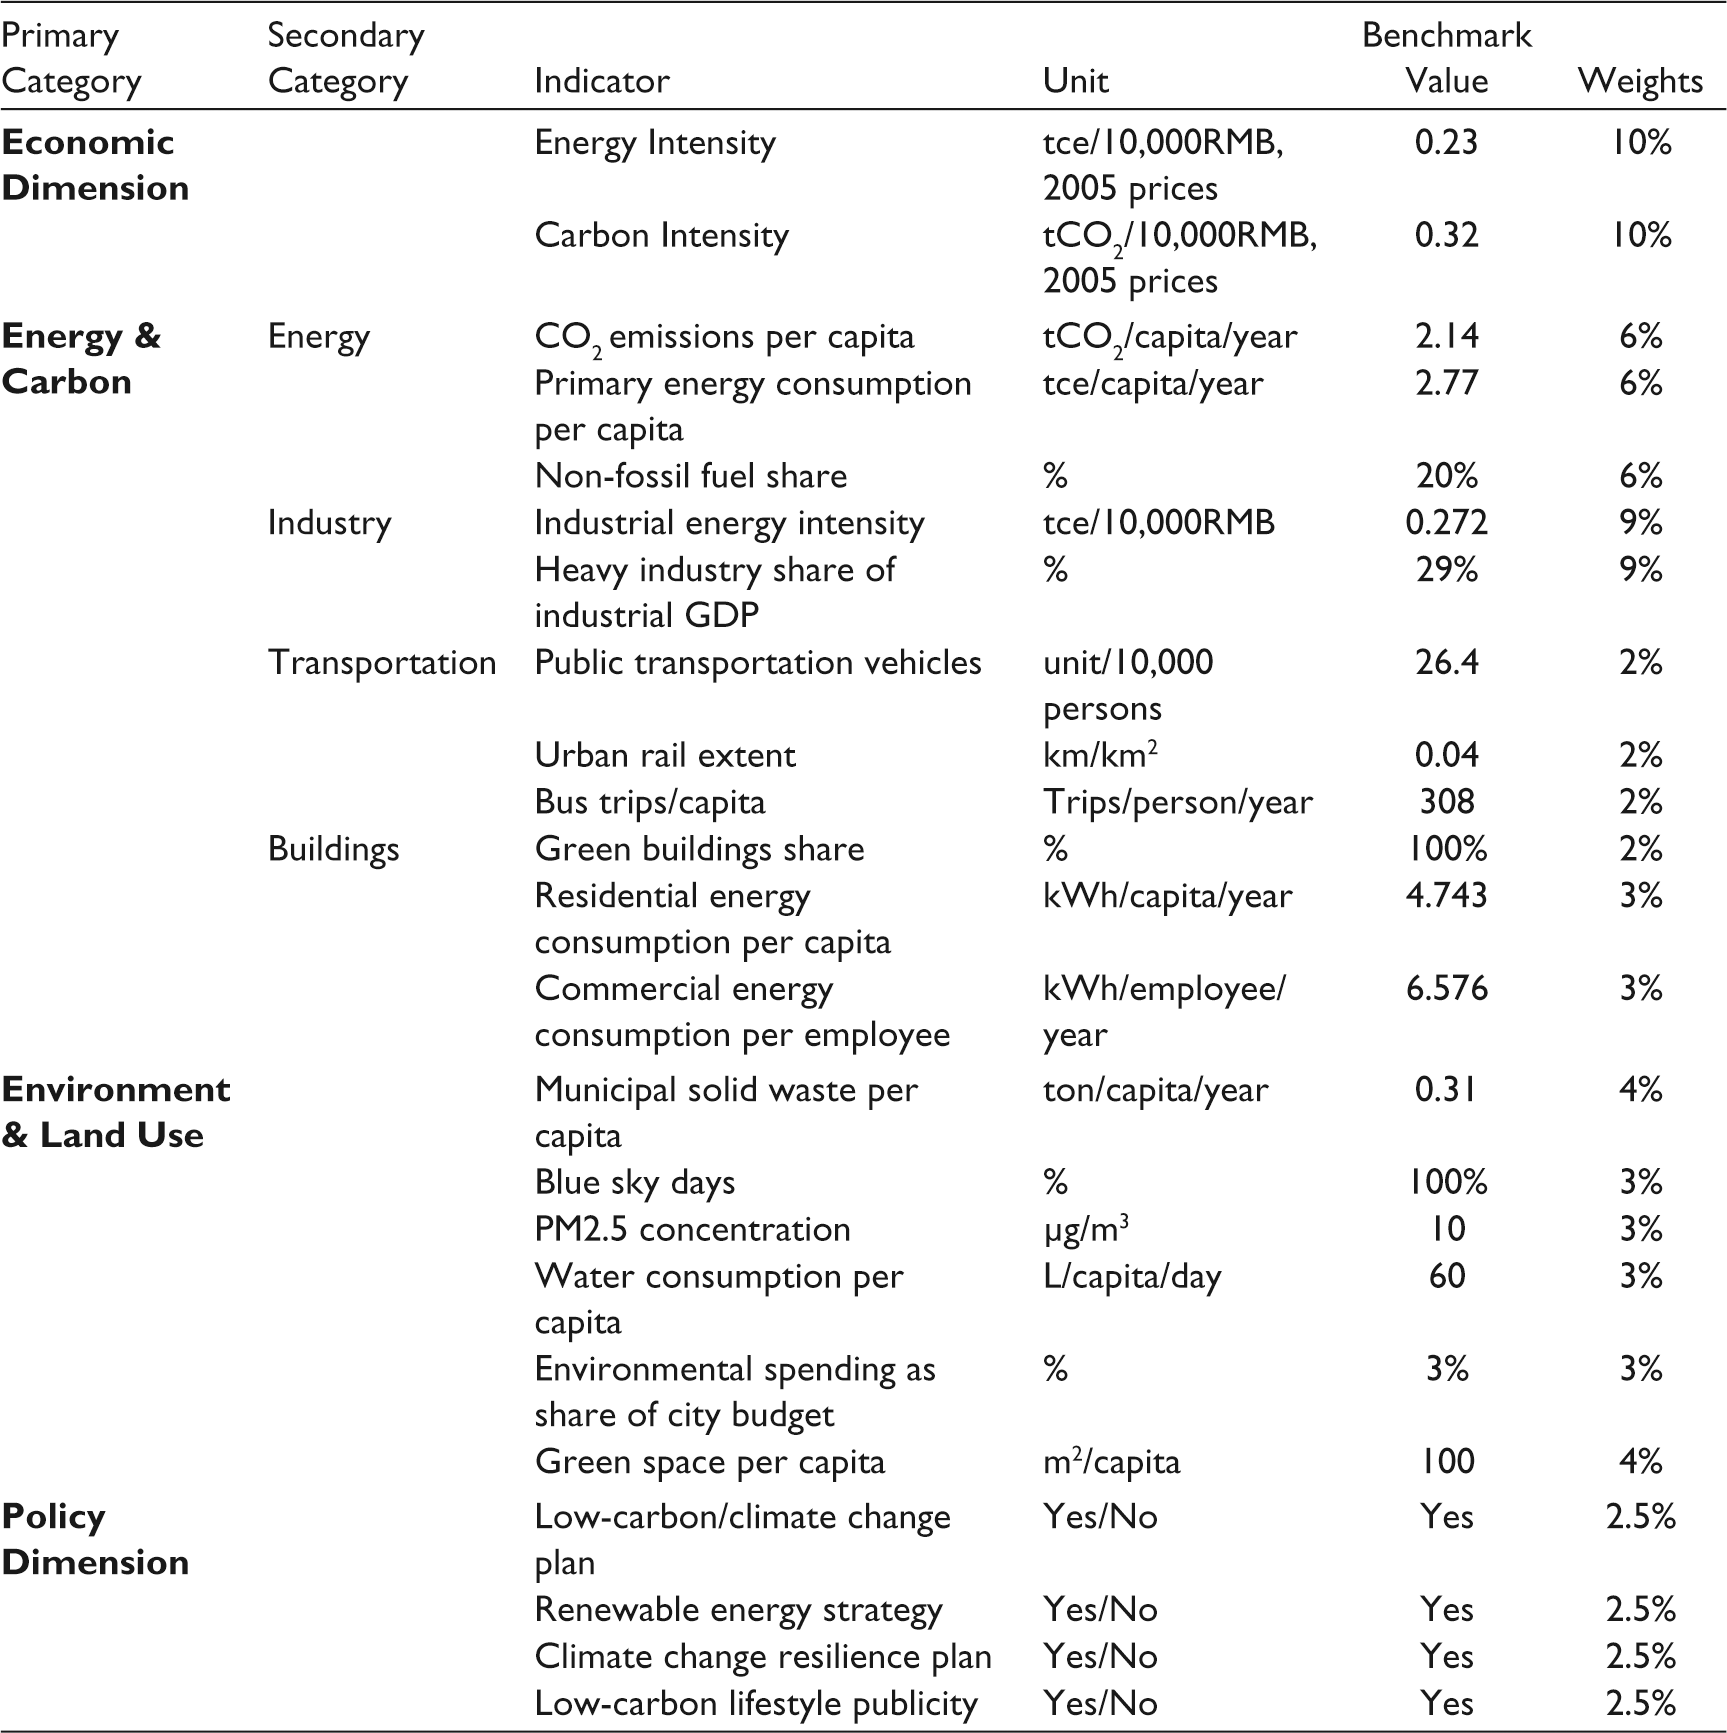
In addition, each of the 23 measurable indicators contains performance benchmarks, which are standards used to convert raw city-data into the scores that make up the index. Benchmarks vary by indicator and can be defined as one of three types: (1) international best practices, (2) China’s national targets, or (3) 20 per cent better than the top 10 best-performing cities in China in terms of low carbon growth in a specific area.
The final LOGIC score ranges from 0 to 100. The higher the score received by a city, the greener and lower carbon its growth is within a specified time period. The equation behind the index score calculation is below:

‘c’ is an index from 1…115 for all cities in the sample;
‘i’ is an index from 1…23 for all indicators;
‘
‘
‘
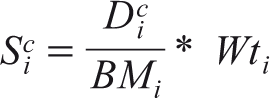
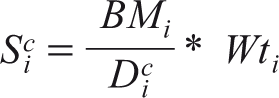
The normalised score for a given city for a given indicator is calculated as follows:
When the normalised indicator score is directly proportional to the city’s data value
When the normalised indicator score is inversely proportional to the city’s data value
LOGIC scores were calculated for a sample of 115 Chinese cities within the time period 2010–2015. Data was collected for 23 green and low-carbon indicators in the 115 cities within this duration, drawn primarily from publicly available government documents and published academic literature.
City Selection
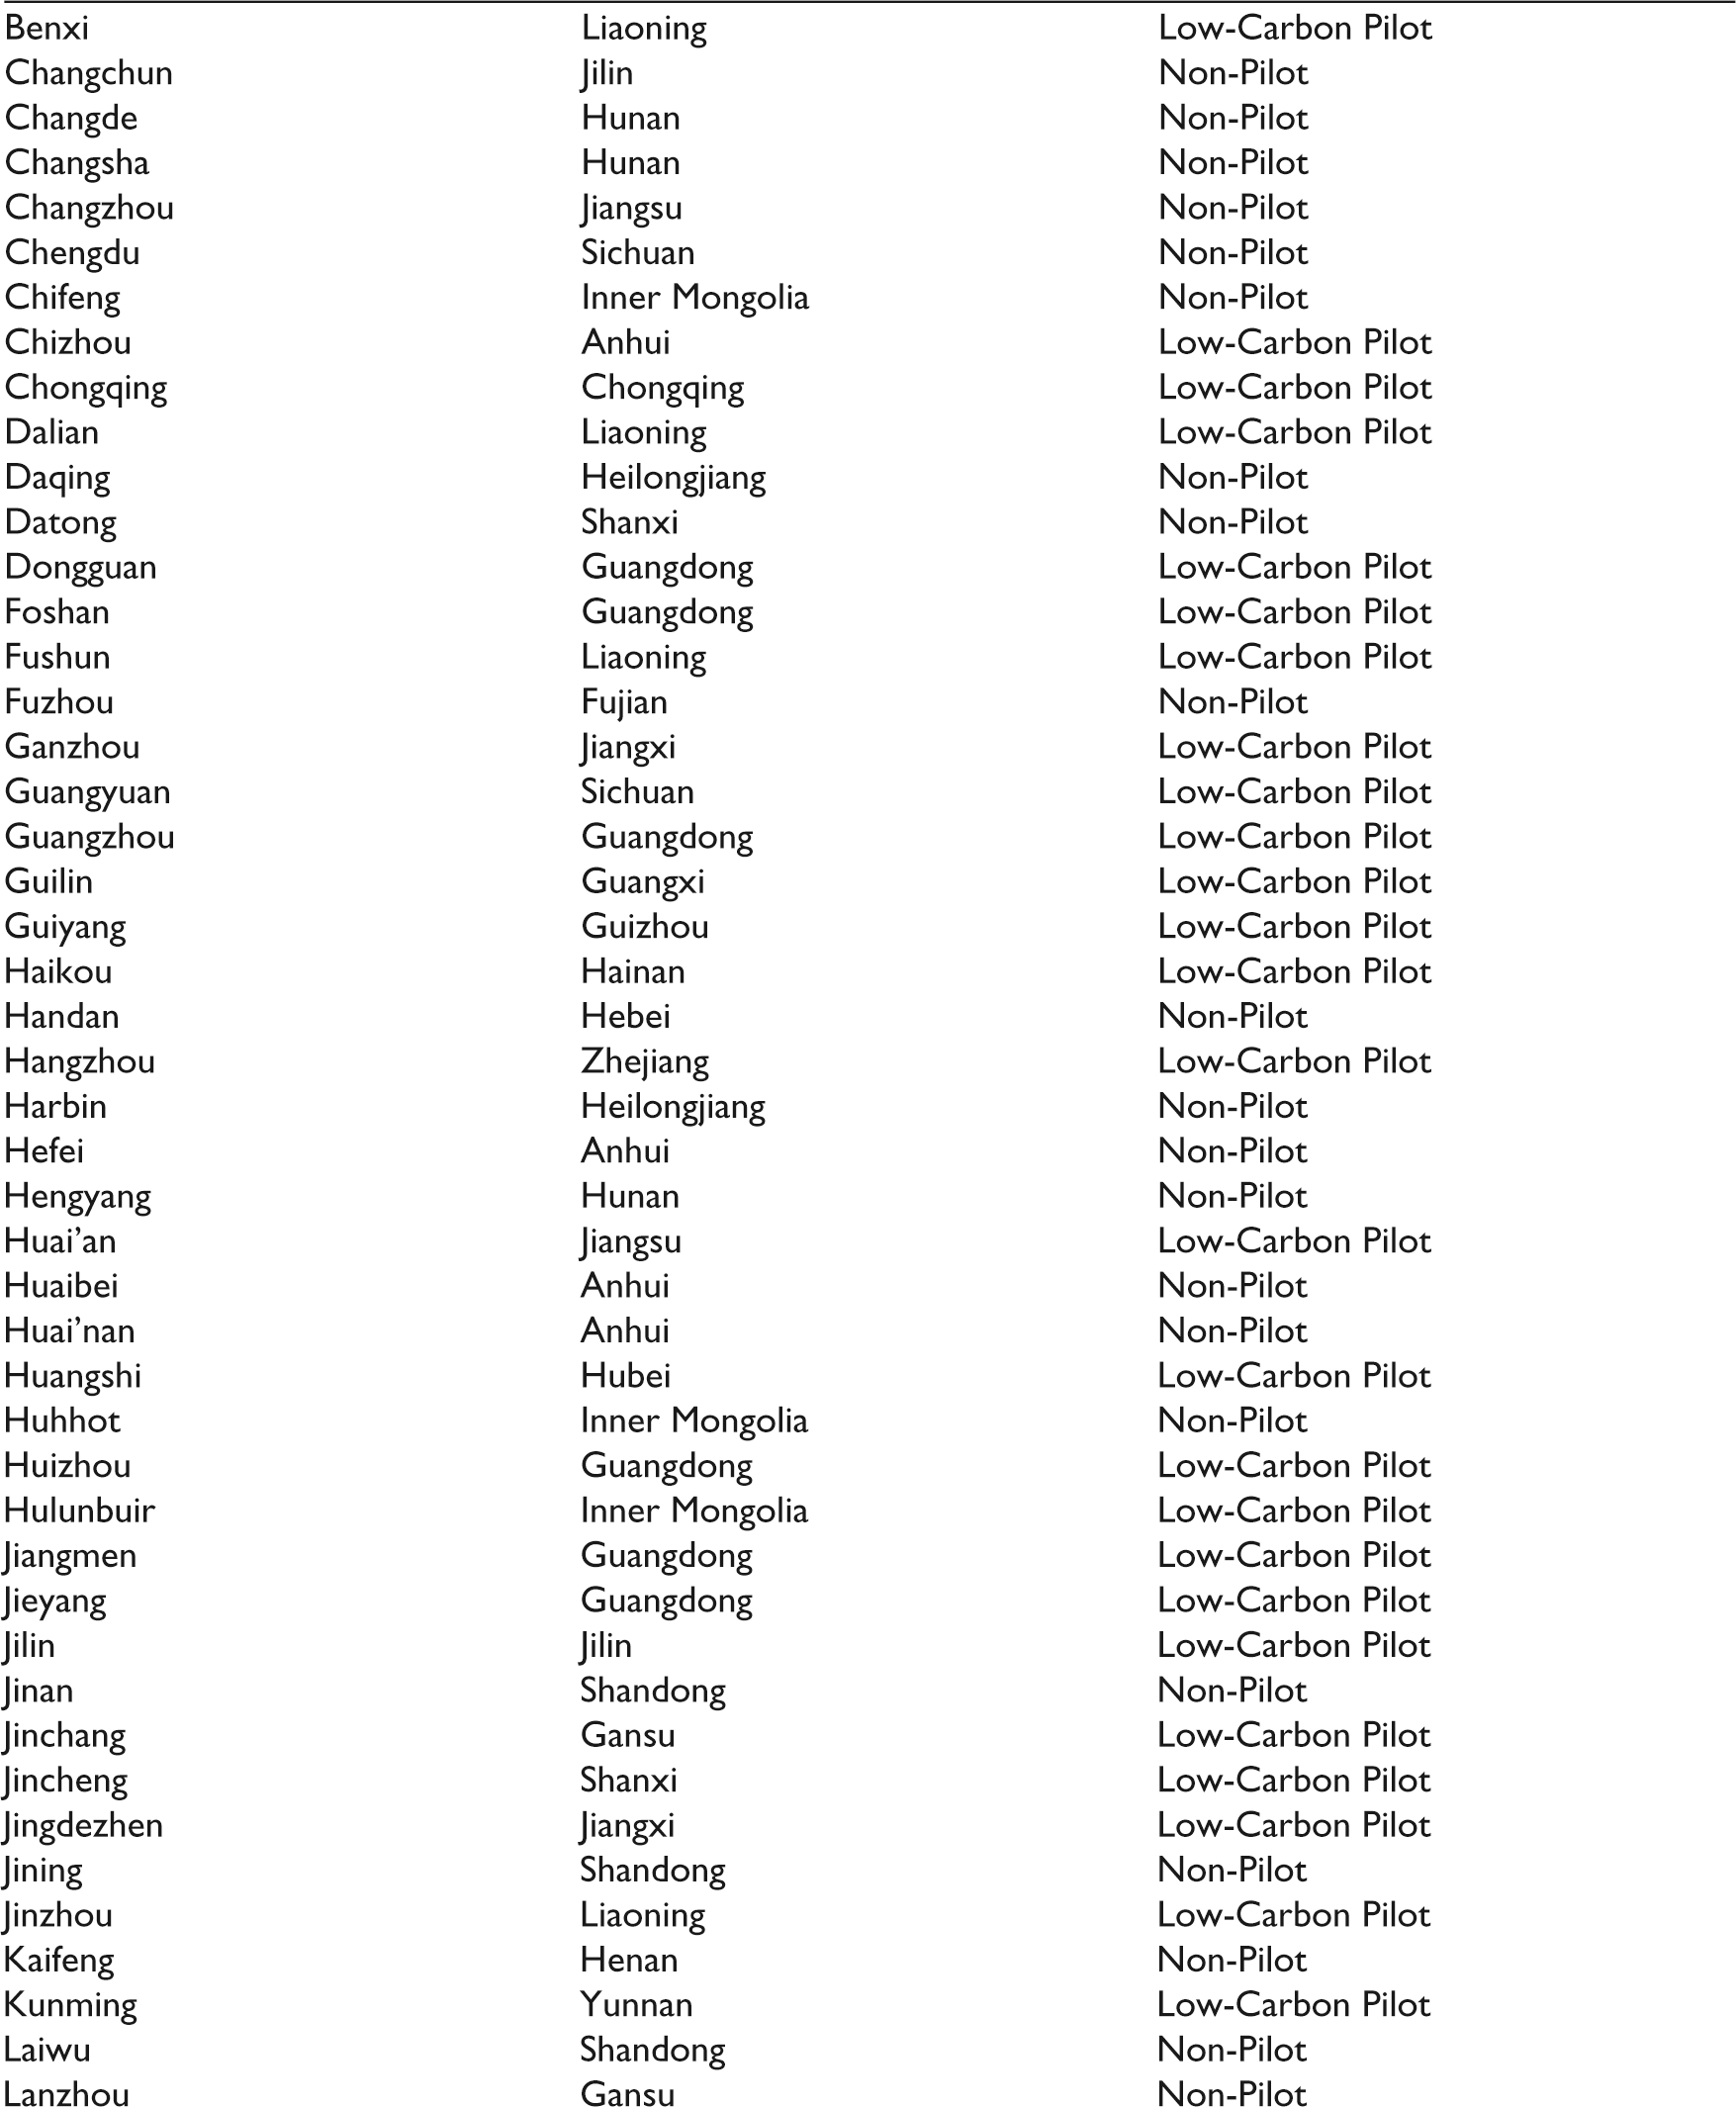
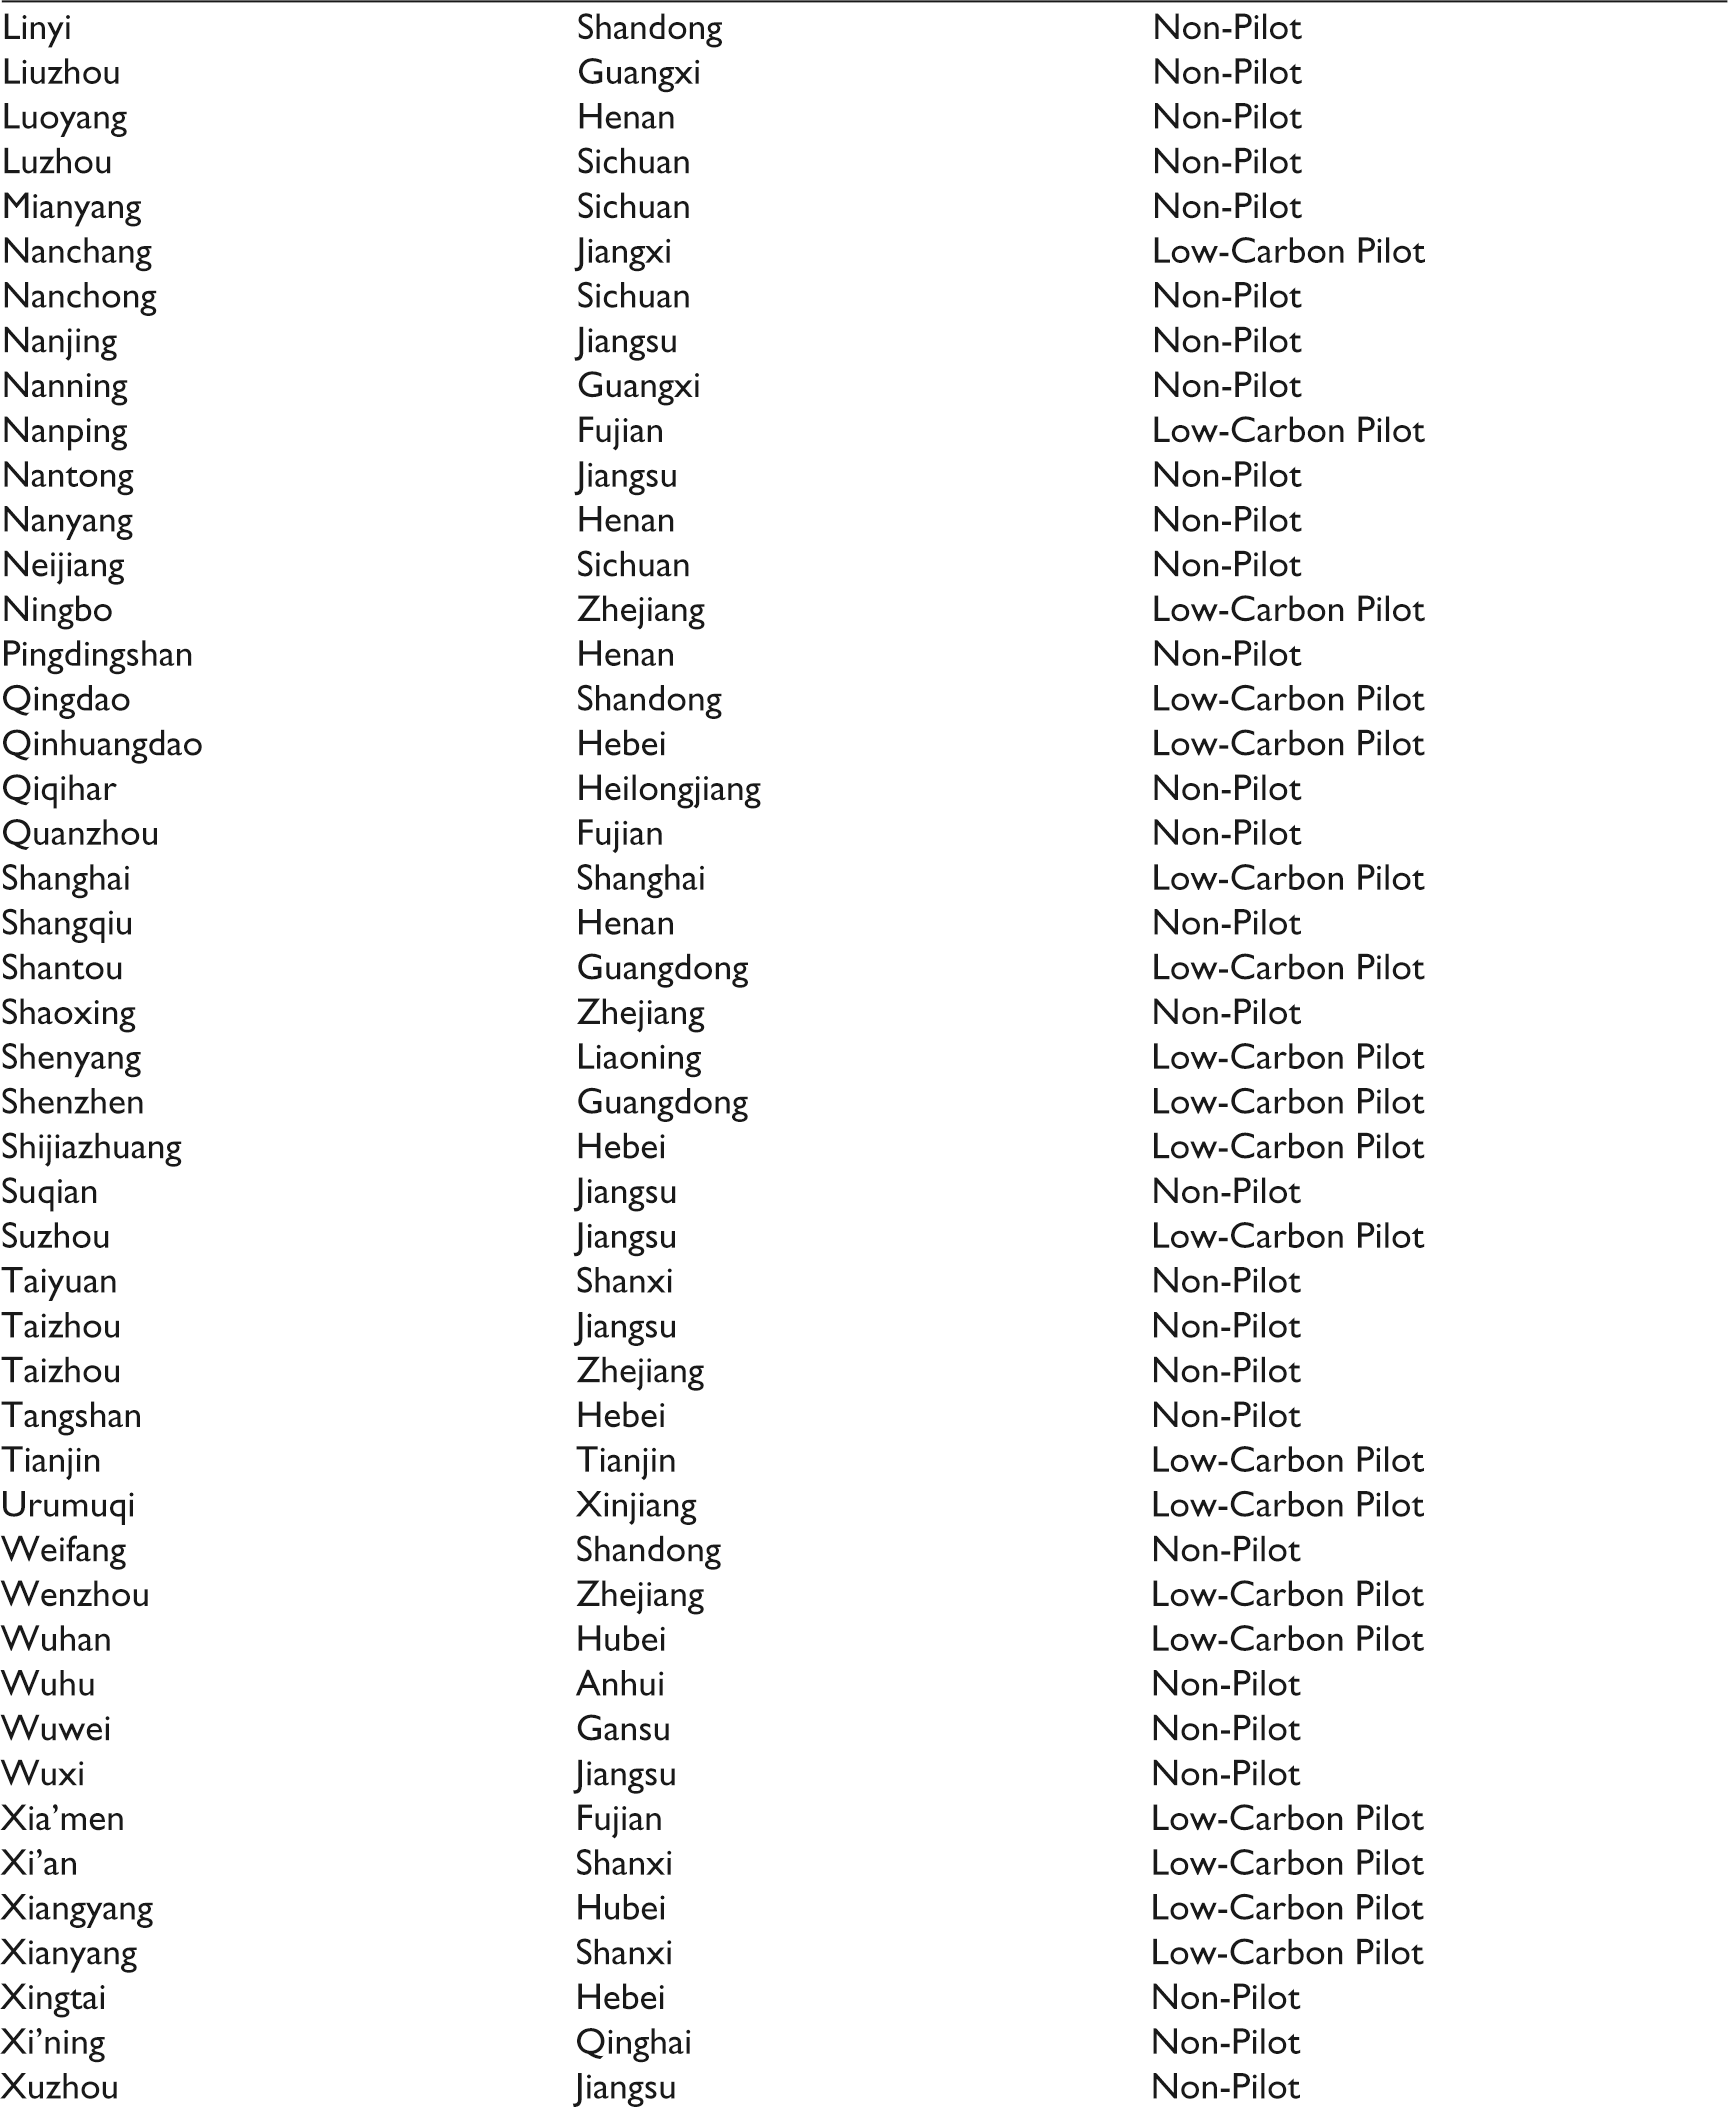
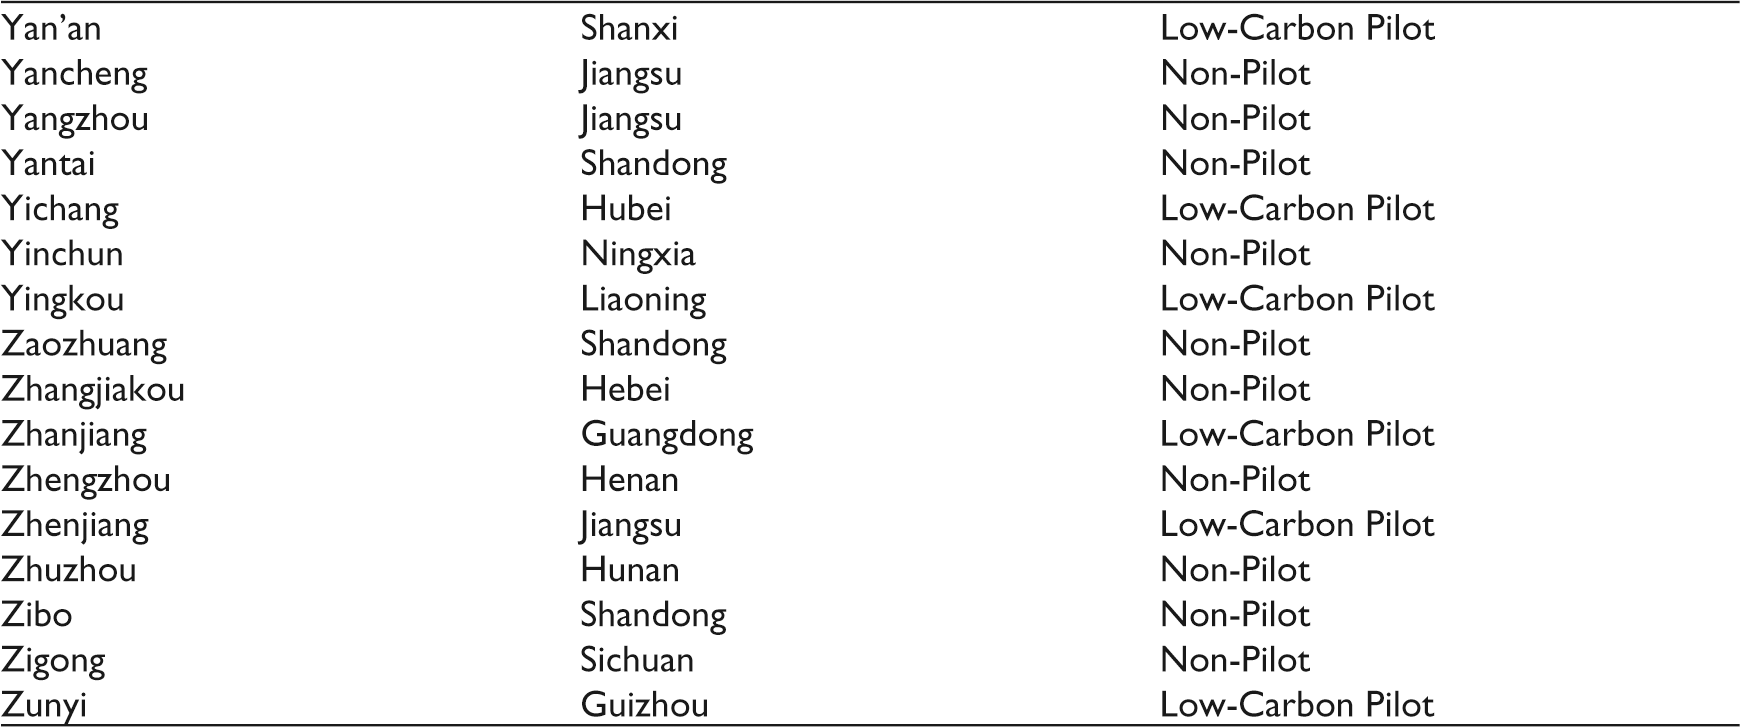
The 115 cities included in the sample represent a diverse range of population sizes, income levels, geographies and stages of economic and urban growth. A complete list of the 115 cities can be found in Annex A.
City selection was based on relevance, representativeness and diversity in green and low-carbon development. Relevance was determined by the importance of a city in terms of China’s economic, demographic and policy context. Representativeness and diversity were achieved by selecting a variety of cities across a range of regions, population sizes, economic development levels and industrial mixes. The 115 cities included 54 pilot and 61 non-pilot cities.
Analysis
This section discusses the key findings of the application of LOGIC to 115 Chinese cities. LOGIC reveals sample cities’ overall and category-specific progress in terms of green and low-carbon development between 2010 and 2015.
LOGIC shows that, overall, Chinese cities have made progress in their green and low-carbon development but have significant room to improve their performance. The average overall index score increased from 38 to 44.9 between 2010 and 2015, but this number still falls below the halfway mark on the LOGIC scale. More than 90 of the 115 cities experienced both GDP growth and LOGIC score growth over the selected time period. As shown in Figure 1, all cities saw significant GDP growth between 2010 and 2015. More than 90 of the cities also saw their LOGIC scores rise over the same period—some with slight increases, others with as much as a 25 per cent increase. Among these, there were two unique clusters of high-performing cities. One cluster (six cities) shows the highest total GDP growth, with LOGIC score growth between 5 and 15 per cent over the five years. Another cluster (five cities) shows the highest LOGIC score growth between 20 and 30 per cent, with GDP growth above the national average. The cities in these clusters show that green and low-carbon goals can be achieved in tandem with good economic performance.

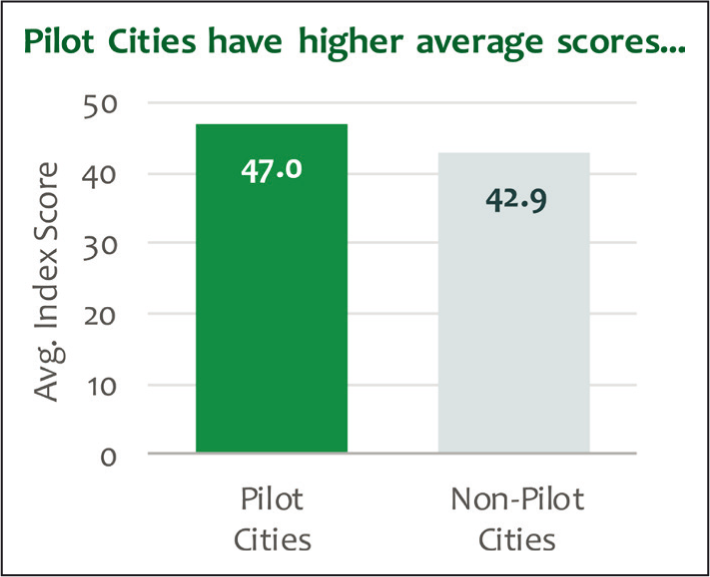
The performance of cities within different groups also varied. Cities that are more economically developed and have low-carbon pilot status received a higher score than less developed and non-pilot cities. As illustrated in Figure 2, the average overall index scores in 2015 for China’s low-carbon pilot cities is 47.0, compared to an average of 42.9 for non-pilot cities. Low-carbon pilot cities made up 80 per cent of the top 20 best-performing LOGIC cities in 2015, despite accounting for less than half of the sample, and saw a quicker increase in their scores over 2010–2015.
Within the LOGIC framework, the average overall score of Chinese cities was broken down into seven categories, as illustrated in Figure 3. In each category, there was a gap between cities’ current performance and the best-performing benchmark. Comparing cities’ overall performance and examining their performance across different categories can help cities identify areas of improvement as they pursue green and low-carbon development.
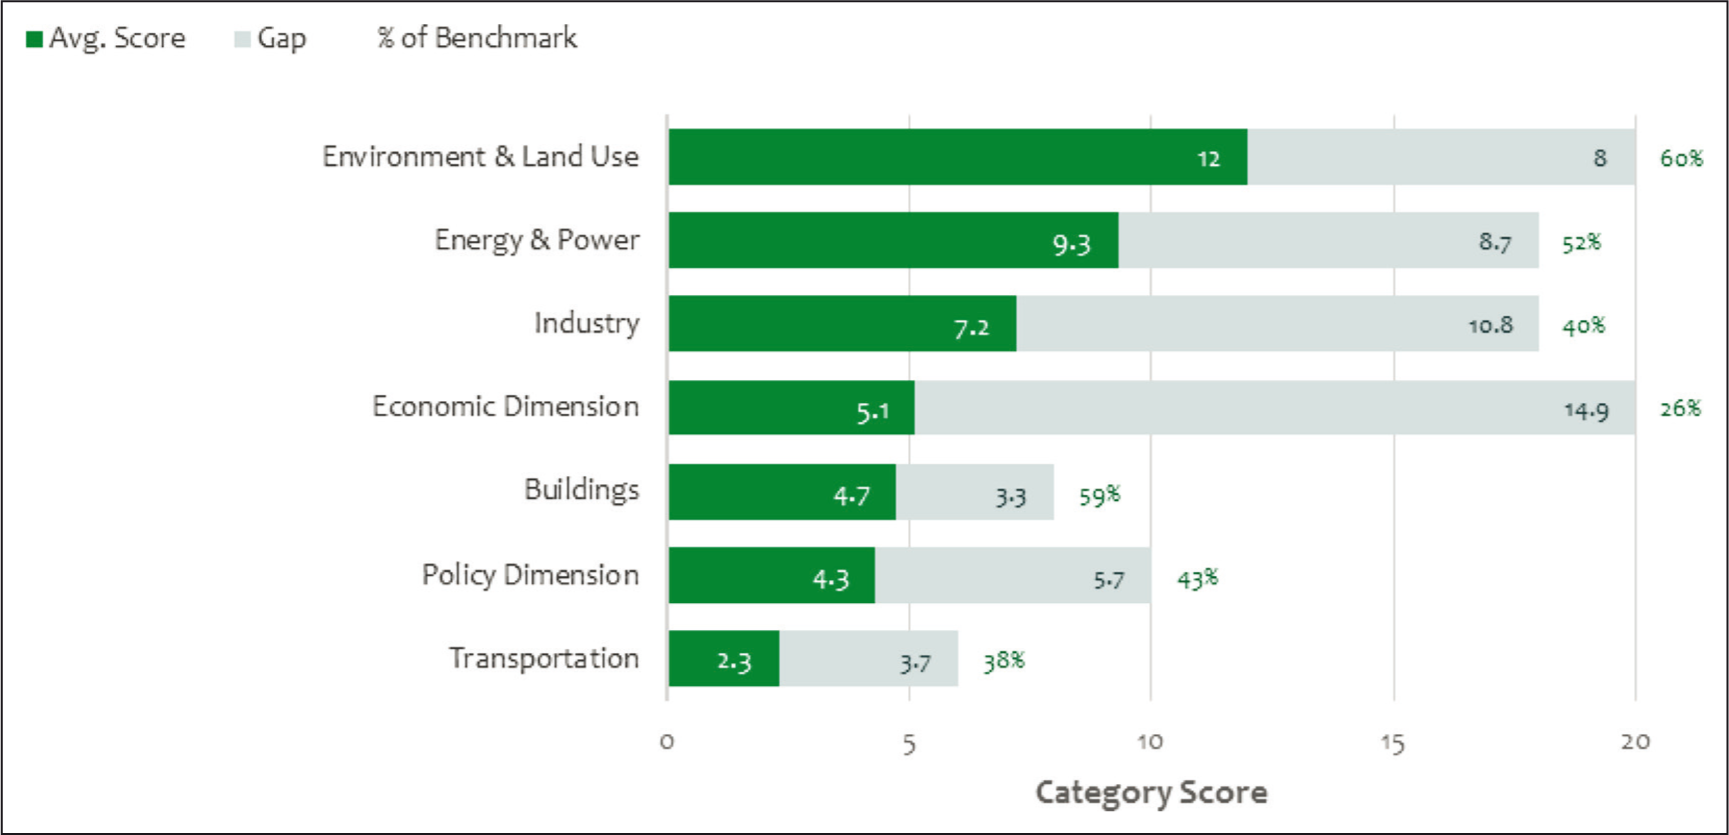
As discussed earlier, the average overall index score for all Chinese cities in 2015 was 44.9 out of 100. Figure 3 shows that the average score of Chinese cities, by category, is 12 out of 20 in environment and land use, 9.3 out of 18 in energy and power, 7.2 out of 18 in industry, 5.1 out of 20 in the economic dimension, 4.7 out of 8 in buildings, 4.3 out of 10 in the policy dimension sector and 2.3 out of 6 in transportation.
Of the seven categories, four showed scores below 50 per cent of the benchmark value: industry, economic dimension, policy dimension and transportation. The average score in the economic dimension was 14.9 points less than the total score of this category (20 in total)—the largest gap between current status and benchmark performance. This reflects the challenge that Chinese cities face in decreasing the energy and carbon intensity of their economic activities. Sample cities also showed weak performance in the industry category. This is due, in large part, to the domination of heavy industry in many cities’ economic structure. The gap between current status and benchmark performance in transportation remains significant as well. Within this category, the urban rail extent indicator is the major contributor to Chinese cities’ poor performance. This is likely due to the high cost of constructing urban rail systems. The policy dimension category also reported a low score, indicating that most cities need to improve their implementation of green and low-carbon development policies.
An Illustrative Case Study: Wuhan
While Chinese cities have started working on decarbonisation, the average overall LOGIC score for them is still under 50. This reflects the challenge cities face in green and low-carbon development but also the potential they have to improve. Drawing on LOGIC results, this section uses the city of Wuhan as a case study to illustrate the challenges and opportunities in urban green and low-carbon actions. It takes a closer look at Wuhan’s green and low-carbon development, examining its current performance and indicating ways through which it can continue to make progress.
Wuhan’s green and low-carbon experience reflects the challenges faced by many Chinese cities as they lower carbon emissions and improve environmental quality. Wuhan is a large, energy-intensive city that serves as an economic hub in China’s central region. A member of China’s ‘1-trillion RMB club’ (Chinese cities with a GDP of more than 1 trillion RMB), Wuhan’s economy has grown at a fast rate. During the 12th Five-Year Plan period (2011–2015), Wuhan’s GDP grew at an average annual rate of 10.4 per cent. However, more than 10 per cent of its annual GDP growth has been driven by energy-intensive and resource-intensive industries, such as electricity, steel, building materials and chemicals.
Energy consumption increased in tandem with economic growth, driving up the use of fossil fuels and attendant carbon emissions. Wuhan’s population has also steadily grown. The annual growth rate of Wuhan’s population is 1.4 per cent, second only to Beijing and Tianjin. Population growth has also increased the demand for energy. In addition, as living standards have improved and urban transportation systems developed, pollution from industry, traffic and public consumption have exacerbated the city’s environmental problems.
Wuhan’s Overall Green and Low-Carbon Development
With a large population, energy-intensive industries and severe environmental problems, Wuhan faces challenges in pursuing green and low-carbon development. Wuhan began moving towards low-carbon development in 2010. That year, Hubei Province—of which Wuhan is the capital—became China’s first low-carbon pilot province. Two years later, in 2012, Wuhan was included in the second batch of NDRC’s low-carbon pilots. Since then, the city has issued a succession of policies aimed at improving energy efficiency and reducing carbon emissions. As shown in Figure 4, during this period, Wuhan’s LOGIC score increased from 32 to 41, which indicates that Wuhan is making progress in green and low-carbon development, even though its performance remains below average.

Wuhan’s participation in this national pilot programme provided a strong political and administrative impetus for the city to develop a comprehensive low-carbon development strategy that incorporates the economy, industry, buildings, transportation, waste disposal and environmental sustainability sectors. During the 12th Five-Year Plan period, Wuhan established new institutional settings, and strategic measures and evaluation mechanisms to promote low-carbon development.
Institutional Settings
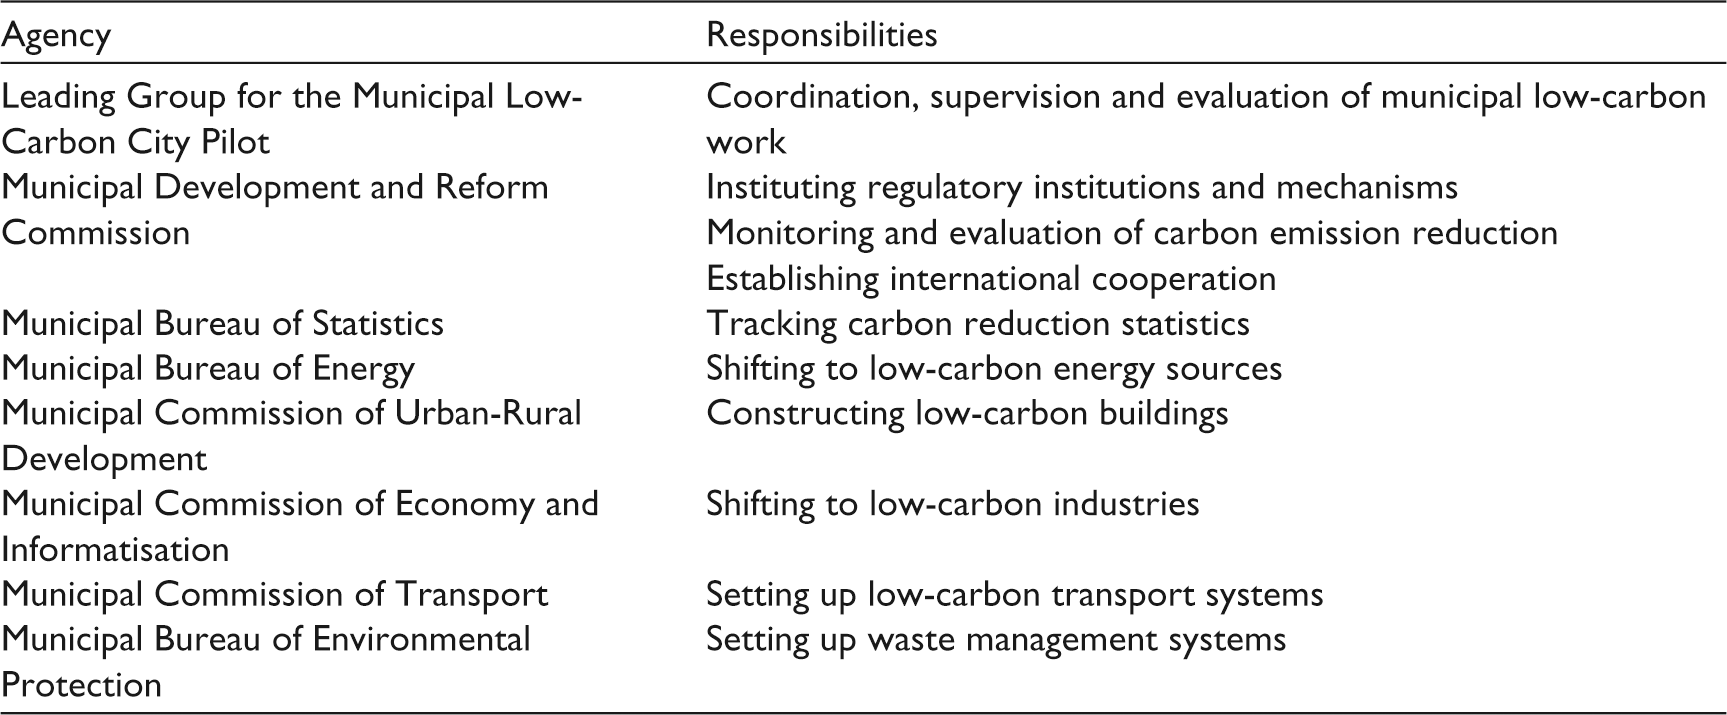
Wuhan established a dedicated coordinating body to lead its participation in China’s national low-carbon city pilot effort, the ‘Leading Group for the Municipal Low-Carbon City Pilot’. A multi-agency group headed by the municipal mayor, its members include the heads of key government agencies. This group is responsible for implementing and coordinating low-carbon city pilot programme actions through a system of inter-agency joint conferences. Table 2 shows the agencies responsible for the design and implementation of sector-specific low-carbon targets, actions, policies and programmes.
Policy Measures
Wuhan has gradually improved its low-carbon development planning. In 2011, Wuhan incorporated concepts of green and low-carbon development into its 12th Five-Year Plan for National Economic and Social Development. In 2011, Wuhan issued the Comprehensive Work Programme on Energy Saving, Consumption Reduction and Climate Change during the 12th Five-Year Plan, and in 2013, it issued the Action Plan on Wuhan’s Low-Carbon Pilot. These steps set out Wuhan’s low-carbon ideas, principles, objectives, main tasks and necessary policy actions. Wuhan pledged to peak carbon emissions by 2022; this pledge was included in its 13th Five-Year Plan. In 2016 and 2017, Wuhan issued the Wuhan 13th Five-Year Plan on Low-Carbon Development and the Wuhan Carbon Peaking Action Plan (2017–2022), respectively (Wuhan Municipal Development and Reform Commission, 2016).
Low-Carbon Action Implementing Agencies in Wuhan
Wuhan has designed low-carbon development strategic measures and policy tools in key fields such as energy, industry, buildings and transportation. In the energy supply sector, Wuhan is developing new renewable energy sources (including wind, photovoltaic and biomass) and encouraging energy conservation in existing power plants. Because Wuhan’s industrial structure is made up of a large proportion of traditional industries, the city has been increasing energy efficiency measures in heavy industry and upgrading its industrial structure. Overall, to transform its energy mix and reduce carbon emissions in these areas, Wuhan is prioritising energy efficiency, adoption of new technologies, reduction of carbon emissions per unit of energy consumption and reduction of energy demand. It has employed new policy tools such as regulations, market incentives, information disclosure mandates and voluntary behavioral change.
Evaluation Mechanisms
Wuhan has completed three annual city-wide GHG inventories and has set up an inventory mechanism using a nationally recognised methodology. It is currently exploring the adoption of Community-Scale Greenhouse Gas Emission Inventories, which are widely used throughout the world. Wuhan launched a district-level GHG inventory at the end of 2018, making it one of the few major cities in China to do so.
Wuhan has also developed key indicators for tracking its low-carbon development. Targets to achieve reduction in carbon intensity and capping emissions have been incorporated into a comprehensive assessment evaluation for all districts, departments, leading bodies and cadres. In addition, the Municipal Development and Reform Commission has established a Carbon Emission Evaluation System on New Fixed Assess Investment projects. However, Wuhan still lacks a systematic monitoring and evaluating system to track the performance of the city’s many policies, actions and programmes geared towards low-carbon growth.
Wuhan’s Green and Low-Carbon Development by Categories
While Wuhan has established a comprehensive and systematic low-carbon development policy framework, it still faces challenges in decarbonising its key sectors. Policymakers need to continue to refine their laws and regulations to provide a firm legislative foundation for low-carbon development efforts. Wuhan also needs to improve the monitoring and evaluation of its policy implementation.
As illustrated in Figure 5, the category-specific LOGIC scores for Wuhan remain far below their respective benchmarks. The following section examines Wuhan’s green and low-carbon growth in greater detail based on the city’s performance across the primary categories. 2

Economic Dimension
Wuhan’s LOGIC score in the economic dimension category is 4.46 out of 20, accounting for only 22 per cent of the benchmark value. The category is measured by economic energy intensity and economic carbon intensity. As discussed earlier, Wuhan’s economic growth is primarily based on energy and resource-intensive industries. In 2015, the city’s secondary sector, including the steel, automobile and petrochemical industries, accounted for 63.1 per cent of its energy consumption and contributed to 45.7 per cent of GDP. Currently, the city is still in the mid to late stage of industrialisation, where the secondary (mainly heavy industries) and tertiary sectors (mainly service-oriented industries) account for roughly equal shares of the economy. During the 12th Five-Year Plan period of 2011–2015, Wuhan implemented the Industrial Doubling Plan and the Services Upgrading Plan, which aimed to develop service-oriented industries (Wuhan Land Resource and Planning Bureau, 2016). These plans are helping Wuhan establish a modern industrial structure and support industrial innovation and upgrading, and low-carbon development. However, it will take time for these policies to affect LOGIC performance in this category.
Environment and Land Use
Wuhan’s LOGIC score in the category of environment and land use is 9.35 out of 20. This score is based on its performance in maintaining green spaces, promoting good air quality, waste management and water consumption. Its low score is in large part due to its poor air quality. Although the city has made efforts to improve air quality, such as decreasing the concentration of nitrogen oxides and particulate matter (PM2.5, PM10), 173 days in the year 2015 were categorised as polluted days. 3
The low score notwithstanding, Wuhan pursued air quality improvement measures during the 12th Five-Year Plan period. The key areas of pollution control were related to coal use, construction dust, motor vehicle emissions and volatile organic compounds from the burning of fossil fuels, requiring cooperation between different government departments such as energy, transportation and buildings. Policies targeted energy-saving emission reductions in coal use and promotion of low-emission units, fixing boundaries for highly polluting fuel combustion zones, monitoring emissions in industries with high levels of pollution, strengthened law enforcement and remediation, online monitoring systems, and other control measures for air pollution (Wuhan Municipal People’s Government, 2017a). For example, Wuhan established an online dust pollution monitoring platform and restricted the use of yellow label (high polluting) vehicles within the city.
As many human activities that generate carbon emissions also produce air pollutants, Wuhan can adopt a co-benefits approach to simultaneously reduce carbon emissions as well as air pollutants. However, measures that facilitate air quality improvement do not always bring other environmental benefits. For example, the application of ground source heat pumps reduces air pollution but also increases underground environment risks. Likewise, the use of bikes can reduce air pollution but increase the demand for bike production, which in turn generates high carbon emissions. Wuhan needs to develop a holistic co-benefits approach that avoids raising emissions in other sectors while reducing air pollution.
Energy and Power
This category measured Wuhan’s green and low-carbon performance in terms of its energy consumption, level of carbon emissions and development of non-fossil fuels. Wuhan received a 7.08 score in this category, indicating that it needs to make a concerted effort to improve its performance. As a city with a large population and undergoing rapid economic development, Wuhan still consumes a large amount of coal-based energy and faces the challenge of balancing industrialisation, urbanisation and decarbonisation.
In 2015, the annual growth rate of the city’s population was 1.4 per cent. This continuous increase in population size is driving the city’s energy consumption, which is highly dependent on fossil fuels. Carbon-based fuels (coal, crude oil and natural gas) account for 77 per cent of the total energy consumption in 2015, even as the share of non-fossil fuels increased from 8.75 to 11.5 per cent between 2010 and 2015 (Wuhan Municipal People’s Government, 2017b).
Wuhan’s energy sector has been focusing on developing new and renewable energy options (including wind power, photovoltaic power, ground source heat pumps, river water source heat pumps and biomass) and encouraging energy conservation measures in existing power plants, coal efficiency of boilers and the implementation of cogeneration (combined heat and power) as part of its low-carbon development plan. Wuhan has released a series of plans to optimise its energy mix and reduce its carbon emissions, such as the 13th Five-Year Plan on Energy Development, 13th Five-Year Plan for Embracing Blue Skies, and the Wuhan Action Plan on Peaking Carbon Emissions (2017–2022). Wuhan also aims to reduce total coal consumption by 5 million tonnes during the 13th Five-Year Plan period (2016–2020) (Wuhan Municipal People’s Government, 2017b) through measures including strict controls on all new coal-fired projects, replacing small coal-fired boilers and banning coal for residential use in certain areas.
Industry
Industry plays a crucial role in Chinese cities’ green and low-carbon development, as this sector is the largest contributor to cities’ carbon emissions. In the case of Wuhan, its LOGIC score in this category is 7.61 out of 18, indicating that Wuhan holds great potential to decarbonise its industry sector. This sector accounted for more than half of the city’s carbon emissions.
During the 12th Five-Year Plan, Wuhan enacted a set of measures to support the transformation and upgradation of traditional industries, technological improvements, product structure optimisation and product quality improvement. The city set limits on the production capacities of existing energy-intensive industries, such as electricity, steel, petrochemicals, building materials, flat glass and paper (Wuhan Municipal People’s Government, 2016). It also phased out energy-intensive, low value-added production capacity by implementing strict policies on industry access, environmental protection and safety standards. Wuhan began monitoring the implementation of energy-saving measures adopted by key energy-consuming units and set energy consumption limits on energy-intensive products. The city also set up a special investment fund for technological transformation.
However, as a key player in China’s manufacturing industry and the nation’s auto industry base, Wuhan’s industrial sector is still marked by high carbon emissions. It therefore needs to further optimise its industrial structure with the development of advanced manufacturing industries, such as computer and electronic products, and increase its energy efficiency with smart energy management systems.
Buildings
Wuhan received a score of 4.08 out of 8 in the buildings category, which is above 50 per cent of the benchmark performance. The score reflects the city’s promotion of green buildings and success in reducing energy consumption per capita in buildings, indicating that Wuhan has made good progress in decarbonising the building sector, even though challenges remain.
During the 12th Five-Year Plan period, the key areas for low-carbon development in the buildings sector were green buildings and building codes. This included energy-saving measures and retrofits, green building and renewable energy building applications and the promotion of energy-saving appliances and green building materials (Wuhan Municipal Commission of Urban-Rural Development, 2017). Policies sought to increase the use of renewable energy power sources and the use of groundwater and air-sourced heat pump systems in new residential buildings and to promote development of new building materials technology.
However, as Wuhan’s urbanisation rate rises and living standards improve, the buildings sector will be a major growth area in terms of the city’s future carbon emissions. In 2016, the State Council issued the Outline for Planning the Development of the Yangtze River Economic Belt, a document which designated Wuhan as a megacity. As a megacity, going forward, Wuhan will focus more on urban functionality, industrial agglomeration and acquiring human resources. This will spur the development of the buildings sector, which could have a long-term carbon lock-in effect if new residential and office structures do not have high levels of energy efficiency. At present, most existing buildings are not energy efficient, and the cost to retrofit them is high. This suggests that Wuhan needs to improve energy efficiency standards for new construction projects. At the same time, more emphasis can be placed on smart metering, smart communications and peak-load management to make heating, cooling, lighting processes and appliances more energy efficient.
Transportation
The LOGIC score for the transportation category in Wuhan is 3.7 out of 6, indicating that the city has been moving toward low-carbon and green transport. In 2015, public transport accounted for 59 per cent of all motorised trips in Wuhan.
As a city with numerous transport-related pilot schemes, including low-carbon transport and new energy vehicle pilot programmes, Wuhan has been exploring different low-carbon practices in its transport sector. During the 12th Five-Year Plan period, Wuhan adopted two low-carbon transportation strategies. One was to promote the use of new energy vehicles and energy-efficient vehicles, and the other was to develop the city’s transportation infrastructure by improving the state of public transport networks and creating a non-motorised transport system. The main policy measures included tax subsidies, a special government procurement programme, and infrastructure investment (Ministry of Transport, 2017; Wuhan Strategic Research Institute on Transport Development, 2017).
While Wuhan has encouraged the use of energy-efficient vehicles such as natural gas-powered taxis, hybrids and electric buses, whether these measures can reduce emissions largely depends on the sources of electricity. If electricity comes mainly from coal-fired power, it could undermine the effect of these measures on emission reduction. Therefore, the promotion of new energy vehicles needs to be complemented by policy support for clean electricity.
Wuhan has increased its infrastructure investment in transportation with the development of public transit networks and new vehicle charging infrastructure, which could reduce transport demand for private cars. However, as Wuhan becomes a national freight logistics centre, it is also important that the city explores energy-saving and emission-reduction opportunities in freight transport.
Recommendation for Wuhan’s Overall Green and Low-Carbon Development
As discussed above, between 2010 and 2015, while Wuhan made progress in its green and low-carbon development, it still has great potential to improve its performance, particularly in the three LOGIC categories of economic dimension, energy and power, and industry—all of which show large gaps compared to the benchmark performance. To make its green and low-carbon efforts more effective, Wuhan needs to make carbon reduction a key criterion in its overall economic and social development planning. This will provide a basis for a long-term decarbonisation strategy and pathway. In addition, as Wuhan is undergoing rapid industrialisation, much more attention should be paid to the decarbonisation of the industrial sector, especially in terms of reducing heavy industry’s share of GDP and industrial energy intensity. One approach is industrial structure optimisation, i.e., developing new strategic industries and service-oriented industries. Another is the improvement of energy-saving management mechanisms and the application of energy-saving and emission-reduction technologies. Instituting regular monitoring mechanisms will also be important elements of Wuhan’s low-carbon development.
Conclusion
This article has provided a snapshot of how cities in China have been performing with respect to their green and low-carbon transition goals. It has described a new city indicator system, the China LOGIC, which measures and tracks efforts by Chinese cities to achieve green and low-carbon development. LOGIC builds on existing international and domestic Chinese city indicator systems, but it is designed to more accurately reflect the green and low-carbon objectives and priorities of Chinese cities. It tracks both the general and sector-specific performance of cities’ green and low-carbon progress. LOGIC’s key finding is that while Chinese cities are able to realise green economic growth—a key government priority—their performance shows that there is much room for improvement.
The article also uses the city of Wuhan as a case study to illustrate the application of LOGIC to assess the green and low-carbon development progress made by cities and understand ongoing challenges. Going forward, LOGIC can help identify and highlight the opportunities for China’s cities to effectively pursue low-carbon development and energy sustainability measures in smart and effective ways. It could also play a role in the development of indicator systems that more accurately assess and compare the green and low-carbon development of cities in different countries, helping to better define international standards and benchmarks.
Footnotes
Acknowledgements
The authors wish to thank Jingjing Zhang, Stephanie Ohshita, Nan Zhou and Alek Cannan for their helpful feedback on the development of the LOGIC index.
Declaration of Conflicting Interests
The authors declared no potential conflicts of interest with respect to the research, authorship and/or publication of this article.
Funding
The authors are grateful for funding support from the Energy Foundation China.
Cities Assessed in LOGIC

| City | Province | Low-Carbon Pilot Status |
| Anshan | Liaoning | Low-Carbon Pilot |
| Baoding | Hebei | Low-Carbon Pilot |
| Baotou | Inner Mongolia | Non-Pilot |
| Beijing | Beijing | Low-Carbon Pilot |
| Bengbu | Anhui | Non-Pilot |
| Benxi | Liaoning | Low-Carbon Pilot |
| Changchun | Jilin | Non-Pilot |
| Changde | Hunan | Non-Pilot |
| Changsha | Hunan | Non-Pilot |
| Changzhou | Jiangsu | Non-Pilot |
| Chengdu | Sichuan | Non-Pilot |
| Chifeng | Inner Mongolia | Non-Pilot |
| Chizhou | Anhui | Low-Carbon Pilot |
| Chongqing | Chongqing | Low-Carbon Pilot |
| Dalian | Liaoning | Low-Carbon Pilot |
| Daqing | Heilongjiang | Non-Pilot |
| Datong | Shanxi | Non-Pilot |
| Dongguan | Guangdong | Low-Carbon Pilot |
| Foshan | Guangdong | Low-Carbon Pilot |
| Fushun | Liaoning | Low-Carbon Pilot |
| Fuzhou | Fujian | Non-Pilot |
| Ganzhou | Jiangxi | Low-Carbon Pilot |
| Guangyuan | Sichuan | Low-Carbon Pilot |
| Guangzhou | Guangdong | Low-Carbon Pilot |
| Guilin | Guangxi | Low-Carbon Pilot |
| Guiyang | Guizhou | Low-Carbon Pilot |
| Haikou | Hainan | Low-Carbon Pilot |
| Handan | Hebei | Non-Pilot |
| Hangzhou | Zhejiang | Low-Carbon Pilot |
| Harbin | Heilongjiang | Non-Pilot |
| Hefei | Anhui | Non-Pilot |
| Hengyang | Hunan | Non-Pilot |
| Huai’an | Jiangsu | Low-Carbon Pilot |
| Huaibei | Anhui | Non-Pilot |
| Huai’nan | Anhui | Non-Pilot |
| Huangshi | Hubei | Low-Carbon Pilot |
| Huhhot | Inner Mongolia | Non-Pilot |
| Huizhou | Guangdong | Low-Carbon Pilot |
| Hulunbuir | Inner Mongolia | Low-Carbon Pilot |
| Jiangmen | Guangdong | Low-Carbon Pilot |
| Jieyang | Guangdong | Low-Carbon Pilot |
| Jilin | Jilin | Low-Carbon Pilot |
| Jinan | Shandong | Non-Pilot |
| Jinchang | Gansu | Low-Carbon Pilot |
| Jincheng | Shanxi | Low-Carbon Pilot |
| Jingdezhen | Jiangxi | Low-Carbon Pilot |
| Jining | Shandong | Non-Pilot |
| Jinzhou | Liaoning | Low-Carbon Pilot |
| Kaifeng | Henan | Non-Pilot |
| Kunming | Yunnan | Low-Carbon Pilot |
| Laiwu | Shandong | Non-Pilot |
| Lanzhou | Gansu | Non-Pilot |
| Linyi | Shandong | Non-Pilot |
| Liuzhou | Guangxi | Non-Pilot |
| Luoyang | Henan | Non-Pilot |
| Luzhou | Sichuan | Non-Pilot |
| Mianyang | Sichuan | Non-Pilot |
| Nanchang | Jiangxi | Low-Carbon Pilot |
| Nanchong | Sichuan | Non-Pilot |
| Nanjing | Jiangsu | Non-Pilot |
| Nanning | Guangxi | Non-Pilot |
| Nanping | Fujian | Low-Carbon Pilot |
| Nantong | Jiangsu | Non-Pilot |
| Nanyang | Henan | Non-Pilot |
| Neijiang | Sichuan | Non-Pilot |
| Ningbo | Zhejiang | Low-Carbon Pilot |
| Pingdingshan | Henan | Non-Pilot |
| Qingdao | Shandong | Low-Carbon Pilot |
| Qinhuangdao | Hebei | Low-Carbon Pilot |
| Qiqihar | Heilongjiang | Non-Pilot |
| Quanzhou | Fujian | Non-Pilot |
| Shanghai | Shanghai | Low-Carbon Pilot |
| Shangqiu | Henan | Non-Pilot |
| Shantou | Guangdong | Low-Carbon Pilot |
| Shaoxing | Zhejiang | Non-Pilot |
| Shenyang | Liaoning | Low-Carbon Pilot |
| Shenzhen | Guangdong | Low-Carbon Pilot |
| Shijiazhuang | Hebei | Low-Carbon Pilot |
| Suqian | Jiangsu | Non-Pilot |
| Suzhou | Jiangsu | Low-Carbon Pilot |
| Taiyuan | Shanxi | Non-Pilot |
| Taizhou | Jiangsu | Non-Pilot |
| Taizhou | Zhejiang | Non-Pilot |
| Tangshan | Hebei | Non-Pilot |
| Tianjin | Tianjin | Low-Carbon Pilot |
| Urumuqi | Xinjiang | Low-Carbon Pilot |
| Weifang | Shandong | Non-Pilot |
| Wenzhou | Zhejiang | Low-Carbon Pilot |
| Wuhan | Hubei | Low-Carbon Pilot |
| Wuhu | Anhui | Non-Pilot |
| Wuwei | Gansu | Non-Pilot |
| Wuxi | Jiangsu | Non-Pilot |
| Xia’men | Fujian | Low-Carbon Pilot |
| Xi’an | Shanxi | Low-Carbon Pilot |
| Xiangyang | Hubei | Low-Carbon Pilot |
| Xianyang | Shanxi | Low-Carbon Pilot |
| Xingtai | Hebei | Non-Pilot |
| Xi’ning | Qinghai | Non-Pilot |
| Xuzhou | Jiangsu | Non-Pilot |
| Yan’an | Shanxi | Low-Carbon Pilot |
| Yancheng | Jiangsu | Non-Pilot |
| Yangzhou | Jiangsu | Non-Pilot |
| Yantai | Shandong | Non-Pilot |
| Yichang | Hubei | Low-Carbon Pilot |
| Yinchun | Ningxia | Non-Pilot |
| Yingkou | Liaoning | Low-Carbon Pilot |
| Zaozhuang | Shandong | Non-Pilot |
| Zhangjiakou | Hebei | Non-Pilot |
| Zhanjiang | Guangdong | Low-Carbon Pilot |
| Zhengzhou | Henan | Non-Pilot |
| Zhenjiang | Jiangsu | Low-Carbon Pilot |
| Zhuzhou | Hunan | Non-Pilot |
| Zibo | Shandong | Non-Pilot |
| Zigong | Sichuan | Non-Pilot |
| Zunyi | Guizhou | Low-Carbon Pilot |