
Abstract
This study focuses on assessing the values of heritage sites in West Bengal, India, with a particular emphasis on the post-lockdown period in the wake of the COVID-19 pandemic. The heritage temple town of Bishnupur in the Bankura district was purposively chosen as the primary research site. Both primary and secondary data sources were utilized. Secondary data were collected from official publications of the Ministry of Tourism, Government of India, the Department of Tourism, Government of West Bengal and other pertinent grey literature sources. Primary data were gathered through structured interviews with a sample of tourists. Analytical tools, including descriptive statistics, semi-log regression models, ANOVA, zonal travel cost method and contingent valuation method, were employed for data analysis. Findings reveal that Bishnupur’s heritage temples primarily attract tourists from nearby areas, particularly within the same district, during the post-lockdown period. Notably, tourists expressed a high level of satisfaction with their experiences, and this satisfaction was found to be significantly associated with their willingness to contribute financially for further improvements and conservation efforts in the heritage sites. This study provides valuable insights into the recreational values of selected tourist sites and tourists’ willingness to pay for their continued enhancement, preservation and management. These insights are particularly pertinent in the context of the post-lockdown period caused by the COVID-19 pandemic. They offer guidance for decision-makers and stakeholders involved in the development and preservation of heritage tourism in West Bengal, India, serving as a valuable resource for informed policy and strategy formulation.
Keywords
Introduction
Heritage tourism has emerged as a remarkable societal phenomenon, gaining prominence in the latter part of the twentieth century (Hampton, 2005; Richards, 2018). It is widely recognized for its capacity to satisfy leisure demands, generate employment opportunities and stimulate economic innovations, thus enhancing the identity of tourist destinations (Rosenfeld, 2008). In contemporary tourism, the majority of trips, whether within one’s own country or abroad, usually incorporate a cultural aspect. This may involve exploring a historic city centre, touring a museum or leisurely wandering through a historic garden. In India, and particularly in West Bengal, the confluence of cultures over millennia has given rise to an array of captivating heritage sites that constitute an immensely appealing and diversified tourism product (Ahamed, 2017). Each of these heritage sites possesses inherent recreational value, a non-market asset, thus prompting significant attention in the field of environmental economics for their preservation and their critical role in sustaining the economic viability of the tourism industry (Devi, 2010; Pearce, 1982).
Before the COVID-19 pandemic, the travel and tourism sector was a robust contributor to global economic growth, creating jobs, alleviating poverty and fostering local socio-economic development (Beshudi, 2020; Honey & Gilpin, 2009; Kinyondo & Pelizzo, 2015; Mbaiwa, 2005; Oh, 2005; Snajdar, 2020; Song et al., 2018). It played a crucial role in both developed and developing economies, driving economic resources through income generation, employment, revenue and infrastructure development (Honey & Gilpin, 2009). However, the emergence of the COVID-19 crisis brought unprecedented challenges, including border closures, reduced transportation and decreased demand in the travel and tourism sector (Henseler et al., 2022; Pham et al., 2021). In 2019, tourism contributed a substantial USD 3.5 trillion to the global economy, equivalent to 4% of the global GDP, but the pandemic halved this contribution to USD 2.0 trillion in 2020, representing 1.8% of the global GDP (UNWTO, 2021). The pandemic also resulted in the loss of 100.08 million jobs globally in the travel and tourism industry (Statista, 2020). India, including West Bengal, was severely affected, with an estimated 40 million job losses and an annual revenue loss of approximately USD 17 billion (FICCI, 2020; NCEAR, 2021). The COVID-19 pandemic significantly impacted the global and local travel and tourism sector, disrupting its economic contributions and employment opportunities.
West Bengal, particularly the Bankura district in Rarh Bengal, boasts numerous architectural and natural heritage sites, including Susunia Hill, Mukutmanipur Dam, Biharinath Hill, Jayrambati, Jhilimilii and Bishnupur, known for its terracotta temples and handicrafts (Chattopadhyay, 2003; Chowdhury, 2006; Mandal & Chakrabarty, 2021; Pan, 2011). These attractions draw both domestic and international tourists, contributing to the local economy and socio-economic development, as it creates employment opportunities and encourages entrepreneurial initiatives (Chatterjee & Chakraborty, 2018; GoI, 2017). In 2018, the Bishnupur Group of Temples recorded 190,470 individuals, marking a notable increase from the 2017 figure of 124,347 people (GoI, 2017, 2020). Marketing strategies have been tailored to showcase the town’s rich cultural legacy, capitalizing on its historical significance. However, it is crucial to value these heritage destinations properly to avoid negative impacts and to ensure balanced and sustainable resource utilization (Dong et al., 2011; Nuva et al., 2009). Underpricing and the non-rival nature of these resources can lead to rapid degradation, worsened by the lack of monitoring (Devi, 2010). The COVID-19 pandemic significantly altered travel interests due to restrictions and changed priorities (Gössling & Schweiggart, 2022; Lagos et al., 2021). West Bengal’s tourism economy suffered, but the government has initiated post-lockdown development efforts to maximize tourism benefits (Sarkar et al., 2021). Proper valuation, including assessing recreational resources, is crucial for policymaking, resource utilization and conservation, tailored to local needs (Henry, 1995). These efforts aim to rejuvenate the tourism sector in West Bengal.
The field of recreational valuation of tourist sites has witnessed significant growth since the 1990s. Notably, three methods have gained prominence in valuing tourist sites: the travel cost method (TCM) (Beal, 1995; Chopra, 1998; Chopra & Adhikari, 2004; Dixon & Sherman, 1990; Mitra et al., 2019; Tobias & Mendelsohn, 1991; Von Buren et al., 1996; Ward & Loomis, 1986), the contingent valuation (CV) method (Dong et al., 2011; Maharana et al., 2000; Mukhopadhyay et al., 2020; Murty & Menkhaus, 1994; Nuva et al., 2009) and the hedonic pricing approach (Choudhury, 2004; Nillesen, 2002; Tohmo, 2004). These valuation methods offer crucial insights in quantifying the recreational and tourism value of heritage sites, shedding light on the consumer surplus generated by visitors, which is essential for policy formulation and resource management (Van Bueren et al., 1996). For example, in the case of Machu Picchu, study suggests that foreign tourists should pay more to increase site profitability and national visitor access, albeit with current legislative barriers (Mourato et al., 2004). While these methods are valuable, they are not without criticisms and challenges. Critics argue that they may oversimplify complex preferences and fail to capture the full spectrum of non-market values associated with heritage sites, such as cultural and historical significance (Crossick & Kaszynska, 2014; Kumar & Kumar, 2008). Additionally, ensuring the accuracy of data and accounting for potential biases in willingness to pay (WTP) estimates can be challenging.
Despite these criticisms, the utility of these valuation methods in assessing the economic value of heritage sites, providing a foundation for further research and policy development in the realm of heritage tourism. However, it is important to note that the rigorous analysis of the empirical investigation on the recreational valuation of tourist sites in India is still limited, and there is a gap in such studies, particularly in the context of West Bengal. This study aims to address this gap by applying these valuation methods to heritage tourism in the state, shedding light on the formulation of heritage tourism policies that account for the perspectives of tourists, with specific objectives including (a) assessing the status of heritage tourism, (b) profiling the socio-demographic and visitation characteristics of tourists, (c) estimating the non-monetary recreational value of tourist sites and (d) gauging tourists’ WTP for site improvements.
Materials and Methods
Selection of the Study Area
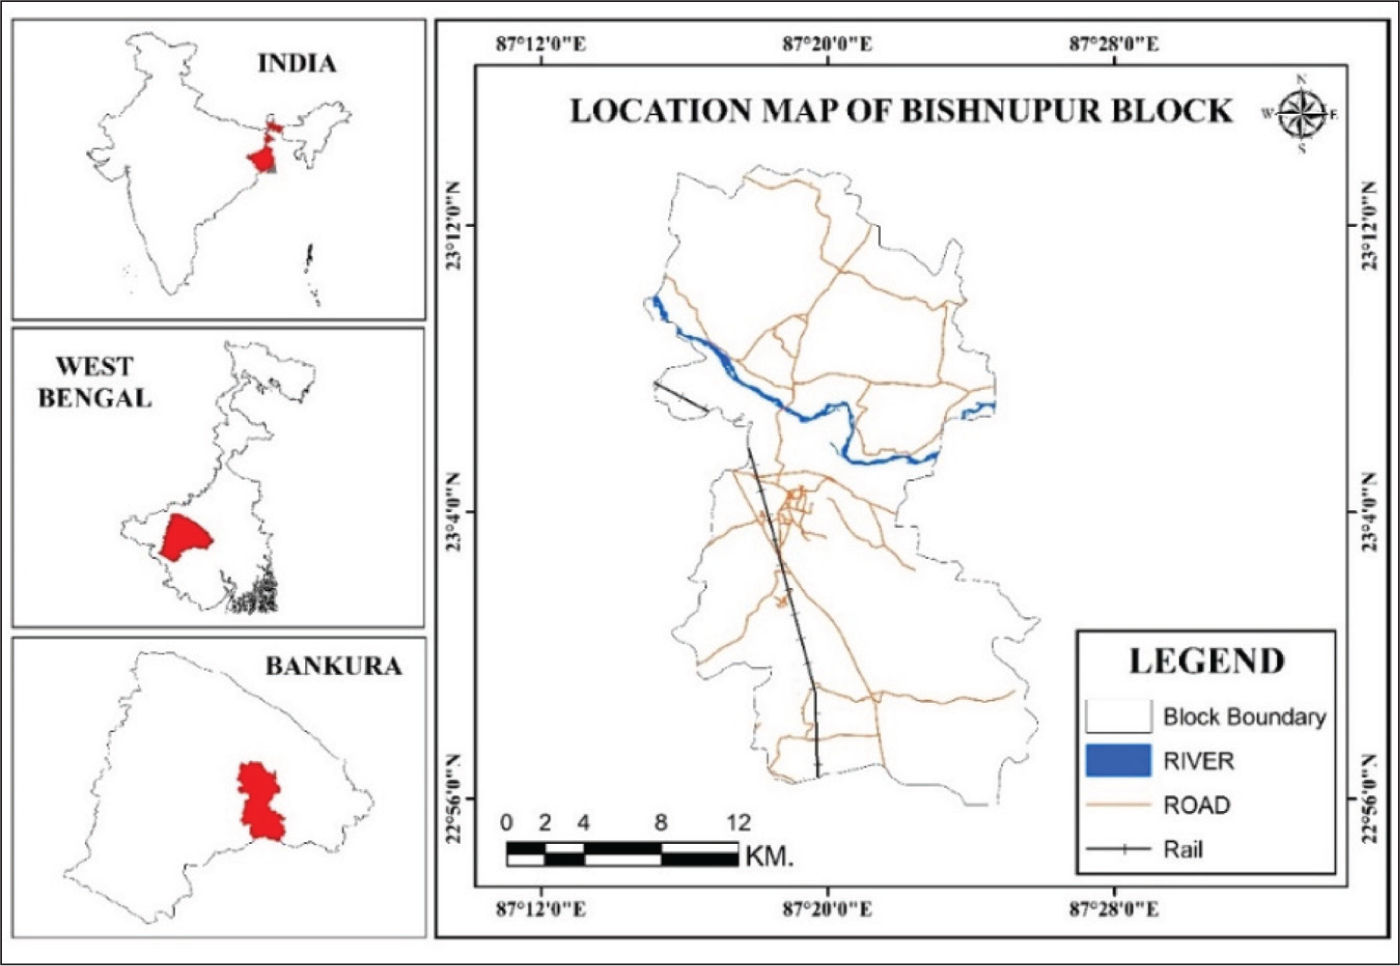
To fulfil the objectives of this study, the terracotta temple town of Bishnupur 1 (23.075°N, 87.317°E) (Figures 1 and 2) of Bankura district in the state of West Bengal was selected purposively, as it attracts large number of tourists (both domestic and international) every year. This site is famous for its terracotta group of temples built by the Malla rulers, historic Radha Krishna temples built during 1600–1800 CE and the Baluchari sarees (Chattopadhyay, 2003; Chowdhury, 2006). Bishnupur is a city and municipality of Bankura district in the state of West Bengal in India. Bishnupur’s coordinates are 23.075ºN 87.317ºE. The district experiences fair cold climate during winter and hot climate in summers. The soil of Bishnupur is broadly classified as ferruginous rod soil. The deciduous forest area of the region is 148,177 hectares, which is 21.5% of the total geographical area of the district. Bishnupur is a well-connected tourist spot by road and railways.
Location Map of the Study Area.

Sources of Data
This study draws upon a combination of primary and secondary data sources. Secondary data were derived from official publications of the Ministry of Tourism, Government of India; the Department of Tourism, Government of West Bengal; and various other grey literature sources such as journals, periodicals, magazines and newspapers. Primary data collection took place through in-depth interviews conducted between March and May 2022, involving a carefully prepared semi-structured interview questionnaire. Prior to the interviews, all respondents were provided with clear information regarding the research objectives and the identity of the researchers. The interview schedule consists of three parts, namely (a) socio-demographic profile (age, sex, occupation, income, education and so on), (b) visitation profile (travel time, travel cost (TC), mode of transport, choice of accommodation and so on) and (c) contingent behaviour (satisfaction with existing services and WTP).
Selection of Samples for Primary Data Collection
To gather data on the socio-demographic and visitation profiles of tourists, in-depth interviews were conducted with a total of 135 domestic tourists. These tourists were selected at random, given their pivotal role in driving local tourism, particularly during the post-lockdown period following the COVID-19 pandemic. Each interview was conducted with one representative respondent, aged 18 or above, from each tourist group.
Analytical Tools
Simple statistical tools like descriptive statistics, semi-log regression model, ANOVA and so on were used for the analysis of primary as well as secondary data.
Cultural heritage’s benefits are multifaceted, ranging from visitor enjoyment to the value placed on its existence, making it imperative to secure funding for conservation. Efficient pricing strategies are crucial in managing these benefits and addressing the complexities of heritage management. By setting entry fees to maximize revenue while considering visitor satisfaction and sustainable capacity, heritage sites can strike a balance. Profit maximization and differential pricing among visitor groups, especially for foreign and domestic tourists, can be effective strategies. Moreover, setting domestic prices to optimize consumer surplus contributes to national welfare. Implementing optimal pricing can be challenging due to limited demand data on price changes. Stated preference methods like TC, CV can help estimate demand by surveying visitors on their WTP. Various studies, including those on renowned sites like Turin’s Rivoli Castle and Warkworth Castle, have applied CV, revealing varying WTP values. Efficient pricing strategies enhance heritage site management by considering financial, visitor and sustainability factors (Bertacchini, 2021; Mourato et al., 2004; Noonan, 2003; Mourato, 2004; Snowball, 2013; Tuan & Navrud, 2008; Verstrynge et al., 2022).
Recreational valuation (equivalent to the economic value) of the study area was estimated by using zonal travel cost method (ZTCM) 2 (Adamowicz, et al., 1998; Grandstaff & Dixon, 1986; Kling, 1997). In this study, the zones were considered on the basis of political boundary, that is, various districts in the state. The concept of TCM is based on the assumption that a rational individual will weigh up the costs of a recreational visit against the benefits of the visit and then display the result in actual behaviour. The individual recreation approach includes five sequential steps: (a) trip preparation, (b) travel to the site, (c) the on-site experience, (d) the travel back from the site and (e) the recollection of the experience (Scheiner et al., 1984). Generally, four components of benefits could be derived from recreational sites. These are: (a) direct on-site recreational benefits, (b) benefits to off-site users such as opinion or existing values, (c) revenue to the operating agency from entrance fees and (d) net gain in regional income derived from on-site expenditures (Ward & Loomis, 1986).
The TCM is based on transportation and other costs of travel. It is assumed that the cost of travel and time taken to visit a recreational site is an indicator for the price of any on-site activities. Users of the TCM anticipate that any increases in travel costs, time, and entrance fees are reflected in improved services and experiences. Data on actual TCs (including food costs, accommodation costs and any forgone income) can be collected by a survey. The benefits for any given individual are the cost savings relative to the other individuals who visit the same recreational environment. In environmental economics, many researchers agree that the semi-log model yields better results (Bann, 1999); therefore, the model in semi-logarithmic form is considered for the study sites. The basic equation of TCM is as follows:
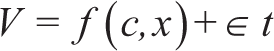
Where V = visitation to the location, c = visitation cost, x = socio-economic variables that are significant to explain V and εt = other factors that does not include the function but affecting V.
Data Analysis and Results
Socio-demographic Profile of the Sample Tourists
The majority of respondents in the sample were male, constituting 90.4% of the total, while female tourists made up a smaller share at 9.6%. The age group of 21–30 years comprised the largest portion of the sample, accounting for 44.4%, followed by those above 50 years, making up 21.50%. In terms of marital status, 48.1% of the sample tourists were married, whereas 51.9% were unmarried. Religion-wise, approximately 97% of the sample tourists identified as Hindu. The majority of these tourists hailed from urban to semi-urban areas. When it came to education, the highest proportion of sample tourists held a graduate degree, totalling 57%, followed by those with a master’s degree at 25.2%. In terms of employment, 28.9% of the sample tourists were unemployed, with private sector employees comprising 24.4%, public sector employees at 18.5% and wage labourers at 14.1%. Regarding monthly family income, the largest share fell within the range of ₹20,001–₹30,000, accounting for 25.2%, followed by the ₹10,001–20,000 range at 24.1%. Some tourists reported a monthly family income of ₹40,000 and above, which constituted 17.8% of the sample. On average, the monthly income for the sample tourists was calculated at ₹2,774.07 (Table 1).
Socio-demographic Profile of the Sample Tourists of the Study Area.

Visitation Profile of the Sample Tourists
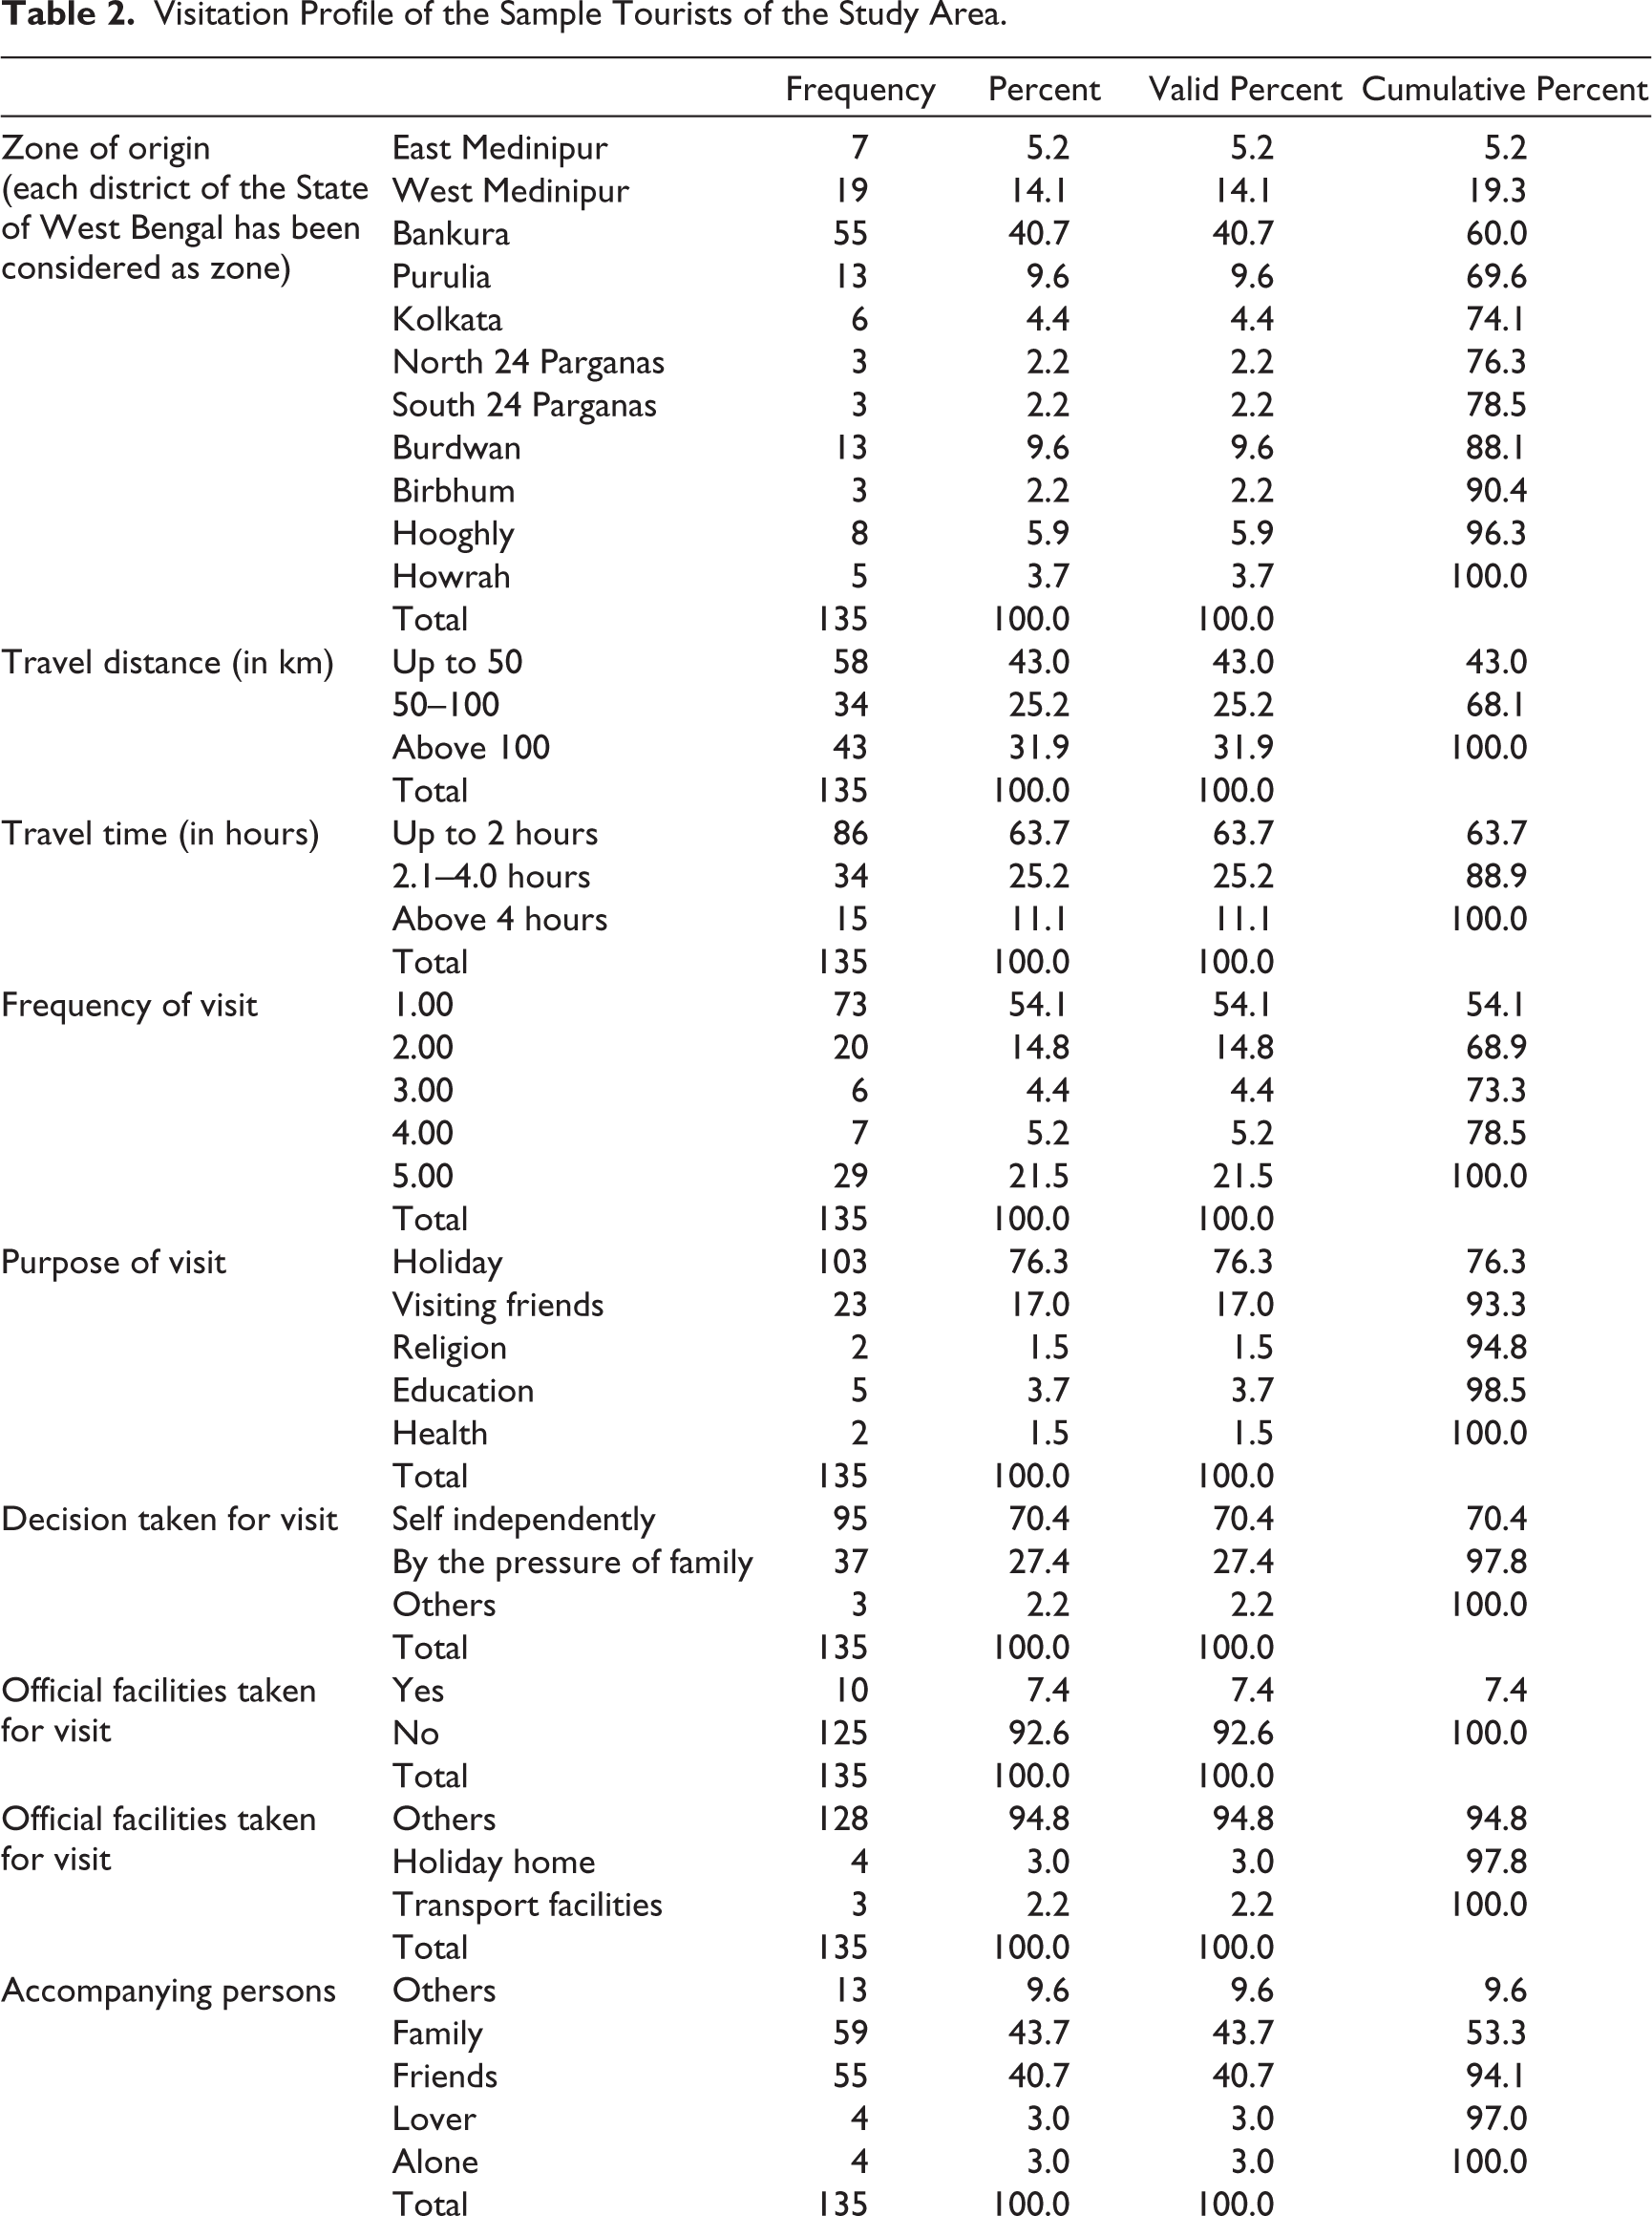
The largest portion of the sample tourists originated from Zone-3 (Bankura), representing 40.7% of the total, which includes the notable archaeological temple town of Bishnupur. Additionally, 14.1% of the sample tourists came from the neighbouring district of West Medinipur. The average distance travelled to reach the study sites was calculated to be 83.11 km, with an average travel time of 2.3 hours. A significant portion of the sample tourists, 54.1%, indicated that this visit was their first time to the site, while the remaining had visited the site previously. The primary purpose for the visit of the sample tourists was holiday, leisure and recreational activities, which accounting for 76.3%, followed by visiting friends at 17%. Most of the tourists were accompanied by family members (43.7%), with friends being the next common group at 40.7%. The majority of the tourists came in groups of four members (44.4%), followed by groups with up to three members (28.1%). Regarding the duration of their stay, the majority were day trippers, making up 74.8%, while ‘1 night 2 days’ stays accounted for 22.2% of the sample. Notably, 64.4% of the sample tourists organized their tour independently. The primary mode of transportation used by the sample tourists to reach the study sites was bike/two-wheelers, comprising 31.9%, followed by private cars at 23%, travel by train at 19.3% and bus at 14.3% (Table 2).
Visitation Profile of the Sample Tourists of the Study Area.

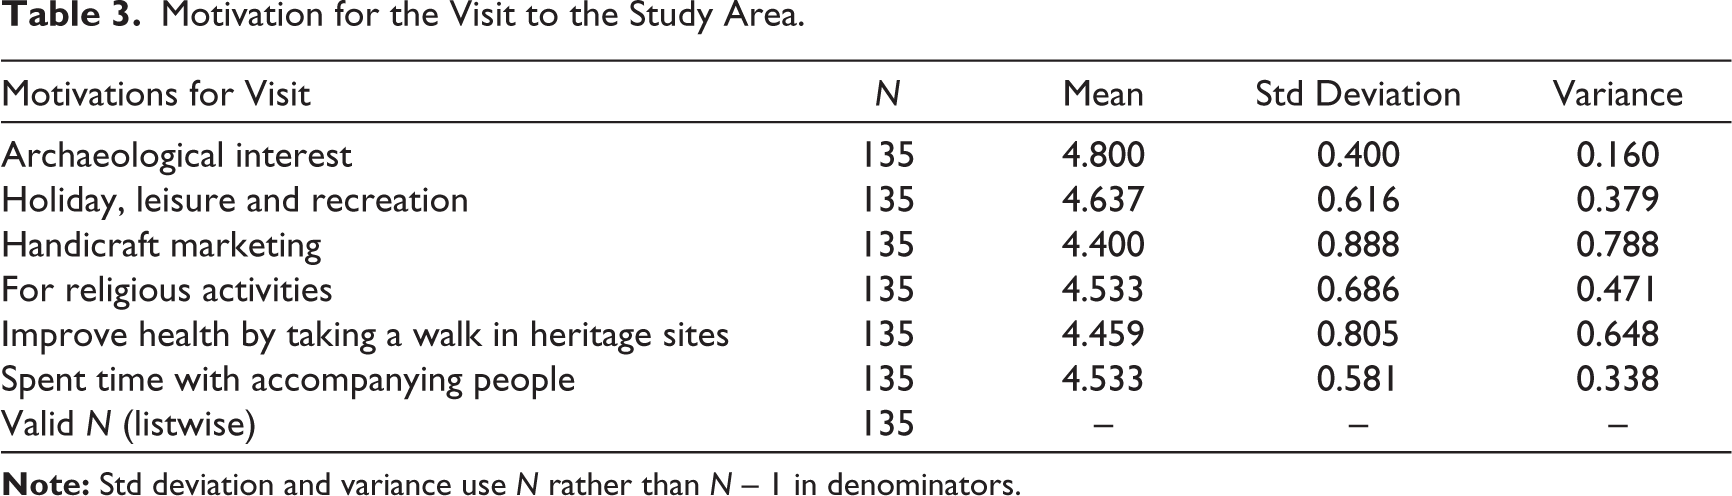
The surveyed tourists exhibited diverse motivations for choosing to visit the study area, with many citing multiple reasons for their trip. Among the primary motivations reported, the majority of respondents indicated a strong interest in archaeology (mean score: 4.80). Following closely were motivations related to holidaying, leisure and recreational pursuits (mean score: 4.64); spending quality time with companions (mean score: 4.53)’ engaging in religious activities (mean score: 4.53); and exploring local handicraft markets (mean score: 4.40) (Table 3).
Motivation for the Visit to the Study Area.
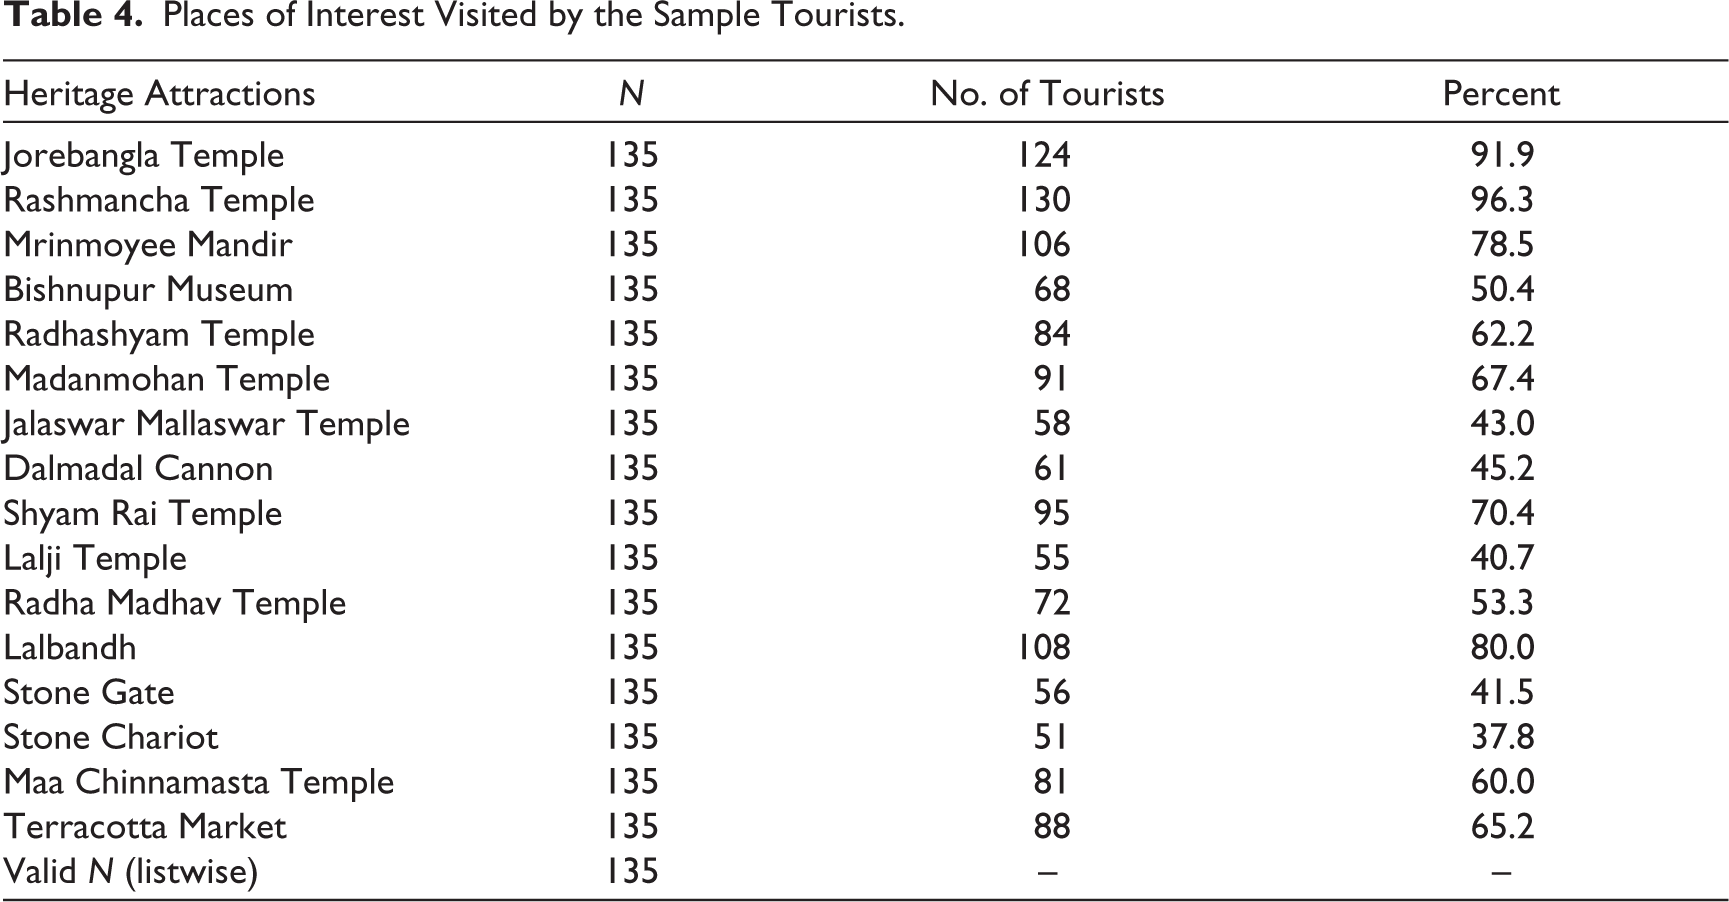
The study area boasts a multitude of captivating sites that draw the attention of tourists. Table 4 provides insights into the key places of interest visited by the sampled tourists. Notably, Rashmancha Temple (96.3%) (Figure 3) and Jorebangla Temple (91.9%) emerged as the two most favoured tourist destinations among the respondents. They were closely followed by Lalbandh (80%), Mrinmoyee Mandir (78.5%), Shyam Rai Temple (70.4%), Madan Mohan Temple (67.4%) and the Terracotta Market (65.2%).
Rasmancha Terracota Temple: A Heritage Attraction in the Study Area.

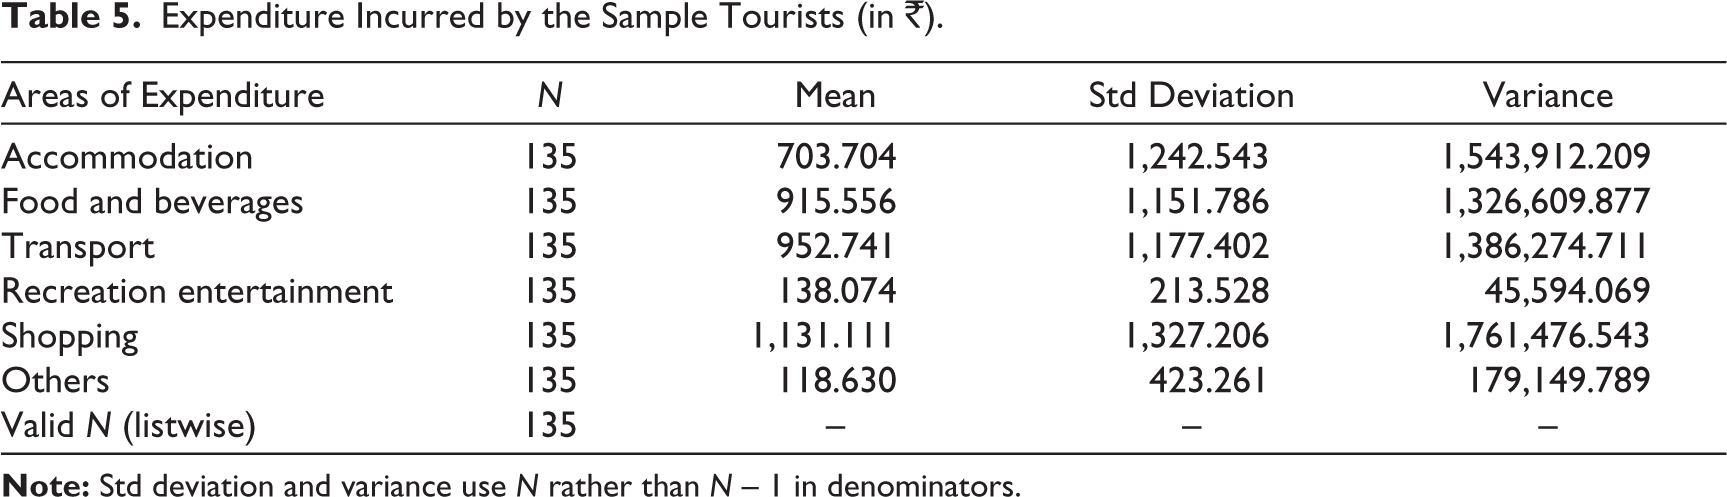
The primary aim of promoting tourism development in any region is to stimulate increased tourist spending within that area. Such expenditure has been shown to have a positive correlation with short-term and long-term economic growth. The money spent by tourists essentially becomes revenue for various stakeholders engaged in the tourism sector. Tourists allocate their funds across various categories, and the study indicates that the sampled tourists directed a significant portion of their expenditure towards shopping. This was followed by expenses related to transportation, food and beverages, and accommodation. It is noteworthy that the local markets, particularly handicraft shops in the study area, emerged as the primary beneficiaries of the funds expended by the sampled tourists (Table 5).
Places of Interest Visited by the Sample Tourists.
Expenditure Incurred by the Sample Tourists (in ₹).
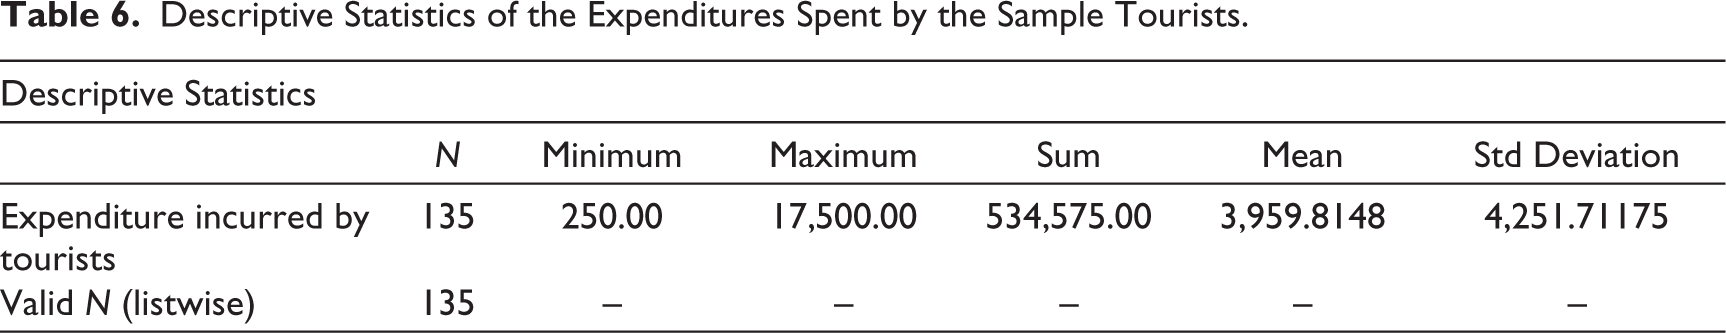
The sampled tourists’ expenditure displayed a range, with the lowest recorded expenditure amounting to ₹250.00 per trip and the highest reaching ₹17,500.00 per trip. In total, the sample tourists collectively spent ₹534,575.00 during their visits to the study sites (Table 6).
Descriptive Statistics of the Expenditures Spent by the Sample Tourists.
A multiple linear regression model was employed to identify the factors influencing the expenditure of the sample tourists. The equation for the simple linear regression model was estimated as follows:

Where
Ei = per capita tourism expenditure of the ith respondent; Ai = age of the ith respondent; Si = sex/gender of the ith respondent (1 = male and 0 = female); Mi = marital status of the ith respondent (1 = married and 0 = others); RUi = rural urban background of the ith respondent; Ei = educational level of the ith respondent; Oi = occupation of the ith respondent; FIi = monthly family income of the ith respondent; Di = distance travelled by the ith respondent; LSi = length of stay by the ith respondent; Ti = mode of travel used by the ith respondent; ATi = types of accommodation used by the ith respondent; and LSi = satisfaction of the ith respondent.
The regression analysis outcomes reveal several significant factors that positively influence the per capita expenditure incurred by the sample tourists in the study area. Gender, area of residence, travel distance, mode of transport and overall satisfaction are all factors that contribute to variations in spending patterns among tourists visiting the study area (Table 7).
Estimated Results of the Simple Linear Regression Equation (1).

Satisfaction Level of the Sample Tourists
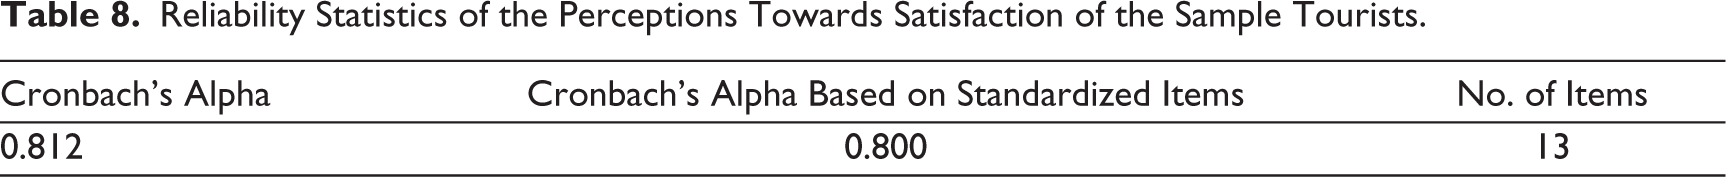
Cronbach’s alpha coefficients were computed to assess the internal consistency and reliability of the measurement scale consisting of five constructs within this study. The resulting coefficient was 0.812, 7reflecting the reliability of the 13 selected satisfaction factors in the study area (Table 8).
Reliability Statistics of the Perceptions Towards Satisfaction of the Sample Tourists.
In order to attract tourists at a specific tourism destination, it is very important to ensure the required and desired services to the tourists, and that too up to their level of satisfaction. The required and desired services of the tourists coming to this tourist area are as follows: (a) state of archaeological interest, (b) transportation service, (c) food and beverages, (d) accommodation service, (e) attitude of local people, (f) cleanliness, (g) general price level, (h) information regarding tourism sites, (i) market facilities, (j) sanitation and drinking water facilities, (k) health/medical facilities, (l) safety and security, and (m) tourist guide. To assess the levels of satisfaction of sample tourists, a five-point scale analytical tool has been used. Five-point scales considered here are as follows: (a) very bad, (b) bad, (c) moderate, (d) good and (e) very good. Opinions of the sample tourists regarding the level of satisfaction from different required and desired services have been presented in Table 9.
Required and Desire Service-wise Satisfaction Level of the Sample Tourists.

Numbers in the bracket is the percentage of the sample respondents.
The opinions of the sampled tourists regarding their level of satisfaction reveal several key insights. Notably, the tourists reported the highest level of satisfaction with the archaeological attractions at the tourism sites, with a mean satisfaction score of 4.837. Following closely, the second-highest mean satisfaction score was attributed to the availability of information about tourist sites, with a score of 4.600. In the third position was the attitude of local people, which received a mean satisfaction score of 4.585, and in fourth place was accommodation service, with a mean score of 4.496. Conversely, the calculated mean values indicate that the sample tourists expressed the lowest levels of satisfaction with sanitation and drinking water, with a mean satisfaction score of 3.911. These findings hold significant importance when it comes to formulating policies and strategies for the development of tourism in the study area (refer to Table 12 for details).
A t-test was conducted to measure the sample tourists’ agreement or disagreement towards the required and desired service and facility-wise satisfaction level in the study area. Thirteen satisfaction factors were considered in this regard. Since there are 13 satisfaction factors, and it is a 5-point Likert scale, the maximum score in favour of satisfaction is 65 and the minimum score is 13. The centre value or test value is 39 (t value obtained as 41.533 with degrees of freedom 134). The total score is 7,686 (Table 12) and the mean value is 57.8148 (with standard deviation 5.26348 and standard error 0.45301). Here, mean value is higher than the centre or test value. Therefore, it can be concluded that the satisfaction level of the sample tourists’ in favour of required and desired service and facilities of the study area were very strong. The result of the t-test is presented in Table 10.
t-Test for Overall Satisfaction of the Sample Tourists.

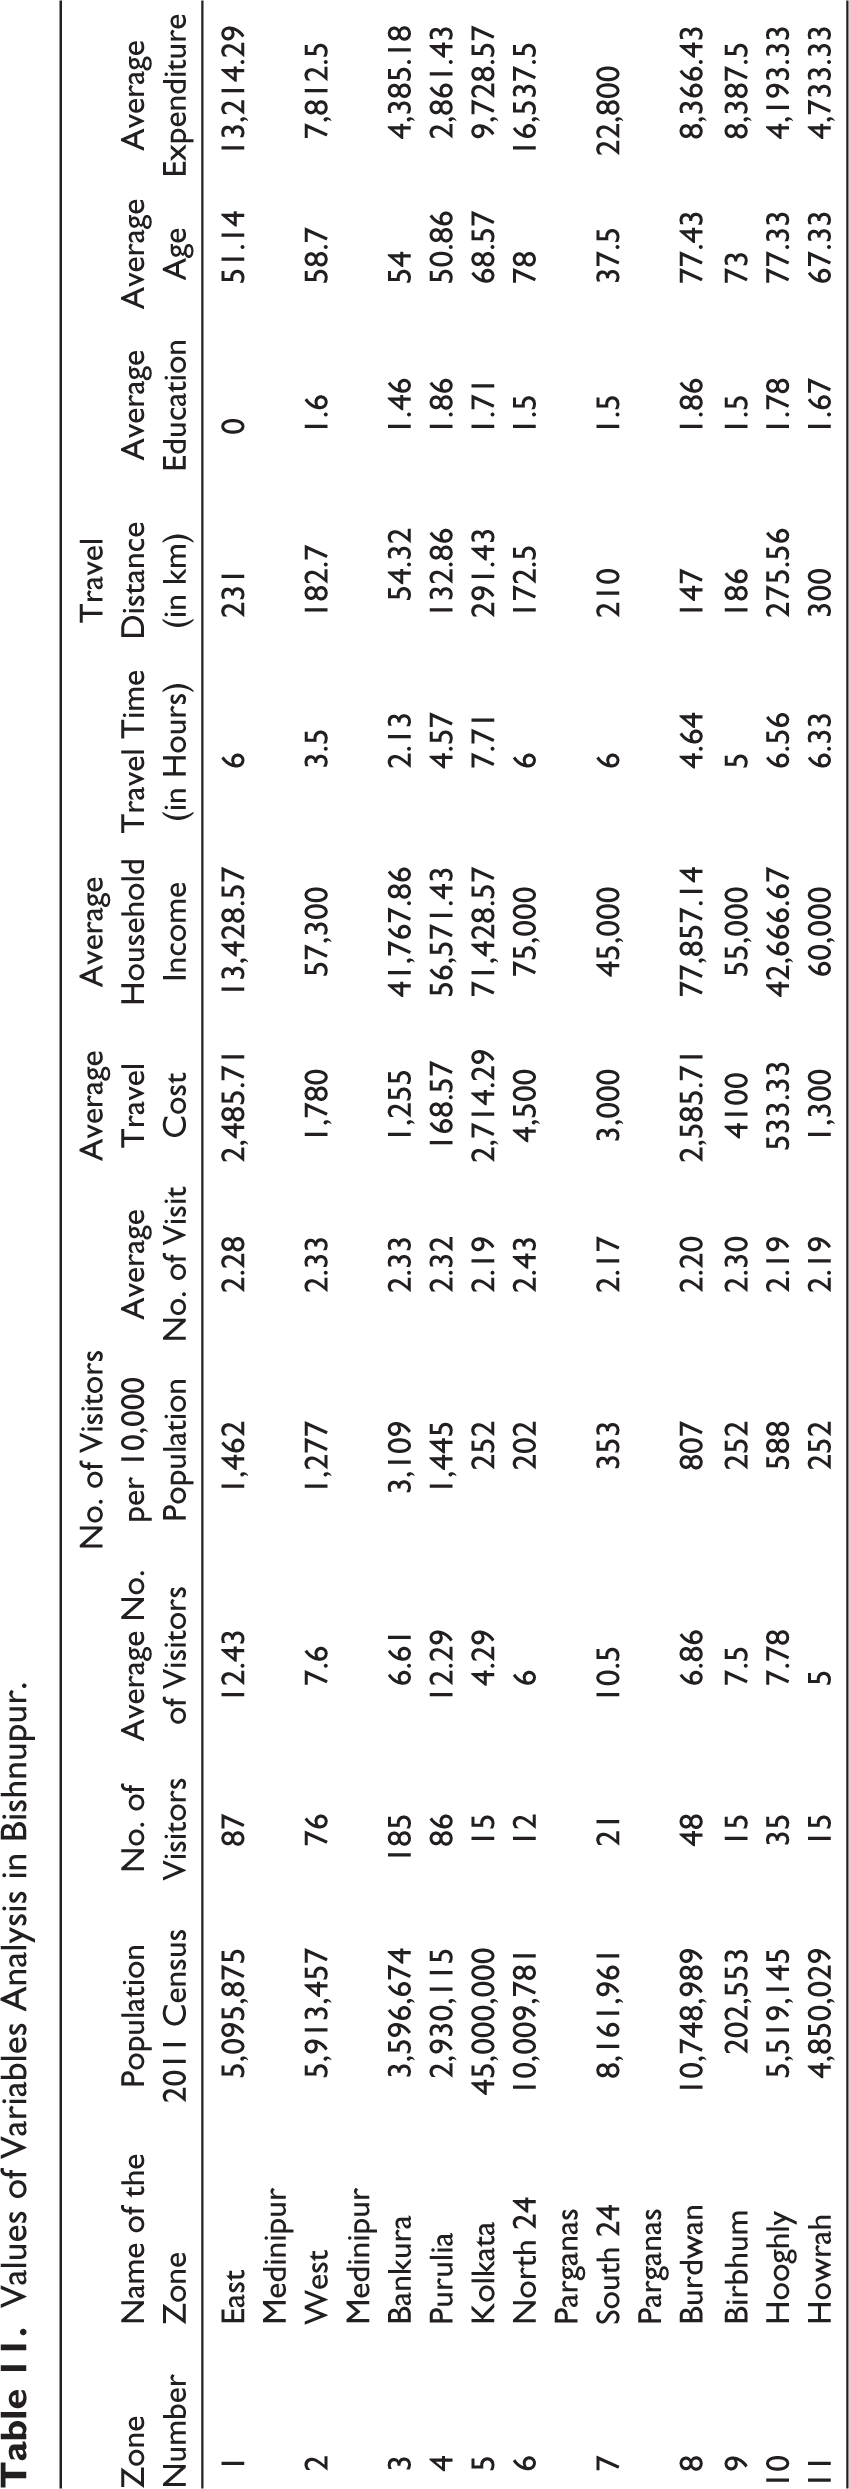
Values of Variables Analysis in Bishnupur.
Estimation of Recreational Value of the Study Site
Cultural capital, closely intertwined with cultural heritage, plays a pivotal role in fostering economic benefits within local areas. Cultural heritage sites have the potential to generate a stream of products and services, thus contributing to economic advantages in their respective regions. The assessment of the recreational value associated with the archaeological heritage town of Bishnupur is presented in Table 11. This table incorporates various variables derived from visitor questionnaires, categorized by the visitors’ places of origin. These variables encompass the number of visitors per 10,000 population, the average number of visitors, the mean travel expenditure, the average monthly income, the mean level of education and the average age of visitors.
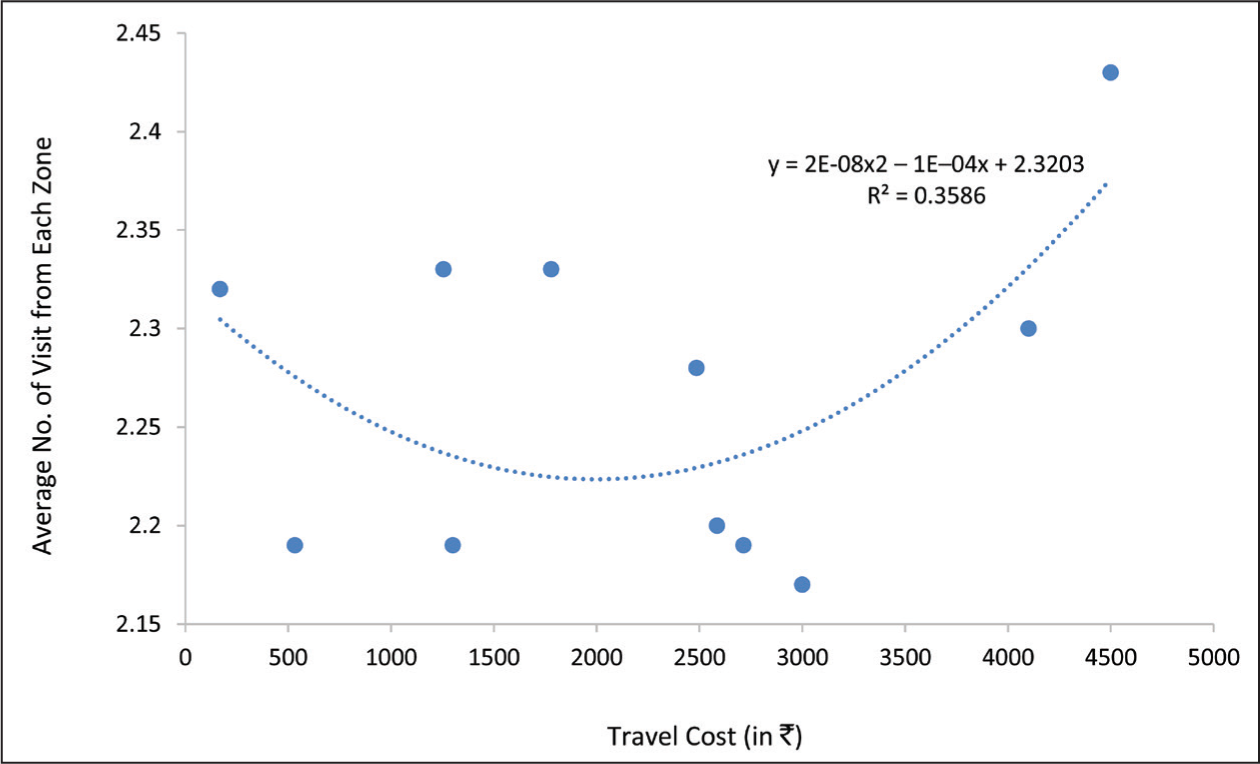
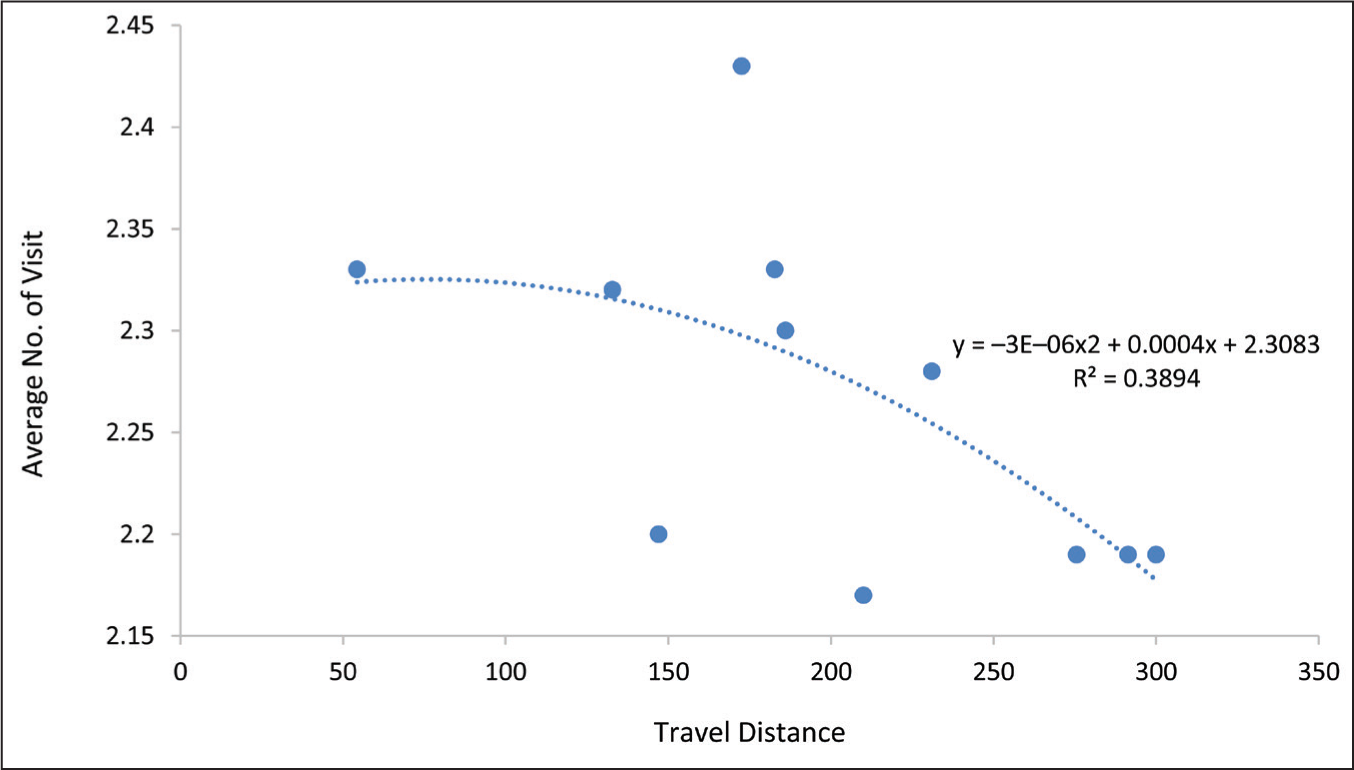
The recreational value of Bishnupur was determined through the utilization of a demand function, which takes into account the aforementioned variables. This approach allows for a comprehensive understanding of how cultural heritage sites like Bishnupur’s archaeological heritage contribute to the recreational experiences and economic contributions of the area. Furthermore, the graphical representation of the recreational demand curve for Bishnupur’s archaeological heritage is depicted in both Figures 4 and 5. These figures provide a visual depiction of the relationship between various factors, such as visitor origin, TC, income, education, age and the demand for recreational experiences at Bishnupur’s archaeological heritage site. Analyzing these demand curves can offer valuable insights into the preferences and behaviours of visitors, aiding in the development of strategies to enhance the economic benefits derived from this cultural capital.
Polynomial Relationship Between Travel Cost and Average Number of Visit.
Polynomial Relationship Between Travel Distance and Average Number of Visit.
WTP of the Sample Tourists
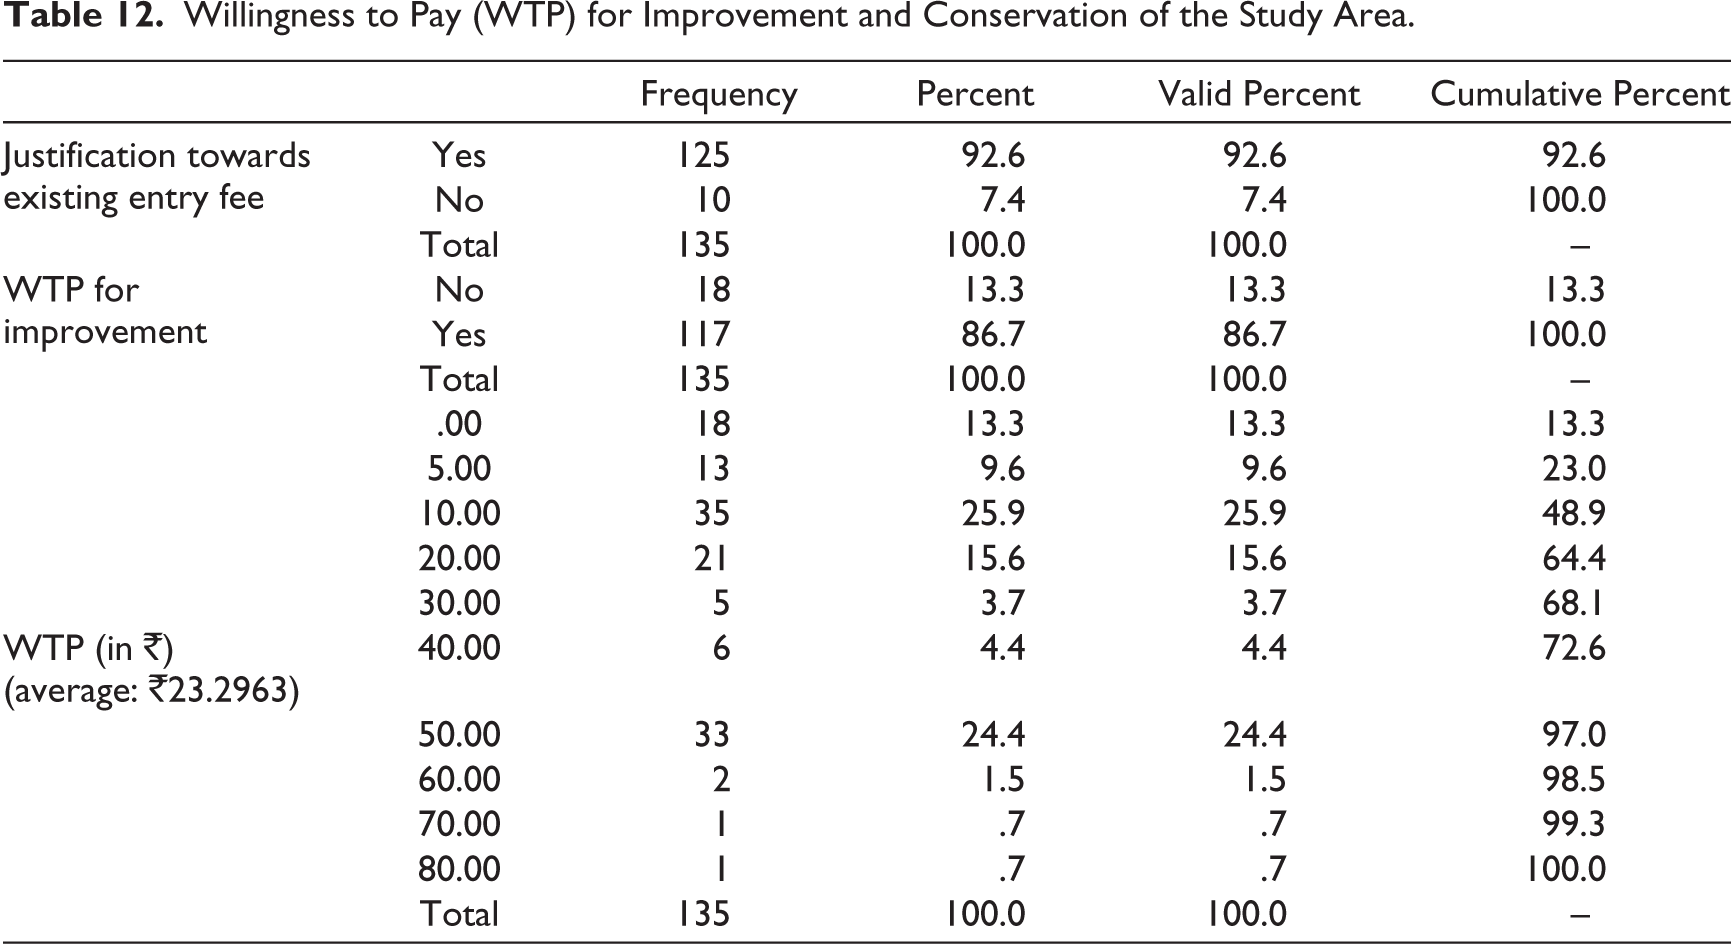
Among the surveyed sample tourists, a substantial 92.6% expressed agreement with the existing entrance fees required for visiting the study sites, highlighting a general consensus regarding the fee’s justification. Additionally, a significant portion, specifically 86.7% of the sample tourists, indicated their willingness to contribute financially towards the enhancement and conservation of these study sites. To delve further into their WTP for such improvements and conservation efforts, respondents were asked about the amount they would be willing to pay as an entrance fee. The results reveal an interesting distribution: 51.5% of the sample visitors were open to paying up to 20 Indian rupees, indicating a preference for lower fee amounts. As the fee amount increased, the frequency of agreement decreased, with only 24.4% of respondents agreeing to pay ₹50.00. A relatively smaller fraction, 13.3% of the sample tourists, showed no interest in paying extra fees to access the study sites. On average, the surveyed tourists demonstrated a willingness to contribute slightly more than ₹23.00 for the betterment and preservation of the study sites. This finding underscores the importance of recognizing visitor perspectives and their financial commitment to supporting the sustainability and conservation of these valuable cultural and recreational assets (Table 12).
Willingness to Pay (WTP) for Improvement and Conservation of the Study Area.
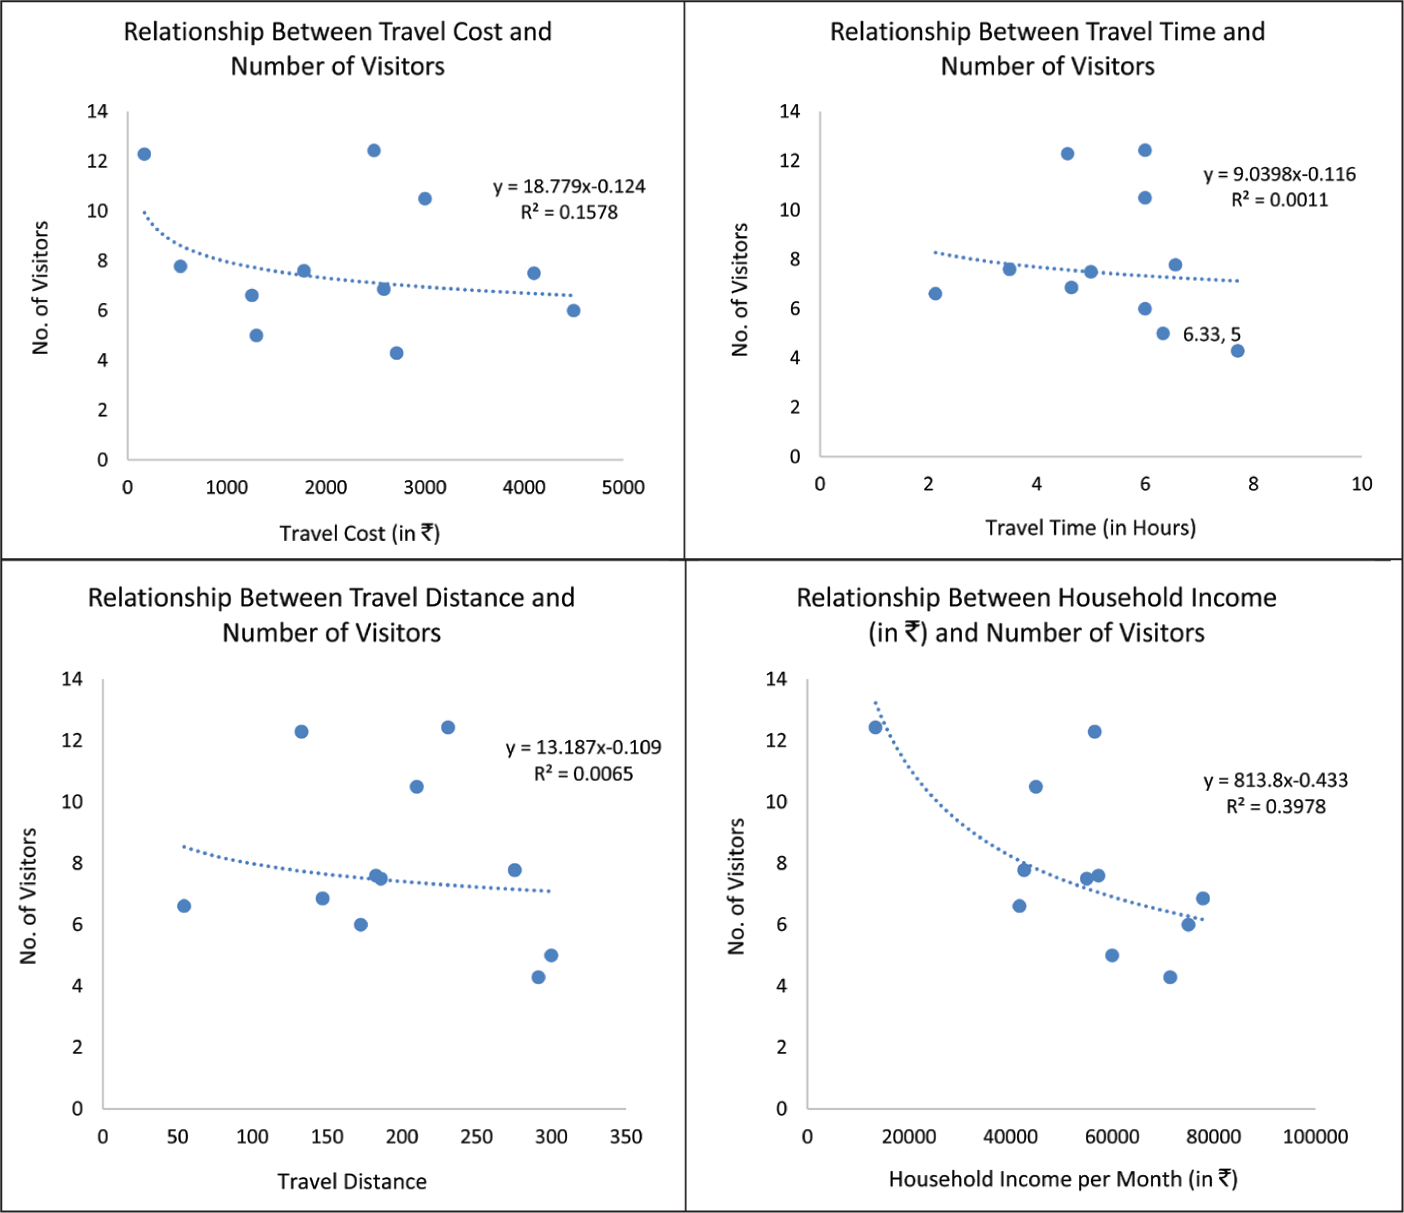
The relationship among the TC, travel distance, travel time, household income and number of visitors from each zone is depicted in Figure 6.
Relationship Among the Travel Cost, Travel Distance, Travel Time, Household Income and Number of Visitors from Each Zone.
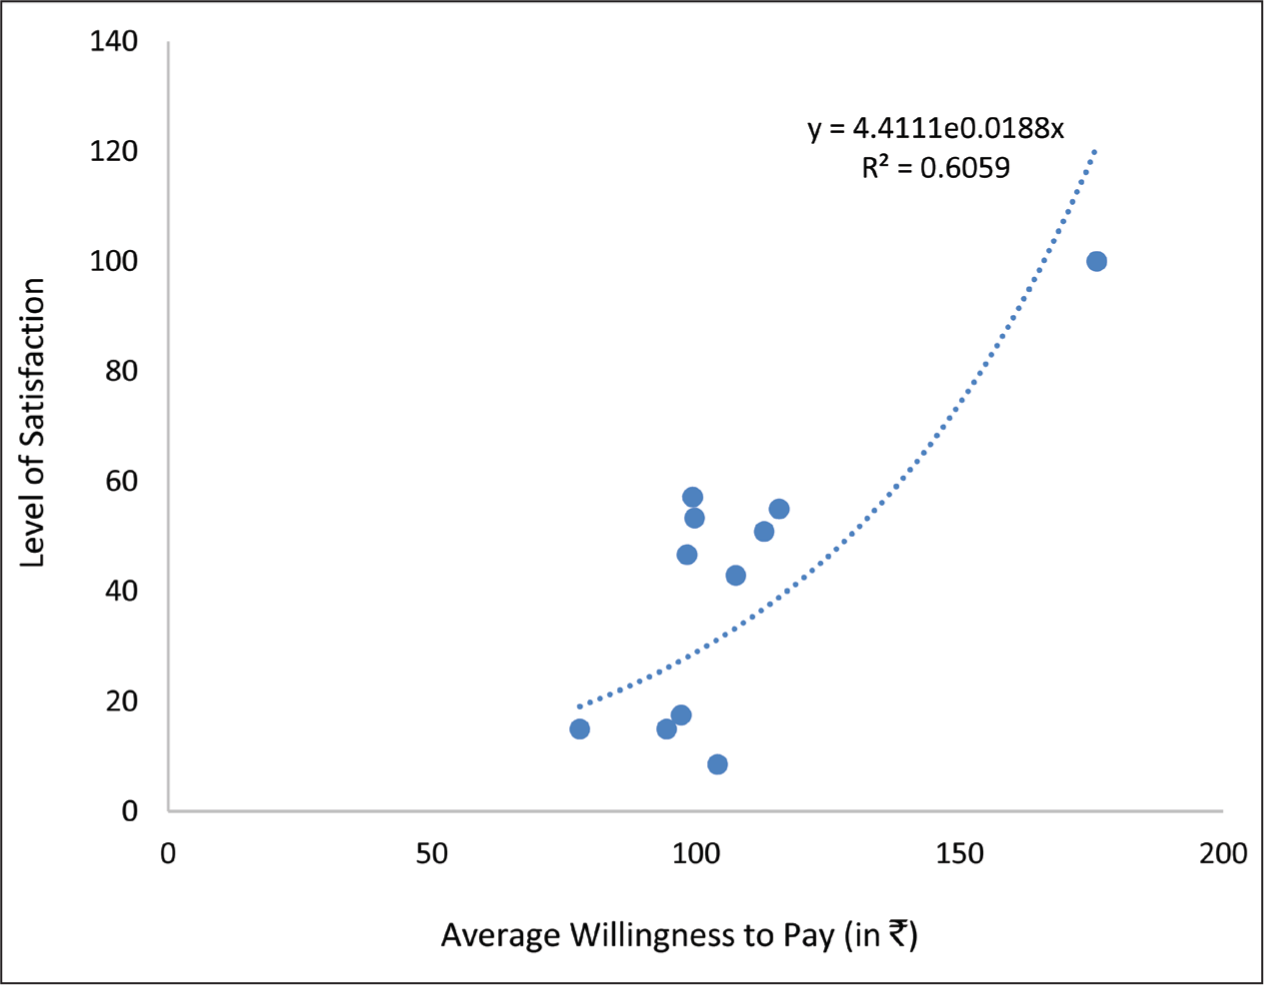
The socio-demographic profile and visitation characteristics of the surveyed sample tourists played a pivotal role in influencing their WTP for the continued development and conservation of the study area. To investigate this relationship, a Simple Linear Regression model was employed, shedding light on the key factors at play. The analysis yielded a noteworthy finding: a statistically significant positive correlation was observed between the satisfaction level of the sample tourists and their WTP for the enhancement and preservation of the study area. In practical terms, this implies that as the satisfaction level of tourists increases, there is a corresponding increase in their likelihood of being willing to financially contribute to the development and conservation efforts. This insight underscores the importance of not only preserving the cultural and recreational aspects of the study area but also ensuring that tourists’ experiences are positive and satisfying. Such satisfaction not only enhances their enjoyment but also motivates them to actively participate in the conservation and improvement of these cherished sites, thus fostering their long-term sustainability (Table 13).
The average WTP along with the relationship with satisfaction level of the sample tourists from each zone is depicted in Figure 7.
Estimated Results of the Simple Linear Regression Equation (2).

Average Willingness to Pay Along with the Relationship with Satisfaction Level of the Sample Tourists from Each Zone.
Discussions
The aim of this research endeavour was to assess the recreational value associated with the Bishnupur temple town located in the state of West Bengal. In order to estimate the economic worth, specifically in terms of the recreational advantages offered by the study sites, the TCM was employed. TCM operates under the premise that the expenses incurred for travelling to a recreational destination serve as the equivalent of the access fee to that particular site. To determine people’s WTP for a visit to the site, this method relies on evaluating the number of trips individuals undertake at varying TCs. This approach is often referred to as a ‘revealed preference technique’ as it unveils the WTP through an analysis of visitor consumption patterns (Environmental Justice Organizations, 2013). It is essential to emphasize that TCM necessitates the availability of precise data concerning TCs, encompassing factors such as distance-related expenses and the costs associated with travel time. Additionally, it requires an understanding of the amount of time visitors are willing to allocate for both their journey to and their stay at the recreational site (Enyew, 2003).
Engaging in recreational activities constitutes a human pursuit that enhances the satisfaction and well-being of visitors. The demand for outdoor recreation has been on the rise in several developing nations, a trend driven by factors like population growth, increased income and improved mobility (Clawson, 1959). The non-monetary worth of a recreational site is reflected in the consumer surplus derived from the estimated demand function. The fundamental principle of the TCM is rooted in the notion that the time and financial expenditures individuals invest in visiting a particular site effectively serve as the ‘price’ of gaining access to that site (Bigirwa et al., 2021; Mayer & Woltering, 2018; Soe Zin et al., 2019).
Consequently, the WTP of people for a visit to the site can be gauged by assessing the number of trips they undertake at varying TCs. This is akin to determining people’s WTP for a marketed product based on the quantity demanded at different price points. In order to underscore the significance of implementing tourism development plans in recreational sites, it becomes imperative to estimate the benefits these sites offer (Limaei et al., 2017; Nandagiri, 2015). It is worth noting that a notable proportion of the study’s visitors possessed a higher level of education. This outcome may suggest that a higher educational background plays a pivotal role in attracting and retaining attention towards recreational sites. Additionally, the findings of this study underscore the impact of various variables such as the time required to access heritage sites, TCs, monthly income, age, education and overall satisfaction levels on the utilization of the archaeological heritage town of Bishnupur in West Bengal.
Key findings from our research have revealed that popular tourist sites such as Rasmancha and Jorebangla Temples attract visitors primarily driven by their archaeological interests and leisure pursuits (Besculides et al., 2002). These temples often captivate tourists due to their unique architectural styles, religious significance and historical importance, making them compelling destinations for individuals interested in history and archaeology (Holtorf, 2016; Shunnaq et al., 2008). Moreover, these temples hold cultural and religious significance, not only for tourists but also for the local population. Visitors may come to partake in religious ceremonies, festivals or simply to immerse themselves in the cultural ambiance of the area. This cultural connection serves as a significant motivator for tourists to explore these sites as mentioned in previous studies (Gilmore, 2010; Neuhofer et al., 2020; Smith, 2015; Wilks & Quinn, 2016). In addition to historical and cultural interests, Rasmancha and Jorebangla Temples also attract tourists seeking leisure and recreation opportunities. The serene and picturesque surroundings of these sites make them alluring destinations for relaxation and enjoyment. Positive feedback and recommendations from previous visitors, whether conveyed through word-of-mouth or shared on online platforms such as travel websites and social media, play a substantial role in influencing tourists’ decisions. It is likely that the growing popularity of these sites can be attributed to the positive reviews and recommendations, drawing more tourists to visit (Besculides et al., 2002).
The tourists’ willingness to contribute an average of ₹23.00 towards the development and upkeep of the area signifies their recognition of the value these sites bring to the community and their eagerness to endorse their preservation. Visitors’ willingness to spend time and money to reach the area can indicate the perceived value of the destination (An et al., 2019; Chang et al., 2014; Lo & Lee, 2011; Pandža Bajs, 2015). It can also highlight potential barriers that might deter some segments of the population from visiting, which could inform strategies to improve accessibility and reduce barriers. Tourists often express their appreciation for well-maintained and easily accessible attractions by demonstrating a willingness to provide financial support for their continuous maintenance (McConell & Strand, 1981; Murzyn-Kupisz, 2013; Talal & Santelmann, 2020). Visitor satisfaction emerged as a pivotal factor influencing their readiness to financially support the conservation of the study sites. Those who expressed higher satisfaction with local services and amenities were more inclined to endorse conservation initiatives. Visitor satisfaction with local services and facilities can exert a substantial impact on their willingness to contribute to the conservation of study sites, driven by the perceived value, positive experiences, trust and sense of responsibility it fosters (Kim & Park, 2017; Stoleriu et al., 2019; Yung & Chan, 2015; Zhang et al., 2023). This underscores the positive rapport between visitors and the site, which, in turn, can translate into robust support for endeavours aimed at preserving and nurturing these invaluable locations.
The outcomes and techniques of this research offer practical guidance for local authorities and stakeholders to improve the appeal of Bishnupur, preserve its cultural heritage and stimulate the local economy. This approach harmonizes tourism development with the preferences of visitors and the imperative for environmental conservation. It provides a blueprint for the enhancement of Bishnupur and can serve as a model for other heritage sites aiming for similar advancements. The research has employed economic valuation methods to pinpoint the aspects of the town that tourists value the most. This information is highly valuable for local authorities and tourism planners as it enables them to allocate resources more efficiently. By focusing on preserving and promoting the specific temples, cultural events or attractions that are most cherished by tourists, resources can be channelled effectively. For instance, if the research reveals that a particular temple is a significant attraction, efforts and funding can be directed towards its restoration and maintenance, as suggested in prior studies (Emerton et al., 2006; Larson & Poudyal, 2012; Leung et al., 2018; McKercher & Du Cros, 2002; Mabulla, 2000; Navrud & Ready, 2002; Peters, 1998; Wells, 1993).
The study has highlighted factors that significantly influence visitor satisfaction, such as transportation, accommodation and cleanliness. Armed with this knowledge, local authorities can prioritize infrastructure development. This might involve improving road access, enhancing the quality of accommodation options and maintaining clean public spaces. These improvements can make the town more attractive to tourists. By assessing tourists’ WTP entrance fees and support conservation efforts, the research offers insights into funding conservation initiatives. The revenue generated from entrance fees can be reinvested in preserving and protecting the historical and natural assets of the town (Eagles, 2002; Ferraro, 2002; Sims, 2010). This ensures that the site remains attractive to future generations of visitors.
The insights gained from the study regarding tourists’ motivations and preferences can serve as a valuable resource for shaping effective marketing strategies. These strategies can be customized to resonate with the identified preferences, thereby attracting a wider spectrum of visitors. For example, if cultural heritage emerges as a significant attraction, marketing campaigns can spotlight the town’s rich history and heritage (Chhabra, 2010; Kolb, 2006; McIntosh & Prentice, 2017; Meyer, 2004; Sautter & Leisen, 1999; Timothy, 2011). Tourism has the potential to generate economic benefits for the local community by creating job opportunities and fostering entrepreneurial endeavours. The research underscores the significance of community involvement in this context (Altinay et al., 2016; Bacq et al., 2022; Chakim, 2023; Moyo & Tichaawa, 2017; Nicholas et al., 2009; Susila et al., 2023). Local authorities can spearhead community-based tourism initiatives that empower residents and facilitate cultural exchanges, ensuring that the local community reaps the rewards of tourism. Furthermore, the research places a strong emphasis on the importance of sustainable tourism practices (McIntyre, 1993). By prioritizing visitor satisfaction and their willingness to invest in enhancements, the study advocates for the development of eco-friendly tourism initiatives. These initiatives not only safeguard the environment but also ensure the long-term sustainability of the site.
On a national level, these findings hold significant relevance for India’s heritage tourism sector. They provide a framework for assessing the economic impact of cultural destinations, aiding policymakers in making informed decisions about sustainable tourism development. The research can serve as a model for evaluating other heritage sites across the country, contributing to the preservation of India’s rich cultural heritage. Internationally, this study advances the field of heritage tourism valuation. It demonstrates the applicability of TCM and other analytical tools in assessing the economic and recreational value of heritage sites. Other countries can draw from this research to evaluate their own cultural attractions, promoting responsible tourism and heritage conservation.
Conclusion
The expedition into Bishnupur Temple Town, guided by the TCM, has unearthed the hidden economic and cultural treasures within its historic confines. As the final brushstrokes were applied to this captivating canvas, a vivid portrait of this remarkable destination came into focus. First and foremost, the heart of Bishnupur’s allure has been revealed. The Rasmancha and Jorebangla Temples, standing as guardians of history and culture, emerged as the foremost attractions, drawing both history enthusiasts and leisure seekers. These sacred and historical sites cast their spell, resonating with cultural significance and beckoning all who seek a glimpse of the past. Furthermore, our expedition has illuminated the profound connection between visitor satisfaction and their commitment to preserving this cultural gem. Satisfied visitors, akin to guardians of a cherished treasure trove, stand ready to contribute, both financially and emotionally, to the conservation and enhancement of this historical tapestry. Our quest began with a simple yet profound thesis: to assess the recreational value of Bishnupur Temple Town and, in doing so, unveil the key factors driving its economic and cultural vibrancy. The treasures we sought were not gold or jewels but insights into the essence of this unique destination. Our research, confined to a specific time frame and locale, offers a snapshot rather than a panoramic view of Bishnupur’s dynamic landscape. Future explorers may delve deeper, unearthing more gems.
Footnotes
Authors’ Contribution
The research conceptualization and design, as well as the field survey for primary data collection, were carried out by the corresponding author with the assistance of the co-authors. The primary data analysis for this study was also conducted by the corresponding author. Furthermore, all authors participated in editing and granting approval for the final manuscript.
Acknowledgements
The authors express their gratitude to Midnapore City College for their invaluable support in conducting this research. Special thanks are extended to our dedicated students, including Anikta Choudhury, Arpita Roy, Amrit Mahata, Abhik Ghosh, Amiruddin Seikh, Moumita Manna, Nabanita Das, Rajashree Pal, Rakhi Modak, Aparupa Khanra, Asima Mondal and Avijit Ghosh, who played a crucial role in gathering the necessary information. We also appreciate the cooperation of the sample respondents for providing us with the pertinent data. Furthermore, we extend our thanks to the anonymous reviewers for their insightful comments and suggestions, which have significantly enhanced the quality of this manuscript. Finally, our sincere appreciation goes to previous scholars who have contributed to similar studies in the field.
Declaration of Conflicting Interests
The authors declared no potential conflicts of interest with respect to the research, authorship and/or publication of this article.
Funding
The authors received no financial support for the research, authorship and/or publication of this article.