




Abstract
G protein–coupled receptors (GPCRs) are targets for designing a large fraction of the drugs in the pharmaceutical industry. For GPCR-targeting drug screening using cell-based assays, measurement of cytosolic calcium has been widely used to obtain dose–response profiles. However, it remains challenging to obtain drug-specific features due to cell-to-cell heterogeneity in drug–cell responses obtained from live cell imaging. Here, we present a framework combining live cell imaging of a cell population and a feature extraction method for classification of responses of drugs targeting GPCRs CXCR4 and α2AR. We measured the calcium dynamics using confocal microscopy and compared the responses for SDF-1α and norepinephrine. The results clearly show that the clustering patterns of responses for the two GPCRs are significantly different. Additionally, we show that different drugs targeting the same GPCR induce different calcium response signatures. We also implemented principal component analysis and k means for feature extraction and used nondominated (ND) sorting for ranking a group of drugs at various doses. The presented approach can be used to model a cell population as a mixture of subpopulations. It also offers specific advantages, such as higher spatial resolution, classification of responses, and ranking of drugs, potentially providing a platform for high-content drug screening.
Keywords
Introduction
It has been estimated that approximately 40% of the commercially available pharmaceutical drugs target G protein–coupled receptors (GPCRs). 1 Accordingly, quantification of GPCR-mediated live cell response is crucial for efficient drug screening. Specifically, it remains a challenge to identify the optimal drug and the corresponding drug dose based on GPCR-mediated responses from a cell population. Since calcium is a universal secondary messenger and plays a vital role in controlling cellular processes, including differentiation, proliferation, migration, and transcription, 2 quantification of cytosolic calcium can be used as a universal tool for screening the drugs for various diseases.3,4 Also, calcium encoding is a well-known mechanism that transfers the stimulus/drug effect and regulates various physiological processes. 5 Many complex disease conditions, such as Alzheimer’s disease, are linked to the dysregulation of the calcium response. 6
Cell-based drug screening assays have been used to measure calcium responses using fluorescent imaging plate reader (FLIPR).7–9 Recently, a high-throughput drug screening for Alzheimer’s disease has been proposed based on calcium imaging and dynamic response quantification. 4 Despite the popularity of calcium flux measurement for the screening of drugs, automated data analysis for a large volume of time-series data pertaining to various drug doses generated by high-resolution imaging still remains a challenge. In traditional drug screening studies with calcium imaging, quantification of cell responses is performed using population-average measurements.3,4 Generally, the dose–response curves obtained based on average measurement are fitted to the Hill equation and EC50 values are reported for comparing drug potency and efficacy. 10 However, single-cell studies may not provide typical sigmoidal curves similar to those obtained from population-based studies. 3 Further, construction of drug-specific dose responses becomes rather challenging, as the responses show high cell-to-cell variability. In contrast to the population mean, we leveraged the heterogeneity present in drug–cell responses and identified clustering patterns that can be used as the scoring parameter for ranking drugs.
Recent trends on drug classification are based on the assessment of cellular heterogeneity from immunofluorescent images. 11 Additionally, a density-based algorithm has been used to visualize the heterogeneity present in single-cell responses. 12 Generally, algorithms for analysis of cell responses incorporate cell response classification and feature analysis.11,13 Principal component analysis (PCA) and Gaussian mixture modeling (GMM) have been used to analyze high-resolution images from fixed cells, 11 and a combination of PCA and k-means classification have been used to automate the analysis of large-scale calcium imaging in neurons. 13 However, limited effort has been directed at implementing these techniques in drug screening and ranking.
Recent studies suggest that the variability in the system may inform classification of cell states.14,15 A major challenge is to correlate such cell states to the biological parameters that are relevant for the scoring and ranking of drugs. 16 As specific biological hypotheses and statistical properties of the system indicate the choice of data analysis tools, it remains challenging to identify a general algorithm that satisfactorily analyzes the time course of molecular response data for multiple drugs. On the other hand, picking a different tool to analyze data from each drug is also suboptimal. We addressed this by taking an engineering approach to identify tools that can be applied to a broad range of drugs.
Traditionally, the FLIPR assay is employed to measure calcium flux for quick identification of agonist and antagonist activities. This method is adaptable to a wide variety of cell receptor systems.7,9 However, this approach is associated with lower spatial resolution of cell responses, prone to nonspecific signals, and does not provide information regarding the ratio of nonresponding to responding cells. Furthermore, xCELLigence/multielectrode array (MEA) is a label-free technique based on measurement of membrane potential that can be used for real-time monitoring of cell viability. 17 However, fabrication of the microelectrodes used in this method is generally expensive, and placing cells in the close proximity to the electrodes remains challenging. 18 Therefore, the collection of responses at a single-cell level has been difficult. In this context, we employ multicell imaging using confocal microscopy and single-cell response analysis to achieve higher spatial resolution. Moreover, imaging combined with the classification of calcium response and drug ranking is proposed as a method for drug screening.
Here, we selected two endogenous GPCRs in HeLa cells for analysis, CXCR4 (chemokine receptor-4) and α2AR (α2 adrenergic receptor), both belonging to the Gαi-coupled GPCR family, 19 and pharmacological targets for neurodegenerative diseases. Specifically, we chose to compare two agonists, a peptide, stromal cell–derived factor-1α (SDF-1α), for the CXCR4 receptor, and a small molecule, norepinephrine, for α2AR. It has been reported that both SDF-1α and norepinephrine play a protective role in neural injury.20,21 Specifically, norepinephrine is a crucial neurotransmitter, and depletion of this molecule is associated with Alzheimer’s disease. 22 Since drug selection may demand the comparison of multiple chemotypes targeting the same GPCR, we used the calcium imaging assay to compare the performances of three other neuroprotective drugs that target α2AR: clonidine, tizanidine, and dexmeditomidine.21,23,24
To the best of our knowledge, limited investigations have been performed on Gαi pathway–mediated calcium responses and detailed quantification of the drug–cell interactions.25–27 The current work proposes an integrated framework for constructing clustering patterns and dose–response features from calcium responses. Here, we provide a detailed comparison of GPCR-targeting drugs based on calcium imaging using confocal microscopy, along with automated analysis of the resultant time-series responses. Finally, to provide a proof of concept for the feasibility of this technique for compound screening, we explored a small group of neuroprotective drugs that cover both Gαq- and Gαi-coupled receptors and ranked their performances as well.
Materials and Methods
Cell Culture
HeLa cells were cultured in Dulbecco’s modified Eagle’s medium (DMEM) (Cellgro, Manassas, VA) supplemented with 10% dialyzed fetal bovine serum (Atlanta Biologicals, Flowery Branch, GA) and antibiotics. HeLa cells were tested for mycoplasma contamination using MycoAlert PLUS Mycoplasma Detection Kit (Washington University Medical School, St. Louis, MO). Cells were seeded on 29 mm glass-bottom dishes (In Vitro Scientific, Sunnyvale, CA) at 0.2 × 10⁶ cells/mL and maintained in culture until 70%–80% confluency in a 37 °C and 5% CO2 incubator. Typically, the cells were cultured for 48 h before drug treatments. In order to have a cell population with similar properties and reproducible results, calculated amounts of cells were delivered to each of the imaging dishes.
Drug and Concentrations
Time-series data obtained from calcium imaging for a set of GPCR-targeting drugs were used in the analysis. SDF-1α (Sigma, St. Louis, MO; Cayman Chemical, Ann Arbor, MI) in Hank’s balanced salt solution (HBSS) was used to activate the CXCR4 receptor at different concentrations (1 –400 ng/mL). Also, histamine (0.001–1 µM) and endothelin (0.05–1 µM) (Sigma) were used to activate histamine and endothelin receptors respectively. A set of drugs having various chemotypes, namely, norepinephrine, tizanidine, clonidine, and dexmeditomidine (Sigma, Cayman Chemical), in HBSS were used to activate α2AR at different concentrations (0.1 µM–1 mM). For drug exposure, the dishes with cells were randomly selected in an unbiased manner.
Live Cell Imaging and Image Analysis
To obtain the time course of calcium responses, Hela cells were imaged on 29 mm glass-bottom dishes using Leica-Andor and Nikon-Andor spinning disc confocal imaging systems with an EM-CCD camera. Further, a 20× objective was used to perform calcium imaging (in HBSS; Invitrogen, Life Technologies, Grand Island, NY). Cells were loaded with the fluorescent dye Fluo-4 (2 μM; Molecular Probes, Life Technologies, Grand Island, NY; Ex, 488 nm; Em, 510 nm) for 30 min in HBSS. Then the cells were washed with HBSS three times (each time, 15 min incubation). Time-lapse imaging was performed every second before and after drug addition. Raw image data were analyzed with Andor IQ software to obtain the time course of fluorescence levels in single cells. The image background correction was done by subtracting background intensity. For each cell, cytosolic calcium increase was measured by quantifying the fold change of the fluorescence level of Fluo-4 with respect to the basal level. Further, at least 20% of the cells were required to respond (be activated) to elicit a response in a cell population.
Kernel Density Analysis and Hypothesis Testing
In order to find the probability distribution of different properties (maximum intensity of Fluo-4, time required to reach the peak intensity, and area under the curve [AUC]), we performed kernel density analysis. For comparison of cell populations at different drug doses, a nonparametric kernel density function was fitted using MATLAB (The Mathworks, Natick, MA). The data set for different properties was tested for normality using the Jarque–Bera test, and nonnormally distributed data were compared using the Kruskal–Wallis test in MATLAB (a p value of 0.05 was taken as statistically significant).
Classification of the Cells Using PCA and k-Means Analysis
Here, we used PCA to reduce the dimension of the matrix containing the time series of calcium concentration in a cell population containing ≥27 cells. Principal components (PCs) were calculated using eigenvalue decomposition of a data covariance matrix. For each drug dose, the raw data (time-series data for the cell population) were arranged in a vector of size 27 × 130 and PCA was used to reduce the dimensionality from 27 × 130 to 27 × 8 ( Suppl. Fig. S1 ). The final dimension was determined through the computation of the eigenvalues of the covariance matrix.
We used the k-means algorithm (an unsupervised clustering method) to classify the cells treated with SDF-1α and norepinephrine for a given number of clusters, k. After clustering of the cell responses, we calculated the percentages of cells P1, P2, and P3 corresponding to three clusters having three different centroids: (Camax,1, Tmax,1), (Camax,2, Tmax,2), and (Camax,3, Tmax,3).
Silhouette Plot: Cluster Validation and Determination of Cluster (k)
To validate the cluster analysis, we used a silhouette plot where silhouette values of each cell in its own cluster show how closely related they are to each other. 28 The silhouette value s(i) for the ith cell was calculated as follows:

where a(i) = average distance (Euclidian distance) of the ith cell from all other cells within the same cluster, and b(i) = lowest average distance (Euclidian distance) of the ith cell from any other cluster (the ith cell is not a member of this cluster).
To determine the number of clusters, k, we performed simulation of clustering for various k values (k = 2, 3, 4) ( Suppl. Figs. S2–S5 ). For each of the k values, the performance of the k-means classification is validated by the silhouette plot ( Suppl. Figs. S6 and S7 ). The Silhouette plot for the clustering corresponding to various k values shows that for k = 3, k-means clustering gives the clusters that are tightly grouped for SDF-1α.
Ranking of Drugs Using ND Sorting
Drug ranking was performed based on identification of the fraction of cells having relatively higher Camax and lower Tmax values by k-means clustering of normalized calcium response of all the drugs with different doses (representative clusters for all drugs are presented in Suppl. Fig. S8 ). In order to accomplish this task, we chose two of the three clusters for each cell response, where one belongs to cells with high Camax (red) and the other belongs to cells with high Tmax (cyan) ( Suppl. Fig. S8 ). The percentage of cells corresponding to the two clusters was calculated for each response, and then the drugs were ranked using nondominated (ND) sorting, 29 where our objective was to maximize the fraction of cells having higher Camax and minimize the fraction of cells having higher Tmax. The fractions having high Camax and high Tmax have a proportional relationship (an increase in one increases the other); the objective was to maximize one while minimizing the other. The complicated issue of optimizing several conflicting objectives was tackled using ND sorting, where each of these competitive drugs was compared with the others and sorted into several fronts, as indicated by ranks. It was not straightforward to identify a single drug and dose of optimal performance in this case, as the objectives were conflicting; hence, there exist multiple optimal solutions, called Pareto optimal solutions. The drugs with corresponding doses within the same front are ND in nature (each drug dose is better than the other, at least in terms of one objective), whereas at least one drug in the front dominates another drug from the remaining fronts. In this way, the drugs in front 1 show the best performance and equally compete. Based on the user’s preference between the objectives, any drug from front 1 can be chosen.
Results
Evaluation of Cell–Drug Interaction Using Live Cell Calcium Imaging
Live Cell Imaging Using Microscopy
First, we performed imaging of intracellular calcium of HeLa cells. In order to show that the assay is robust and generate similar signals on different days, we performed the assay for several days. Supplemental Figure S9 shows the plot for calcium response in HeLa cells for 100 µM norepinephrine on various days. The result shows that the responses are comparable on various days, and the ranges of Camax and Tmax are similar between the days.
Next, we identified the specific difference between the two drugs targeting different receptors with respect to their calcium signatures using short-time (130 s) live imaging.
Figure 1A
shows the time-lapse images of HeLa cells for SDF-1α for various doses: 1 ng/mL (
Fig. 1A
,

Confocal imaging of cytosolic calcium shows heterogeneity in the calcium response for Gαi-coupled GPCR-targeting drugs. (
In order to test the specificity and robustness of the assay, we also performed calcium imaging using confocal microscopy in the presence of an endogenous G protein g-subunit and in the presence of an overexpressed G protein g-subunit in HeLa cells ( Suppl. Fig. S10 ). The result shows that the Camax for the calcium response corresponding to the overexpressed G protein was found to be significantly different (p < 0.05, Kruskal–Wallis test) from that of the endogenous expression ( Suppl. Fig. S10 ). This suggests that the assay is sensitive to protein expression level and can be used to discriminate between endogenous and overexpressed conditions.
Comparison of Drugs Targeting Two Gαi-Coupled Receptors
Statistical Analysis of Camax, Tmax, and AUC
We performed a statistical analysis of the raw time-series data, and the results indicate that the two drugs, SDF-1α and norepinephrine, show significant variability in responses in regards to the maximum value of Fluo-4 intensity (Camax), the time corresponding to the maximum peak (Tmax), and the AUC ( Suppl. Table S1 ). Hence, we chose Camax, Tmax, and AUC as the drug scoring parameters (three-parameter output) for the calcium signals obtained from imaging. The box plot for these three parameters shows that the dose responses for the two drugs are different ( Fig. 2A , B ). It also shows that Camax and AUC are both higher for SDF-1α than for norepinephrine, whereas the range of Tmax values are comparable for the two drugs for the selected range of drug doses. But the variances in Camax, Tmax, and AUC indicate that the cell-to-cell variability is less for norepinephrine than for SDF-1α ( Suppl. Table S1 ). The kernel density function fitted to these parameters (Camax, Tmax, and AUC) at various drug doses indicates a similar trend ( Suppl. Figs. S11A–C and S11G-I ).
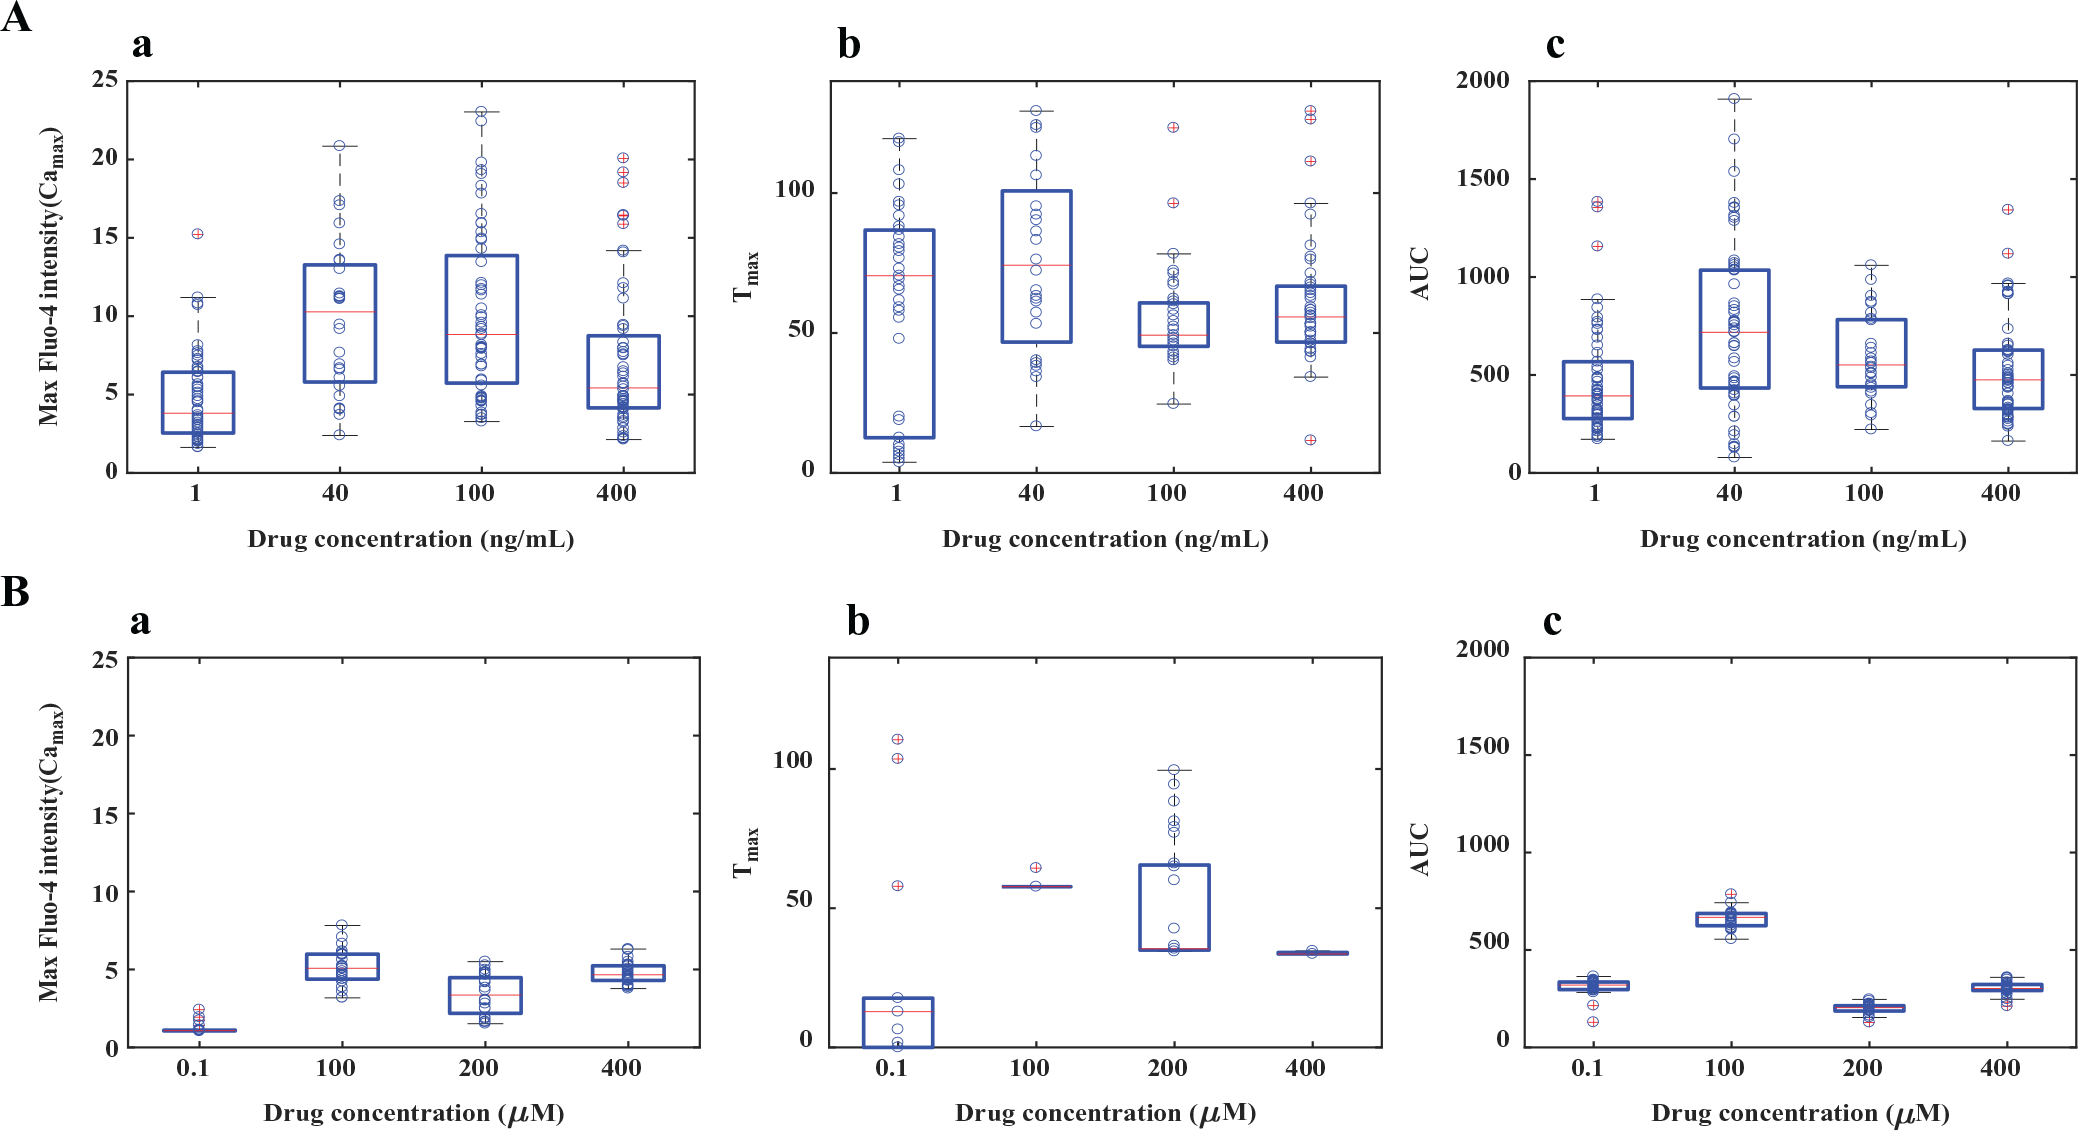
Comparison of calcium responses induced by drugs targeting two Gαi-coupled GPCRs. Box plot analysis was used to quantify and compare the calcium responses (with respect to Camax, Tmax, and AUC). (
Nonlinearity in Dose Responses
The mean for all the parameters, Camax, Tmax, and AUC, varied nonlinearly (the function may not be fitted to a Hill equation like a dose–response curve), with an increase in drug doses for both drugs ( Suppl. Figs. S11D–F and S11J-L , Fig. 2A , B ). For example, in the case of SDF-1α–CXCR4 interactions, the population mean shifts to a higher AUC with an increase in the drug dose (in the range of 1–400 ng/mL), followed by a decrease in AUC with a further increase in drug dose (in the range of 1–400 ng/mL) ( Suppl. Fig. S11F ). Additionally, the results show that the cell-to-cell variability is a function of drug dose, and the features of the variability in calcium responses are specific to the drug type ( Suppl. Fig. S11 ).
Comparison of the Drug Features: Clustering
Classification of Cells Based on Camax and Tmax: Comparison of Drugs Using Method I
We compared the two drugs with respect to the clustering pattern present in the cell population. The flowchart for the two clustering methods (Methods I and II) used here are shown in Figure 3 . For this, we performed classification of the population response for the two drugs based on the known parameters Camax and Tmax using k means. Each cell is represented through its Camax (x axis) and Tmax (y axis) values ( Fig. 4A , B ). The automated classification of SDF-1α- and norepinephrine-mediated responses indicates that the cell population can be presented as the mixture of subpopulations. The centroid of each subpopulation was shown (black x mark) to represent the average behavior in each cluster with various drug doses ( Fig. 4A , B ). However, the results clearly show that norepinephrine at 100 and 400 µM doses evokes a homogeneous response compared with SDF-1α at 100 and 400 ng/mL. Although we used k = 3 for comparison, the comparison of the two drugs with classification using k = 2 indicates similar conclusions ( Suppl. Fig. S2A,B ). Since automated classification is capable of differentiating between the two Gαi-coupled GPCR-targeting drugs, the technique can be used for scoring of drugs with respect to Camax and Tmax.
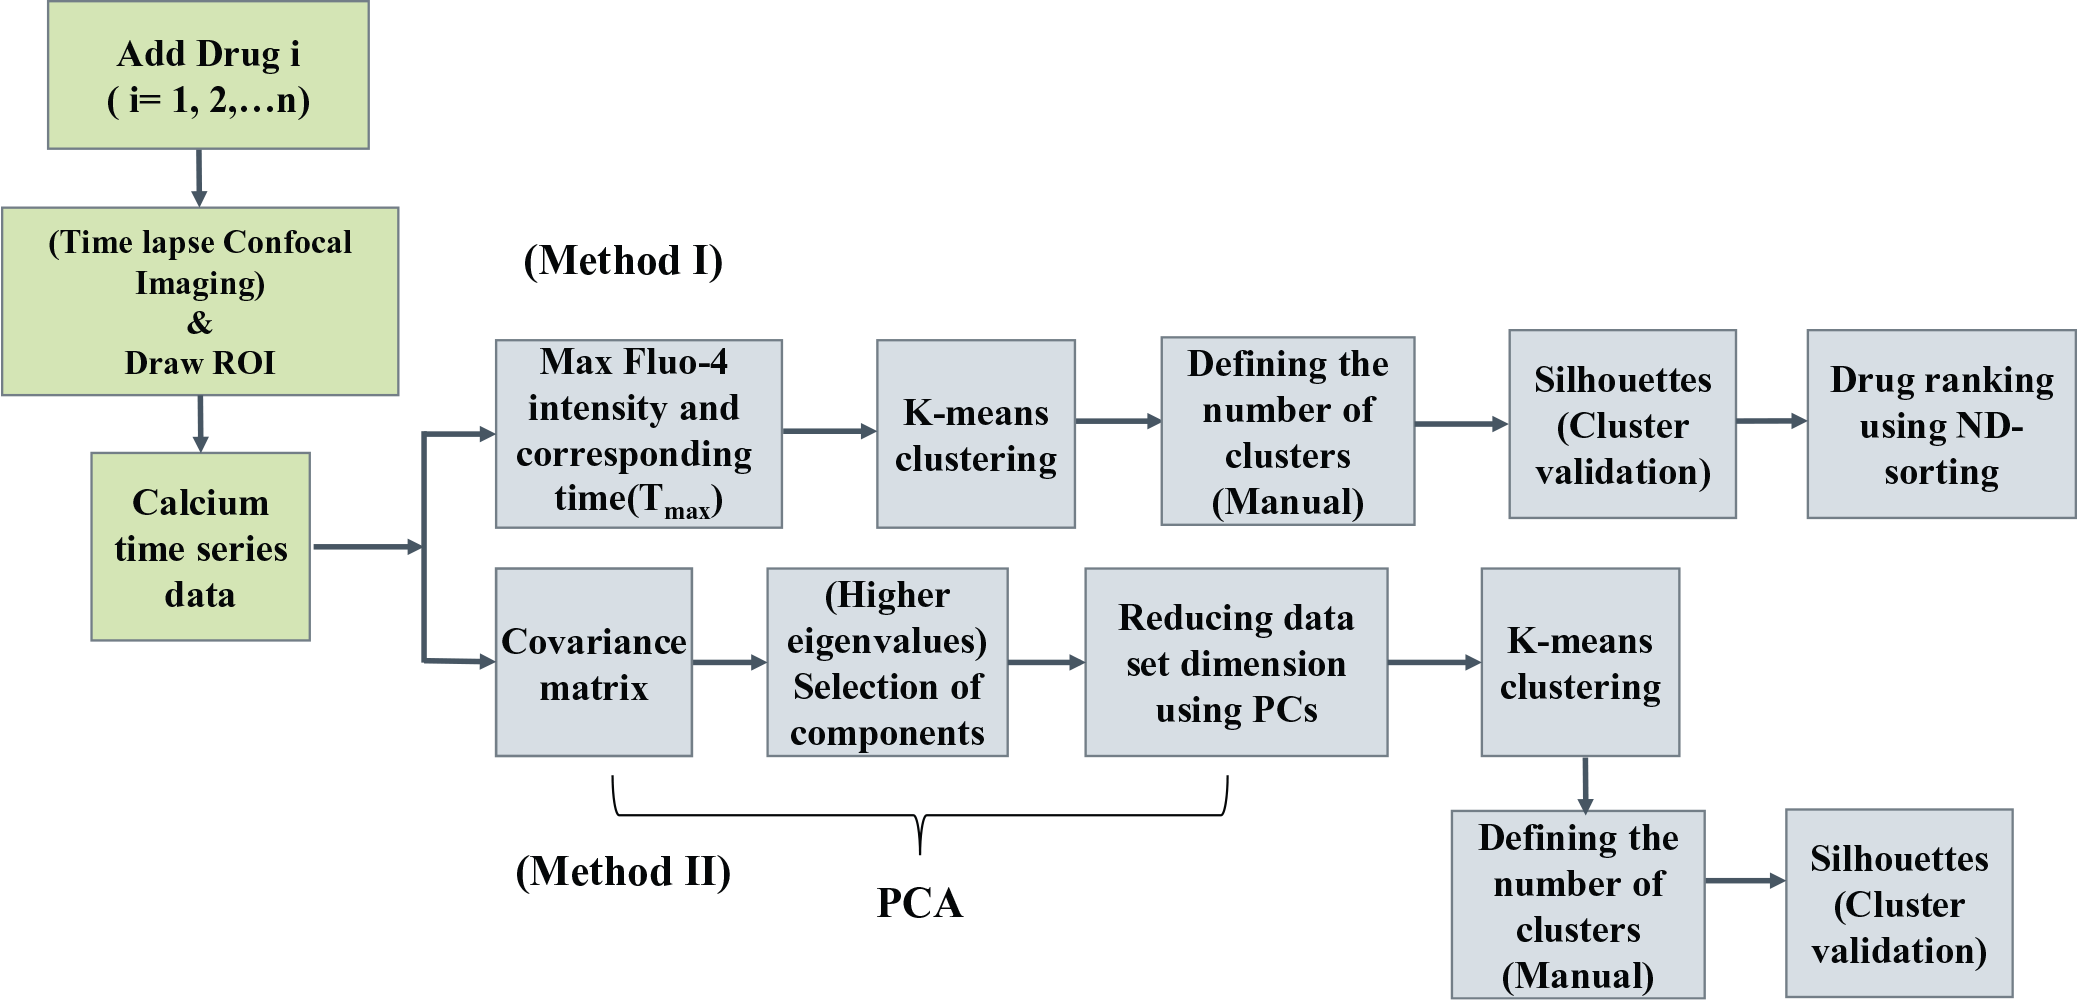
Schematic diagram representing an integrated platform for live cell calcium imaging using confocal microscopy, classification of calcium responses, and drug ranking.
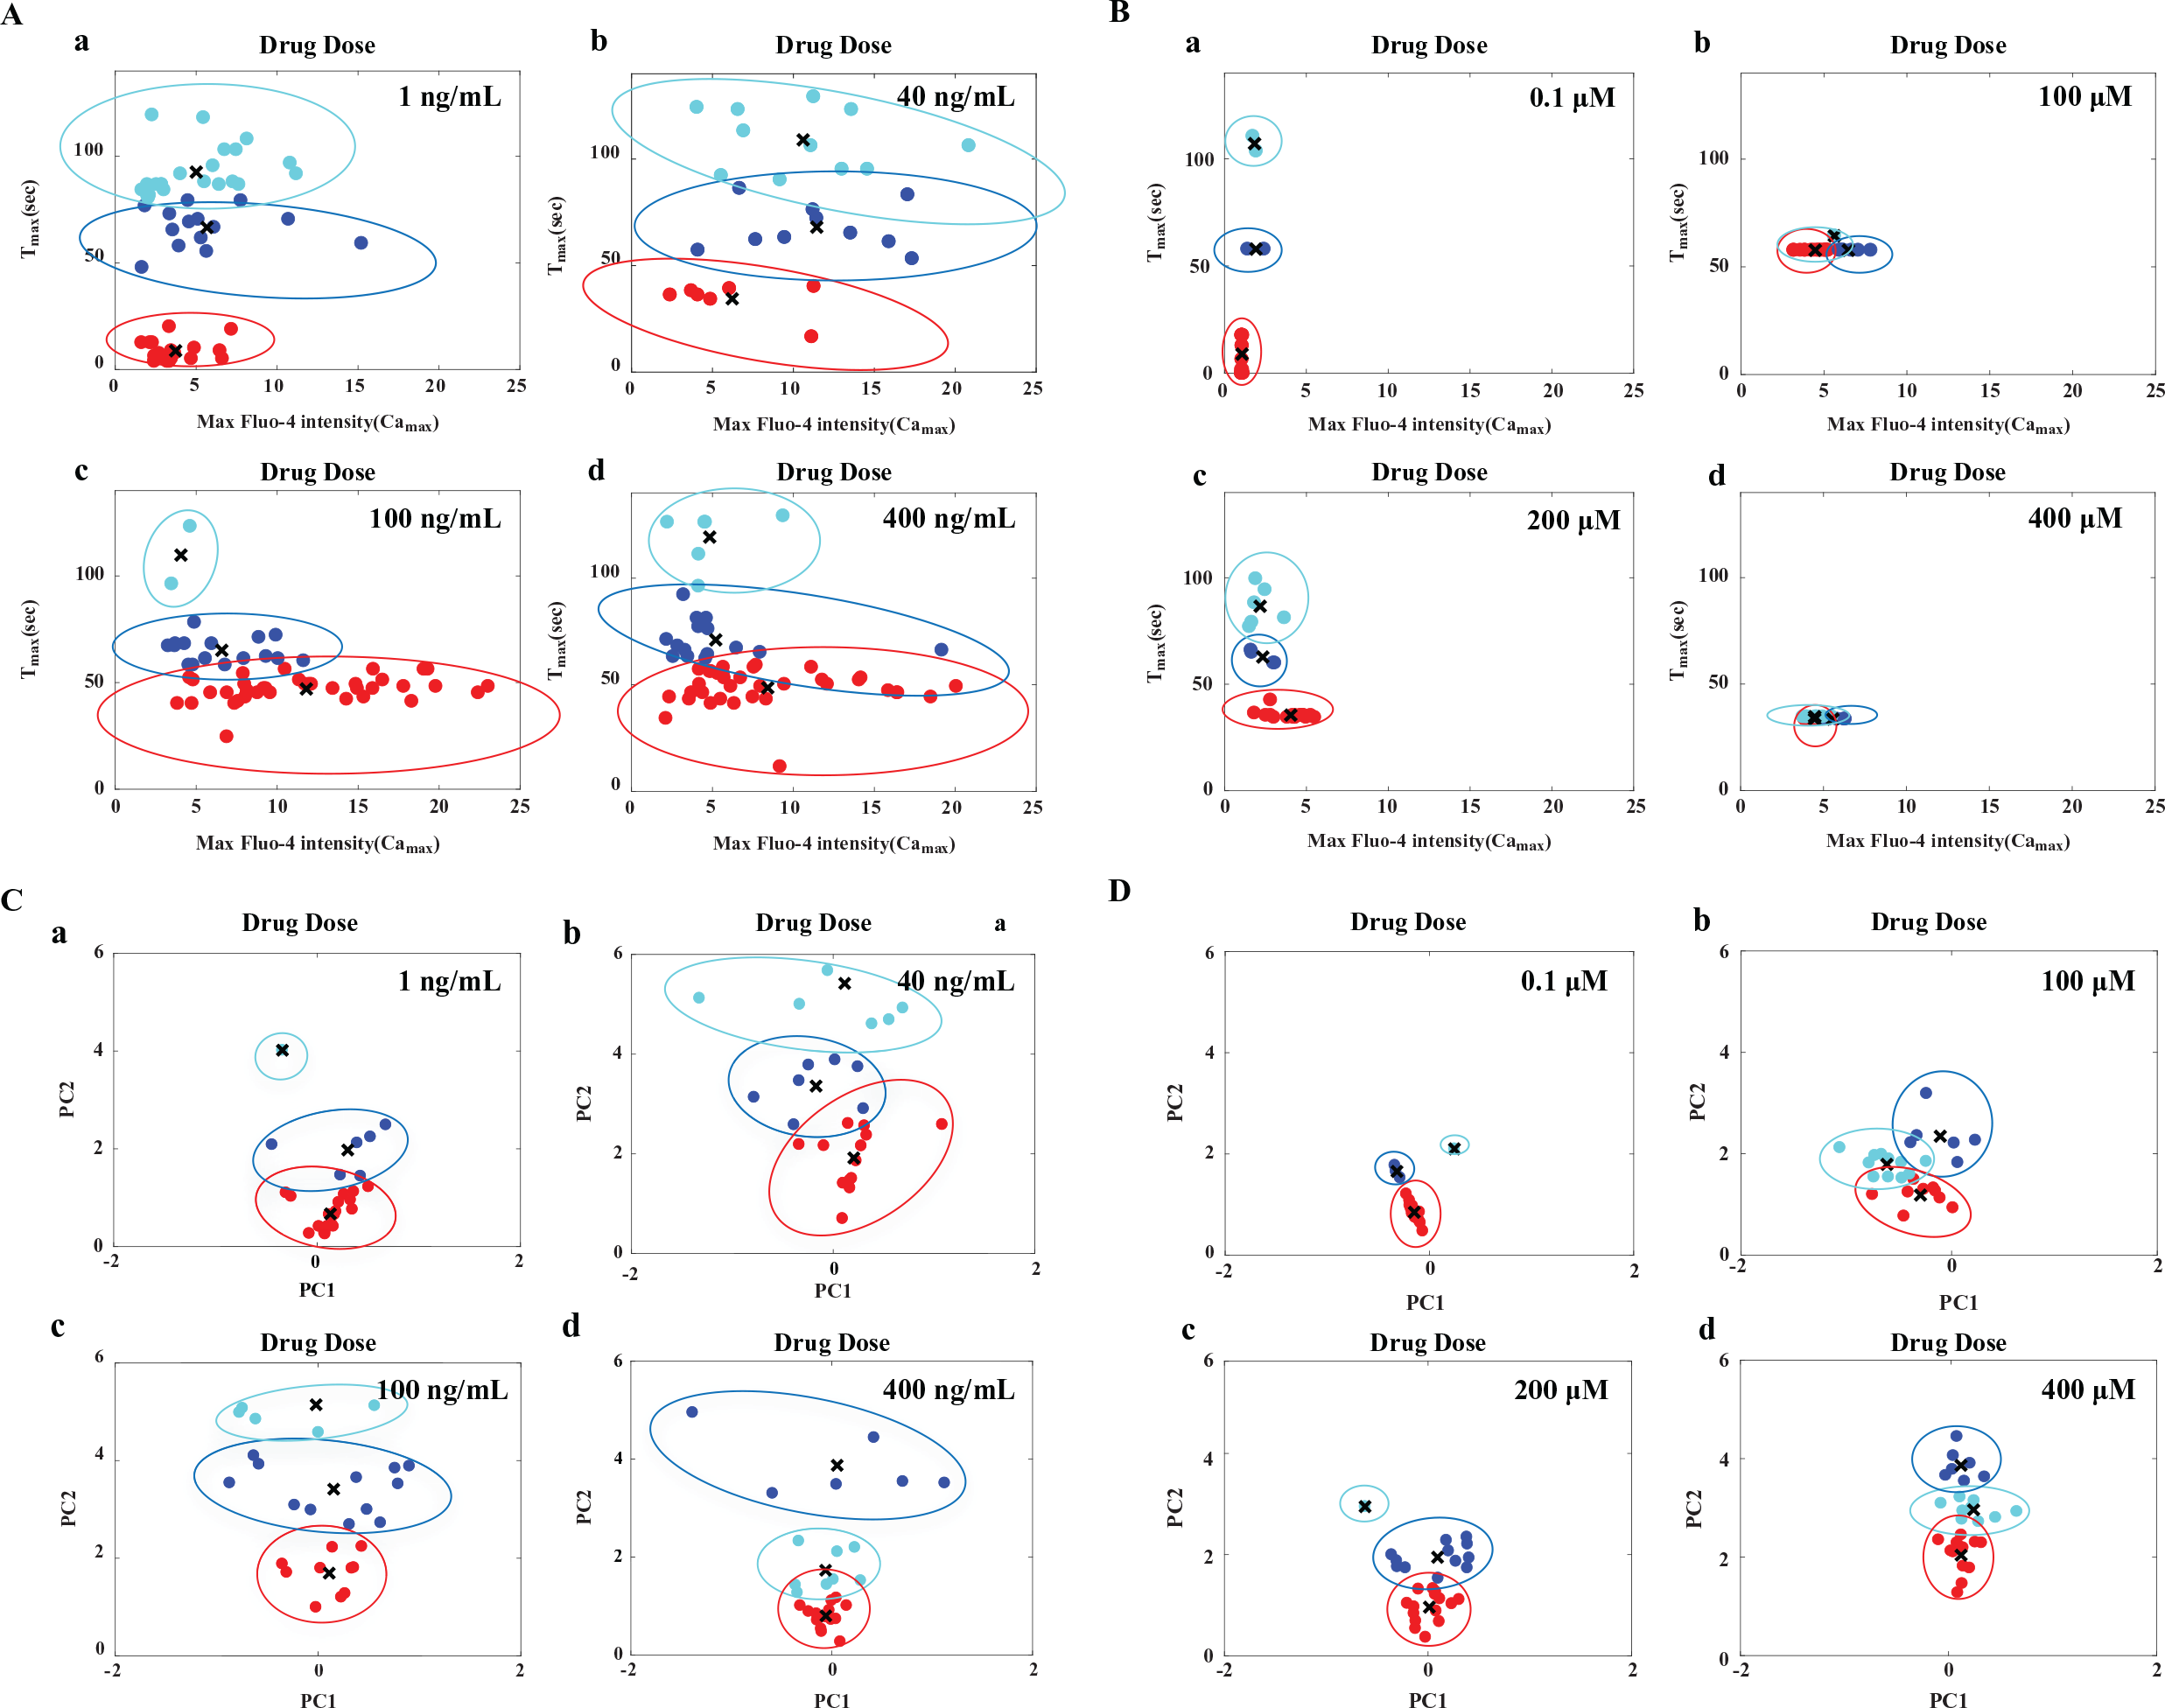
Classification and visualization of SDF-1α- and norepinephrine-mediated calcium responses in a HeLa cell population using Methods I and II. (Method I, activity measured by Camax and Tmax; Method II, PCA and k means of dynamic data). Heterogeneous calcium responses are presented as a mixture of subpopulations (respective subpopulations are shown in red, blue, and cyan). The centroid positions of the respective subpopulations are shown by the black x. (
Percentage of Responding Cells and Stacked Bar Plot
We performed subpopulation profiling to create a dose response using Camax and Tmax that can be used for the identification of optimum drug doses. The stacked bar plot shows the relative distribution of each member of the subpopulation. For CXCR4-mediated responses, at a lower drug dose concentration (40 ng/mL), ~45% of the cells responded (as shown in the representative plot for each subpopulation with the three colors) ( Suppl. Fig. S2C,a ). A further increase in drug concentration (100 ng/mL) resulted in ~94% of the cells responding (as shown in representative plots for each subpopulation) ( Suppl. Fig. S2C,a ). By comparing the 100 and 400 ng/mL drug dose responses, the 100 ng/mL drug dose resulted in ~94% responding cells, compared with ~88% responding cells at indicating that 400 ng/mL can be regarded as an optimum dose to get the highest activity ( Suppl. Fig. S2C,a ). A similar analysis was performed for norepinephrine, and the trend in percentage of responding cell versus dose shows a different characteristic, indicating that the optimal dose can be 100 µM ( Suppl. Fig. S2C,b ).
Automation of Classification Based on Time-Series Data: Comparison of Drugs
In the previous method, we used two parameters, Camax and Tmax, for the classification of cells. To improve on the generality in handling any dynamic data obtained from live imaging, we next used a combination of dimension reduction by PCA and k-means clustering for automation of the analysis. For visualization, we used PCA, and the results for the two drugs are shown in two dimensions ( Fig. 4C , D ). The results show that the SDF-1α- and norepinephrine-mediated responses in cell population can be classified as a mixture of subpopulations. The automated analysis of two drugs reveal that even two GPCR (Gαi-coupled)-targeting drugs show distinct features with respect to dose responses. The specific differences are (1) the heterogeneity in calcium response is less in norepinephrine than in SDF-1α, as we did not find enough cells in each cluster (with k = 3); (2) the distance between the clusters for norepinephrine is less than that of SDF-1α; and (3) the distance between the points within the cluster is similar for norepinephrine SDF-1α. Although we used k = 3 for comparison, the classification using k = 2 indicates similar conclusions ( Suppl. Fig. S3A,B ). This information can be further used to infer that norepinephrine can be used as a potential drug for inducing a synchronous calcium flux, even though the amplitude of its calcium response is lower than that of SDF-1α.
Next, we performed subpopulation profiling using the stacked bar plot obtained from the clustering using Method II, and the results indicate that the clustering pattern or the features of the calcium responses from the two Gαi-coupled receptor–targeting drugs are distinctly different ( Suppl. Fig. S3C, a and b ). It was found that the relative proportion of various responses follows a nonlinear response with respect to the drug dose of the two drugs. Subpopulation profiles allow quantitative comparison of the dynamic calcium responses across doses. In order to obtain faster activity in a large fraction of cells, 100 ng/mL of SDF-1α and 200 µM of norepinephrine can be used. Although the mean Camax for norepinephrine is lower than that for SDF-1α, norepinephrine can be selected as the drug for obtaining synchronous calcium peaks in a larger cell population. On the other hand, SDF-1α can be selected as a drug if a smaller fraction of cells are to be activated with a higher value of Camax.
Drug Selection and Dose Optimization: Ranking of Drugs Using ND Sorting
In order to set up a screening platform for a library of molecules and to test unknown compounds, we developed a strategy for ranking drugs using ND sorting. Various chemotypes are needed to be tested against the same target receptor in the case of compound screening. Hence, we performed a comparison of ligands of different chemotypes, such as clonidine, tizanidine, norepinephrine, and dexmeditomidine, that target α-2AR (at 500 µM and 1 mM). Figure 5A , B shows the comparison of the time course of calcium dynamics and a Camax versus Tmax plot for the four drugs at 500 µM. Similarly, the comparison is presented for a drug dose of 1 mM ( Suppl. Fig. S12 ). The results clearly show that the performances of the drugs targeting the same receptor are distinctly different. We compared the action of these drugs, and the results show that these ligands generate distinct signals. Then, we ranked the drugs based on maximizing the percentage of cells having a higher value of Camax and minimizing the percentage of cells having a higher value of Tmax. The result indicates that the performances of norepinephrine at 500 µM and clonidine at 1 mM are better compared with the others ( Fig. 6A ). This in turn establishes the specificity and robustness of the assay.
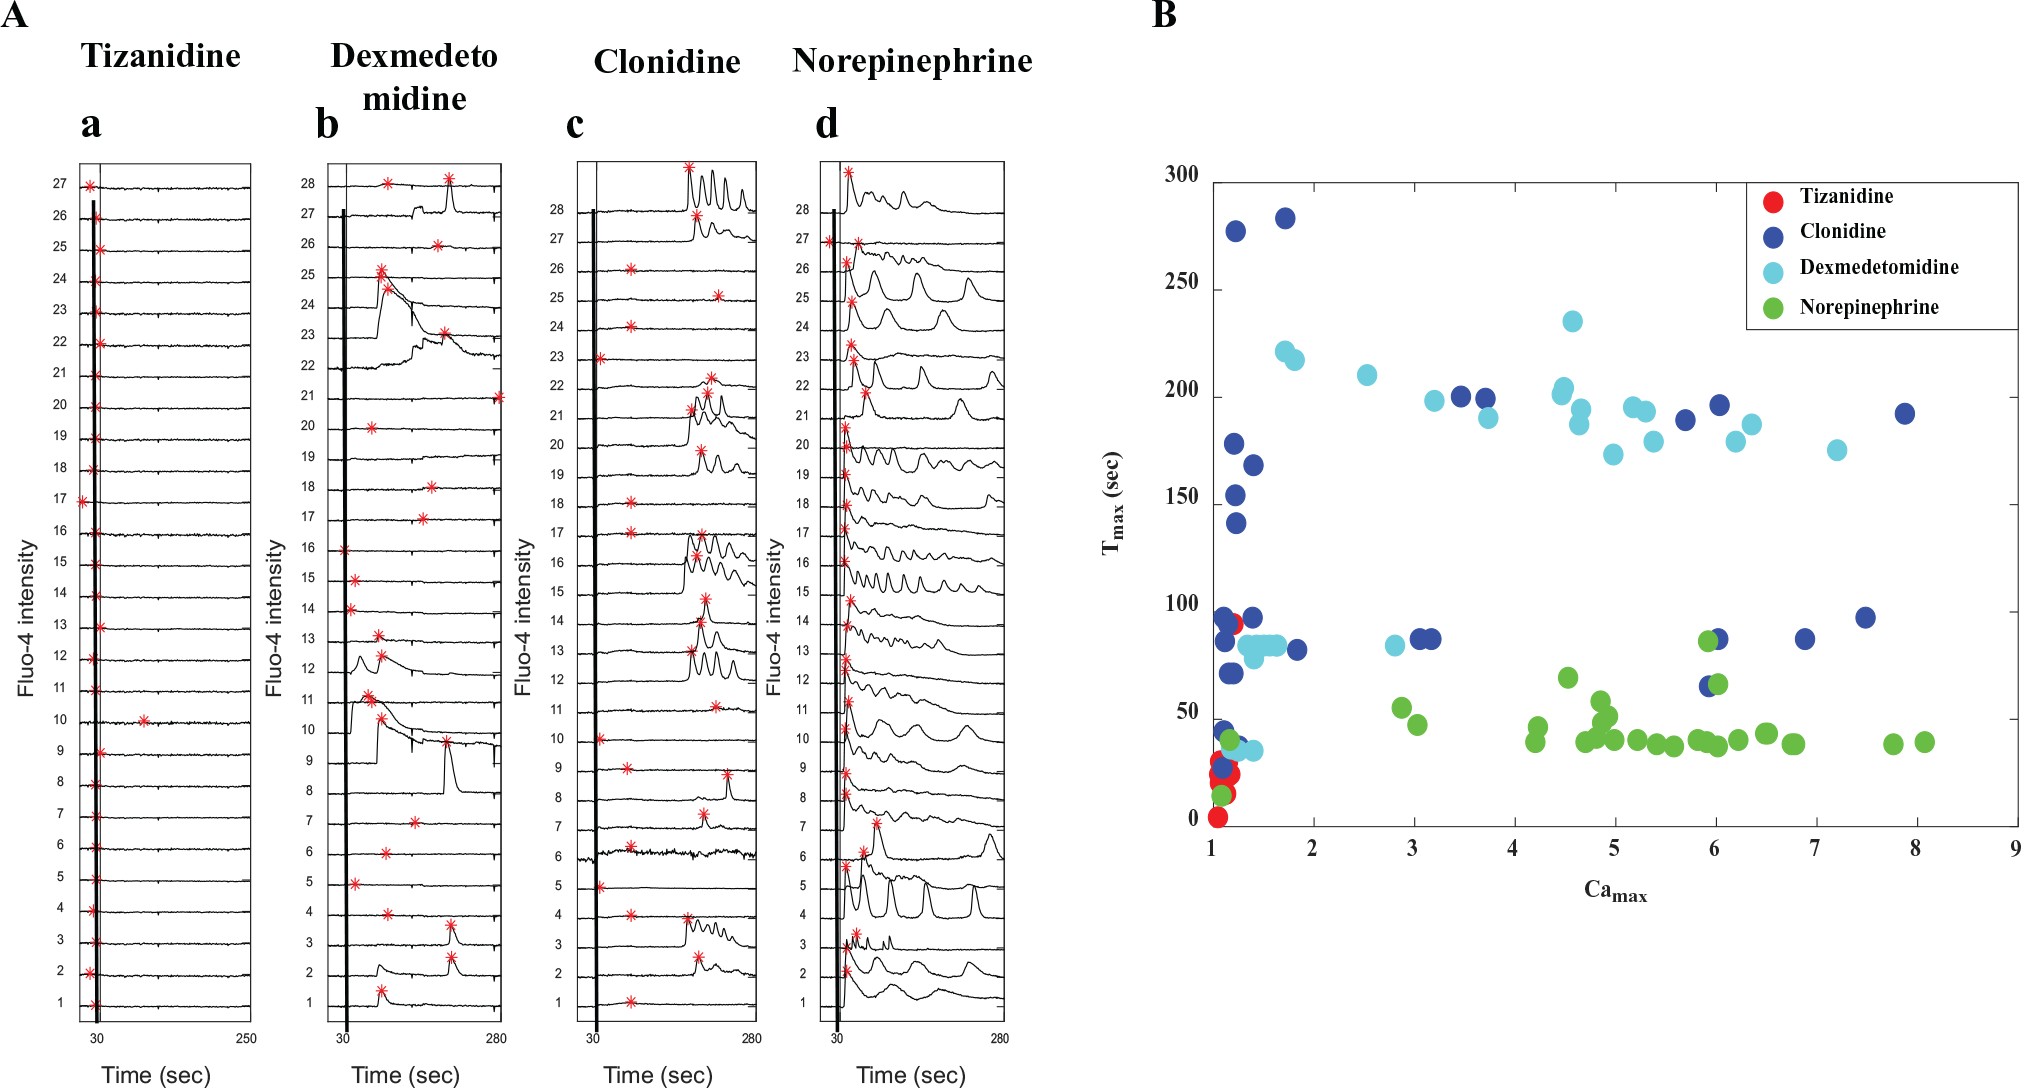
Comparison of the drug action through calcium imaging assay for four drugs (tizanidine, clonidine, dexmedetomidine, and norepinephrine) activating α2AR at 500 µM. (

Ranking of drug performance/activity for a set of compounds at various doses based on the maximization of subpopulation showing higher Camax and the minimization of subpopulation showing higher Tmax using ND sorting. (
In order to show the feasibility of this assay for compound screening, we took a set of GPCR-targeting drugs (norepinephrine, SDF-1α, histamine, and endothelin) containing both Gαq- and Gαi-coupled drugs and compared their performances ( Fig. 6B ). The result shows that histamine at a lower dose (1 µM) is comparable to norepinephrine at 100 µM and SDF-1α at 100 ng/mL, and these drugs are assigned to the highest rank. As these drugs are assigned an equal rank, this implies that one is better with reference to the first objective, and the other is better with reference to the second objective.
Discussion
Traditional techniques like FLIPR and xCELLigence can be used for screening the agonist activity based on calcium flux measurement and real-time monitoring of the cell viability.7–9,17,18 However, these assays suffer from limited spatial and temporal resolution. The major disadvantages of FLIPR are its susceptibility to capture nonspecific/false-positive responses and the use of pooled responses during the analysis of a large number of cells. The xCELLigence system is appropriate mainly for excitable cells, such as neurons and muscle cells, while it is not suitable for drug screening using nonexcitable cells. 18 In both instances, obtaining single-cell responses, classifying them, and estimating the percentage of responding cells remain challenging.
In the current study, we demonstrate a scheme for high-resolution imaging of cytosolic calcium using confocal microscopy and automated analysis of the calcium dynamics. In contrast to fixed-cell-based immunoassays for drug selection, the proposed technique is based on live cell imaging. Advantages of the proposed framework over existing techniques include (1) improved spatial and temporal resolution obtained by means of imaging, (2) unbiased analysis through automated feature extraction and clustering of a large amount of imaging data generated from time-series videos (manual analysis may yield subjective variability), (3) estimation of the relative proportion of responding and nonresponding cells, and (4) suitability to both excitable and nonexcitable cells.
The output of this technique is a dose–response feature for a specific drug through which multiple drugs can be compared and ranked. Since cells can be imaged in 96-well plates using a high-content imaging system having robotic arms, 30 and automated analysis can be performed from calcium responses, such a technique can be integrated to a high-content assay. The typical time frame required for running the clustering analysis for 96-, 384-, and 1536-well plates ranges from 1 to 10 min ( Suppl. Table S2 ). Additionally, the stacked bar plot can be used for the identification of a specific feature of a drug during the drug screening process, and this technique can also be implemented for the determination of the optimal dose during drug screening. The proposed ranking strategy based on clustering can be implemented for scoring a large number of drugs in the case of high-throughput screening. The technique can also be used for testing unknown compounds and ranking them compared with a list of known compounds based on their calcium response with time.
The initial cost for setting up a confocal microscope for single-cell calcium imaging is comparable to the cost of FLIPR and xCELLigence. Additionally, epifluorescence imaging can also be used for obtaining calcium dynamics. Therefore, the assay can also be performed in an incubation chamber attached to a relatively inexpensive fluorescence microscope. Further, the assay can be improved through long-term imaging (50–70 min) of intracellular calcium concentration, which will provide high-resolution information on calcium spiking over time. One major limitation of this assay lies in the fact that the region of interest defining each cell boundary needs to be manually marked. This can be circumvented by developing an efficient image segmentation tool for the specific cell line of interest.
The clustering technique employed here can be used for the identification of distinct patterns corresponding to any drug from time-series data obtained from any cell line through calcium imaging. The sorting technique can also be used for ranking a large set of drugs for pharmacological studies based on multiple objectives. Here, we demonstrated that the assay can be used for comparing multiple drugs targeting different receptors, as well as the same receptor, and identifying differences between them. Further, this approach can be implemented to classify calcium responses and rank a large number of GPCR-targeting drugs to screen the optimal drug for neuronal regeneration, a process known to be regulated by calcium signaling. The throughput of this process can be improved by automating the selection process of the cluster number for various drugs and including advanced cell segmentation algorithms.
Footnotes
Acknowledgements
We thank Professor N. Gautam at Washington University School of Medicine in St. Louis, Missouri, for allowing us to perform some of the experiments on live cell confocal imaging. We thank K. Apoorva Katragadda and Ashutosh Gupta for data analysis and Dr. Soumya Jana at the Department of Electrical Engineering, Indian Institute of Technology, Hyderabad, India, for useful discussions.
Declaration of Conflicting Interests
The authors declared no potential conflicts of interest with respect to the research, authorship, and/or publication of this article.
Funding
Funding for this research was provided by the Indian Institute of Technology, Hyderabad, and the University of Toledo, OH, USA.
Supplementary material is available online with this article.
References
Supplementary Material
Please find the following supplemental material available below.
For Open Access articles published under a Creative Commons License, all supplemental material carries the same license as the article it is associated with.
For non-Open Access articles published, all supplemental material carries a non-exclusive license, and permission requests for re-use of supplemental material or any part of supplemental material shall be sent directly to the copyright owner as specified in the copyright notice associated with the article.
