



Abstract
Liver vessel density can be evaluated by an imaging biomarker diffusion-derived vessel density (DDVD): DDVD/area(b0b2) = Sb0/ROIarea0 – Sb2/ROIarea2, where Sb0 and Sb2 refer to the liver signal when b is 0 or 2 (s/mm2); ROIarea0 and ROIarea2 refer to the region of interest (ROI) on b = 0 or 2 images; and Sb2 may be replaced by Sb15 (b = 15). This concept was validated in this study. Liver diffusion images were acquired at 1.5 T. For a scan-rescan repeatability study of six subjects, b values of 0 and 2 were used. The validation study was composed of 26 healthy volunteers and 19 consecutive suspected chronic viral hepatitis B patients, and diffusion images with b values of 0, 2, 15, 20, 30, 45, 50, 60, 80, 100, 200, 300, 600, and 800 were acquired. Four patients did not have liver fibrosis, and the rest were four stage 1, three stage 2, four stage 3, and one stage 4 patients, respectively. The intraclass correlation coefficient for repeatability was 0.994 for DDVD/area(Sb0Sb2) and 0.978 for DDVD/area(Sb0Sb15). In the validation study, DDVD/area(Sb0Sb2) and area(Sb0Sb15) were 14.80 ± 3.06 and 26.58 ± 3.97 for healthy volunteers, 10.51 ± 1.51 and 20.15 ± 2.21 for stage 1–2 fibrosis patients, and 9.42 ± 0.87 and 19.42 ± 1.89 for stage 3–4 fibrosis patients. For 16 patients where IVIM analysis was performed, a combination of DDVD/area, PF, and Dfast achieved the best differentiation for nonfibrotic livers and fibrotic livers. DDVD/area were weakly correlated with PF or Dfast. Both DDVD/area(Sb0Sb2) and area(Sb0Sb15) are useful imaging biomarkers to separate fibrotic and nonfibrotic livers, with fibrotic livers having lower measurements.
Keywords
Chronic liver disease is a major public health problem, accounting for approximately 1.3 million deaths worldwide in 2015. 1 The end result of untreated chronic liver disease is inflammation, loss of liver parenchyma, and healing by fibrosis and regeneration. Earlier-stage liver fibrosis is more amenable to therapeutic intervention. In the early stages of fibrosis when the cause (e.g., hepatitis B or C) is treated, regression occurs in at least 70% of patients with the right antiviral management.2,3 The regression of liver fibrosis can be complete in early stages, whereas partial and prolonged recovery occurs in late or advanced stages. 4 Treatment with combined therapies on underlying etiology and fibrosis simultaneously might expedite the regression of liver fibrosis and promote liver regeneration. Early detection of liver fibrosis is important for early institution of treatment and to maximize the potential for regression and better prognosis.
Currently, there is no established noninvasive diagnostic method to detect and grade early-stage liver fibrosis.
5
The reference standard for detection and staging of liver fibrosis remains biopsy; however, it is invasive and frequently causes pain and discomfort, with risk of bleeding and hospitalization. Moreover, biopsy is subject to sampling errors and not suitable for longitudinal monitoring. Liver fibrosis is associated with reduced liver perfusion6–8 and progressive loss of endothelial fenestration and deposition of collagen in the space of Disse. These processes reduce the rate of blood flow and prolong its transit time. On diffusion-weighted imaging, blood vessels show a high signal when there is no diffusion gradient (b = 0 s/mm2) and a low signal when very low b values (e.g., 1 s/mm2) are applied (

where Sb0 refers to the measured liver signal intensity when b = 0 s/mm2, and Sb1 refers to the measured liver signal intensity when b = 1 s/mm2. ROIarea0 and ROIarea1 refer to the ROI on b = 0 s/mm2 and b = 1 s/mm2 images, respectively. Sb1 and ROIarea1 can also be approximated by other low b-value diffusion image data, such as Sb2, which is the measured liver signal intensity when b = 2 s/mm2. Sb2 may be preferable in cases when Sb1 contains residual high blood signal. Wang 9 further suggested that this surrogate biomarker, DDVD/area, can be used to evaluate the existence and severity of liver fibrosis.
This study proposes a method to calculate liver DDVD/area, evaluate their measure-remeasure repeatability, and validate their application in a database composed of healthy livers and fibrotic livers. Moreover, as some clinical MRI scanners currently do not allow b values less than 10 s/mm2 (except b = 0), this study also evaluated the usefulness of DDVD/area(b0b15) = Sb0/ROIarea0 – Sb15/ROIarea15. Additionally, the diagnostic performance of a combination of DDVD/area parameter and intravoxel incoherent motion (IVIM) parameters was tested.
Materials and Methods
The MRI data acquisition was approved by the local institutional ethical committee, and informed consent was obtained for all subjects. The IVIM type of diffusion scan was based on a single-shot spin-echo-type echo-planar sequence using a 1.5 T magnet (Achieva; Philips Healthcare, Best, Netherlands). The SPIR technique (spectral presaturation with inversion recovery) was used for fat suppression. Respiratory gating was applied in all scan participants. The TR was 1600 ms and the TE was 63 ms, with one TR per respiratory cycle (TR hereafter refers to the time from the radiofrequency pulse to echo signal acquisition). Other parameters included slice thickness = 7 mm, interslice gap = 1 mm, matrix = 124 × 97, field of view (FOV) = 375 × 302 mm, number of excitations (NEX) = 2, and number of slices = 6.
The scan-rescan repeatability study was performed on six healthy subjects (four males and two females; mean age, 37 years; range, 20–58 years) from April 21, 2019, to May 19, 2019. For this, volunteers were scanned twice (scans 1 and 2) during the same session, with the subjects’ position and selected scan planes unchanged. Images with 16 b values of 0, 2, 4, 7, 10, 15, 20, 30, 46, 60, 72, 100, 150, 200, 400, and 600 s/mm2 were acquired, and images with b values of 0 and 2 s/mm2 were used in the current study. The validation study used a database collected from July 27, 2017, to November 2, 2018, 10 where the images had b values of 0, 2, 15, 20, 30, 45, 50, 60, 80, 100, 200, 300, 600, and 800 s/mm2. There were 26 healthy volunteers (14 males, 12 females; mean age, 24 years; range, 20–41 years) and 19 consecutive patients suspected of liver fibrosis with liver biopsy results. Three patients had chronic viral hepatitis B infection, but biopsy did not show liver fibrosis, and one patient’s biopsy result showed only mild simple steatosis. These four patients were all males, aged 19–57 years. The liver fibrosis patients (mean age, 46 years; range, 22–62 years) had four stage 1 subjects, three stage 2 subjects, four stage 3 subjects, and one stage 4 subject, all with chronic viral hepatitis B. One patient additionally had hepatocellular carcinoma.
All data analysis was implemented in MATLAB (MathWorks, Natick, MA). For DDVD/area measurement, only the liver tissue to the right border of the vertebral body was included (
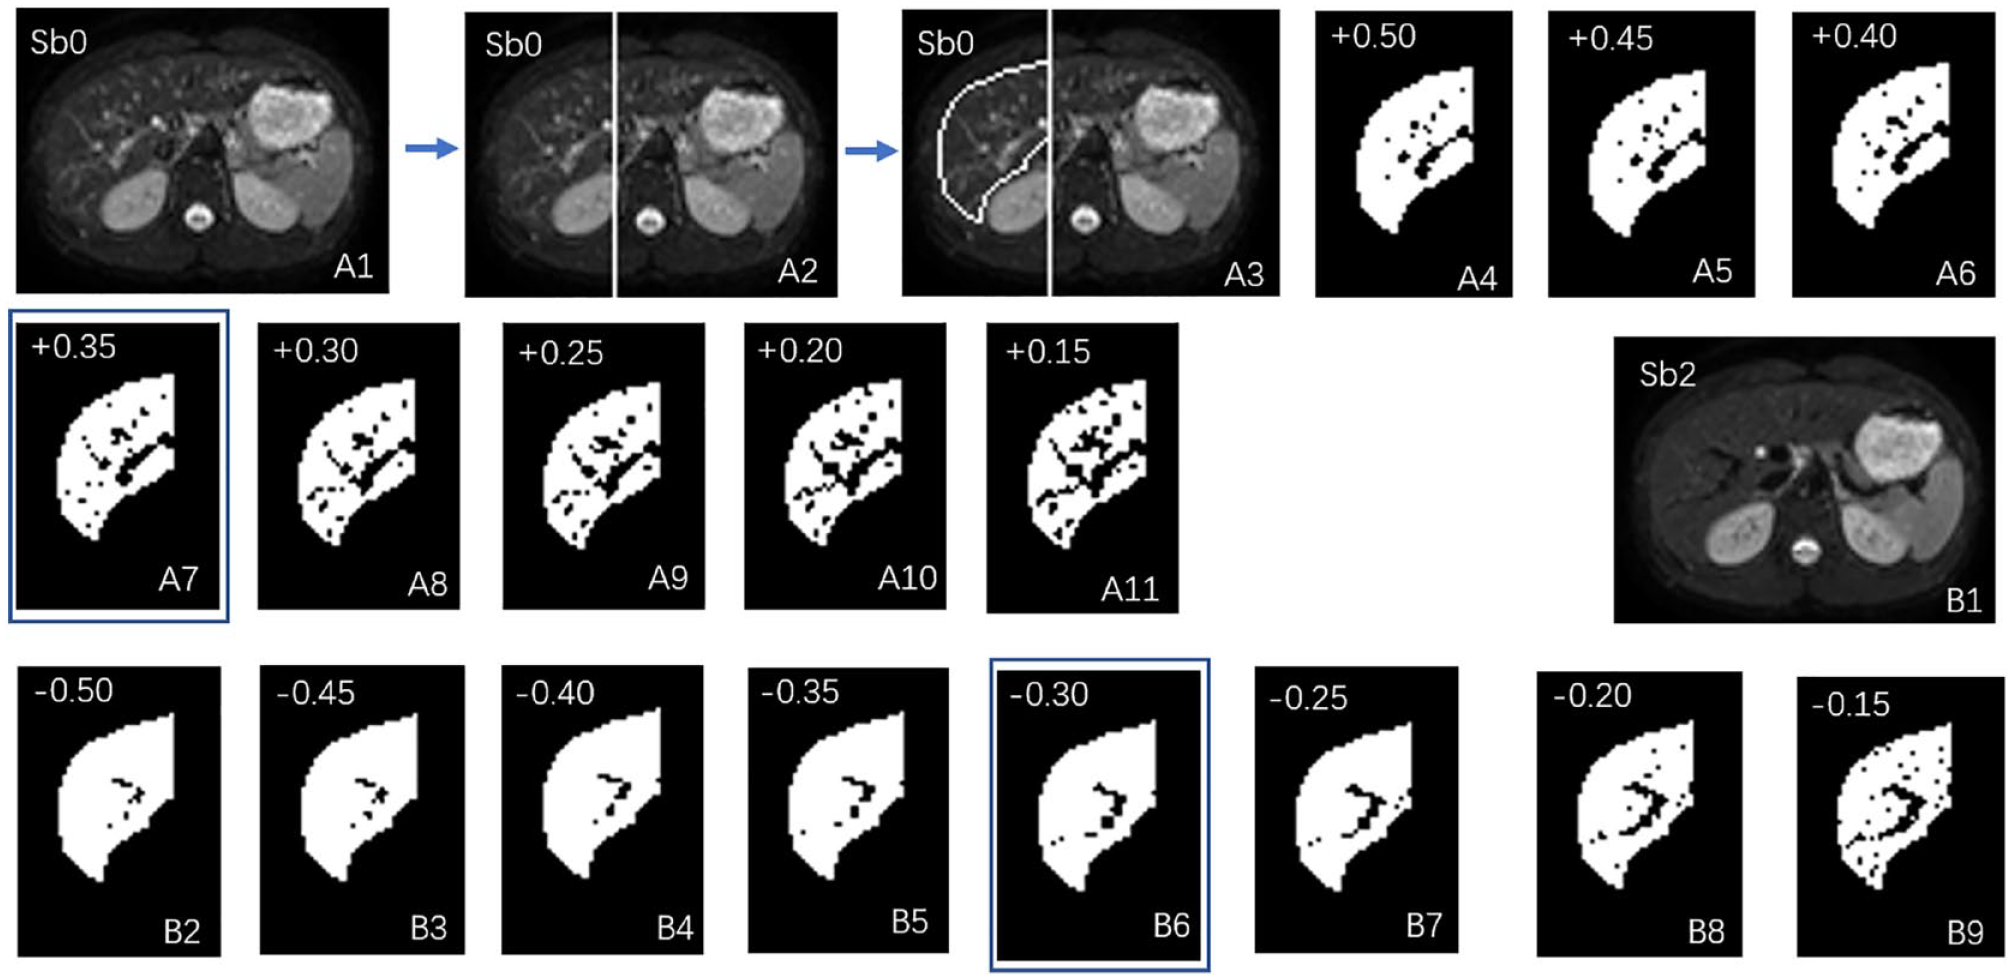
An example of vessel pixel removal after processing the Sb0 image (b = 0 s/mm2) and Sb2 image (b = 2 s/mm2). (
Two parameters were obtained:


In this study, the ROI areas of the included slices were broadly similar, and the average DDVDs of individual slices were calculated to obtain the value of the liver.
IVIM analysis for PF (perfusion fracture, f), Dfast (perfusion-related diffusion, D*), and Dslow (true diffusion, D) of the study subjects has been presented; 10 the IVIM results from our previous study were used for additional analysis in the current study. Three patients were excluded for IVIM analysis due to substantial respiratory motion. 10 The b = 15 s/mm2 image was used as the starting point for biexponential segmented fitting as detailed previously.9,10,13,14 The signal value at each b value was normalized by attributing a value of 100 at b = 15 s/mm2 (Snorm = (SI/SI15) × 100, where Snorm is the normalized signal, SI is the signal at a given b value, and SI15 is the signal at b = 15 s/mm2). The threshold was b = 60 s/mm2 for segmented fitting.14,15 For a bicompartmental model, the signal attenuation was modeled according to eq 2:

where SI(b) and SI15 denote the signal intensity acquired with the b-factor value of b and b = 15 s/mm2, respectively.
In data analysis, the approach that maximizes the relative distance between the patient group with fibrosis and the volunteer group without fibrosis is favored.13,15 Particularly, this difference may be important for separating borderline fibrotic livers and normal livers. 13 In this study, we use the existing data to build models (i.e., a line in a 2D plane and a plane in a 3D space) that can be used to predict the best separation between the nonfibrotic livers and fibrotic livers of future study subjects. In the case of the 2D plane, we use IVIM perfusion fraction and DDVD/area to separate the nonfibrotic livers and fibrotic livers, and this model is the line that maximizes the distance between data points of nonfibrotic livers and data points of fibrotic livers of subjects in this study. For the 3D space, this model is the plane that maximizes the distance between nonfibrotic liver data points and fibrotic liver data points.
As previously described,13,15 to estimate the relative distance between the measures of healthy livers and fibrotic livers, for each study subject’s results, the DDVD/area, PF, Dslow, and Dfast values were normalized to range between 0 and 1 according to the formula (xi – xmin)/(xmax – xmin). xmax is the largest value of the DDVD/area, PF, Dslow, or Dfast in this study, and xmin is the smallest value of the DDVD/area, PF, Dslow, or Dfast in this study. The DDVD/area does not have a unit, PF is in percentage, and Dslow and Dfast have units of mm2/s. As the measured values differed substantially among these four parameters, this normalization gives each parameter equal weight.
A 2D plane was constructed with DDVD/area as the X axis and PF as the Y axis. With the support vector machine (SVM) approach, the best separating line between healthy livers and fibrotic livers was defined as A*X + B*Y + D = 0. In the 2D coordinate system, the distance between point (X0, Y0) and line A*X + B*Y + D = 0 was calculated according to the following equation:

The mean distance of points representing healthy livers to the line and the mean distance of points representing fibrotic livers to the line were calculated, and then these two mean distances were added together.
A 3D coordinate system was then constructed with DDVD/area as the X axis, PF as the Y axis, and Dfast or Dslow as the Z axis. With the SVM approach, the best separating plane between healthy livers and fibrotic livers was defined as A*X + B*Y + C*Z + D = 0. In the 3D coordinate system, the distance between point (X0, Y0, Z0) and plane A*X + B*Y + C*Z + D = 0 was calculated according to following equation:

The mean distance of points representing healthy livers to the plane and the mean distance of points representing fibrotic livers to the line were calculated, and then these two distances were added together.
For fibrosis patients (n = 12), the correlations between DDVD/area versus Dfast and PF DDVD/area versus PF were inspected graphically. The values of the three IVIM parameters were rescaled, with the mean measures of DDVA/area, PF, and Dfast for the fibrosis patients rescaled to 1. Moreover, Pearson correlation analysis was performed for the correlation between DDVD/area versus Dfast and PF DDVD/area versus PF for all patients (n = 16) and volunteers (n = 26).
Results
The DDVD/area measurement scan-rescan repeatability of six healthy volunteers is shown in Table 1 . The intraclass correlation coefficient (ICC) was very good: 0.994 and 0.978 for DDVD/area(b0b2) and DDVD/area(b0b15), respectively. This also suggests the robustness of our image postprocessing procedure for vessel pixel removal. However, notable intersubject variation was also observed with coefficients of variation (CoVs) of approximately 0.34 and 0.20 for DDVD/area(b0b2) and DDVD/area(b0b15), respectively.
Scan-Rescan Repeatability Measure for DDVD/Area(b0b2) and DDVD/Area(b0b15) of Six Healthy Volunteers.

SD, standard variation.
For the validation study, the results of DDVD/area(b0b2) and DDVD/area(b0b15) for healthy volunteers and patients are shown in Figure 2 and Table 2 . The mean values of DDVD/area(b0b2) and DDVD/area(b0b15) for the validation study volunteers were similar to those for the volunteers of the scan-rescan repeatability study ( Table 1 ). A trend was seen that fibrotic livers had lower DDVD/area measurements, and also, a more severe grade of fibrosis was associated with even lower measurements. On the other hand, the DDVD/area of four patients without liver fibrosis had values similar to those of healthy livers.
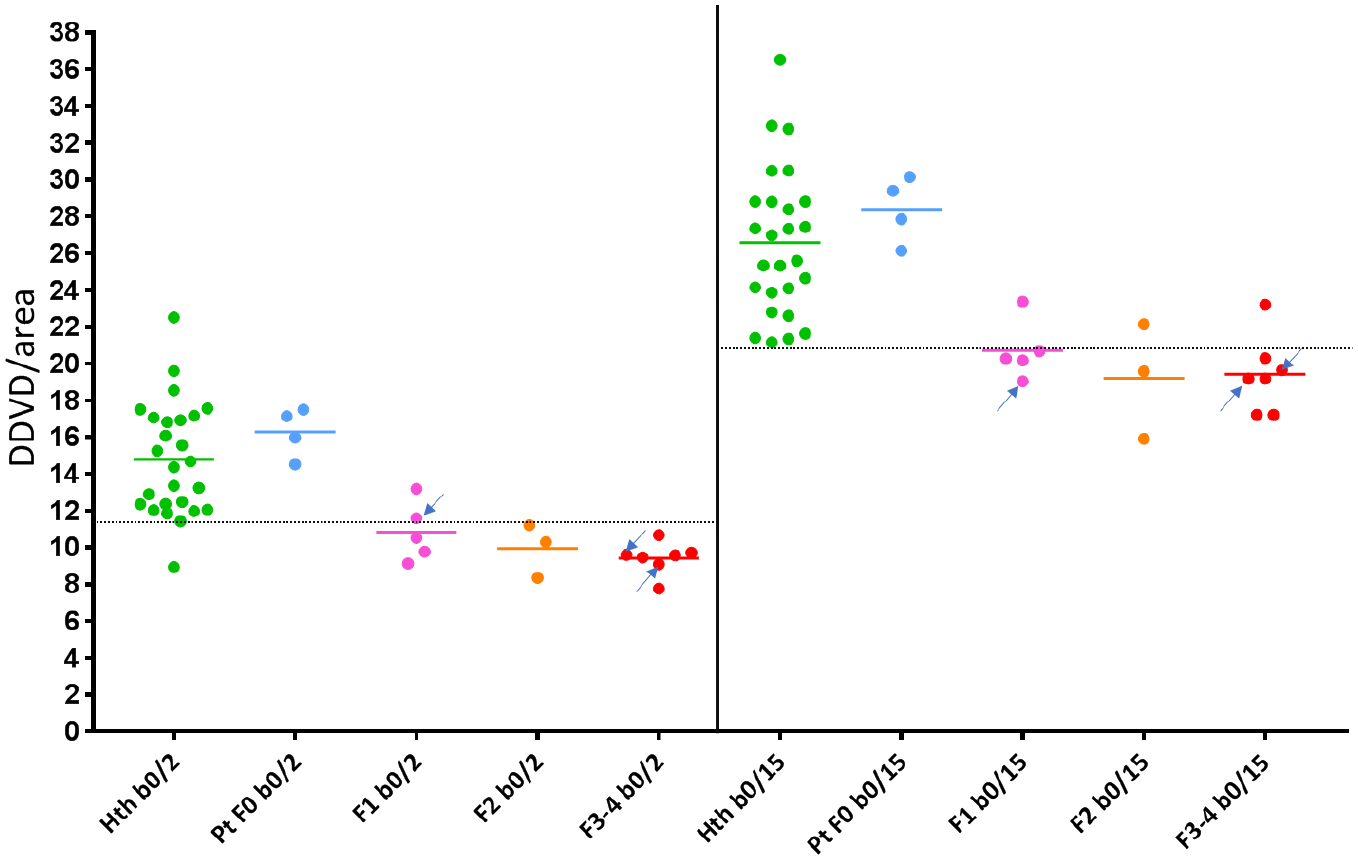
Scatterplot of DDVD/area(b0b2) and DDVD/area(b0b15) measurement of healthy volunteers (Hth, n = 26), patients without fibrosis (Pt F0, n = 4), and liver fibrosis patients of different stages (F1–F4, n = 15). b0/2 denotes the measured difference between the b = 0 image and b = 2 image; b0/15 denotes the measured difference between the b = 0 s/mm2 image and b = 15 s/mm2 image. Arrows denote three patients whose IVIM results could not be measured due to severe respiratory motion (n = 3).
Mean and Standard Deviation of DDVD/Area(b0b2) and DDVD/Area(b0b15) for Healthy Volunteers, Patients without Fibrosis, Patients with Stage 1 and Stage 2 Liver Fibrosis, and Patients with Stage 3 and Stage 4 Liver Fibrosis Patients.
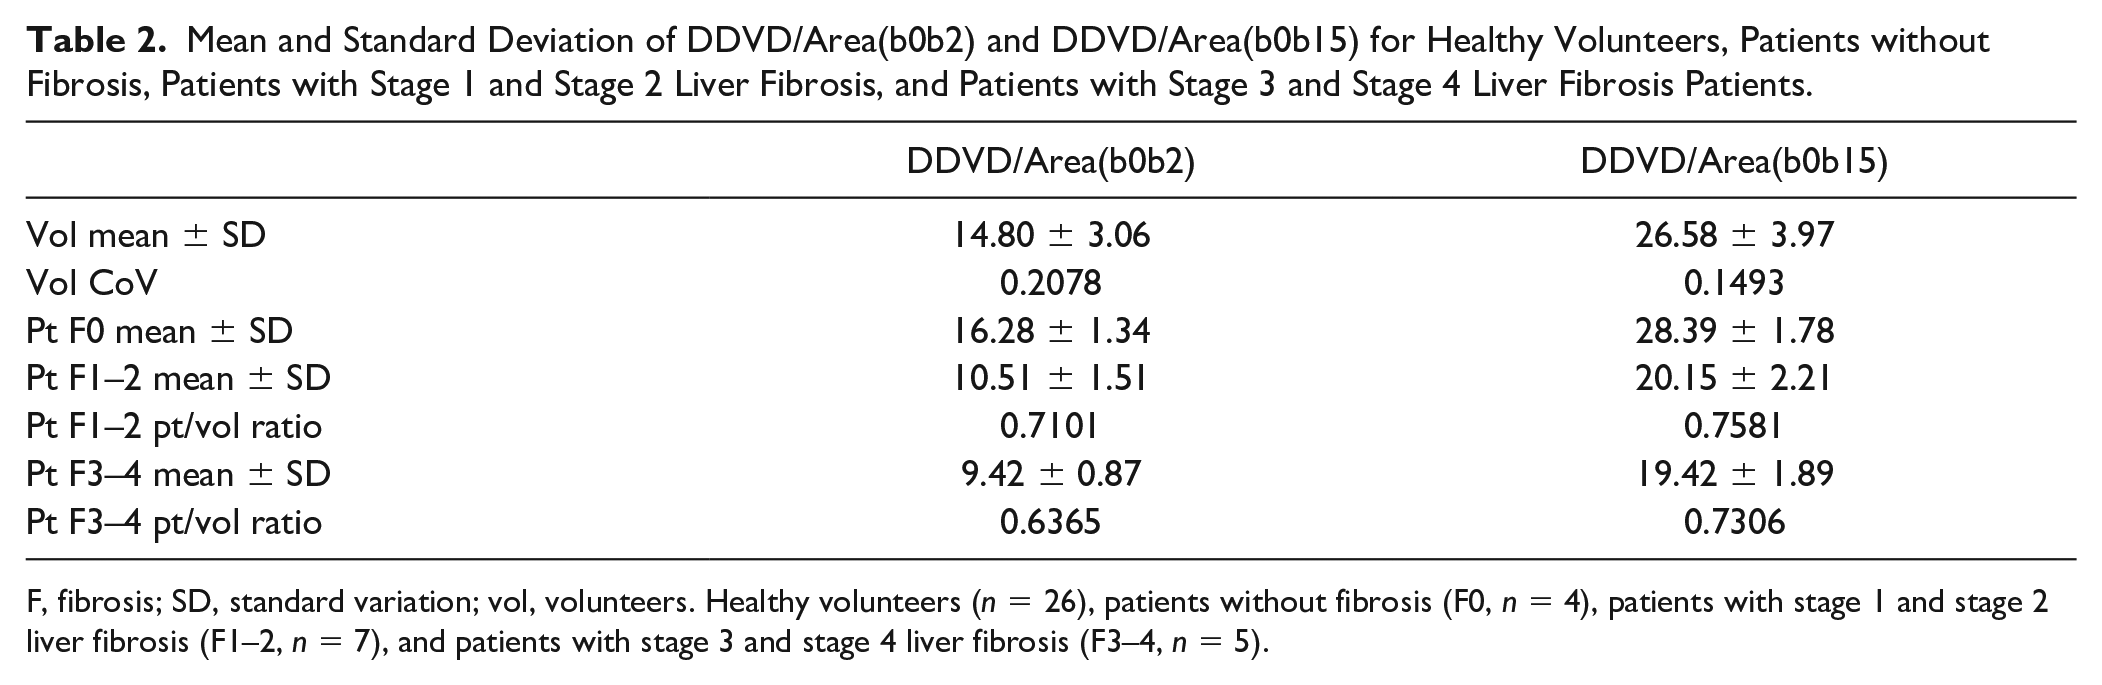
F, fibrosis; SD, standard variation; vol, volunteers. Healthy volunteers (n = 26), patients without fibrosis (F0, n = 4), patients with stage 1 and stage 2 liver fibrosis (F1–2, n = 7), and patients with stage 3 and stage 4 liver fibrosis (F3–4, n = 5).
The patient/volunteer (pt/vol) ratio, which was the mean measurement for a patient group divided by the mean measurement for healthy volunteers, was applied to evaluate the relative performance of DDVD/area(b0b2) versus DDVD/area(b0b15). The smaller the pt/vol ratio, the bigger would be the difference between the measurements for patient values and those for healthy volunteer values. Based on the pt/vol ratio and Figure 2 , DDVD/area(b0b2) and DDVD/area(b0b15) demonstrated broadly similar performances in separating nonfibrotic versus fibrotic livers, with only a slightly smaller pt/vol ratio for DDVDb0b2 and slightly favoring DDVD/area(b0b2).
The 2D plots of DDVD/area versus PF are shown in Figure 3 . With PF (Y axis) as the reference to separate nonfibrotic livers and fibrotic livers, the healthy volunteers in the orange square, which had a lower PF measurement, that is, those close to the fibrotic patients in Y-axis distribution, can be further separated from fibrotic patients by DDVD/area in X axis. Furthermore, an additional Z axis with Dfast or Dslow was introduced to the 2D plane of Figure 3 , so that PF, DDVD/area, and Dfast, or PF, DDVD/area, and Dslow constituted two 3D spaces. For these two 3D spaces, the mean relative distances between the volunteer cluster and patient cluster, as calculated with eqs 3 and 4, are shown in Table 3 . Under the assumption that a larger distance suggests potential better differentiation of nonfibrotic livers and fibrotic livers, Table 3 shows that the introduction of Dslow or Dfast as a third axis further improved the distance between the volunteer cluster and patient cluster, and even more so with Dfast. Results in Table 3 confirm the data in Table 2 so that DDVD/area(b0b2) slightly outperformed DDVD/area(b0b15). The 3D plots of DDVD/area with PF, and Dfast as three axes are shown in Figure 4 .

2D scatterplot of DDVD/area measurement and PF for healthy volunteers (blue dot, n = 26), patients without fibrosis (green dots, n = 4), and patients with liver fibrosis (red dots, n = 12). There were three patients whose IVIM results could not be measured due to severe respiratory motion; thus, these three patients are missing from the figure, compared with Figure 2. (
Mean Distance (in Relative Units) between Healthy Volunteer Cluster and Fibrosis Patient Cluster.
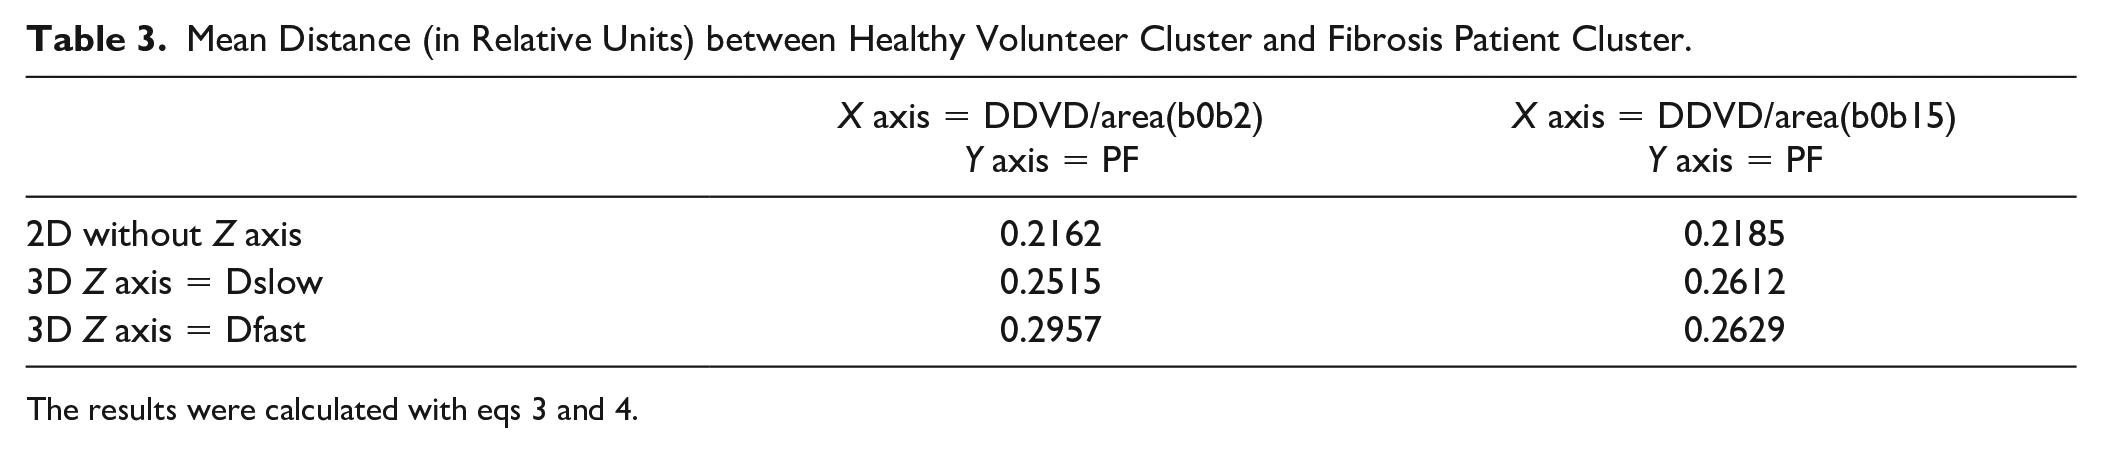
The results were calculated with eqs 3 and 4.

3D display of healthy volunteer group (green dots, n = 26), patients without liver fibrosis (blue dots, n = 4), patients with stage 1–2 liver fibrosis (orange dots, n = 7), and patients with stage 3–4 liver fibrosis (red dots, n = 5). (
For liver fibrosis patients, the correlations between DDVD/area versus Dfast and DDVD/area versus PF are graphically demonstrated in Figure 5 . Figure 5 shows that DDVD/area larger than 1 could be associated with Dfast or PF smaller than 1, and vice versa; thus, no clear correlation pattern could be noted. However, the Pearson correlation coefficient (r) for patients and volunteers combined was 0.419 (p < 0.005), 0.51 (p < 0.001), 0.44 (p < 0.001), and 0.52 (p < 0.001) for, respectively, DDVD/area(b0b2) versus Dfast, DDVD/area(b0b15) versus Dfast, DDVD/area(b0b2) versus PF, and DDVD/area(b0b15) versus PF; such correlations were weak yet significant. These relationships can also be visualized in Figure 3 .
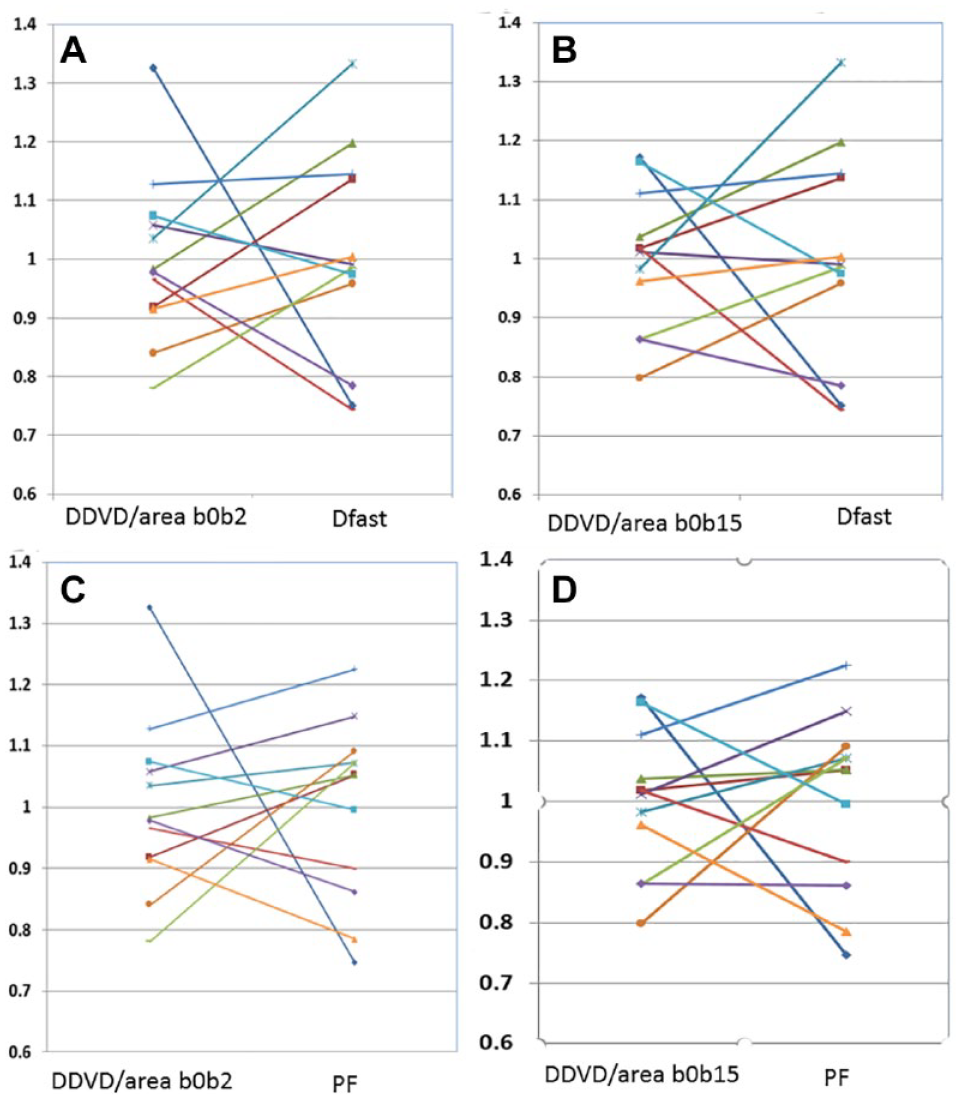
Graphical demonstration of the poor correlation between DDVD/area versus Dfast and DDVD/area versus PF for fibrotic livers. The mean measures of DDVD/area, PF, and Dfast for the 12 patients with fibrosis were rescaled to 1.
Discussion
Wang et al.,9,13,15 Huang et al.,
10
and Li et al.
14
recently demonstrated that diffusion MRI-derived IVIM measurements can offer high sensitivity in detecting liver fibrosis. However, the disadvantages of IVIM measurement include a long scan time to acquire multiple b-value imaging data, and a long scan time is often associated with notable respiration-induced motion. Dfast (D*) is also difficult to be fitted precisely.16,17 The signal difference between b = 0 s/mm2 images and b = 1 s/mm2 images can be dramatic on diffusion-weighted imaging; in particular, the vessels show high signal without a diffusion gradient, while they show a dark signal when the diffusion gradient is b = 1 s/mm2. This provides the basis for the DDVD/area analysis described in this study. This study shows that DDVD/area offered good scan-rescan repeatability and proved to be useful for the separation of livers with and without fibrosis. As could be theorized,
9
this study confirmed that the DDVD/area(b0b15) value was higher than the DDVD/area(b0b2) value, and tentatively shows that DDVD/area(b0b2) performed slightly better than DDVD/area(b0b15); however, the differences between these two approaches were broadly similar (
Fibrosis, regenerative nodule formation, and intrahepatic vasoconstriction are classical mechanisms that account for increased intrahepatic vascular resistance in cirrhosis. Mechanisms responsible for the increase in sinusoid resistance include a mechanic factor that is a direct consequence of fibrosis deposition and a dynamic component related to endothelial dysfunction, deficient intrahepatic nitric oxide production, increased vasoconstrictor production, and other factors that promote the increased contraction of hepatic stellate cells.18–20 As expected, the DDVD/area parameter (which is related to microvessel density) was shown to be weakly correlated to the IVIM perfusion parameters PF (perfusion fraction) and Dfast (perfusion-related fast diffusion). Figure 5 shows, for liver fibrosis patients, that the DDVD/area did not have a linear relationship with PF or Dfast; thus, DDVD/area, PF, or Dfast may provide related, as well as complementary, information for liver perfusion. It has been noted that the IVIM parameter Dslow is less sensitive than the perfusion parameters PF and Dfast for detecting liver fibrosis.10,13,17 This study shows that the best separation between nonfibrotic livers and fibrotic livers was achieved by a combination of DDVD/area(b0b2), PF, and Dfast ( Table 3 ). Using the same method in the current study (eq 4), we additionally quantified the distance when a combination of PF, Dfast, and Dslow was applied: 0.2488, as opposed to 0.2957 when a combination of PF, Dfast, and Dslow DDVD/area(b0b2) was applied ( Table 3 ). This difference may be important for separating marginal cases of nonfibrotic and fibrotic livers.
The same as IVIM analysis, 10 the DDVD/area measures of the three patients with chronic viral hepatitis B without fibrosis and the one patient with simple steatosis resembled those of the healthy volunteers. The diffusion and perfusion measurements of yet another four patients presented by Li et al. 14 further suggest that while the pathological process of fibrosis can drive down the liver blood perfusion (as shown by decreased Dfast and PF), mere chronic viral hepatitis B without fibrosis could have normal liver blood perfusion as well as diffusion.10,14
In comparison with IVIM analysis, DDVD analysis has the advantage of simplicity, and image data (b = 0 and b = 2 or 15 s/mm2) can be potentially acquired by a single breath-hold. In this study, for the three patients excluded for IVIM analysis due to substantial respiratory motion,
10
DDVD/area analysis could be performed satisfactorily. In fact, these three patients could be largely separated from heathy volunteers by DDVD/area analysis alone (
There are a number of limitations of this study. This is a preliminary proof-of-concept study; both data acquisition and data postprocessing can be improved in the future. The intersubject variation among healthy subjects was large in our study. We believe this can be much mitigated by increasing the number of slices scanned, as well as the b = 0 s/mm2 image and b = 2 (or b = 15 s/mm2) image being scanned by a breath-hold technique. As noted, the image data were acquired with respiratory gating in this study; thus, the b = 0 s/mm2 image and b = 2 s/mm2 (b = 15 s/mm2) image were not perfectly matched in anatomical location. Currently, the vessel pixel-removing process was done manually; how to automate this process will be one of our next research priorities. It would be particularly useful if on-the-spot DDVD/area computing can be performed immediately after the diffusion image data are acquired, to help select next imaging sequences. All our patients had liver fibrosis due to viral hepatitis B; whether results of our study can be generalized to liver fibrosis of other causes, such as nonalcoholic steatohepatitis (NASH), remains to be validated. Our volunteers were on average younger than the patients, so that patient groups and the control group were not matched in age. We did not control the meal status for this study; because postmeal and fasting status may influence blood flow to the liver, for future studies it can be recommended that patients fast for 6 h before liver imaging. 34 Finally, the patient number in this study was small; while we believe the concepts proposed in this study would be generalizable, whether very good performance of the DDVD/area to separate livers with and without fibrosis would be generalizable, and how to best utilize the DDVD parameter, requires further studies.
In conclusion, the DDVD/area analysis described in this study offered good scan-rescan repeatability and was proved to be a useful biomarker for the separation of livers with and without fibrosis, and livers with severe fibrosis tended to have even lower DDVD/area measurements than those with milder liver fibrosis. The combination of DDVD/area and IVIM parameters improved the separation of fibrotic and nonfibrotic livers. Diffusion MRI-derived perfusion biomarkers, including DDVD and IVIM, may be able to play important roles in liver fibrosis management, for both detection and longitudinal monitoring. It can be expected that the experience gained for liver fibrosis evaluation can also be useful for DDVD analysis of other organs and other pathologies, such as for the evaluation of perfusion-rich tumors.
Supplemental Material
Supplemental_Material_for_DiffusionMRIderivedVesselDensity_XiaoAndWang – Supplemental material for Diffusion MRI Derived per Area Vessel Density as a Surrogate Biomarker for Detecting Viral Hepatitis B-Induced Liver Fibrosis: A Proof-of-Concept Study
Supplemental material, Supplemental_Material_for_DiffusionMRIderivedVesselDensity_XiaoAndWang for Diffusion MRI Derived per Area Vessel Density as a Surrogate Biomarker for Detecting Viral Hepatitis B-Induced Liver Fibrosis: A Proof-of-Concept Study by Ben-Heng Xiao, Hua Huang, Li-Fei Wang, Shi-Wen Qiu, Sheng- Wen Guo and Yì Xiáng J. Wáng in SLAS Technology
Footnotes
Acknowledgements
We thank Mr. Nazmi Che-Nordin for the help in processing IVIM parameters.
Supplemental material is available online with this article.
Declaration of Conflicting Interests
The authors declared no potential conflicts of interest with respect to the research, authorship, and/or publication of this article.
Funding
The authors disclosed receipt of the following financial support for the research, authorship, and/or publication of this article: This study was partially supported by a grant from the Research Grants Council of Hong Kong SAR (project no. 2141061).

References
Supplementary Material
Please find the following supplemental material available below.
For Open Access articles published under a Creative Commons License, all supplemental material carries the same license as the article it is associated with.
For non-Open Access articles published, all supplemental material carries a non-exclusive license, and permission requests for re-use of supplemental material or any part of supplemental material shall be sent directly to the copyright owner as specified in the copyright notice associated with the article.
