
Abstract
Background:
Total ankle arthroplasty (TAA) has continued to increase in popularity as a treatment for ankle arthritis. Despite popularity, continual updates to implant designs strive for improved outcomes which has led to different implant design changes including an extended-length tibial tray to offer more distal tibia cortical coverage. The purpose of this study was to compare radiographic findings (tibial component subsidence, tibial component loosening, heterotopic ossification [HO]) and patient-reported outcome measures (PROMs) between 2 age-, gender-, and body mass index–matched TAA groups.
Methods:
This study was a retrospective review of TAA patients matched into 2 groups: group 1 patients received the extended tibial tray implant, and group 2 received the standard tibial tray implant. Pre- and postoperative lateral radiographs and PROMs (Veterans-RAND 12 [VR-12] Item Health Survey, Ankle Osteoarthritis Scale [AOS], visual analog scale [VAS], and patient satisfaction) were analyzed.
Results:
Seventy-eight patients were allocated to each group. The mean age was 66.7 years in group 1 and 66.9 years in group 2, with a mean follow-up of 44.6 months and 50.7 months, respectively. There were no significant differences between the groups for pre- and postoperative PROMs. Group 1 had higher patient satisfaction with overall care (95.4 vs 89.8, P = .019). Radiographically, the rate of HO formation was significantly lower in group 1 (38.5% vs 62.8%, P < .001), and group 1 also had greater plantarflexion (P = .096) and significantly less dorsiflexion (P = .008).
Conclusion:
Results appear to indicate that using TAA implants with an extended-length tibial tray is associated with more complete distal tibia cortical coverage, a numerically lower but statistically nonsignificant rate of tibial component subsidence, less heterotopic ossification formation, a trend toward greater postoperative plantarflexion, and higher patient satisfaction with overall care.
Level of Evidence:
Level III, retrospective cohort study.

Introduction
Although ankle arthrodesis remains a reliable surgical treatment option, total ankle arthroplasty (TAA) continues to increase in popularity for the treatment of end-stage ankle arthritis. 1 Despite this increased popularity, continual updates to implant designs strive for improved outcomes. 2 The Salto Talaris fixed-bearing prosthesis has been available in the United States since 2006. The original design consisted of a tibial implant with four sizes and one length option. More recently, an extended-length tibial tray was added to offer more distal tibia cortical coverage. 3 Although prior studies have identified potential factors that may contribute to failure or worse outcomes in TAA including comorbidities such as diabetes and obesity, 4 tobacco use, 5 and implant malpositioning, 6 few studies have investigated the role of distal tibia cortical bone coverage as it relates to overall radiographic and clinical outcomes. The purpose of this study was to compare the rates of tibial component subsidence, tibial component loosening, heterotopic ossification (HO) formation, postoperative range of motion (ROM), and patient-reported outcome measures (PROMs) between 2 matched groups of patients: TAA with Salto Talaris extended-length tibial tray components with increased distal tibia cortical bone coverage vs TAA with Salto Talaris standard length tibial tray components. The authors hypothesize that having metal to cortical bone contact instead of mechanically less compression-resistant cancellous bone support will reduce shifting and/or subsidence of the implant.
Materials and Methods
This retrospective study was conducted under institutional review board approval. An initial 337 patients who underwent a primary TAA between January 2019 and October 2021 with Salto Talaris implants (Smith & Nephew) were included for review Figure 1. Patients were included if they had a minimum of 2-year clinical follow-up, an initial 6-week and follow-up 5-view postoperative radiographs, and had a documented body mass index (BMI) in the medical chart. Exclusion criteria included use of another component other than Salto Talaris, incomplete PROMS, incomplete or nonweightbearing postoperative radiographs, and lost to follow-up/declined research participation. One hundred fifty-six patients were matched into 2 groups for age, gender, and BMI. Group 1 consisted of patients who received TAA with the extended-length tibial tray implant and group 2 consisted of patients who received the standard-length tibial tray implant. Pre- and postoperative radiographs were analyzed for ROM and the presence of subsidence, loosening, HO formation, and tibial implant coverage. ROM was measured using plantarflexion and dorsiflexion weightbearing lateral radiographs; the angle was taken of lines between the anterior border of tibial diaphysis and calcaneal tuberosity to the first metatarsal head. Subsidence was evaluated through the serial radiographs and was defined as >5° of change in alignment of the tibial component or >5 mm of change in talar position. The degree of lucency was determined by measuring the distance from the prosthesis to the edge of the lucent line. Implants with global progressive lucency or change in alignment as described above were deemed to be loose; no specific measurement was used to confirm loosening, but rather a change in position of the implant was noted. HO was evaluated and noted in anterior or posterior to the prosthesis with significant HO to be >50% of the joint space. Subsidence on the tibial side was defined as above with angular change in alignment of >5°. Failure was defined as implant loosening or subsidence that resulted in prosthetic revision surgical procedure. Subsidence and HO represent distinct radiographic entities: subsidence refers to a change in the position or alignment of the tibial implant relative to the bone, whereas HO refers to ectopic bone formation at the periphery of the joint space unrelated to implant position. Loosening was determined on the basis of radiographic criteria alone; clinical symptoms were not used as a diagnostic criterion for loosening in this study. All radiographic analysis was performed by a foot and ankle orthopaedic surgery fellow (CJT) and a fellowship-trained orthopaedic surgeon who specializes in foot and ankle surgery (PMC) whose surgical patients were not included.
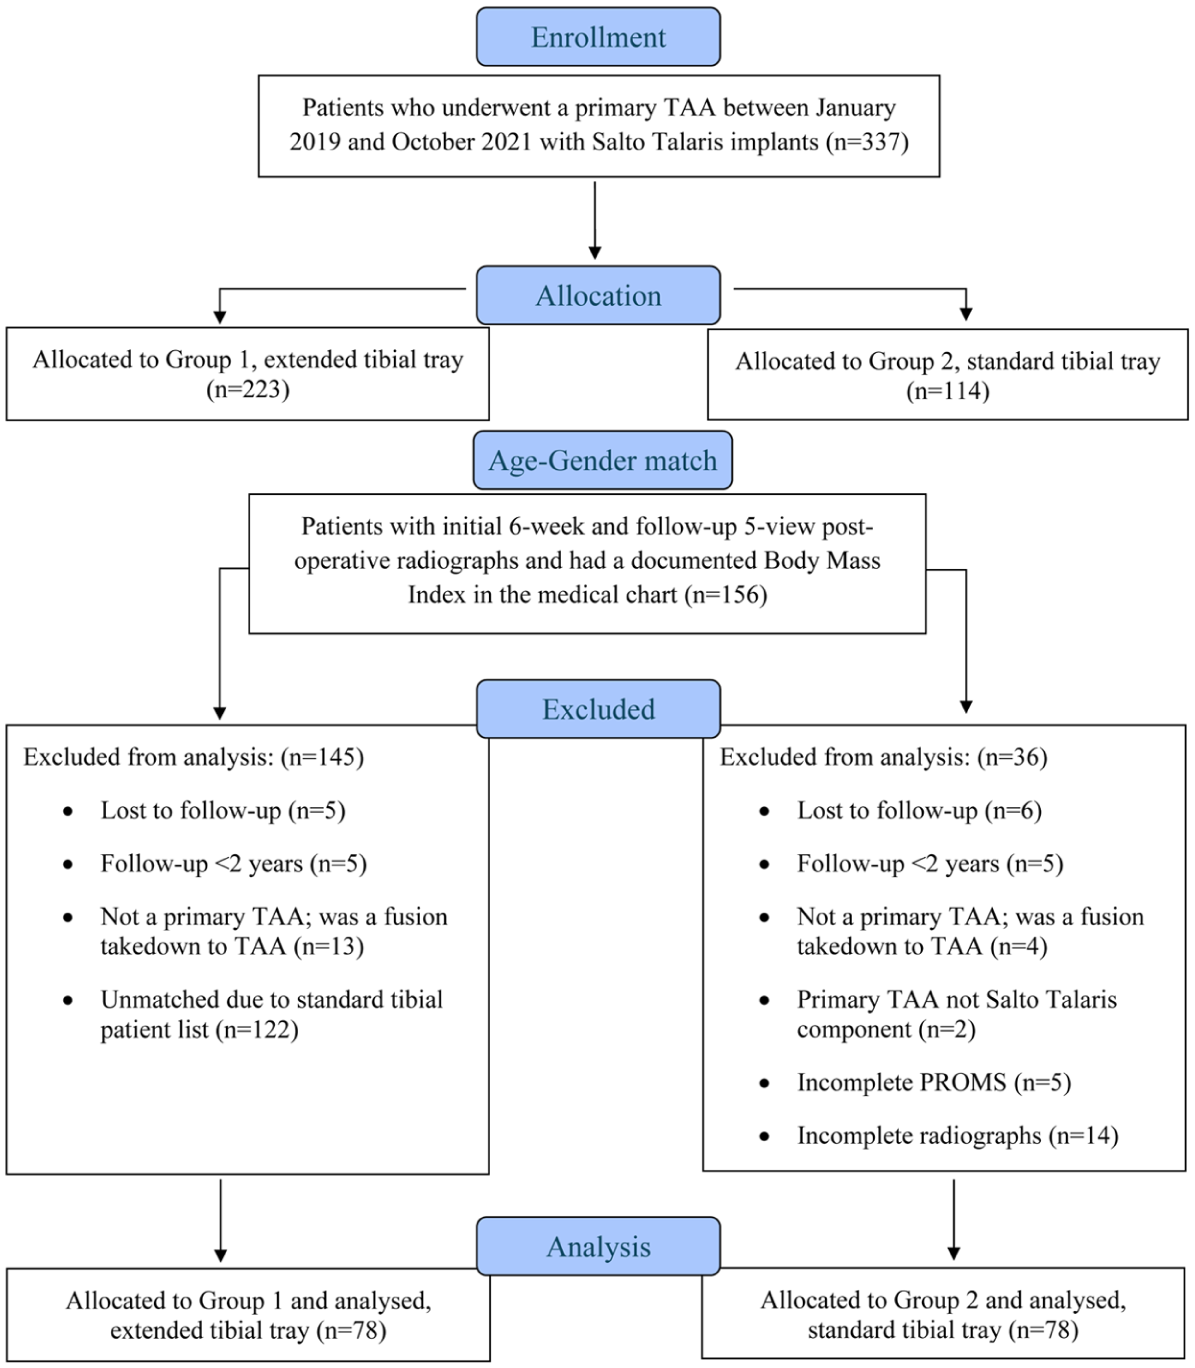
Total ankle arthroplasty consort diagram.
Patient data included age, sex, BMI, diabetes diagnosis, smoking status, concomitant procedures, and any postoperative complications. PROMs were collected prospectively at the preoperative visit and each postoperative visit at the following intervals: 3 months, 6 months, and annually thereafter. PROMs analyzed included the Veterans-RAND 12 (VR-12) Item Health Survey, Ankle Osteoarthritis Scale (AOS), visual analog scale (VAS), and Patient Satisfaction with overall care. The primary endpoint was looking for differences in subsidence rates between the trays that have full front to back coverage and those that do not.
Statistical Analysis
In the absence of prior literature directly comparing subsidence rates between tibial trays with full front-to-back cortical coverage and those without, the effect size from Takenaka et al 7 was used to approximate the sample size of the current study. In their study, anterior placement of the talar component was associated with significantly greater subsidence compared with posterior placement (2.1 ± 2.0 mm vs 0.6 ± 1.4 mm, P = .017). Using these values, we calculated a Cohen d effect size of 0.87, representing a large effect. A future study aiming to detect a similar difference with 80% power and α = 0.05 would require approximately 21 patients per group. Descriptive statistics were reported for patient demographics. Paired sample t tests were used to compare PROMs at preoperative and latest follow-up evaluation as well as used to compare radiographic information including degree of tibial cortical contact (full tibial cortical contact being defined as the metal tray of the tibial component being at least 50% covering the undersurface of both the anterior and posterior tibial cortices on the standing lateral ankle radiograph), HO formation, subsidence, loosening, as well as degree of plantar flexion and dorsiflexion between the matched patients. For all radiographic assessment, the average of both readers’ measurements was reported. Pearson correlation coefficient was computed for continuous numeric measurements and Spearman rank correlation coefficient was computed for the binary assessments to determine interrater reliability. In this study, coefficients less than 0.4 were considered weakly reliable, coefficients between 0.4 and 0.6 moderately reliable, and coefficients greater than 0.6 strongly reliable. For all statistical tests, significance was set at P <.05.
Results
Seventy-eight matched patients (45 males; 33 females) were included in each group with a total of 156 patients included in the analysis. The mean age was 66.7 years in group 1 and 66.9 years in group 2, with a mean follow-up of 44.6 and 50.7 months, respectively. Patient demographics are summarized in Table 1. Figure 2 notes the ancillary procedures which took place at the time of the index TAA.
Patient Demographics Between Group 1 and Group 2.
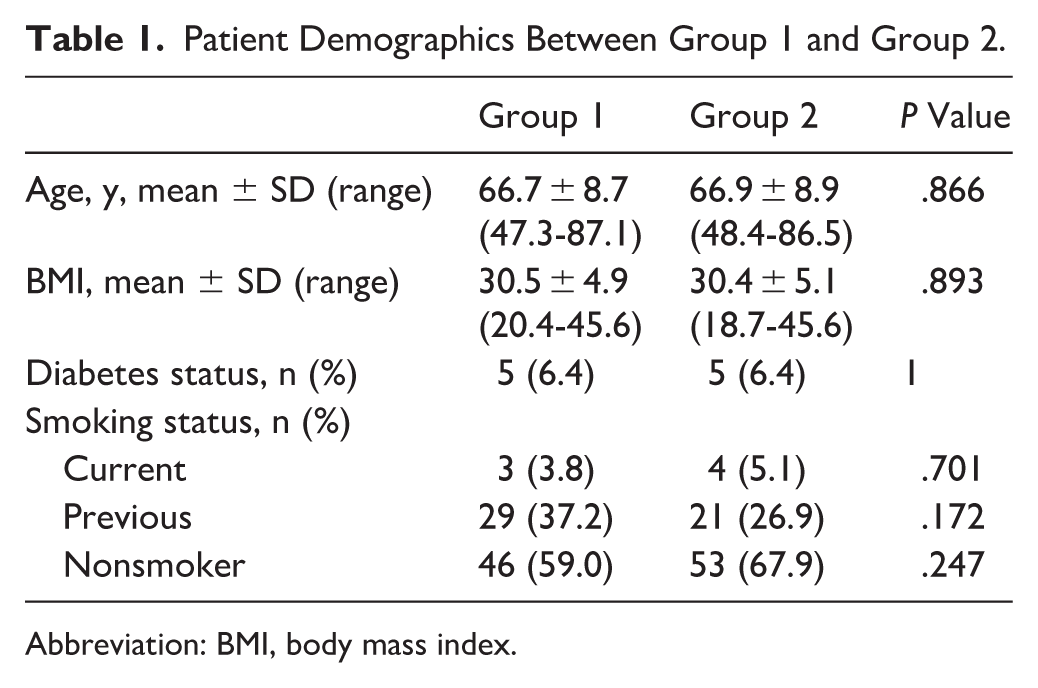
Abbreviation: BMI, body mass index.
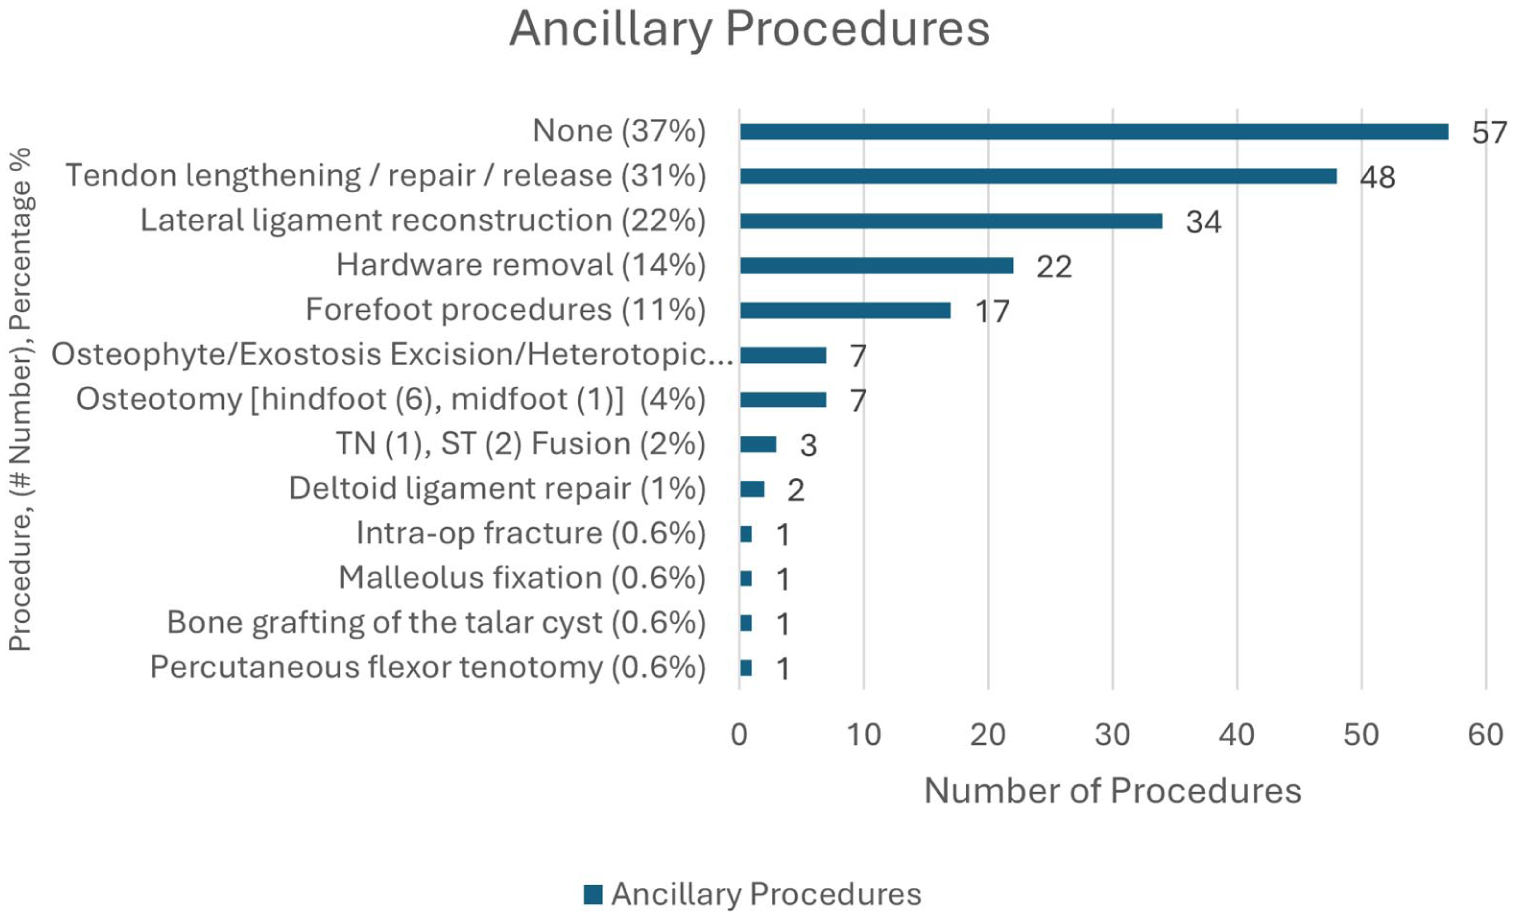
Ancillary procedures at the time of the index total ankle arthroplasty.
No statistically significant differences were found between the two matched groups in terms of preoperative VR-12 mental or physical scores, AOS pain or disability score, and VAS pain score, as illustrated in Table 2. Postoperative PROMs and radiographic outcomes are summarized in Table 3. All the postoperative PROMs were similar between group 1 and group 2 at the latest follow-up; however, group 1 did have significantly higher patient satisfaction with overall care (95.4 vs 89.6, P = .019).
Preoperative Patient-Reported Outcome Measures.
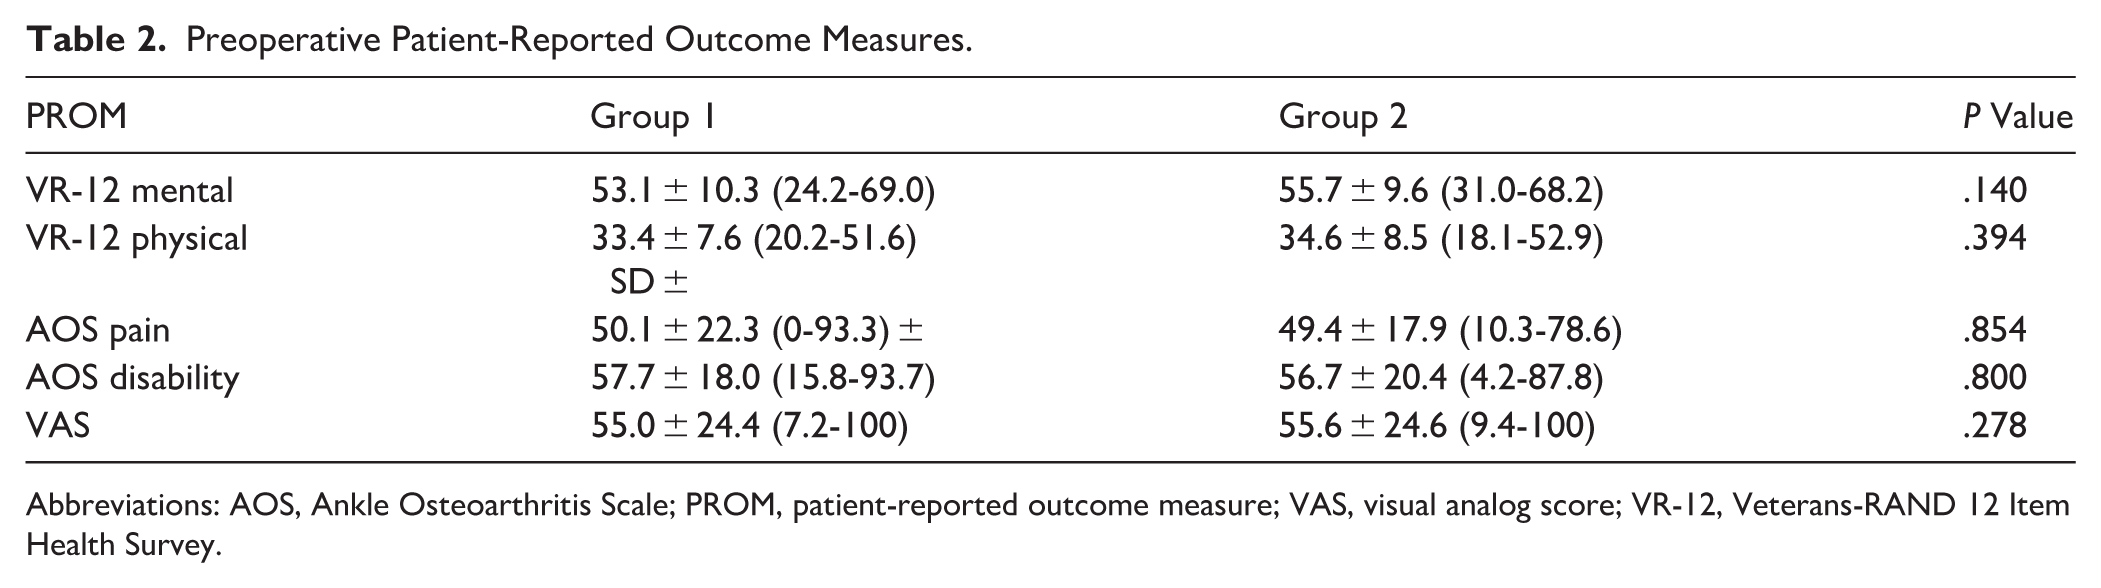
Abbreviations: AOS, Ankle Osteoarthritis Scale; PROM, patient-reported outcome measure; VAS, visual analog score; VR-12, Veterans-RAND 12 Item Health Survey.
Postoperative Patient-Reported Outcomes Measures and Radiographic Outcomes.
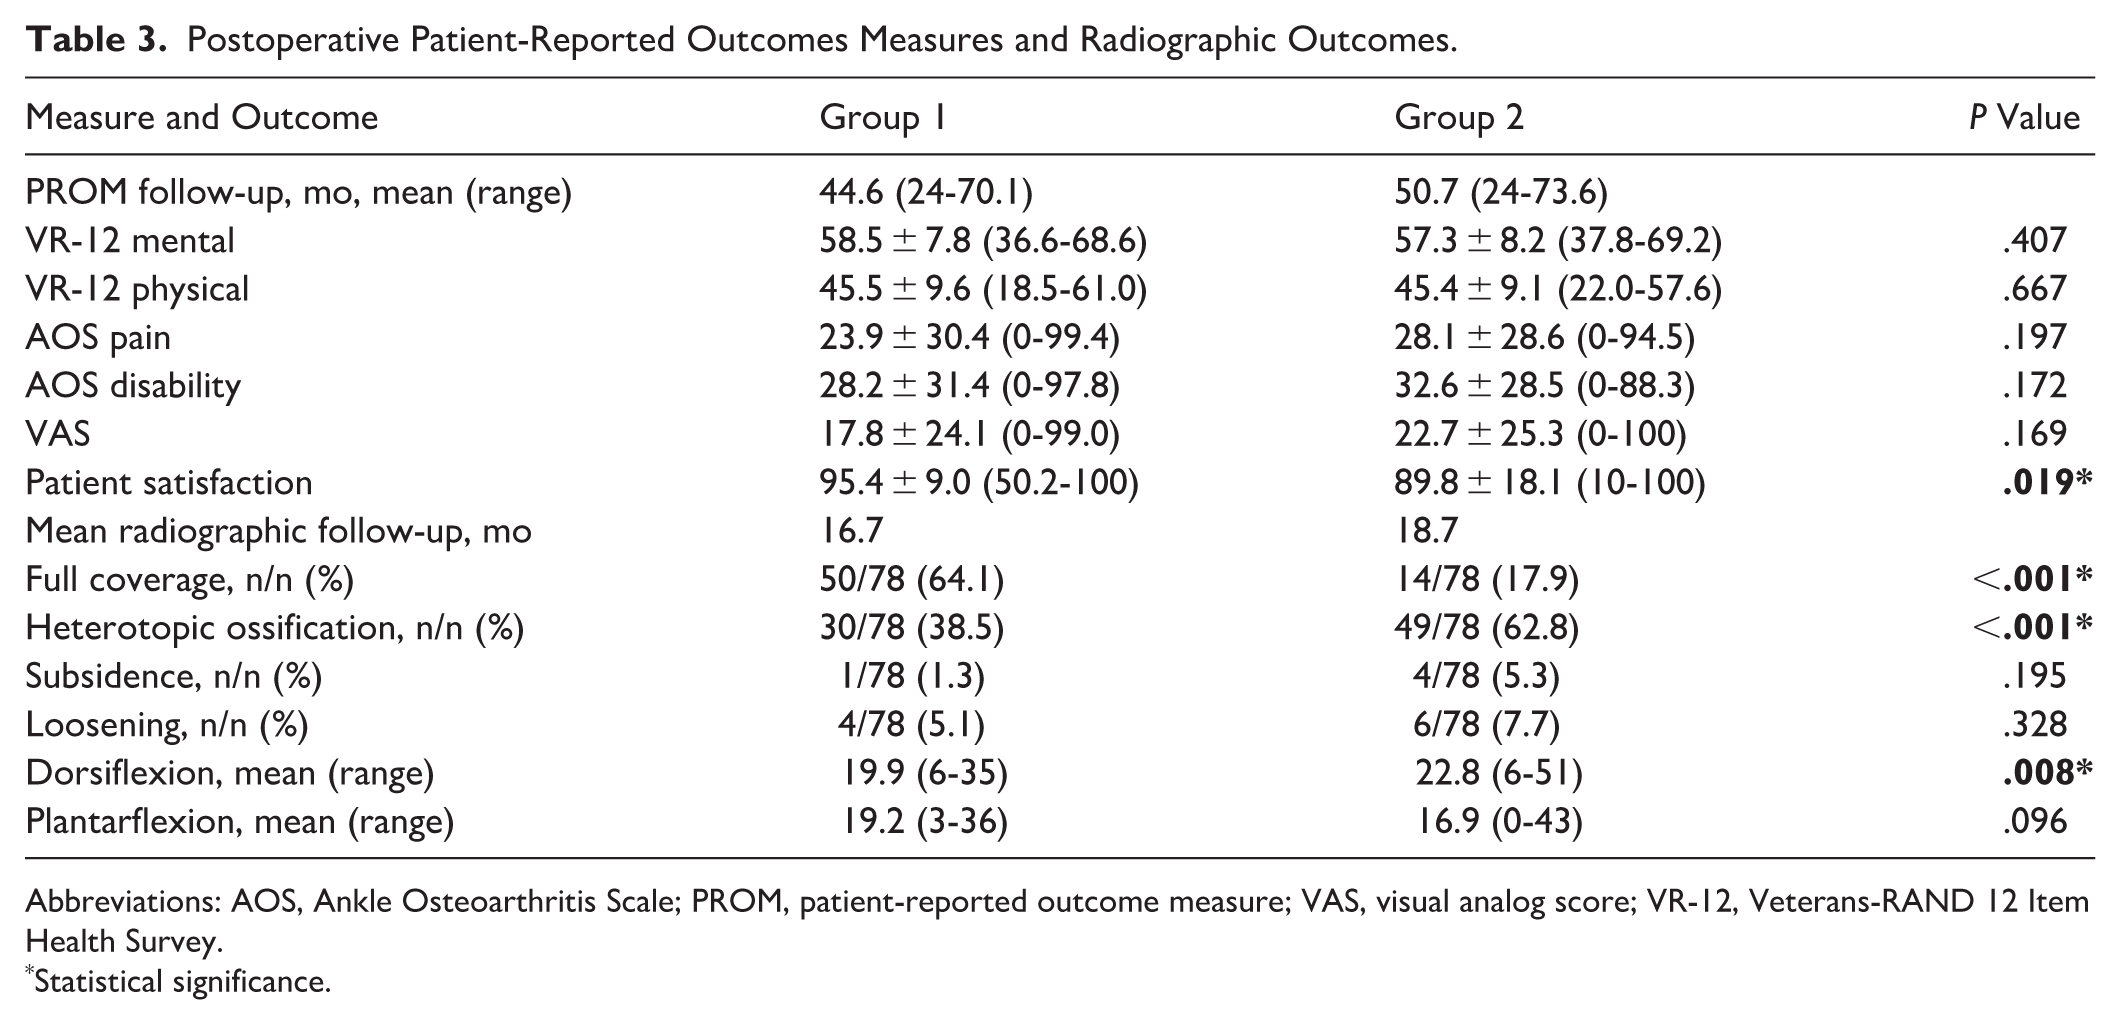
Abbreviations: AOS, Ankle Osteoarthritis Scale; PROM, patient-reported outcome measure; VAS, visual analog score; VR-12, Veterans-RAND 12 Item Health Survey.
Statistical significance.
Radiographically, the rate of HO formation (38.5% vs 62.8%, P < .001) was significantly higher in group 2 and postoperative dorsiflexion was significantly different between groups (P = .008), whereas plantarflexion showed a nonsignificant numerical difference (P = .096). In group 1, there were 28 patients who did not have full coverage and 66% of those had HO. In group 2, of the 64 patients who did not have full coverage, 70.3% had HO. The 1 patient in group 1 whose tray subsided had 82% tibial coverage whereas the 4 patients in group 2 had an average of 77% tibial coverage. Additionally, 8 patients in group 1 had posterior overhang with an average of 1.75 mm, and group 2 had 1 patient with posterior overhang of 1 mm. Undersized implants posteriorly were identified in 2 patients in group 1 with average of 2.5 mm. Both patients would have had a larger undersize if the standard regular component was inserted. Thirteen patient implants in group 2 were undersized posteriorly with an average of 4.5 mm.
All radiographic measurements had strong reliability between the 2 readers, except for dorsiflexion in group 2 (moderate correlation coefficient = 0.61). Figure 3 demonstrates an example of a patient from group 1 without tibial component subsidence, and a group 2 patient who exhibited postoperative radiographic tibial subsidence. A visual comparison of a group 1 patient who did not develop HO formation and a group 2 patient who did develop postoperative HO formation is seen in Figure 4. Finally, Figure 5 demonstrates an example of a group 1 patient’s postoperative plantarflexion compared to a group 2 patient’s postoperative plantarflexion when seen on the lateral plantarflexion weightbearing radiograph.
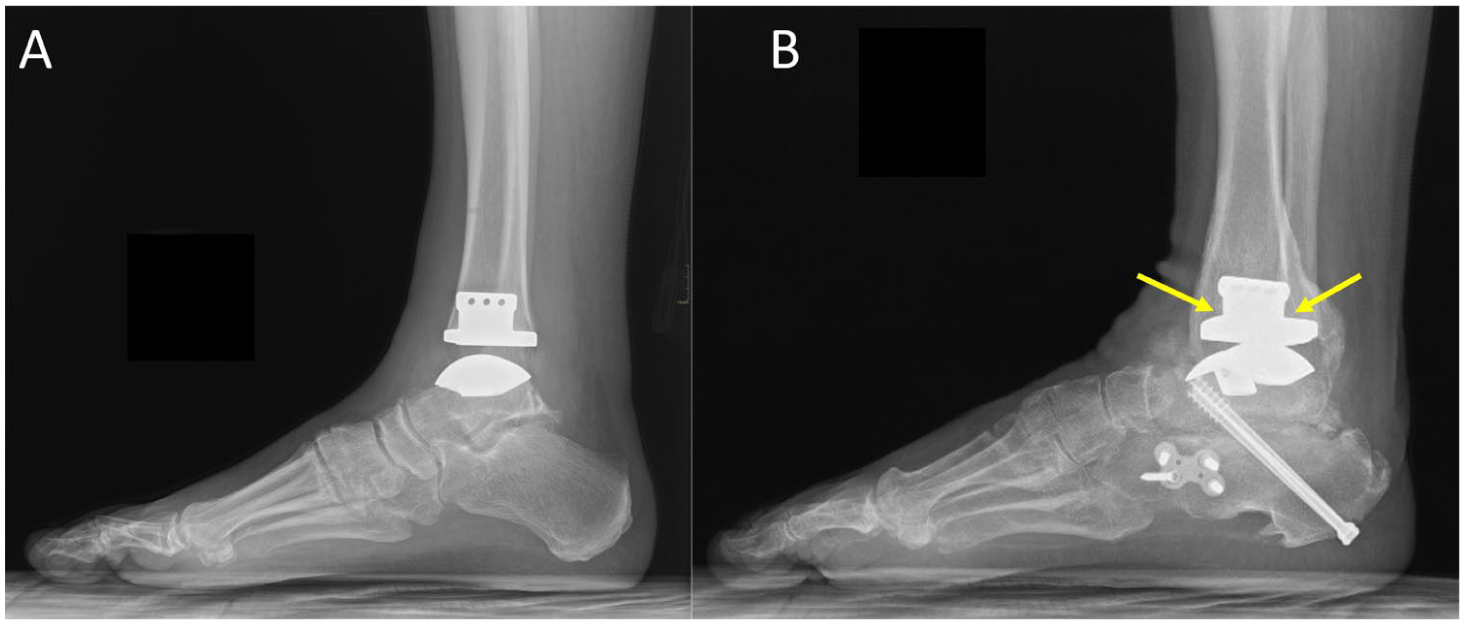
(A) Group 1 patient (56-year-old female) demonstrates a lateral radiographic without tibial component subsidence compared to (B) a group 2 patient (59-year-old male) with radiographic tibial component subsidence (yellow arrows).
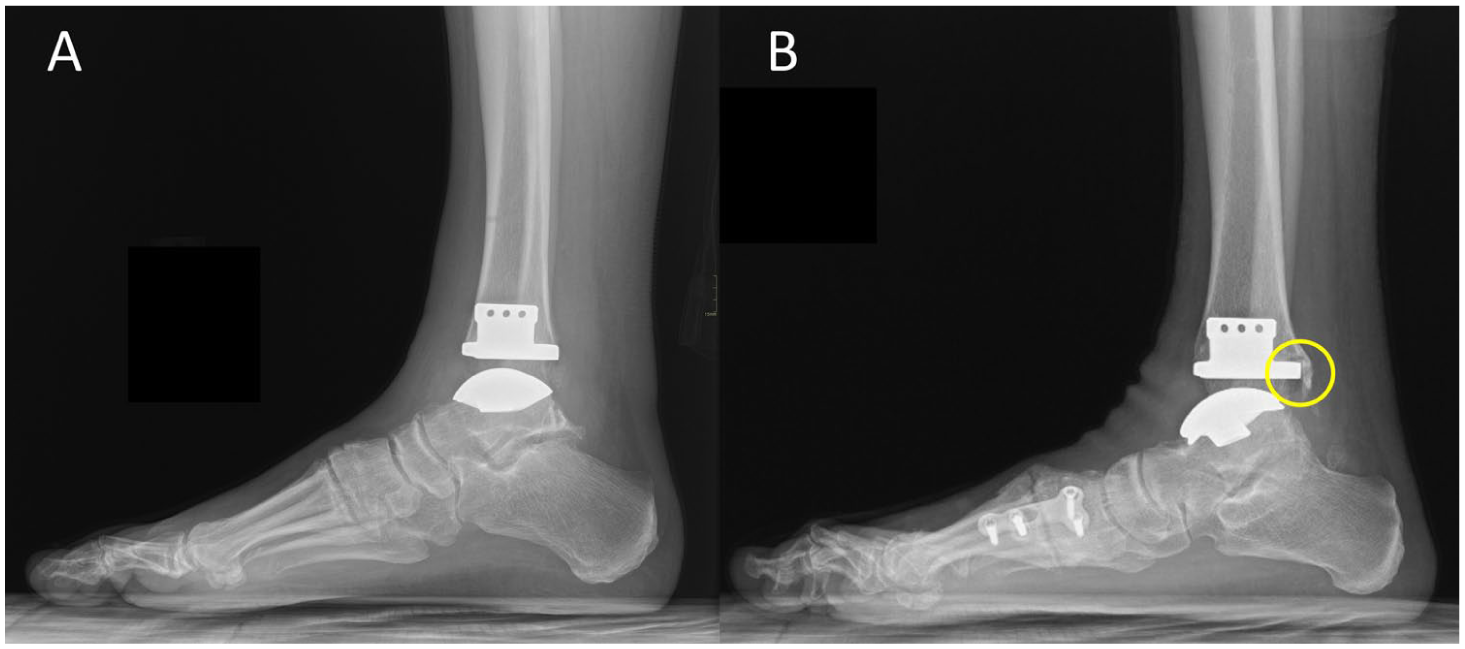
(A) Group 1 patient (56-year-old female) demonstrates a lateral radiographic without postoperative HO formation compared to (B) a group 2 patient (67-year-old male) with radiographic evidence of HO formation (yellow circle).
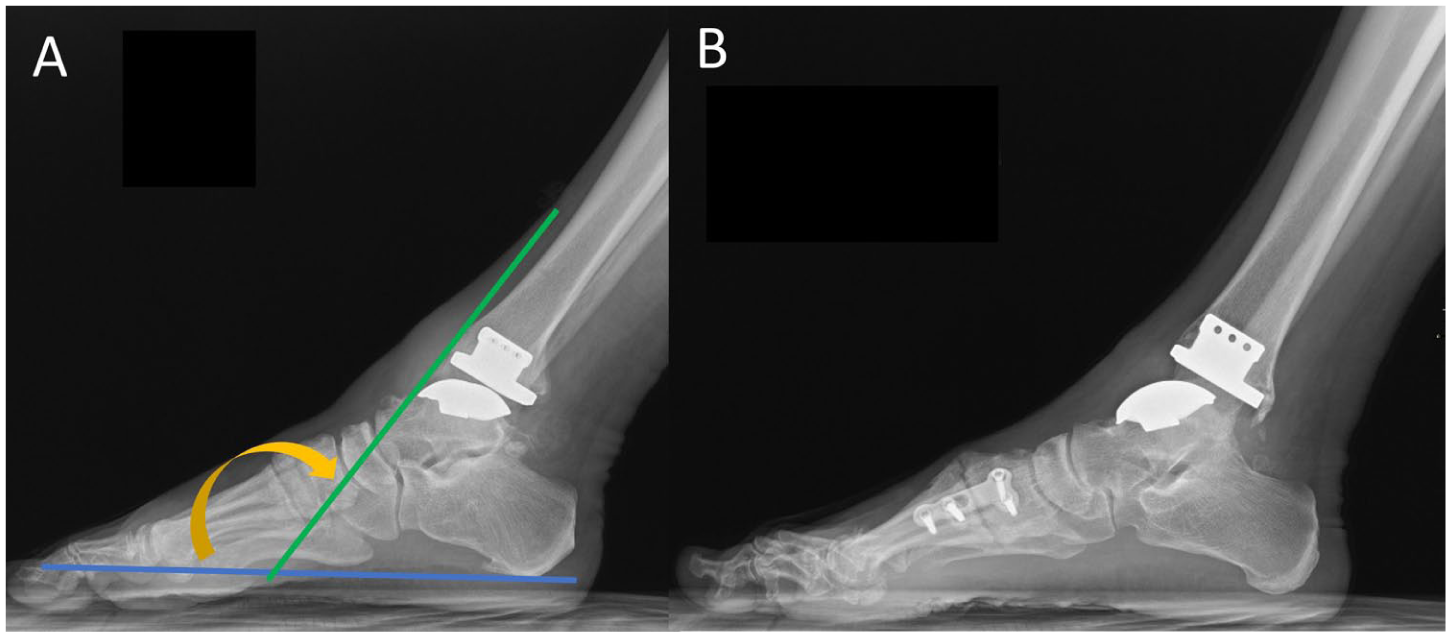
Plantarflexion weightbearing lateral radiographs of the right ankle of (A) a group 1 patient (54-year-old male) compared to (B) a group 2 patient (67-year-old male). Angle measurement (orange arrow) is taken of lines between the anterior border of the tibial diaphysis (green line) and calcaneal tuberosity to the first metatarsal head (blue line).
In total, 7 patients underwent subsequent surgeries (Table 4). Five of the 7 TAA cases ultimately ended in failures, including 3 patients requiring revision TAA and 2 patients who developed a postoperative infection and underwent TAA explant and cement spacer placement.
Subsequent Surgical Procedures for Patients Who Received TAA With the Extended-Length Tibial Tray Implant (Group 1) and Those Who Received the Standard-Length Tibial Tray Implant (Group 2).

Abbreviations: ORIF, open reduction and internal fixation; TAA, total ankle arthroplasty; TN, talonavicular.
Discussion
This age-, gender-, and BMI-matched cohort study reveals interesting radiographic and clinical outcome differences between patients who received TAA with a tibial component that offered full distal tibia cortical bone coverage and patients who did not have full distal tibia cortical bone coverage. To our knowledge, there is limited published literature specifically investigating the differences in outcomes between this tibial component design feature.
The only study found to look specifically at the difference in radiographic outcomes in patients who had TAA with different lengths of tibial components that offered complete coverage of the distal tibia cortical bone was a retrospective analysis of 107 patients performed by King et al 8 in 2013. Their study found that decreased distal tibia cortical bone coverage was associated with more HO formation. 8 The current study also found statistically significantly higher rates of HO formation in patients who did not have full distal tibia cortical bone coverage.
Whether the development of HO formation leads to clinical symptoms is still unclear.8-14 Some studies such as the investigation published by Wood and Deakin 15 in 2003 as well as Choi and Lee 12 in 2011 reported that HO formation after TAA was not found to result in worse clinical outcomes. Butler et al’s 11 systematic review and meta-analysis also found that HO is a common finding following TAA and is not associated with inferior clinical outcomes. However, other studies have demonstrated poorer results associated with HO formation. 16 Our investigation demonstrated that patients in group 1 had statistically significantly lower rates of HO formation and higher patient satisfaction with overall care scores. Although this was an association seen in our study, causation cannot be determined in this analysis. The study published by Lee et al 16 in 2011 found that HO formation was associated with limited ROM, which confirmed findings from an earlier study published by Valderrabano et al 17 in 2004 that found lower ROM associated with HO formation. When PROMs and ROM were compared in all 156 patients in the current study with HO and without HO, no significant difference was seen in any outcome measure, including patient satisfaction with overall care (Table 5). Although it is true that previous studies are not conclusive regarding the clinical relevance of HO formation, our study indicated that it was associated with lower postoperative plantar flexion and differences in PROMs.8-14
PROMs and Range of Motion in All Patients With and Without HO Postoperatively.

Abbreviations: AOS, Ankle Osteoarthritis Scale; HO, heterotopic ossification; PROM, patient-reported outcome measure; VAS, visual analog score; VR-12, Veterans-RAND 12 Item Health Survey.
There are several limitations to our study. The retrospective nature of our study allows no control for patient clinical follow-up and/or imaging. For clinical follow-up factors, many of our patients live out of state and/or >3 hours’ travel from the clinic, they were doing well and/or did not desire to return to clinic. Patients’ clinical follow-up for imaging and the completion of PROMs are different follow-up time intervals. For imaging, patients were not assessed preoperatively for ROM and, postoperatively, the assessors of the radiographs were not blinded to the intervention and that may introduce a possible bias in the assessment of radiographic outcomes. The absence of postoperative weightbearing computed tomography imaging to assess subsidence or HO was not obtained, which could offer detection of osteolysis and subtle implant changes. We acknowledge the fact that preoperative ROM are missing, which is a significant limiting factor in our ability to draw any conclusions about postoperative motion. In addition, we do not have any positive findings with respect to pain or subsidence. This study has relatively short-term follow-up and perhaps if the cohorts were followed to mid- and long term, a greater difference in outcomes would be seen between the two cohorts. Further follow-up is needed. It is also unclear, based on our subgroup analysis of group 1, that the presence of HO is associated with decreased plantarflexion or patient satisfaction.
This study may suggest that for future designs, the more the tibial tray contacts the mechanically more solid anterior and posterior distal tibial cortices (vs cancellous surface only), the less the implant may tend to subside, loosen, and ultimately fail, thus theoretically worsening the patient-reported outcomes. This would be analogous to a house built on a solid foundation. Future prospective studies are needed for stronger strength of evidence.
Conclusion
In conclusion, results appear to indicate that using TAA implants with an extended-length tibial tray with full distal tibia cortical bone coverage is associated with a numerically lower but statistically nonsignificant rate of subsidence, less HO formation (with unknown clinical significance), a trend toward greater postoperative plantarflexion (P = .096), and higher patient satisfaction with overall care. Future analysis with longer-term follow-up as well as a larger patient cohort may help shed even more light into use of TAA implants with and without full tibia cortical bone coverage.
Supplemental Material
sj-pdf-1-fao-10.1177_24730114261452667 – Supplemental material for Use of an Extended-Length Tibial Tray in Total Ankle Arthroplasty: Rate of Subsidence, Loosening, Heterotopic Bone Formation, and Clinical Outcomes
Supplemental material, sj-pdf-1-fao-10.1177_24730114261452667 for Use of an Extended-Length Tibial Tray in Total Ankle Arthroplasty: Rate of Subsidence, Loosening, Heterotopic Bone Formation, and Clinical Outcomes by Christopher J. Traynor, Hui Zhang, Carissa C. Dock, Rebecca Stone McGaver, J. Chris Coetzee, Jeffrey D. Seybold, Kayla J. Seiffert, Paul M. Cammack and Bryan D. Den Hartog in Foot & Ankle Orthopaedics
Footnotes
ORCID iDs
Ethical Considerations
Ethical approval for this study was obtained from Advarra, Columbia, MD Institutional Review Board (Pro00057134).
Funding
The authors disclosed receipt of the following financial support for the research, authorship, and/or publication of this article: This work was supported by Smith & Nephew and directed toward TCO Research Support.
Declaration of Conflicting Interests
The authors declared the following potential conflicts of interest with respect to the research, authorship, and/or publication of this article: Hui Zhang, MD, reports outside of this work: Fusion Orthopedics, consultant; and Cinch Medical, consultant. J. Chris Coetzee, MD, reports outside of this work: Responsive Arthroscopy LLC, stock; Arthrex, Inc, other professional activities; DePuy Synthes Products LLC, other professional activities; and Smith & Nephew, Inc, other professional activities. Jeffrey D. Seybold, MD, reports outside of this work: Enovis, IP royalties, paid consultant, and paid presenter or speaker. Paul M. Cammack, MD, reports outside of this work: Paragon 28, paid consultant; and Arthrex, Inc, paid consultant. Bryan D. Den Hartog, MD, reports outside of this work: FootInnovate.com, stock or stock options; and Smith & Nephew, IP royalties. Disclosure forms for all authors are available online.
References
Supplementary Material
Please find the following supplemental material available below.
For Open Access articles published under a Creative Commons License, all supplemental material carries the same license as the article it is associated with.
For non-Open Access articles published, all supplemental material carries a non-exclusive license, and permission requests for re-use of supplemental material or any part of supplemental material shall be sent directly to the copyright owner as specified in the copyright notice associated with the article.