
Abstract
Background:
Success after total ankle replacement (TAR) requires accurate implant sizing so the tibial component achieves adequate cortical support. Implant fit is challenging in smaller and female patients because medial-lateral (ML) constraints may force selection of tibial components undersized in the anterior-posterior (AP) dimension, although this has not been investigated in arthritic ankles. This study sought to quantify distal tibia morphology in TAR patients and compare those measurements to implant dimensions.
Methods:
Ninety-nine consecutive TAR patients with preoperative weightbearing computed tomographic (CT) scan were retrospectively reviewed. Multiplanar reformatting aligned axial slices orthogonal to the tibial anatomical axis. Tibial AP length and ML width were measured at 8 and 10 mm resection depths. Manufacturer specifications for the implanted tibial tray were used to obtain AP and ML dimensions. Dimensional mismatch was defined as anatomic measurement minus implant dimension (negative = overhang, positive = undercoverage). Sex-based comparisons used unequal-variance t tests; multiple linear regression evaluated predictors of mismatch.
Results:
There were significant differences in implant coverage between genders. Tibial implants took up significantly greater amounts of the ML plane in women (mean 2.3 mm difference), P < .01; meanwhile, with the numbers available, no statistically significant difference in AP mismatch between sexes could be detected (P = .81). In multiple regression analysis, these differences were primarily explained by body size, but gender had a statistically significant effect on implant coverage (1.15, 95% CI 0.28-2.02, P < .01).
Conclusion:
In this cohort, we found that tibial trays consistently exceeded native AP dimensions while leaving limited ML clearance, particularly in smaller and female tibiae. These constraints may approach thresholds associated with medial malleolar fracture and gutter impingement. Implant systems decoupling AP and ML sizing or offering narrower ML options may better accommodate distal tibial morphology. Clinical implications remain to be established.
Level of Evidence:
Level III, retrospective cohort study.
Keywords
Introduction
Total ankle replacement (TAR) has become an increasingly reliable, motion-preserving alternative to ankle arthrodesis for patients with end-stage tibiotalar arthritis. Modern implant systems have substantially improved fixation, alignment, and polyethylene conformity. 1 Nevertheless, survivorship still lags behind hip and knee arthroplasty, with registry and multicenter studies reporting 10-year survival between 85% and 95%, depending on implant type and patient selection. 2 Mechanical complications, including tibial subsidence, radiolucency, and early loosening, remain key factors limiting long-term success.3-5
In a physiologic ankle, compressive load is distributed through subchondral trabecular bone. TAR resection removes this trabecular bone, eliminating the normal load-distributing pathway and requiring the implant to transfer load directly to the cortical shell, making adequate cortical contact a prerequisite for stable fixation, and critical at higher resection levels.3,6 The distal tibial plafond has a thin and irregular cortical shell with limited subchondral bone stock, predisposing the construct to edge loading and micromotion at the bone–implant interface.7-9 Finite-element and cadaveric investigations have demonstrated that fixation stability depends on cortical engagement and tray geometry: inadequate cortical support reduces the load-bearing interface and increases micromotion, whereas excessive mediolateral (ML) overhang concentrates edge stresses on the distal tibial cortex and medial gutter.5,10 These stress concentrations may result in symptomatic medial gutter impingement, stress reactions, or stress fractures of the medial malleolus. Collectively, these biomechanical imbalances help explain why early tibial migration and radiolucency are among the most commonly observed failure patterns.3,4,11
Current TAR systems typically offer 4 to 5 discrete tibial tray sizes. Morphometric and statistical shape-modeling studies demonstrate meaningful geometric sex differences in the distal tibia: men generally exhibit larger overall dimensions, whereas women possess smaller tibiae with proportionally narrower tibial morphology width. 12 As a result, available implant sizes may not simultaneously accommodate both dimensions. A tray selected to match the anterior-posterior (AP) length may leave insufficient ML space, bringing the implant close to the medial cortex or gutter and increasing the risk of malleolar fracture or impingement, whereas selecting a smaller size to preserve ML containment may result in AP undercoverage. 10
Prior morphologic studies have characterized distal tibial geometry in healthy individuals, but few have examined arthritic ankles where deformity and remodeling further constrain implant fit. Global tibial morphology is informative, but it is resection-plane geometry that dictates the cortical footprint for fixation. The distal tibial metaphysis narrows asymmetrically, and small differences in resection depth (8 vs 10 mm) meaningfully alter both cortical perimeter and local AP and ML dimensions. 13 Despite known sex-based geometric variation, few studies have compared implanted tibial trays directly with the cortical footprint at clinically relevant resection planes, leaving implant sizing adequacy for smaller and female ankles poorly defined.
Therefore, the purpose of this study was to characterize tibial implant–bone relationships in patients undergoing TAR by comparing native morphology at 2 standard resection depths (8 and 10 mm) with the dimensions of implanted tibial trays. Specifically, we sought to (1) quantify anteroposterior and mediolateral tibial geometry at each resection plane, (2) evaluate sex-based differences in distal tibial morphology, and (3) determine the magnitude and direction of implant-bone mismatch in a clinical TAR cohort. We hypothesized that female tibiae would demonstrate proportionally smaller ML dimensions relative to implant width, resulting in greater mismatch and reduced cortical support compared with male patients.
Methods
This was a computerized modeling study using preoperative imaging from a consecutive series of TAR patients from an institutional registry within 1 year. Institutional review board approval was obtained prior to study initiation. Ninety-nine patients (55 male, 44 female) with complete preoperative weightbearing computed tomography (WBCT) scans were included. Patients with previous hardware and/or incomplete scans were excluded. The etiologies of ankle arthritis in the cohort included post-traumatic arthritis (n = 29; 29%), primary arthritis (n = 34; 34%), chronic instability–associated arthritis (n = 20; 20%), flatfoot-related arthritis (n = 9; 9%), inflammatory arthritis (n = 3; 3%), and prior ankle fusion (n = 4; 4%).
Anatomic Measurements
All WBCT scans were viewed in the institutional picture archiving and communication system (PACS) using multiplanar reformatting aligned to the tibial anatomical axis. The axial plane was oriented normal to the tibial anatomical axis, the sagittal plane was aligned with the tibial plafond, and the coronal plane bisected the fibular groove as shown in Figure 1. All measurements were taken in the axial plane. Axial reformats were generated at 8 and 10 mm above the joint, representing typical bone resection depths in TAR, depending on the system, in accordance with prior techniques in the literature. 2 At each resection plane, 6 measurements were taken (Figure 1). Three AP measurements were obtained perpendicular to the tibial axis:
Medial AP line tangent to the fibular notch
Midpoint AP line through the geometric center of the resection surface
Lateral AP line along the lateral cortical margin
Next, 3 ML measurements were obtained orthogonal to the AP lines:
Anterior ML line aligned with the anterior border of the fibular notch
Midpoint ML line through the central region of the surface
Posterior ML line aligned with the posterior border of the fibular groove 14
The mean of the 3 AP and 3 ML measurements defined the average anatomic AP length and average anatomic ML width, respectively. Landmarks such as the fibular notch and fibular groove were selected to ensure measurement consistency.
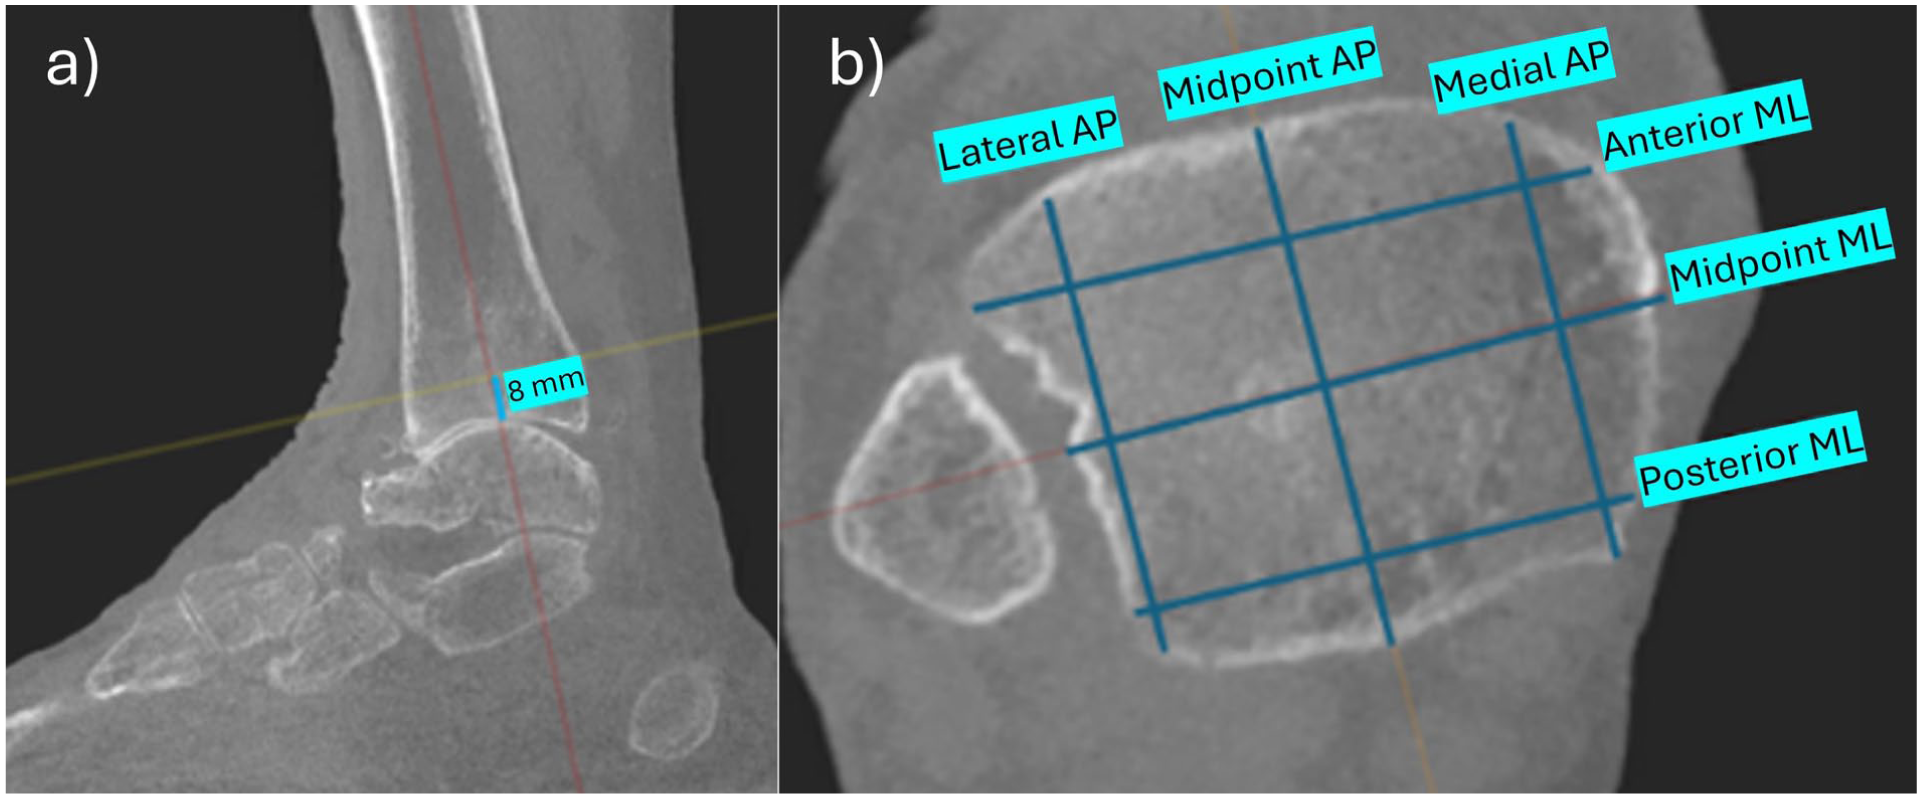
(A) Sagittal slice illustrating multiplanar reformatting used to align the axial plane perpendicular to the tibial anatomical axis, with the resection plane defined 8 mm distal to the native joint line. (B) Reformatted axial plane positioned 8 mm below the joint line to simulate the resection level, demonstrating AP and mediolateral (ML) measurements.
Implant Measurements
Implant dimensions were obtained directly from the manufacturer surgical technique guides for the 3 TAR systems used at the study institution in this patient population: Wright Medical Inbone II, Wright Medical Infinity, and Exactech Vantage. These 3 systems were pooled to reflect the institutional case mix rather than to evaluate any individual design. Manufacturer-reported dimensions, which may reflect outer implant geometry rather than bone-contact surface architecture, were used as they represent the specifications surgeons reference for sizing decisions. For each system, the AP length and ML width reported by the manufacturer for the tibial tray were recorded. The implant size used for each patient was identified from the operative note, and the corresponding manufacturer-reported AP and ML dimensions for that size were used for comparison with anatomic measurements. For each case, anatomic tibial measurements obtained from WBCT were compared directly with the manufacturer-reported implant dimensions corresponding to the component implanted intraoperatively. Dimensional differences were calculated as follows:

This calculation was performed separately in the AP and ML directions, as illustrated in Figure 2. In the AP plane (Figure 2A), the anatomic AP length was compared with the implant AP dimension to quantify overhang or undercoverage. In the ML plane (Figure 2B), the anatomic ML width was compared with the implant ML dimension. By this convention, negative values indicated implant overhang beyond the cortical margin, whereas positive values indicated residual uncovered bone (undercoverage). Importantly, a degree of ML undercoverage is expected to maintain the medial gutter and to avoid impingement near the fibula. Aspect ratios were calculated as the ratio of AP length to ML width for each specimen.
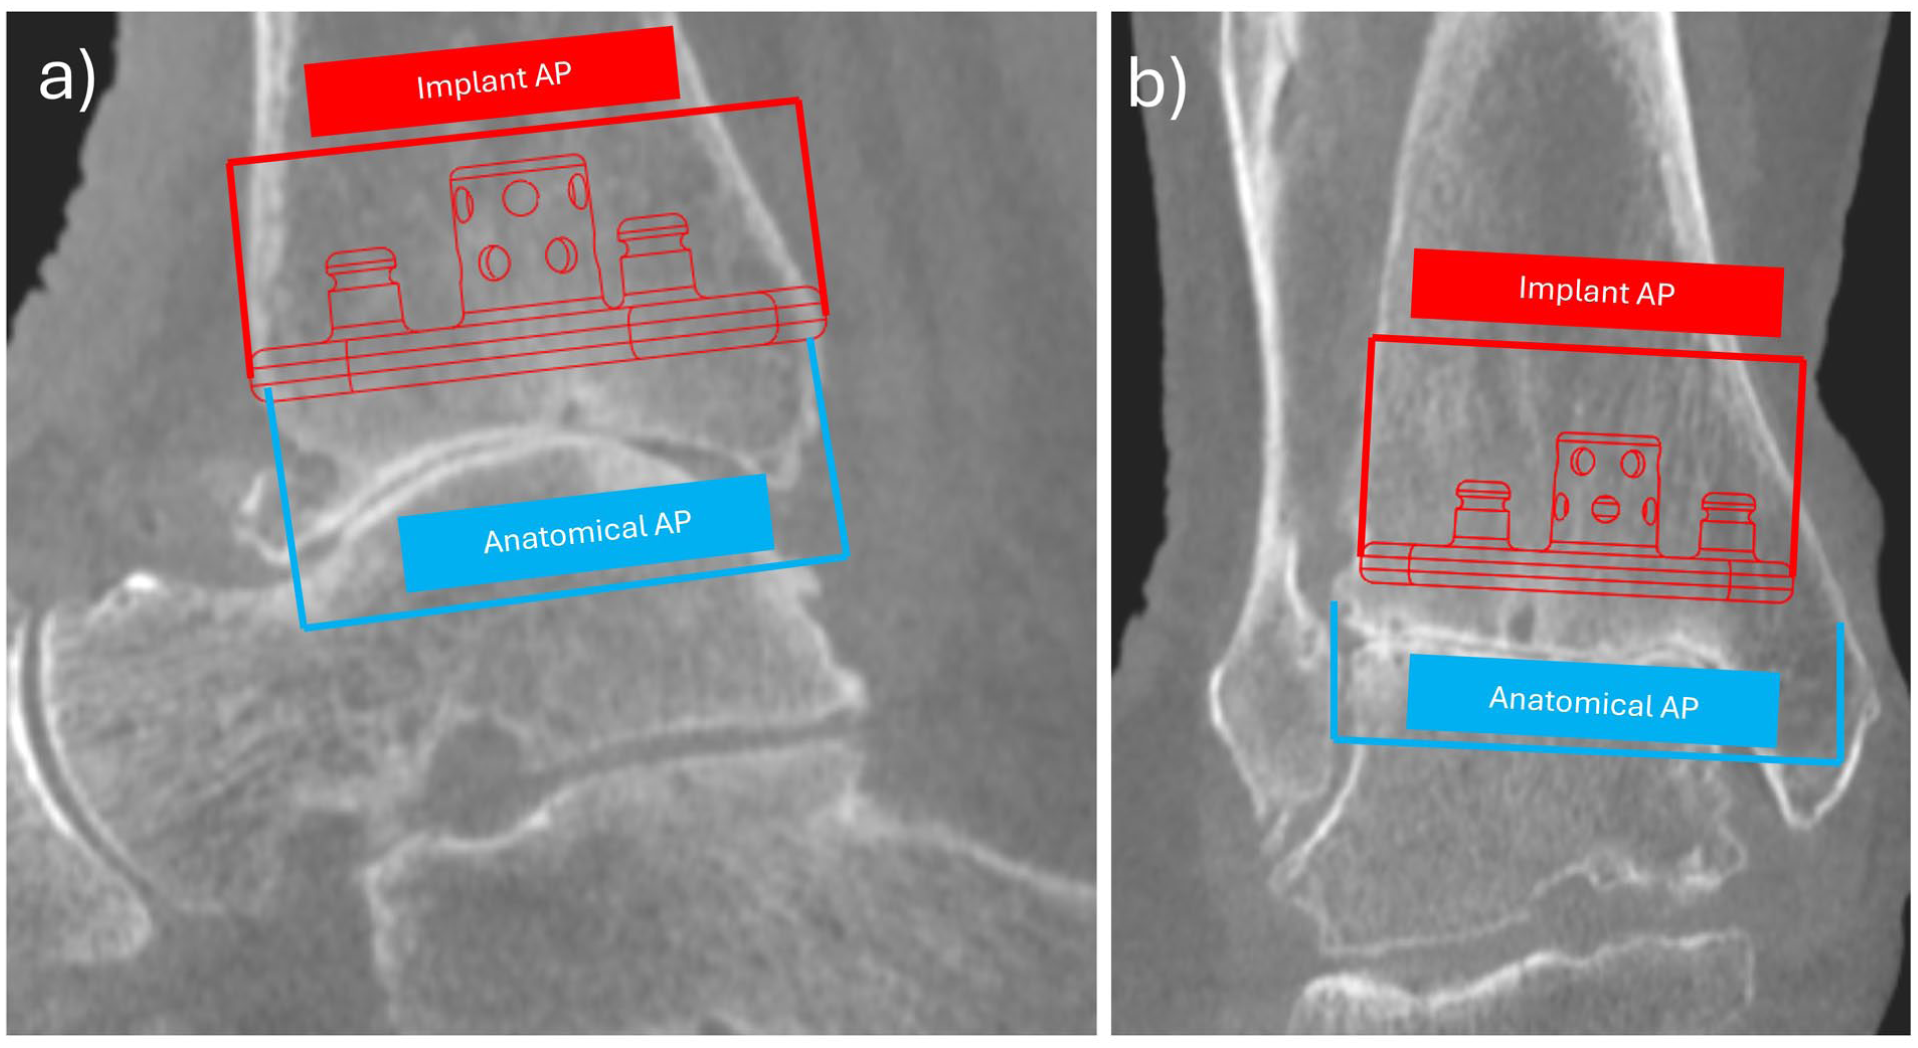
Comparison of anatomic (blue) and implant (red) dimensions used to calculate tibial overhang or undercoverage. (A) AP measurement demonstrating the difference between the anatomic AP length and the implant AP dimension. (B) Mediolateral (ML) measurement illustrating the size mismatch between the implant and the native tibial plafond. Because the implant footprint is near the available ML dimension, the surgeon must position the implant more medially, requiring additional medial malleolar resection and thus increasing the risk of fracture. The theoretical implant position shown here is centered within the tibia to highlight the extent of medial malleolus that would need to be resected to fully accommodate the implant. Positive values reflect residual bone (undercoverage), whereas negative values indicate implant overhang.
Statistical Analysis
Descriptive statistics were calculated for AP and ML differences and for AP/ML ratios at both resection levels. Sex-based comparisons were performed using unequal-variance t tests with Satterthwaite approximation. Multiple linear regression models were constructed to assess predictors of implant-bone mismatch: AP difference as a function of sex and native AP length, and ML difference as a function of sex and native ML length (analyzed separately for 8- and 10-mm resections). Interaction and nonlinear effects were evaluated, and heteroskedasticity-robust SEs were applied. Statistical significance was defined as α = .05 (2-sided). All analyses were performed in Python 3.12 using statsmodels and scipy libraries. All analyses are exploratory in nature, and findings should be considered hypothesis-generating rather than confirmatory. No a priori power calculation was performed, which is acknowledged as a study limitation.
Results
The final analysis included 99 patients (55 male, 44 female). Table 1 shows the demographic and morphometric measurements seen in the cohort. Male patients were taller and had higher weight than female patients (both P < .001). Correspondingly, males demonstrated proportionally larger tibial dimensions at both the 8- and 10-mm resection planes (all P < .001). Despite these size differences, with the numbers available, no statistically significant difference in AP-to-ML ratio between sexes could be detected at either level (P ≥ .17), suggesting comparable overall bone shape.
Demographic and Morphometric Comparisons Between Male and Female Cohorts. a
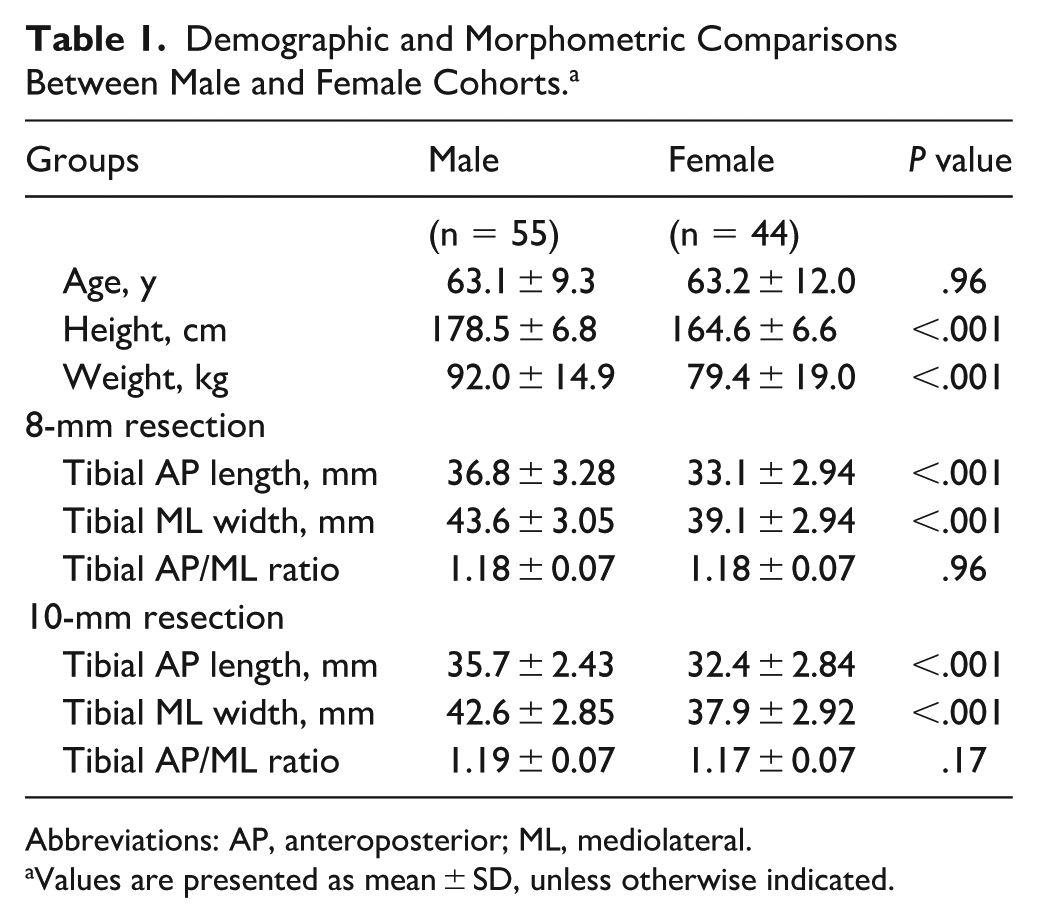
Abbreviations: AP, anteroposterior; ML, mediolateral.
Values are presented as mean ± SD, unless otherwise indicated.
Across the cohort, tibial components demonstrated a consistent pattern of anteroposterior overhang (negative values) and mediolateral undercoverage (positive values) relative to the resected tibial surface. At the 8-mm resection level, the mean AP difference was −4.65 ± 2.43 mm, becoming slightly more pronounced at −5.56 ± 2.22 mm at 10 mm, indicating that the implant extended beyond the native cortical margins in the AP direction. When stratified by sex, mean AP differences were −4.70 ± 2.57 mm in males and −4.57 ± 2.35 mm in females at 8 mm, and −5.78 ± 2.37 mm vs −5.17 ± 2.15 mm, respectively, at 10 mm. With the numbers available, no statistically significant difference in AP mismatch between sexes could be detected (P = .81 at 8 mm; P = .26 at 10 mm), as can be seen in Figure 3.
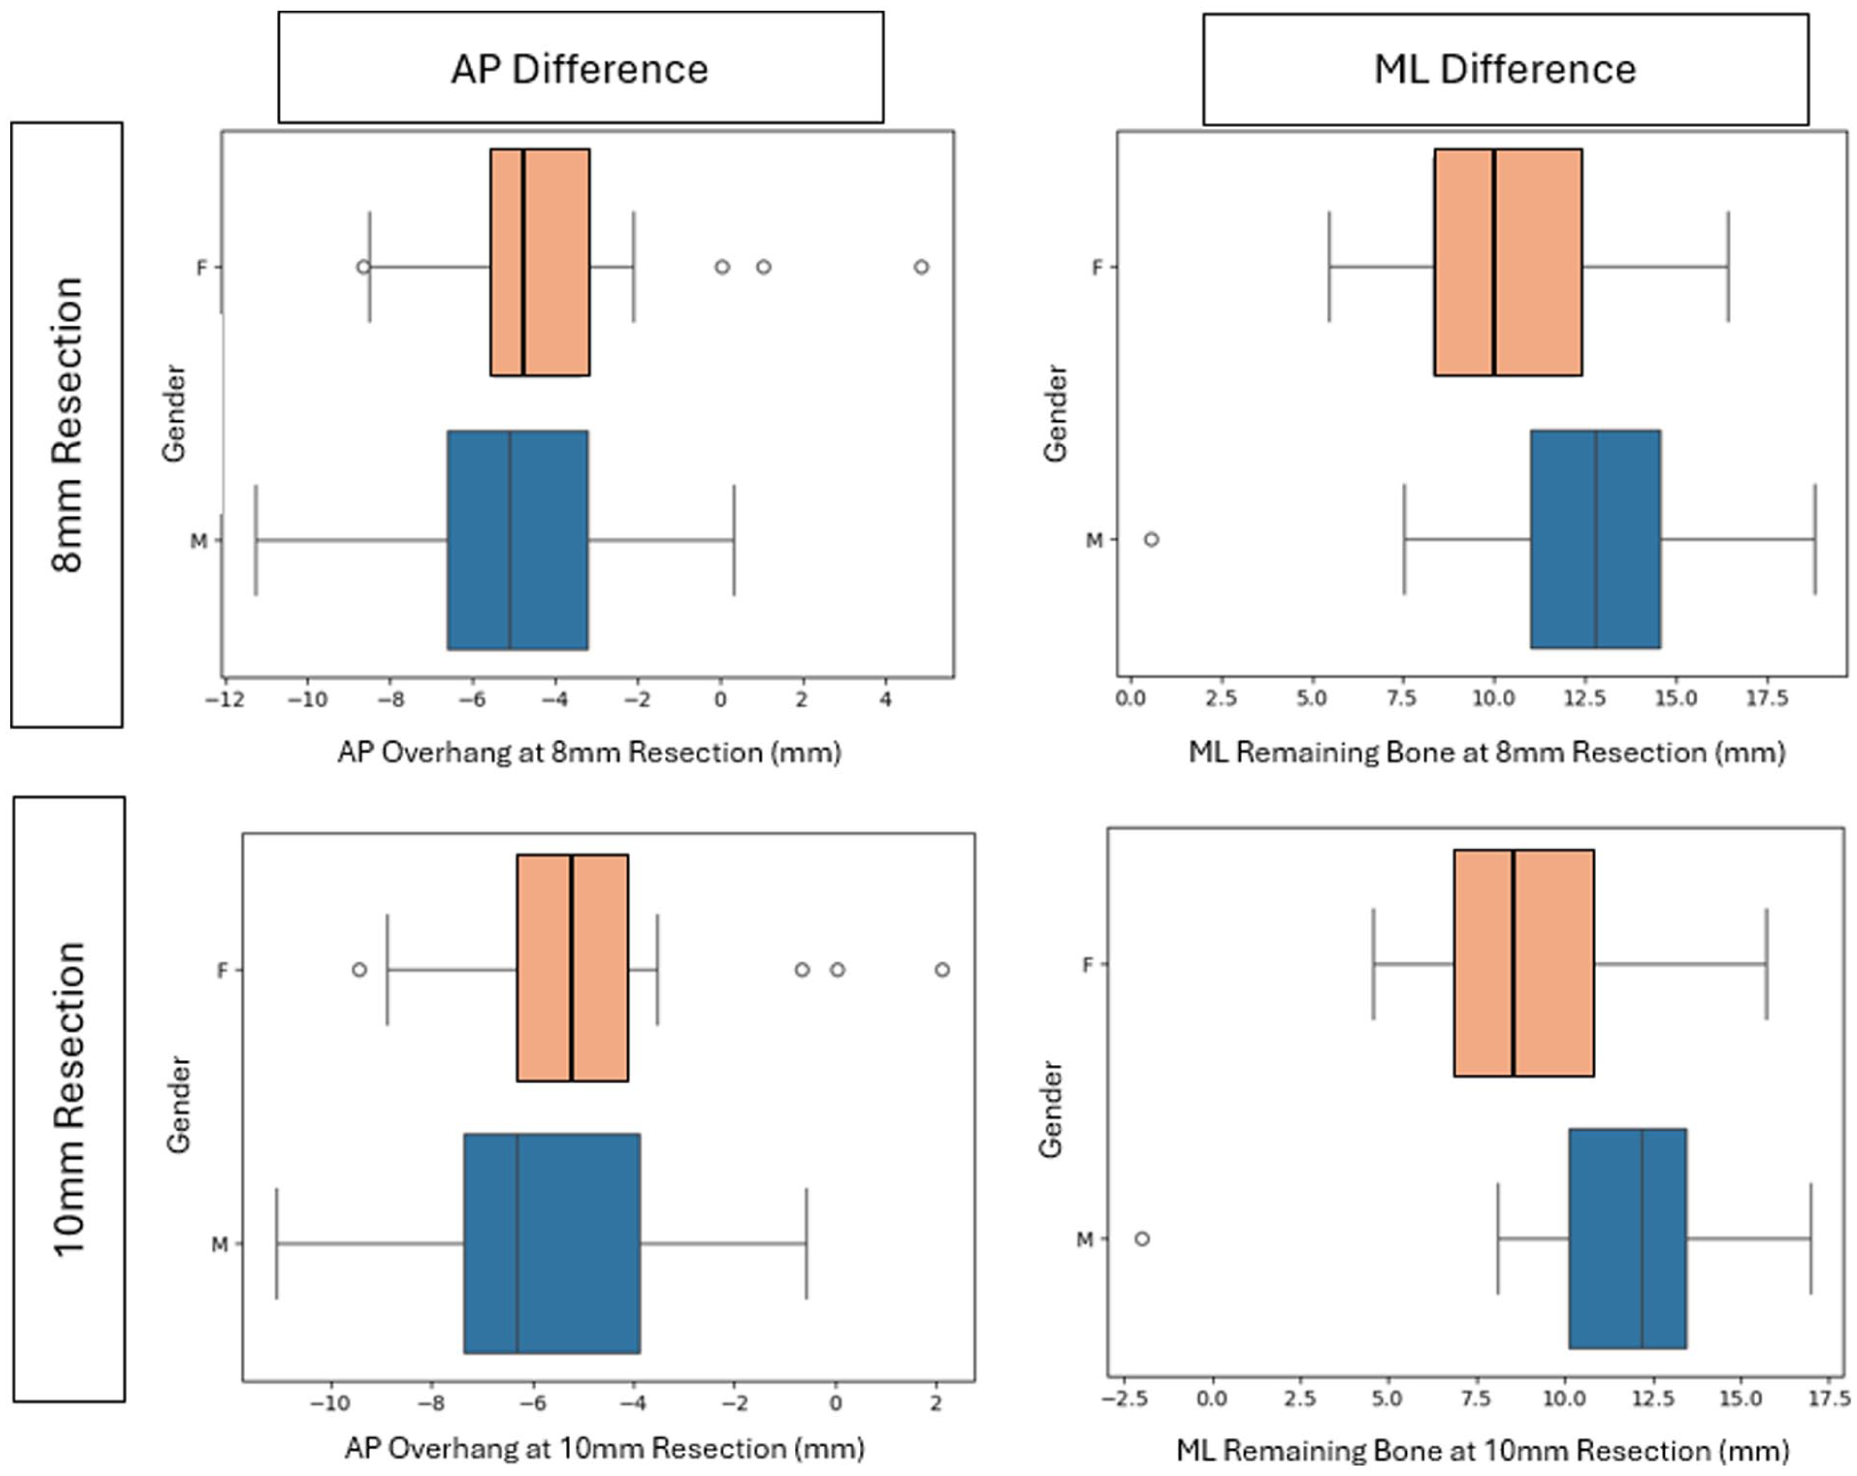
Box and whisker plots illustrating anteroposterior (AP) and mediolateral (ML) dimensional differences between anatomic tibial measurements and implant dimensions across sexes and resection levels. Top left: AP difference at the 8-mm resection. Top right: ML difference at the 8-mm resection. Bottom left: AP difference at the 10-mm resection. Bottom right: ML difference at the 10-mm resection. Negative values indicate implant overhang relative to the native cortex, whereas positive values indicate undercoverage. Consistent positive values in the ML direction reflect expected undercoverage necessary to preserve the medial malleolus and maintain clearance from the fibula.
ML measurements were positive, indicating implant undercoverage. The mean ML difference was 11.67 ± 3.13 mm at 8 mm and 10.74 ± 2.85 mm at 10 mm. Males averaged 12.71 ± 3.00 mm at 8 mm vs 10.37 ± 2.82 mm in females (P < .01), and 11.99 ± 2.21 mm vs 9.18 ± 2.82 mm at 10 mm (P < .01), indicating a narrower mediolateral envelope in females such that implants occupy a greater proportion of the cortical surface. The mean AP:ML ratio was 0.85 ± 0.05 at 8 mm and 0.84 ± 0.05 at 10 mm, with no statistically significant differences (P = .68 and P = .09, respectively; Figure 3).
Multiple linear regression confirmed bone size as the dominant predictor of implant-bone mismatch. For AP difference at 8 mm, larger native AP length was associated with greater mismatch (β = 0.32, P < .01, 95% CI 0.14-0.51), whereas female sex independently contributed an additional +1.34 mm discrepancy (P < .01, 95% CI 0.12-2.56). At 10 mm, AP length remained significant (β = 0.24, P < .01, 95% CI 0.10-0.38), with a similar sex effect (+1.32 mm, P < .01, 95% CI 0.43-2.21).
For ML difference, native ML length demonstrated an even stronger association (β = 0.80, P < .01, 95% CI 0.68-0.91) at 8 mm, and female sex added an independent +1.15 mm mismatch (P < .01, 95% CI 0.28-2.02). At 10 mm, ML length remained significant (β = 0.73, P < .01, 95% CI 0.61-0.85), whereas the sex effect was attenuated and did not reach significance (+0.73 mm, 95% CI –0.12 to 1.57). As shown in Figure 4, after accounting for native tibial dimensions, female patients showed approximately 1 to 1.3 mm greater residual mismatch in the mediolateral plane.
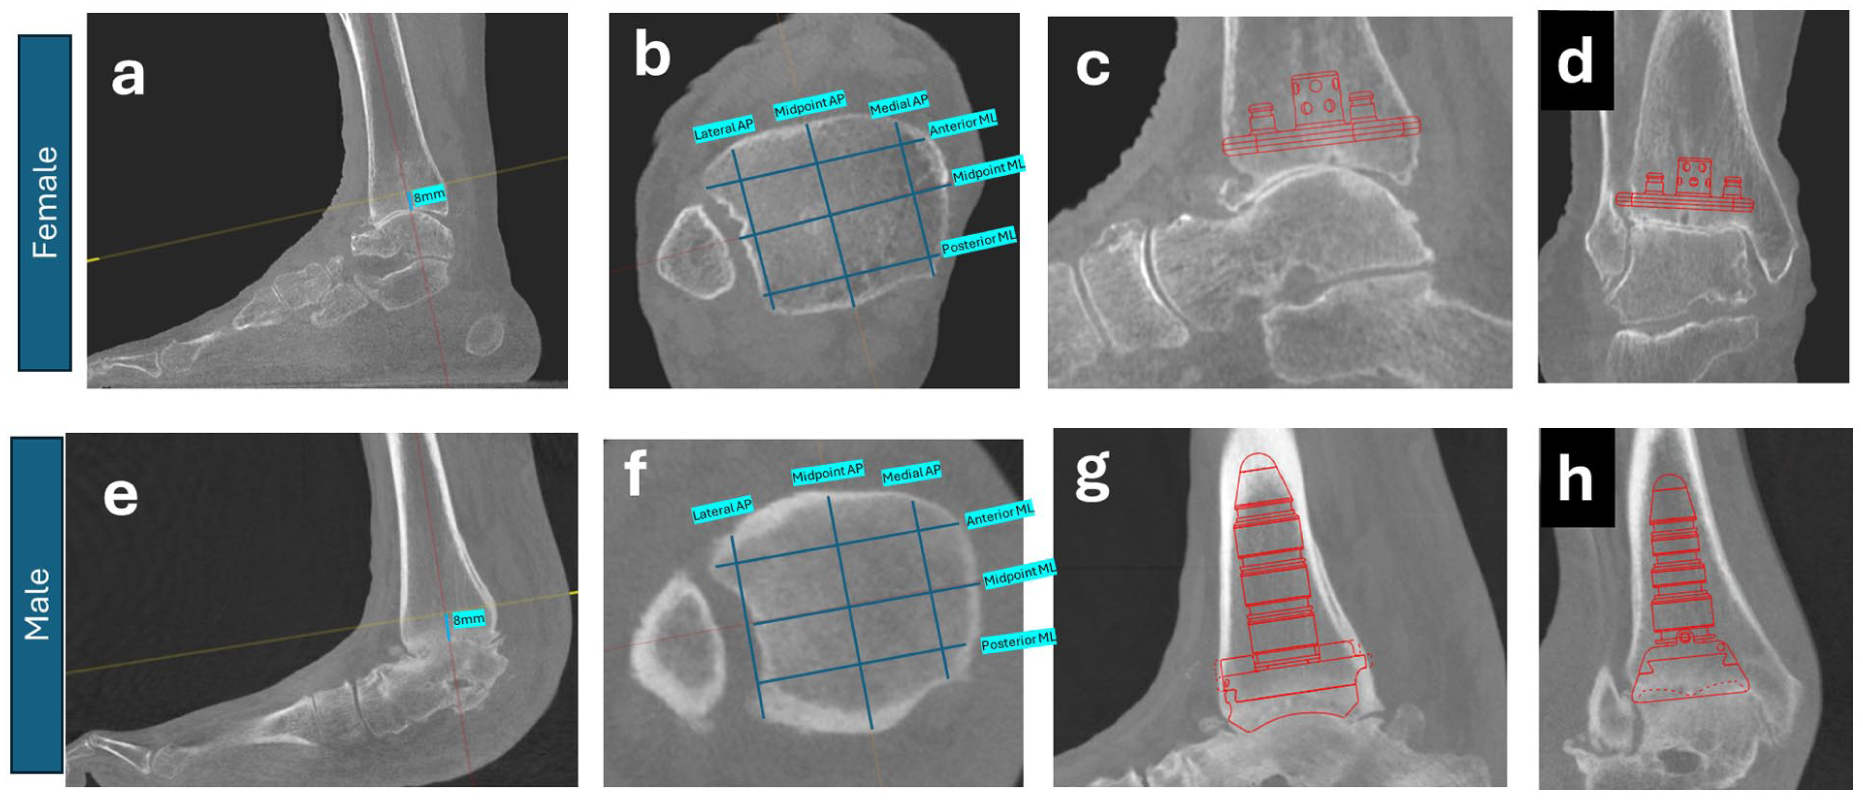
Sample cases showing differences in implant coverage between genders. Panels A and B show sagittal and axial views of standard measurement technique in a female patient. Panels C and D show the AP and ML implant coverage of the implant that was selected intraoperatively for the patient (Exactech Vantage Size 2). In panels E and F, measurements were again performed according to standard technique in a male patient. Images G and H demonstrate the coverage from the selection intraoperatively (Inbone II Size 4L).
Discussion
This study assessed the dimensional relationship between implanted tibial trays and resected distal tibial morphology in a clinical cohort of TAR patients. Using weightbearing CT data and operative implant records, we found that tibial component fit was not uniform across patient morphology. Although currently available implant designs are intended to provide maximal AP coverage while avoiding ML overstuffing, our findings suggest that these design principles favor larger tibiae. Specifically, tibial components demonstrated greater mediolateral mismatch in smaller patients, who were more often female, even after adjusting for native bone size. This is a possible explanation for increased medial pain observed in female TAR patients in observational studies. 4
In our cohort, female patients had narrower tibial widths and correspondingly less residual space between the implant and medial cortex, even after controlling for overall bone size. Multivariable models confirmed that female sex independently predicted greater ML mismatch, consistent with prior morphometric studies demonstrating narrower metaphyseal envelopes in female tibiae. Although overall AP:ML aspect ratios were similar between sexes, implant fit is governed by absolute dimensions, not proportions. Two tibiae with identical ratios but different scales will not fit the same discrete tray equally well; the smaller tibia will have less residual ML clearance and greater AP overhang for any given size, explaining why similar ratios do not preclude clinically meaningful fit differences.
These findings offer possible structural explanations for well-characterized TAR complications. First, medial gutter impingement, marked by pain and inversion stiffness, has been associated with tray proximity to the medial cortex, particularly with varus deformity. 15 Palma et al 10 reported that patients undergoing revision for medial impingement had statistically greater medial talar translation and higher joint line elevation, with talar downsizing reducing impingement risk by 82%. Our findings align with this framework: maximizing AP coverage in a tibia with limited ML width reduces medial clearance and may increase impingement risk. The consistent AP overhang observed uniformly across sexes and all 3 implant systems is an interesting finding in this study. Although potentially intended to maximize cortical engagement, this overhang may also contribute to anterior soft tissue impingement or limited dorsiflexion, associations that warrant evaluation in future outcome studies. 16
Second, reduced ML clearance in smaller and female patients may reflect elevated periprosthetic fracture risk. Palma et al 17 demonstrated that a reduced medial malleolar bone width was a consistent predictor of fracture, especially when the residual margin fell below 10.3 mm. Our ML residual bone measured 11.7 mm and 10.7 mm at 8 mm and 10 mm resection depths, respectively. At 10 mm, the average ML margin was 10.37 mm in males vs 9.18 mm in females. When interpreted against clinical cutoffs from Palma et al, these anatomic findings theoretically place female patients at elevated risk for medial malleolar fracture, though this study does not assess outcomes and such inference is speculative. Notably, 44% of females had <10.3 mm ML clearance at 10 mm resection, approaching published fracture-risk thresholds. Given that medial malleolar fracture complicates 2% to 4% of TARs,18,19 these observations may suggest that anatomically at-risk patients may be more prevalent than previously recognized.
Current TAR systems size tibial trays linearly in both AP and ML dimensions, limiting the ability to optimize cortical fixation while maintaining ML clearance. In patients with narrow tibiae, particularly women, a trade-off emerges: an AP-optimized tray risks medial crowding, whereas downsizing for ML safety sacrifices AP fixation. The 2 to 3 mm smaller ML clearance in females approximates a full tray-size mismatch in most modern systems. 20 Offering tibial trays with narrower ML widths, or decoupling AP and ML sizing altogether, may improve implant fit across the spectrum of tibial morphologies. Importantly, although some implant systems have begun to offer “long” tibial components to increase tibial length, among systems with this option available, 65% of components used in our cohort were “long,” suggesting that additional sizing options may be needed to reduce implant-bone mismatch. It is worth noting, however, that the experience with gender-specific knee arthroplasty offers a cautionary parallel: despite well-documented morphologic sex differences in the distal femur, randomized trials have demonstrated no significant clinical benefit of gender-specific knee implants over standard unisex designs in terms of pain, range of motion, or patient satisfaction. 21 This suggests that anatomic mismatch alone does not necessarily translate into measurable clinical harm, and that the clinical implications of the tibial fit differences identified here remain to be established through prospective outcome studies. With the current results, these findings may guide preoperative risk stratification. WBCT enables precise measurement of resection-plane cortical morphology, and cases with borderline ML clearance or asymmetric tibial morphology may warrant prophylactic medial fixation or selection of implant systems with narrower ML dimensions. 17
This study has several limitations. Our imaging-based approach allowed standardized measurement of tibial resection morphology and simulated implant fit, but we did not analyze actual component position, including alignment and rotation, both of which are known contributors to postoperative biomechanics and impingement. Because implant size was recorded from the operative note, observed mismatch may partly reflect surgeon sizing decisions rather than anatomy alone. Manufacturer-reported dimensions may also represent outer implant geometry rather than the true bone-contact surface, which could affect the magnitude of calculated differences.
Several additional constraints should be acknowledged. Only 3 FDA-approved systems were included, and findings may not generalize to designs with different AP/ML scaling conventions. Intraobserver and interobserver reliability of CT measurements was not assessed. No a priori power calculation was performed, so the absence of a significant AP difference between sexes should not be interpreted as establishing equivalence. No clinical outcomes were evaluated; future studies should link WBCT-derived fit metrics with postoperative symptoms and complications to establish actionable thresholds. Finally, the retrospective single-center design limits generalizability, although our consecutive series with a broad size and sex distribution does support the external validity of the observed trends. Additional demographic variables such as race/ethnicity and BMI subgroups were not captured and would further inform the generalizability of these findings.
Conclusion
In this WBCT analysis of 99 TAR patients, we found a consistent dimensional mismatch between native distal tibial morphology and current tibial tray sizing. Across 3 implant systems, the actual tibial components selected intraoperatively had overhang past the AP cortical margins, whereas residual ML bone stock was limited, particularly in smaller and female tibiae. This reduced medial clearance approached previously reported thresholds associated with medial gutter impingement and medial malleolar fracture. These data support implant design strategies that decouple AP and ML sizing or provide narrower ML options to better accommodate patients with smaller bone morphology. Future studies linking these anatomic fit metrics with clinical outcomes are needed to define actionable thresholds and guide TAR design evolution.
Supplemental Material
sj-pdf-1-fao-10.1177_24730114261455297 – Supplemental material for Implications of Size and Gender for Implant Fit and Coverage in Total Ankle Replacement
Supplemental material, sj-pdf-1-fao-10.1177_24730114261455297 for Implications of Size and Gender for Implant Fit and Coverage in Total Ankle Replacement by Benjamin R. Wesorick, Kira Lu, John Spivack, Elena Karas, Scott J. Ellis, Constantine A. Demetracopoulos and Jensen Henry in Foot & Ankle Orthopaedics
Footnotes
Ethical Considerations
Ethical approval for this study was obtained from the institutional review board (no. 2020-2132).
Declaration of Conflicting Interests
The authors declared the following potential conflicts of interest with respect to the research, authorship, and/or publication of this article: Benjamin R. Wesorick, BSE, reports restor3d: paid consultant. Scott J. Ellis, MD, reports Stryker/Wright Medical: paid consultant, product development (with royalties). Constantine A. Demetracopoulos, MD, reports Exactech, Inc: IP royalties; In2Bones: IP royalties; Wolters Kluwer Health–Lippincott Williams & Wilkins: publishing royalties. Jensen Henry, MD, reports Exactech, Inc: paid consultant. Disclosure forms for all authors are available online. Disclosure forms for all authors are available online.
Funding
The authors received no financial support for the research, authorship, and/or publication of this article.
References
Supplementary Material
Please find the following supplemental material available below.
For Open Access articles published under a Creative Commons License, all supplemental material carries the same license as the article it is associated with.
For non-Open Access articles published, all supplemental material carries a non-exclusive license, and permission requests for re-use of supplemental material or any part of supplemental material shall be sent directly to the copyright owner as specified in the copyright notice associated with the article.