



Abstract
Counter-narratives to dominant development discourses are made possible using research methods designed to elicit marginalized voices. In this article, we propose a new analytical framework called the interpretive schema for drawings for analyzing visual narratives. The interpretive schema for drawings consists of five themes or interpretive lenses (scale, centrality, inclusion, connections, and relationality) that were generated from maps of fuelwood collection in rural India. We suggest that the interpretive schema reflects and animates a range of spatialities that are central to geographic studies of human–environment dynamics. Using the interpretive schema for drawings in this way enables us to emphasize emic socio-spatial perspectives, and offers a critical research avenue through which everyday realities can be represented, understood, and validated. While other image-based research approaches, critical cartographies and participatory mapping exercises may encourage the expression of alternative knowledges, our proposed interpretive schema for drawing presents a specific set of guidelines for interpreting and making sense of visual narratives through explicit socio-spatial analysis.
Introduction
Visual narratives are a useful way to capture the contexts, mechanisms, and meanings of lived experiences (Banks, 2007; Prosser, 1996). They also allow for the creative expression of individualized perspectives, knowledges, and feelings, all of which influence how people view their surrounding environments (Wee and Anthamatten, 2014). These are important considerations when seeking to understand the spatial and temporal dynamics of individual and/or community experiences within complex and changing physical landscapes. In particular, we suggest that drawings as a visual narrative, reflect, and animate a range of spatialities that are central to geographic studies of human–environment dynamics. Fuelwood collection in rural India, for example, contains a particular set of embodied experiences and spatialities. Actively navigating and experiencing spaces through social-environmental interactions leads to different spatial understandings and perceptions of place (Tuan, 1977; Wee and Mason, 2016). Traditional research methods like surveys and interviews, while useful in a variety of ways, are not explicitly designed to elicit people’s spatial connections to their environment and to each other. Instead of using written or spoken text to convey perceptions of space, drawings allow for inductive visualization, that is, individuals express perspectives of habitual practices in space. This is done through inventive work with a physical canvas, allowing for hands-on, geometrical engagement with various spatial considerations (Knowles et al., 2015). In this study, we develop and apply an analytical framework, the interpretive schema for drawings (ISD), to a set of drawings in order to emphasize place-specific connections as well as emic perspectives grounded in the realities of livelihood activities (Chatti et al., 2017). We suggest the ISD can provide a useful approach for others hoping to enhance environment and development research in diverse settings.
In the next section, we provide an overview of drawings as visual narratives, including how they have been previously utilized to inform research on human-environment relationships. This is followed by a description of how we developed the ISD, which offers a critical research avenue through which the experiences of individuals (notably those of marginalized status) can be understood and represented. As part of this section, we introduce and describe the regions where drawings about fuelwood collection were gathered as well as the broader context of sustainable energy development in South India.
Drawings as visual narratives
Visual narratives fit within the broader field of visual methodology, which seeks to understand how people perceive and experience spaces in unique socio-cultural settings (Rose, 2007). In this article, we gathered and analyzed visual narratives created by people participating in and experiencing the activity of fuelwood collection. The purpose of this research was not to generalize these findings, but to understand individual as well as collective ways of “seeing” livelihood activities. “Seeing” here refers not only to the observation itself, but also to the ontological orientations that constitute what is seen and experienced (Oldrup and Carstensen, 2012). Sontag (1977) adds that visual data do not simply render an impersonal, objective world, instead, they are an individual’s evaluation of it. Drawings, as an example of a visual narrative, represent the human experience in ways that articulate our perceptions of personal, social, and spatial relationships (Knowles et al., 2015). Drawings and other visual outputs provide creative, interactive formats that can be integrated with more traditional data collection methods, including interviews and oral histories, to capture the everyday experiences and “geo-narratives” of research subjects (Bell et al., 2015; Kwan and Ding, 2008). Along with these analytic benefits we must be careful to also recognize that all cartographic representations, including drawings, are contingent, relational, and context-dependent (Kitchin and Dodge, 2007).
From a “post-representational” perspective, all drawings and the different narratives they are associated with, should be understood in the context of “the production process, as well as … political and personal agendas” (Caquard and Cartwright, 2014: 105). Like all research tools, drawings are subjective, and we recognize the power-laden processes through which they are produced and interpreted. The use of drawings must be approached with an explicit analysis of the power-imbued processes at work in the representation of knowledge. An analysis of power in the case of visual narratives not only recognizes the hierarchies between the various individuals and groups drawing, but also between the researchers, facilitators, and the various participants in research. These show up in the unequal ownership of visual outputs in participatory, community projects (Mitchell and Sommer, 2016); when engagement with people and places proceeds in reductive, formulaic ways (Leeuw et al., 2017); and when narratives are presumed to be linear because there is the expectation of a clear beginning, middle, and end (Martz et al., 2020). We build on earlier scholarship by feminist post-structuralist scholars in science studies who critiqued the notion of a disembodied view “from nowhere” (Haraway, 1988), thereby refuting the idea of a singular objective truth.
Despite containing their own internal political and power dynamics, visual narratives may nonetheless provide an opportunity for relatively “silent” community members or those who may otherwise be “spoken for”, to share their personal insights. Visual narratives enable and empower participants to articulate different knowledges, complexities, and social realities on the ground (Edmunds et al., 1995). For example, counter- and community-mapping exercises have helped to challenge and/or destabilize dominant visual and cartographic representations of space (Dalton and Stallmann, 2017; Harris and Hazen, 2006; Parker, 2006; Sletto et al., 2020). Tremblay and Harris (2018) used participatory video to capture subjectivity, emotions and empathy associated with water resource use and sanitation (in)access from community members. Doing so allowed them to “understand the individual as an agent of change … while attending to broader socio-ecological, political and infrastructural relationships” (p. 175). Chatti (2019) used participatory drawings to elicit the desired spatial organization, and energy and material flows within people’s homes, as a way to understand how community members conceptualize a life well-lived, and consequently, what people aspire to. Drawings and other visual tools encourage participants to self-represent, to heighten consciousness, and to “challenge map silences that imply the absence of people or resources” (Parker, 2006: 477). In these ways, visual narratives can lead to social changes that are transformative and emancipatory, and that are able to “change the picture” (Mitchell, 2011: 177). We understand this work to be an extension of such efforts and it is our hope that our article can contribute to efforts to counter the epistemic violence (Spivak, 1993) of colonial, Euro-American led, and top-down developmental models of praxis and research. Such intellectual projects to challenge singular notions of expertise have been led by scholars of indigenous studies, who have shown how the act of storytelling can be a subversive, counter-hegemonic act of resistance and a way to “reclaim epistemic ground” erased by colonialism (Sium and Ritskes, 2013). In this article, we attempt to use visual narratives in the service of such intellectual and political aims.
Visual narratives also provide insight into how direct experience influences a sense of place associated with particular locations or activities. In studies of spatial cognition, researchers have noted a correlation between direct interactions with the environment and the level of spatial/environmental knowledge that accrues from those experiences. People learn to navigate spaces by moving through them, and through this familiarity they integrate tactile and kinesthetic patterns in the landscape. For example, in cases where individuals hold greater autonomy and the freedom to explore their surroundings (e.g. walking instead of being driven) they also demonstrate a greater ability to recall route details and to structure space (Derr, 2006; Risotto and Giuliani, 2006). Drawings have been utilized to understand the importance of places in people’s lives (e.g. which places are positioned in the center of a drawing), as well as an individual’s use, knowledge, and opinion about her/his environment (e.g. how much detail they give to certain landscape features) (Trell and Van Hoven, 2010). Here, greater detail found in drawings and mental maps may be correlated with the number and intensity of experiences an individual has in a given place (Matthews, 1984). This conforms with Abrams (1997: 74–75) who notes how, “meanings remain rooted in the sensual dimensions of experience… encounter, participation”.
Research using drawings has provided useful insights on a range of issues from how children view their individual environmental futures (Alerby, 2000; Barraza, 1999), to the influence of dominant environmental discourses across cultures and languages (Wee, 2012), and the perceived level of stress and resilience held within different communities (Huss and Alhaiga-Taz, 2013). By revealing social actions within the rituals of everyday life where culture-specific norms operate, visual narratives can provide a better understanding of mundane practices in research contexts and catalyze a stronger commitment to inclusivity in the research process (Young and Barratt, 2001). Visual narratives thus provide one possible way of eliciting knowledge that may otherwise be obscured within dominant development processes.
Gathering knowledge about socio-spatial practices
Of considerable concern to many development organizations is the collection of fuelwood: its quantity, location, and impact on nearby forests. Most research on cookstoves and fuelwood collection relies on geospatial analysis, social surveys, interviews, and focus groups to assess the many social factors influencing fuelwood collection, and to generate potential recommendations for policymakers. These include offering newer cookstoves, which are designed to positively impact indoor air quality and forest conservation (due to less wood being used for cooking and heating) (Simon et al., 2014).
Absent from much fuelwood collection research are the realities of daily practices in households and villages at different scales and in different settings. Far too little attention has been given to understanding the process of procuring energy resources used for cooking within public forests, private properties and communal agricultural fields, among other areas (Chatti et al., 2017; Simon and Peterson, 2019). Our work here analyzes drawings about fuelwood collection to develop an analytical framework that draws attention to the socio-spatial dimensions of such livelihood activities and more broadly, development. We examine the potential benefits of visual narrative analysis as a critical methodology and suggest this technique can productively complement ongoing research approaches by capturing and integrating the perspectives and experiences of communities targeted for development.
Study areas and field methods
This study was part of a multi-year United States National Science Foundation (NSF) grant to understand cookstove use in relation to fuel collection activities and forest cover change. 1 The majority of research took place in January 2017 examining household interactions with “improved” cookstoves. Specifically, we analyzed how newly installed clean and efficient burning stoves impacted household cooking practices, social relationships, daily routines, economic opportunities, and fuelwood collection. As part of this project, we also conducted a preliminary study using drawings to better understand the socio-spatial dimensions of livelihood activities. This aspect of the grant is the focus of this article.
Drawings were collected, along with surveys (n = 1200), focus group interviews (n = 12), and participant observations, in rural south India at the site of two clean cookstove projects with two partner NGOs. These projects replace traditional stoves (deemed to be unsafe and unhealthy) with newer, cleaner varieties. Specifically, these projects were assessed in two villages in Gangavati Taluk, Karnataka and two villages in Paderu Taluk, Andhra Pradesh (see Figure 1). Non-governmental organization (NGO) A oversees the cookstove project in Karnataka and is actively involved with rural development activities throughout nine districts in the state. NGO B manages the cookstove project in Andhra Pradesh and is active in several districts heavily populated by tribal groups, who are the main beneficiaries of the organization’s activities.

Map of South India. Two study sites are indicated with boxes: Gangavati Taluk area in Karnataka (left) and Paderu Taluk area in Andhra Pradesh (right).
Within the two villages in Gangavati Taluk, a survey of people engaged in fuelwood collection resulted in a total of 78 women participants with an average age of 38 years. The religious affiliation of these women was 88% Hindu, 11% Muslim, and 1% Christian. Just over 14% of women from the survey population were from scheduled castes, with nearly 38% from other backward castes. Approximately 29% of the participants held scheduled tribe status. The remaining population were from general/other caste (16%) and unreported (3%). 2 Roughly 60% of the survey population identify as not literate, with the remaining 40% literate. 3
Ecologically, Gangavati is a semi-arid environment with scant tree cover and comprised predominantly of dryland agricultural land uses—though increases in irrigation and the advance of commodity crop production is quickly changing both the region’s economy and landscape. Land around Gangavati has become increasingly segmented by private property holdings due in large part to the regional expansion of cultivated land for crop production. These land use changes have increased rates of farmland conversion and land privatization, thus restricting access to previously public forest resources for many villagers in the area. Today, the primary fuel source in the Gangavati area is the invasive shrub Prosopis juliflora, which was intentionally planted by the Karnataka government in response to fears of a fuelwood crisis in the 1970s.
Similar to the villages in Gangavati, a survey of people engaged in fuelwood collection within the Paderu villages revealed an all-woman (38) sample population. This group overwhelmingly comprised scheduled tribe members (Bagata (6), Kammara (1), Konda Dhora (9), Nooka Dhora (16) Porja (3), and other (3)), which reflects the region’s overall tribal belt status (Paderu Taluk is 83% scheduled tribal). Of the 38 respondents, all but five (33) were identified as not literate. Furthermore, land holdings for respondents suggests that despite unfair historical land titling practices that dispossessed many tribal residents of their land, many families now hold access to private lands. 4
The environment around Paderu is hillier than Gangavati and is indicative of the rugged landscapes found within the Eastern Ghats. The area contains a number of irrigated paddy areas and community forest plots. Vegetation cover in the area is noticeably patchy and comprises shrubs, grasses, and small trees, a land cover artifact of extensive timber harvesting under the British Raj and, later, commercial forest uses and land titling policies under Indian rule. 5 In Paderu, private land holdings and public land access are influenced by an equally complicated history. Many indigenous families lost their established paddy fields in a series of false title sales facilitated by corrupt local officials. This process displaced indigenous agricultural activities and likely exacerbated podu (slash and burn) cultivation. These historical contestations have directly influenced land cover, fuel availability, and thus contemporary fuel collection practices.
Preceding our collection of drawings, villagers from NGO A and NGO B projects participated in a 1–2 h focus group where the research project was explained, and where villagers shared their perspectives on the use of new cookstoves. Their responses included personal stories and descriptions of firsthand experiences with fuel collection. These anecdotes and insights provided valuable context and supplementary information as we sought to interpret the meanings in each drawing.
Following focus group interviews, researchers and NGO staff invited people engaged in fuelwood collection to gather at a central village location in each participating site. The participants were encouraged to form small groups (see Figures 2 and 3). In each group, women were invited to draw a picture of fuelwood collection using pens and paper provided by the research team. 6 The specific prompt, provided verbally to participants in the local language, was “please make a map of your fuelwood collection route”. Participants took on two roles: there was a drawer (person actually drawing) and there were contributors (individuals providing their input to the drawer). While we had initially hoped to collect drawings from individuals about their fuelwood collection routes, our fieldwork activity drew enthusiastic participation from some people who do not traditionally collect fuelwood in the region. Thus, the drawings we collected include visual narratives of people who were drawing from personal experience, as well as visual narratives from people drawing based on others’ experiences.
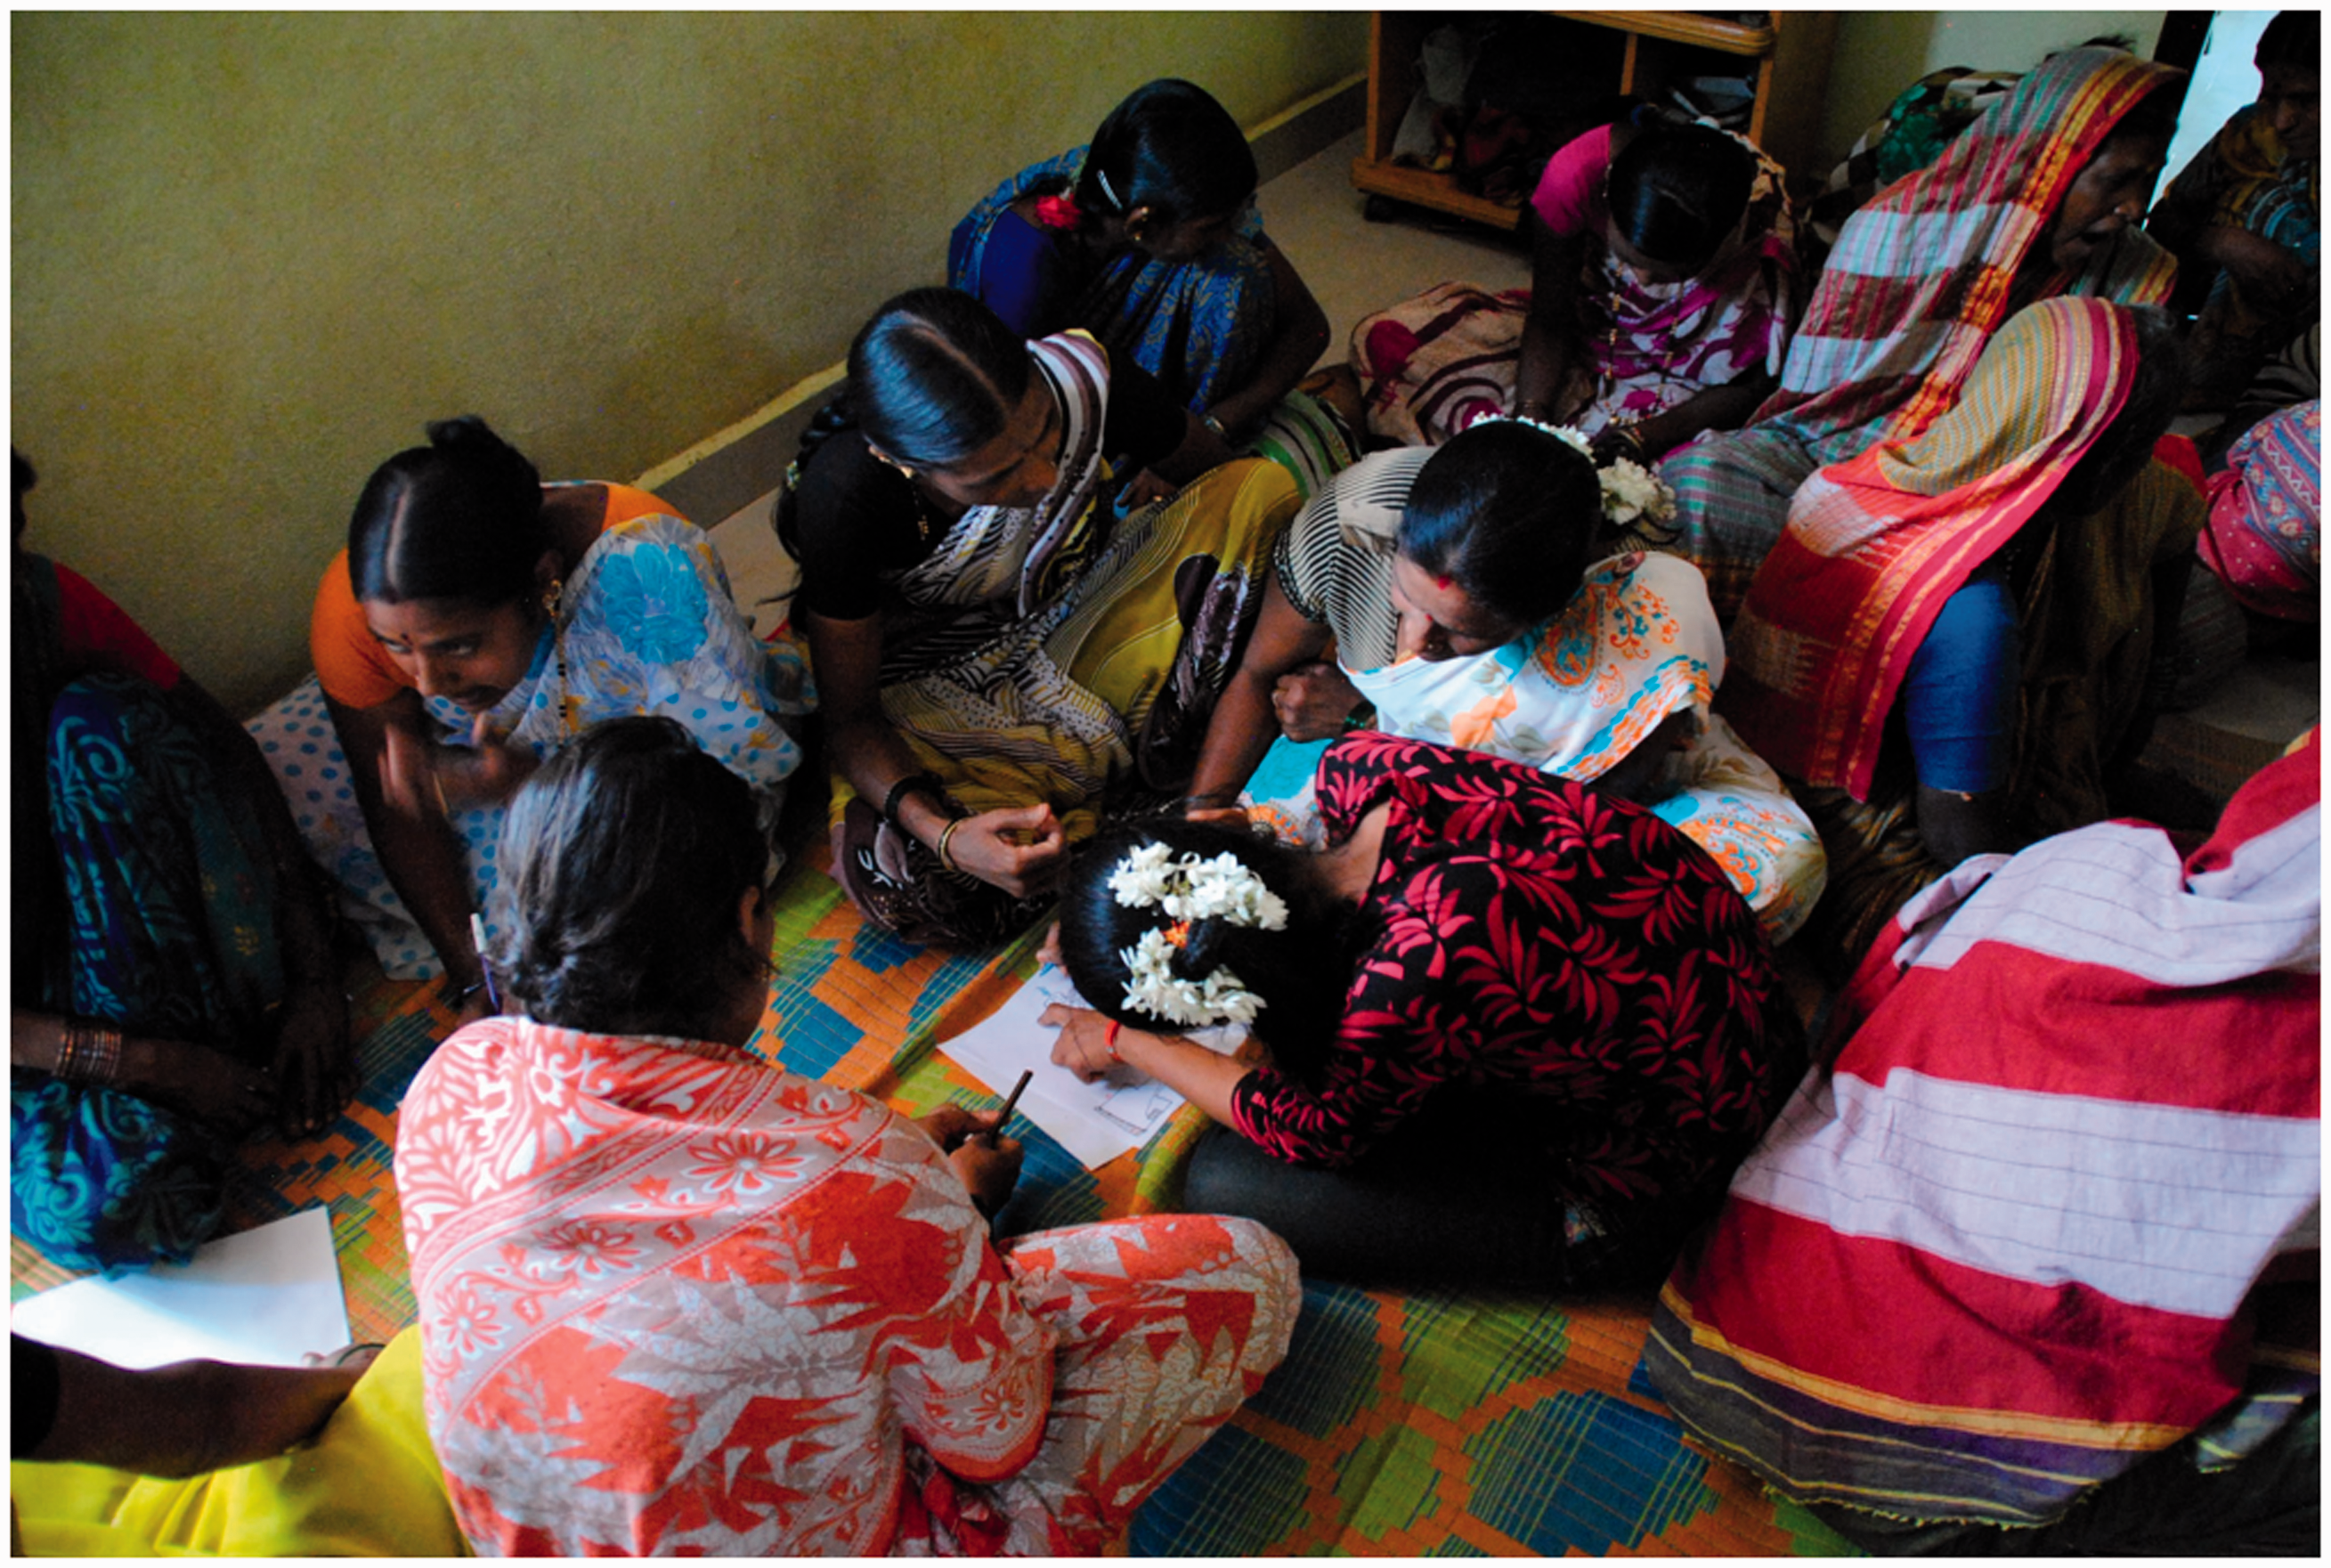
Villagers drawing at a Karnataka project site.

Villagers drawing at an Andhra Pradesh project site.
Immediately after the images were completed, drawers were asked to clarify their drawings as a form of “member-checking” (i.e. conferring with drawers and contributors to better ascertain the intended meaning of images). These descriptions were not audio-recorded; instead, researchers took handwritten notes, some of which remain evident on several of the drawings presented here. Ultimately, a total of 25 drawings were collected from both NGO A sites (13) and NGO B sites (12). Within this sample, there were six drawings where men took on the role of “drawer” (NGO B only) and 19 images drawn by women (NGO A and B). Five drawings were not “usable” due to the absence of labels, written descriptions, and/or other signifying elements, which made them impossible to interpret. An example of such a drawing is provided in Figure 4. This left us with a total of 20 drawings for analysis: 9 from NGO A sites and 11 from NGO B sites.
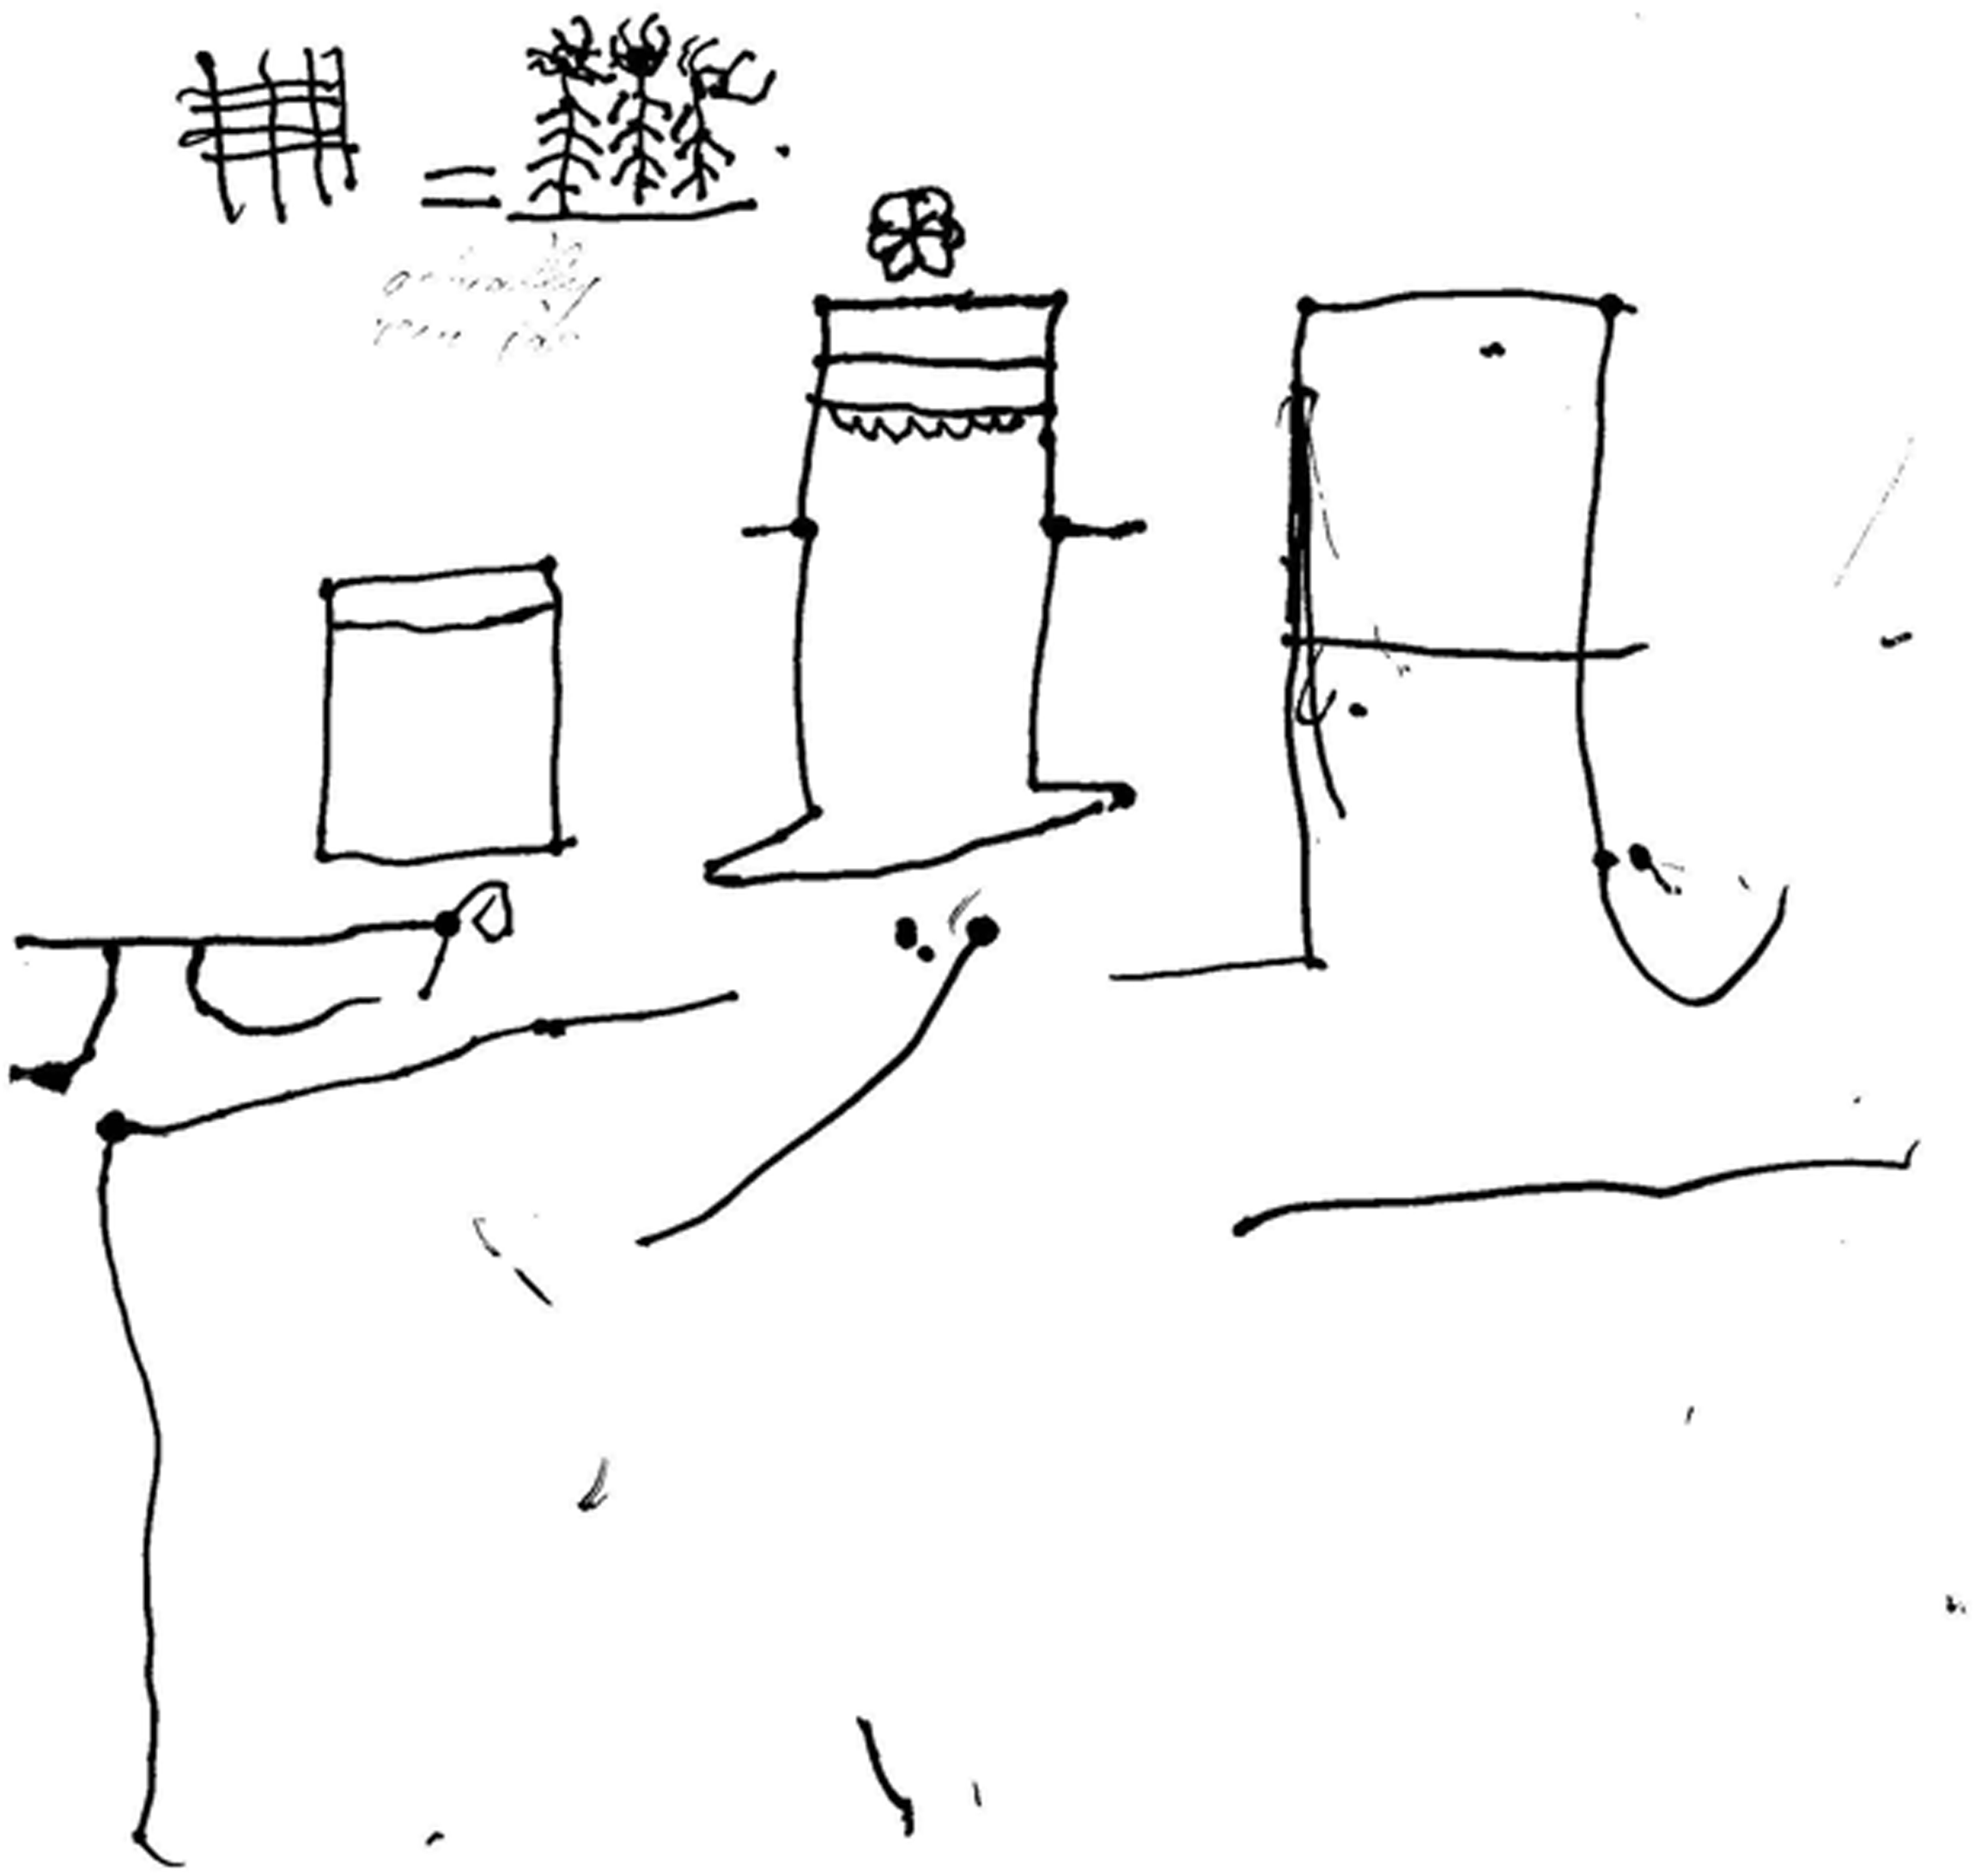
Example of a drawing that was not included for data analysis in this study.
One of the authors translated labels and words on the drawings (which are in the two South Indian languages of Telugu and Kannada) into English. These translations were checked by other native speakers of Telugu and Kannada, including NGO employees, to ensure accuracy. These English translations were further verified using field notes from two authors who coordinated the field drawing exercise.
Our preliminary analysis was content-driven; that is, as a group the authors visually scanned each drawing for all discernible objects: people, paths, structures, vegetation, landscape types, and other land features. These descriptive titles or codes were systematically listed on a spreadsheet and disagreements, if any, were discussed before moving on to the next drawing. Through this process, we established a form of inter-rater reliability which allowed each member of the research team to be consistent in how we analyzed the drawings. Similar content in each drawing, for example, would be assigned the same code. The goal here was to develop grouped codes that we would later use to identify broader themes (Miles and Huberman, 1994). This iterative approach allowed the authors to develop novel insights, fostering a greater sensitivity to both recurring and unique narratives embedded within the drawings. For instance, fuelwood collection is revealed as a social activity that people engage in together. Groups traverse multiple and different landscapes to collect fuelwood and this activity forges people’s relationship to the surrounding landscapes. Some drawings center people, thus signaling fuelwood collection as a significant, personal activity, while others foregrounded the landscape thereby representing fuel collection in a more disembodied way. Additionally, drawings reveal physical and emotional connections to the activity of fuel collection and these may influence the specific ways people move (or have moved) within and through specific locations. Finally, the same geographic area was represented differently reflecting diverse perceptions of time and distance related to fuelwood collection.
With these preliminary interpretations, we proceeded to generate emergent themes (totally five) that would inform our analytical framework. Whereas the codes had literal or descriptive meaning, our themes had connotative meaning, that is, they connote the socio-spatial conventions associated with that image in a particular context (Barthes, 1981). For example, seeing various depictions of individual houses with small footpaths, as well as large roads connecting villages helped us understand how different people related to the activity of fuelwood collection in terms of scale. Likewise, seeing where people located themselves in their drawings sensitized us to the “flesh and blood beings learning through their senses and responding to images through their embodied experiences” (Weber, 2008: 46). Both these processes—the listing/grouping of codes and identification of themes—represent a constant comparative analysis in qualitative research, which is particularly helpful when trying to elicit underlying patterns in an entire dataset (Leech and Onwuegbuzie, 2007). These themes are collectively labeled as an interpretive schema for drawings (ISD). We discuss the ISD in greater detail below, referencing sample drawings to illustrate and exemplify different socio-spatial dimensions of livelihood activities.
Towards a new analytical framework for visual narratives: An interpretive schema for drawings
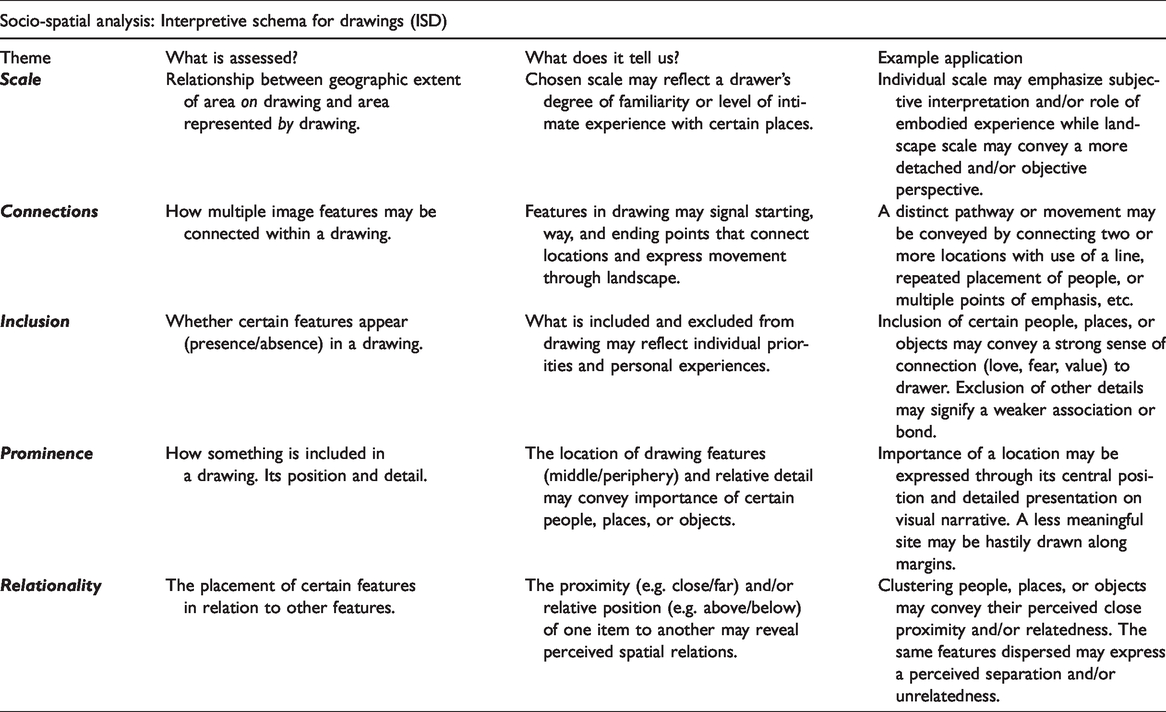
In this section, we propose a new analytical framework for visual narratives, described through an ISD. An ISD enables researchers to identify and interpret important features of drawings; it is also an approach to visual narrative analysis that can be applied to a broad range of topics, populations and locations. It is important to note that some drawings exhibit more than one ISD theme. Each theme is described below, together with selected drawings that illustrate the role of scale, centrality, inclusion, connections, and relationality in human–environment relationships.
Scale
Scale is understood here as the relationshizp (or ratio) between the geographic extent of the area on the drawing and the area represented by the drawing. One example of scale in our study is evidenced by drawings including only people (small area represented), drawings including people as well as a single house and/or a single route, 7 drawings including several houses and multiple routes, and finally drawings exhibiting a “birds eye view” of the landscape (large area represented). The latter included villages instead of individual houses and fuelwood collection routes were absent (see Figure 5).
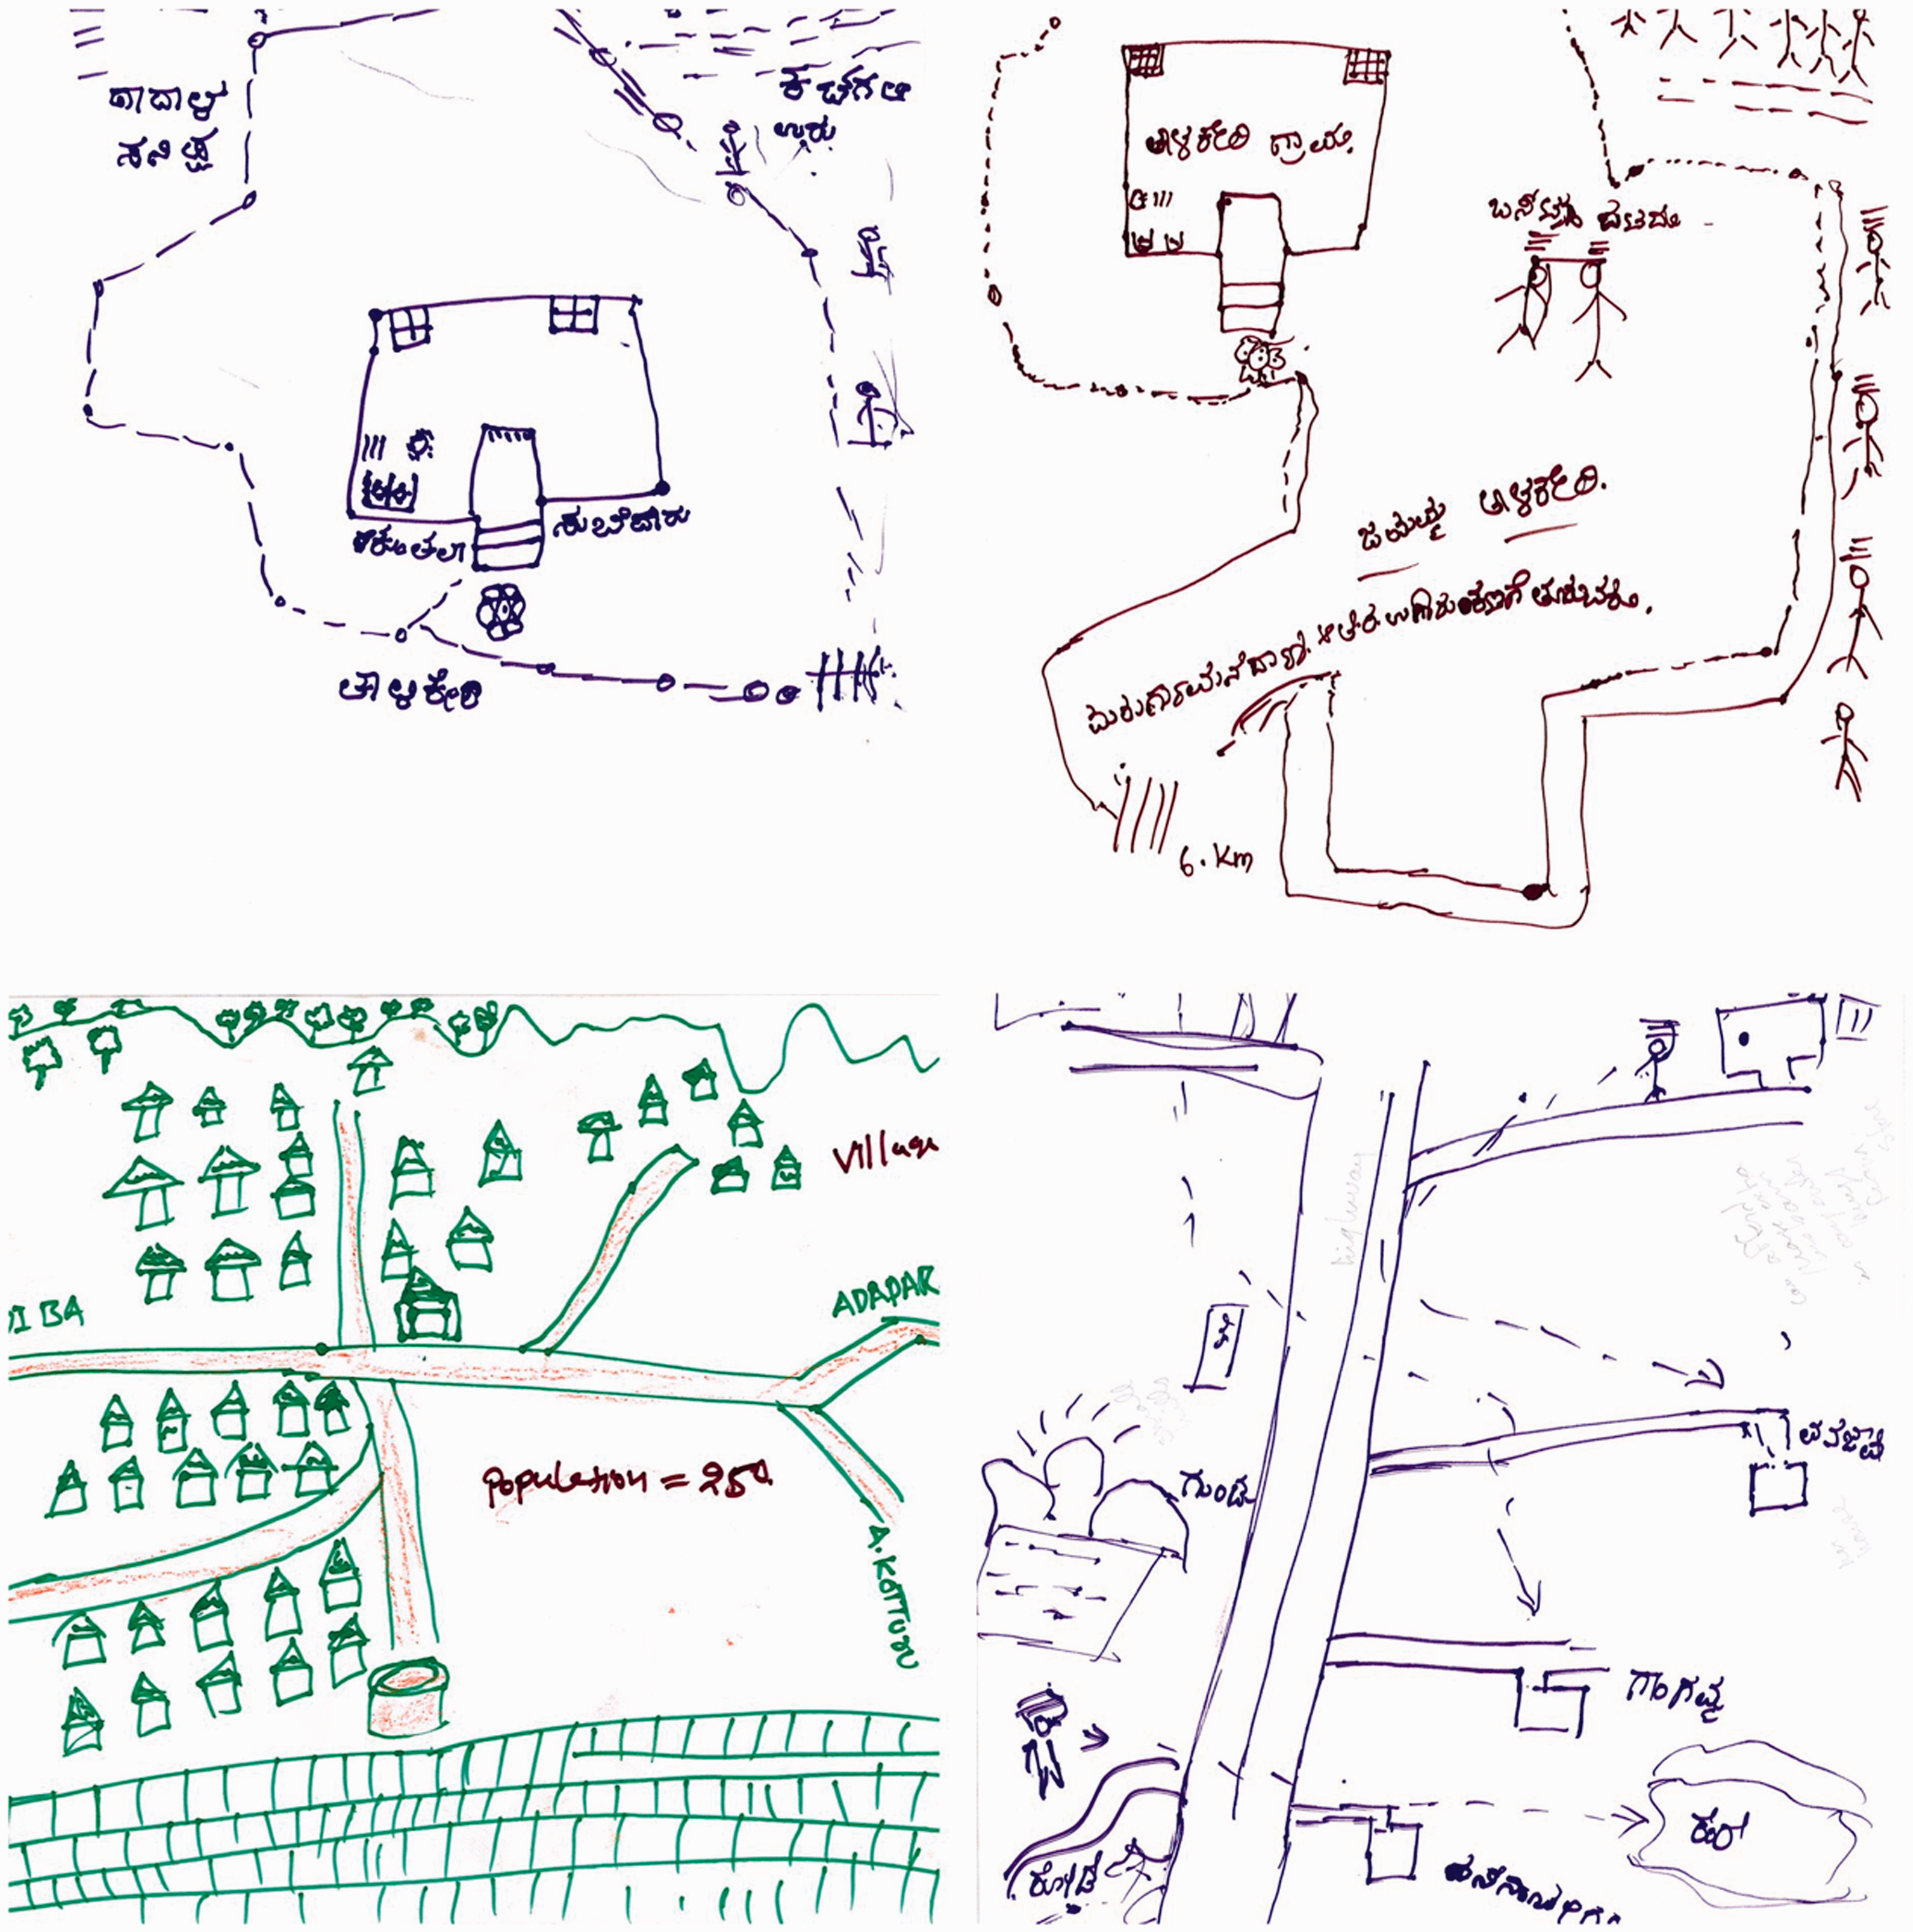
Drawings of fuelwood collection presented (clockwise) in order, from single house/route, to multiple houses/routes, to a village. The first three drawings are from NGO A, the fourth from NGO B.
Inclusion
Another way to analyze drawings is to assess whether certain features appear in a drawing at all. What the drawer chooses to include and exclude from their drawing may reflect individual priorities and personal experiences. For example, the inclusion of multiple people carrying fuelwood in a drawing may suggest fuelwood collection is more than a utilitarian activity. Rather, its inclusion may signify a group activity that creates, fosters, and encourages certain forms of social interactions (or shared burdens). This may convey the presence of a strong sense of community and support network amongst certain villagers.
Prominence
Prominence connotes the positioning and detail of certain image features included in drawings. We understand “prominence” to be related to the location of a drawing feature (e.g. its placement in the middle or periphery of the image) and/or the relative detail of that feature (e.g. providing more/less specificity or emphasis) (see Figure 6). Unlike scale, images do not exhibit a gradation vis-a-vis prominence. Nearly all images have something in the middle or have components that are afforded more attention and detail. In the context of fuelwood collection, we can compare how prominent or detailed a house or particular landscape feature is, based on the position and attention to detail it has been given in the drawing (Wee and Anthamatten, 2014). In turn, we may begin to understand how a feature’s prominence reflects the feelings, experiences, and priorities of the drawer and/or contributors.

Different features of the landscape are centrally located on the drawings. Clockwise from left: (a) a woman, (b) people collecting fuelwood, (c) village, river, and forest. The first drawing (a) is from NGO A, the second and third drawings are from NGO B.
Connections
Drawings may convey connections between multiple features in a landscape. In many cases, there are starting and ending points that connect locations and express movement through the landscape. These drawing characteristics may also help researchers appreciate qualitative attributes or differences between specific pathways. In this context, fuelwood collection may be viewed as a journey with temporal and spatial dimensions. For example, the fuelwood collection process may originate from the home and extend to the source of fuelwood, with people or other aspects of the drawing signaling different stages of the journey (see Figure 7). Importantly, these beginning and ending points are expressed differently, thus highlighting a range of fuelwood collection experiences in these villages.
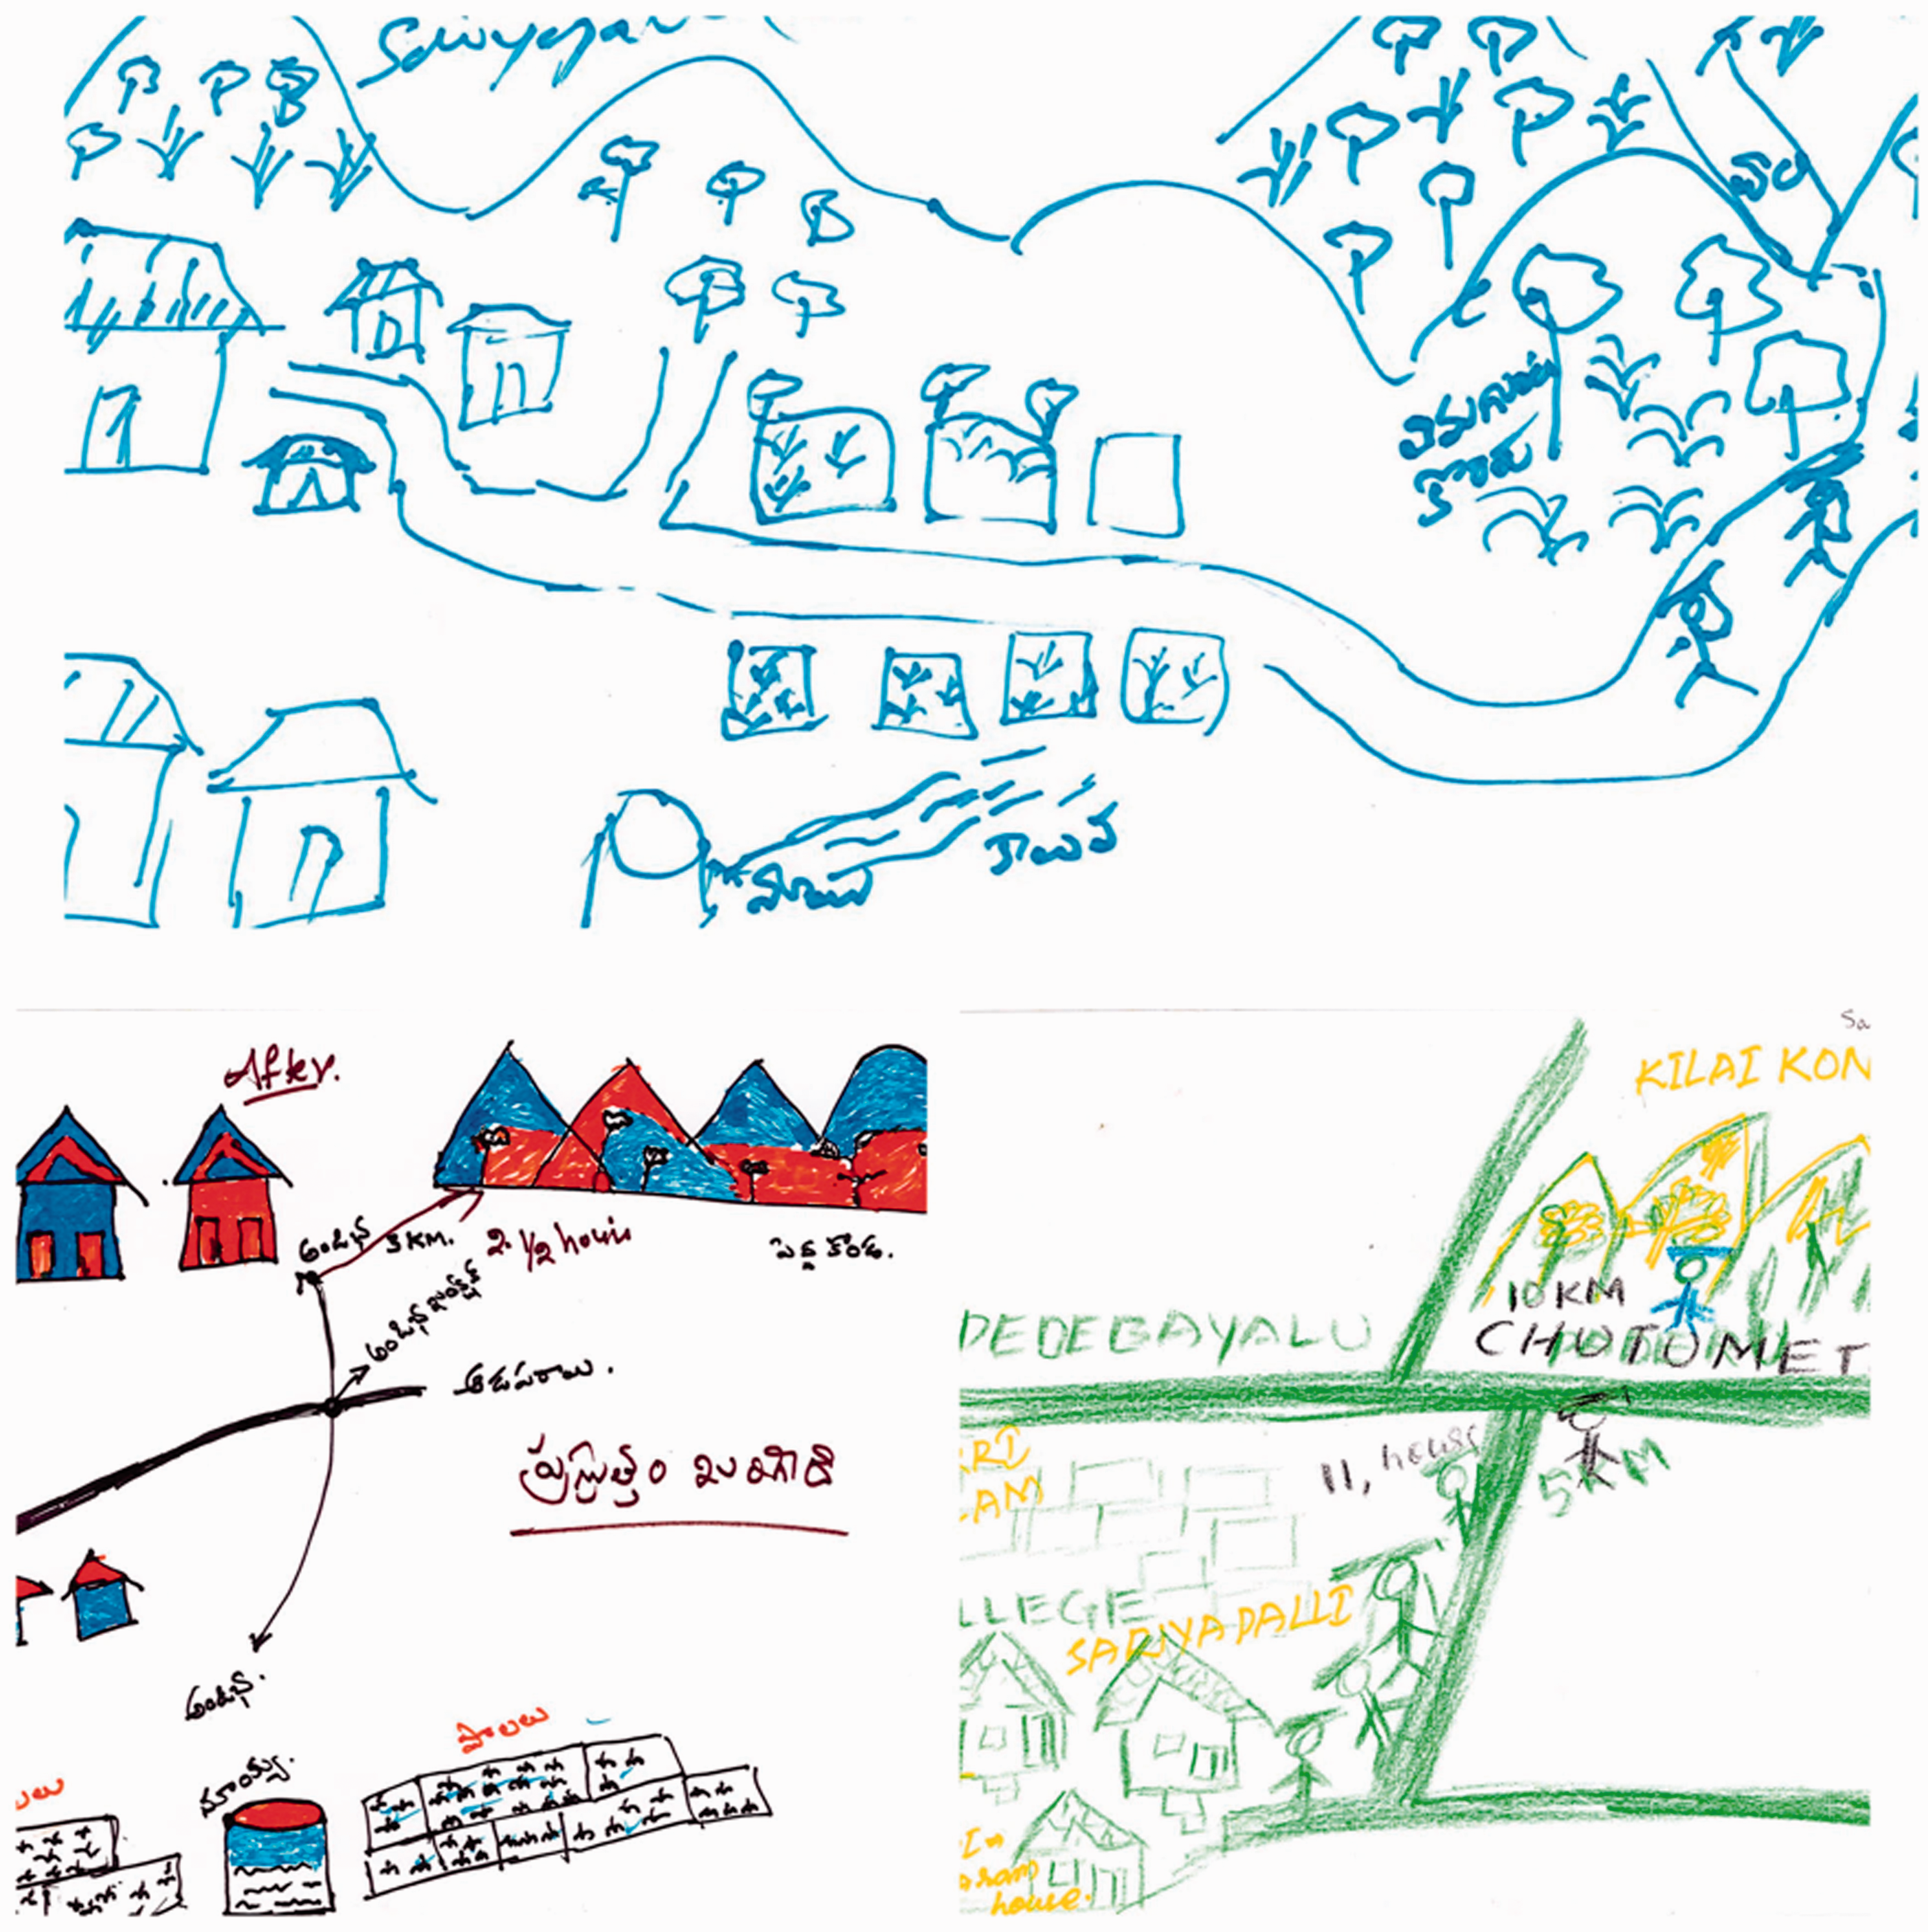
Drawings (clockwise) showing different beginning and ending points along fuelwood collection routes. These movements may be conveyed using different techniques, such as with implied movement (people walking) or with lines and arrows. All images from NGO B.
Relationality
It is also useful to consider the placement of certain features in relation to other features. We understand this form of relationality between human and/or environmental features to include proximity (close/far) and/or the relative position (above/below, clustered/spread out) of one item to another. There are multiple ways of relating to and knowing distances between places. For example, the first drawer (top left in Figure 8) placed their village closer to seemingly unbroken forest while another drawer put the same village further from certain forest patches (top right). In another comparison, one image placed people close together as they engaged with fuelwood collection (bottom right), while another image presented individuals as more spread out (bottom left), even though both images were drawn by people living in the same village. These drawings may reflect perceived human–environmental relationships (through spatial features of proximity and relative position) related to the fuelwood collection process.

The first two drawings (top, clockwise) from NGO B show the proximity and relative position of roads (central junction) to the adjacent mountains and forest. Meanwhile, the third and fourth drawings from NGO A show the proximity and relative position of people to homes.
Table 1 provides a summary of each theme and its analytic role in this study, as well as its applicability to other types of research and/or settings utilizing visual narrative analysis.
Description of ISD themes.
An ISD framework to enhance environment and development research
In this section, we describe how this analytical framework, the ISD, may yield new insights and generate other important considerations when used as part of visual narrative analysis in environment and development research. It is widely understood that top-down development projects are procedurally unjust and frequently produce negative outcomes in their target areas. This is particularly the case where voices external to a community are given priority when designing and implementing projects—a form of development viewed as a “colonial model” (Peet and Watts, 2002: 24) that arises when authorities make decisions without adequate local representation (Birkenholtz, 2008; Cooke and Kothari, 2001; Davis, 2005; Forsyth 2003; Ribot, 1998; Simon, 2014). In the context of our study, the prevailing development discourse assumes fuelwood collection is an entirely utilitarian and burdensome livelihood activity with few, if any, upsides relative to cookstoves. We contend that simply “designing” cookstove adoption into people’s lives has rarely yielded positive environmental or social outcomes (Khandelwal et al., 2017; Simon et al., 2020).
Participatory research methods are seen as corrective because they entail using explicit methods that incorporate the perspectives of people whom development efforts are supposed to help. 8 Scholars have long documented the potential benefits and challenges of employing research methods that elicit the viewpoints and voices of dispossessed communities and marginalized individuals (e.g. Chambers, 1994; Dickinson et al., 2010; Mosse 2001). New and/or different participatory methods are constantly sought, even within supposedly and already “participatory” development approaches. Numerous scholars in science and technology studies (STS), indigenous studies, political ecology, and environmental anthropology have grappled with the politics and processes influencing how people know and represent the world they experience (Gagné, 2019; Goldman et al., 2011; Jasanoff, 2004; Lave, 2012; Sium and Ritskes, 2013). We propose that the ISD, when used in concert with other participatory research methods, can help researchers challenge and critique dominant narratives found within conventional development orthodoxy. The following section highlights these research contributions.
Drawing on the ISD may reveal new information and emphasize “process”
Feminist political ecologists emphasize the importance of both embodiment and spatial relations in understanding how people relate to, and are influenced by, the environment (Nightingale, 2011; Edmunds et al., 1995; Sultana, 2009). While it may seem self-evident that collecting fuelwood requires moving through the landscape in a particular way, the ISD draws attention to the different ways fuelwood collection involves interacting with the landscape and the people within it. This is an activity that involves physical movements and interactions in material space, as well as social relationships that are embedded within the spaces traveled. This serves to counter the idea that fuelwood collection is a ubiquitous, universal activity where one simply “goes out and gathers wood”. For some, the act of fuelwood collection appears to require and generate an intimate knowledge of the places surrounding the villages where people live. This knowledge is gained by traversing through, and interacting with, particular landscapes (and the barriers, pathways, and detours within) to satisfy fuelwood needs. This reflects the sentiments of Soja (1980: 210) who noted four decades ago, that “space itself may be primordially given, but the organization, use, and meaning of space is a product of social translation, transformation and experience”. In this regard, some fuelwood collection paths are (perceived to be) at great distances from the homes of study participants, while others are more proximate. Some paths require cutting through private lands, while others move through public access roads. Furthermore, the ISD highlights the types of landscapes one traverses to collect fuelwood, and what it might mean to collect fuelwood (e.g. fuelwood as a social activity), instead of focusing solely on measurable outcomes (e.g. how much time it takes to collect fuelwood).
Additionally, the ISD allowed us to analyze the embodied subjectivities of individuals in rural India who participated in this research, and their relationships to energy procurement (in this case through fuelwood collection) as they navigate social-ecological landscapes. As Sultana (2009) notes, “subjectivities are not abstract notions but are lived in bodies, in spaces, through practices and have materialities that need attention”. Sultana’s work analyzed how arsenic contamination of drinking water, and the subsequent marking of private and public tube wells as “safe” or “unsafe” for drinking led women to find alternative sources of drinking water for themselves and their families. These women needed to renegotiate access to safe drinking water (via access to tubewells marked “safe”) while simultaneously renegotiating familial and community expectations on how they navigated public and private space. Our hope is that the ISD contributes to ways of understanding the social-ecological processes that feminist political ecologists (e.g. Mollett and Faria, 2013; Nirmal and Rocheleau, 2019) have called our attention to, which are integral to the formation of subjectivities along intersectional axes of social difference (such as gender, race, caste, class) frequently targeted by development interventions.
Drawing on the ISD can bring spatial considerations to the fore
Compared with interviews, surveys, observation, and other research methods, visual narratives hold unique possibilities for generating insights on the spatiality of human interactions with their environment. As the ISD (Table 1) suggests, individual experiences with the environment include considerations of scale, connections, inclusion, prominence, and relationality. For example, although interviews may capture important temporal evidence, such as how collection routes, landscapes, and experiences have changed from one year to the next, they lack an explicit spatial presentation and layout. Use of the ISD enables researchers to consider relative distance, proximity, position, connection, hierarchy, extent, and proportion—all of which are geographical considerations that may enable a more robust account of perceived and actual human–environment relationships. As our research demonstrates, the ISD as an analytic framework can serve as a useful and more spatially oriented supplement to other quantitative and qualitative methodologies.
Drawing on the ISD may enhance critical research and generate counter-narratives
Mitchell (2011) describes how visual-based research can be directed toward social change, noting that “from photovoice…to participatory video, there is an inherent sense that [visual methodologies] will have an impact – and thereby ‘change the picture’” (p. 179). For instance, children in Swaziland were given disposable cameras and asked to take pictures of places where they felt safe and not so safe in school. Numerous children, particularly girls, took pictures of toilets and expressed fears of sexual violence. Thereafter, the picture in Swaziland changed to include sanitation as well as child protection (Mitchell, 2011). Likewise, in her seminal work on participatory research, Katz (1986) used film to highlight the realities of life for children in Sudan. She “changed the picture” by drawing attention to underlying issues of power and privilege in agricultural economies. Using participatory video in South Africa, Tremblay and Harris (2018) “changed the picture” by empowering individuals to be agents of change in their communities. We propose that in generating dialogue about the social responsibilities and inequities of development projects, and by elevating the mundane in fuelwood collection, the ISD offers a similar opportunity to “change the picture”.
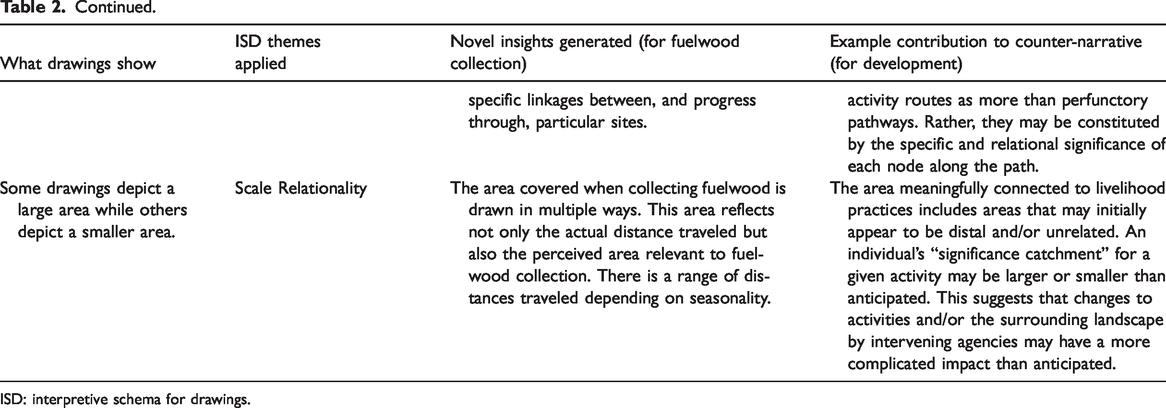
The ISD presents an effective critical lens that can challenge top-down (and even some participatory) development interventions by providing insights into the socio-spatial behaviors and considerations of individuals such programs are intended to benefit. This is achieved by, for example, eliciting participant perceptions of, priorities in, movements through, and experiences with their surroundings. For instance, development agencies may agree that fuelwood collection over time has become more difficult, but precisely what the difficulties are and how they are experienced and perceived by different social groups may be better understood through the use of an accompanying ISD analytical framework (see Table 2). Additionally, if prioritized, this research approach can illuminate the nuances of gender, caste, class, and other intersectional identities engaging with fuelwood collection (and thus avoid a one-size-fits-all development intervention). We suggest the ISD is also useful when used in conjunction with other participatory qualitative and quantitative research methods such as interviews, surveys, and oral histories, all of which may provide complementary information enabling more robust critical analysis.
Novel insights and potential counter-narratives.
ISD: interpretive schema for drawings.
Drawing on the ISD complements participatory, community-based cartography and qualitative geographic information systems
We view the ISD as an analytic framework that complements other explicitly spatial methods like qualitative geographic information systems (QGIS) that relies on both GIS and more humanistic methods such as sketch maps (Boschmann and Cubbon, 2014), and inductive visualization techniques (Knowles et al., 2015). As with QGIS and other critical cartography and participatory GIS research (Elwood, 2010), the goal is to make human experiences visible, more tangible, and ultimately more personal (Caquard and Cartwright, 2014). This is evidenced, for example, by the dimensions of inclusion and prominence in the ISD (Table 2) where detailed information about fuelwood collection provides not only insight into lived experiences but also reveals personal perceptions of this activity. We therefore encourage the use of visual narratives and the ISD alongside other digital representations. In fact, doing so may provide opportunities for comparative and cross-reference analysis (by, for example, comparing relative and absolute distances on drawings and digital maps).
Analytic frameworks like the ISD can be part of an exploratory or explanatory mixed methods approach
On the one hand, the ISD can generate evidence that contributes directly to the construction of narratives and to the advancement of knowledge on a given topic. This approach may follow an explanatory mixed methods format where researchers collect other types of data first and then use those findings to justify and inform the visual narrative analysis phase. For example, drawings in this study have contributed to our understanding of group foraging dynamics, where people may travel together, fan out individually and reconvene again at various points along the collection path. These inferences from drawings supplement and corroborate previously collected data. On the other hand, the ISD may prove to be a useful initial method for gathering preliminary information that provokes further questions and subsequent lines of inquiry. This follows an exploratory mixed methods approach, where drawings may be a useful form of precursory research used principally for information gathering purposes. For example, if we had collected and analyzed drawings at the outset (instead of organizing drawings after having gained some insights on the collection process), we may have recognized certain visual features and patterns—such as how many women indicated repeatedly joining and separating during the fuelwood collection process—and used those insights to pursue further lines of inquiry.
Analytic frameworks like the ISD operate within existing power hierarchies
While the ISD allows for new insights, it does not obviate the need to understand context. There are multiple points that emphasize the power dynamics in visual narrative analysis that we alluded to earlier. First, the process of eliciting visual data is itself revelatory of existing power hierarchies (Caquard and Cartwright, 2014) given the relationship between researcher and researched (see Linda Tuhiwai Smith’s (2013) Decolonizing Methodologies, which provides an extensive analysis of the ways in which the very act of research itself is imbricated in imperialism). Here, the drawing prompts themselves reveal certain framings that researchers bring to the topics at hand. Then there is the process of drawing itself, followed by interpretation. Each of these steps is nestled within the politics of knowledge production. Our proposed ISD does not sidestep any of these issues. Nonetheless, the ISD provides a way to elicit insights from marginalized communities whose subjectivities (along numerous axes) may obscure their preferences and views from dominant development discourses as we discuss in this section.
The process of collecting drawings allows researchers to better understand power dynamics in fieldwork sites (Parker, 2006). Recall, for example, that in certain villages men insisted on being the “drawer”. By noting who draws for whom, who chooses to draw but does not speak, whose drawing is lauded as being accurate, and so on, a deeper understanding of uneven social contexts may be possible. Furthermore, the person drawing and other contributors will, in turn, have their insights interpreted by the researcher, which will likely influence what is and is not seen (the ISD is meant to guide this interpretive process). It should be noted that drawings as a visual narrative may also provide an opportunity for research participants to “define the problem of interest” and to “reveal what might be uncomfortable or unknown” (Keller et al., 2008: 429). Second, the drawings themselves highlight the power-laden contexts through which people interact with their environments. As Edmunds et al. (1995: 4) stated, “the meaning ascribed to the landscape, the values attributed to its various elements, and the normative visions of that landscape's future can generate very different cognitive maps…” These differences may or may not result in material differences in the practices of fuelwood collection (here, further research may need to be carried out). However, they suggest the need to (a) tend to differences in how individuals (across intersecting lines of gender, class, caste, mobility, etc.) come to know and value the landscapes in which they live and work, and (b) understand that an individual’s ability to recall spatial relationships (e.g. locations and routes) is always situated in and informed by, complex socio-spatial dynamics.
Conclusion
Top-down development projects have long been critiqued for their negative outcomes and procedurally unjust qualities. Participatory methods are thus seen as corrective because they utilize methods that incorporate the perspectives of people development efforts are ostensibly meant to help. For decades now, scholars have documented the potential benefits and challenges of employing research methods that elicit the priorities and voices of dispossessed communities and marginalized individuals. Our study explores how visual narratives in the form of drawings may improve our understanding of communities that are targeted by development projects, and in doing so, complement other forms of participatory research that contest development orthodoxy. Put another way, other methods such as surveys and interviews may allow the perspectives of marginalized communities to be “heard”, but visual narratives allow insights from these groups to be “seen”.
Specifically, we propose an ISD to analyze counter-hegemonic development narratives. This analytic framework contains five themes or interpretive lenses: scale, centrality, inclusion, connections, and relationality, which allow researchers to animate a range of spatialities that are central to geographic studies of human–environment dynamics. Analysis of drawings using an ISD enables us to emphasize emic socio-spatial perspectives grounded in everyday realities. Fuelwood collection, for example, contains a particular set of embodied experiences along pathways navigated during the energy procurement process. While image-based research approaches such as counter- and community-mapping exercises encourage the expression of alternative knowledges in the visual form, the ISD proposed here outlines a specific set of guidelines for evaluating (socially and spatially) locally generated drawings and other visual renderings. In this way, the ISD “changes the picture” by making visible the challenges and complexities that communities face (Mitchell, 2011), and that development projects need to take into account. By linking research outcomes to social change, the ISD offers an important critical methodology through which place- and person-specific experiences can be represented, understood and ultimately validated.
Highlights
Drawings as a visual narrative animate a range of spatialities that are central to geographic studies of human–environment dynamics. We propose an ISD with five themes or interpretive lenses: scale, centrality, inclusion, connections, and relationality. Our proposed ISD presents a set of guidelines for interpreting and making sense of drawings and other participatory visual renderings. Analysis of livelihood activities using an ISD emphasizes emic socio-spatial perspectives grounded in everyday realities (counter-narratives). The ISD is thus a critical methodology through which the perspectives of marginalized groups can be represented and understood.
Footnotes
Declaration of conflicting interests
The authors declared no potential conflicts of interest with respect to the research, authorship, and/or publication of this article.
Funding
The authors disclosed receipt of the following financial support for the research, authorship, and/or publication of this article: The research was funded through US National Science Foundation Grant (No. 1539746).