
Abstract
Background
Cognitive impairment patients are prone to malnutrition, which further promotes cognitive decline. Cognitive impairment patients are unable to accurately answer subjective questions in the nutrition screening scale. Therefore, it is crucial to establish a nutritional risk prediction model using objective evaluation indicators to evaluate the nutritional status of cognitive impairment patients during hospitalization.
Objective
To develop a nomogram for prediction of the nutritional risk in cognitive impairment patients.
Methods
The least absolute shrinkage and selection operator (LASSO) was used for regression analysis, and predictive factors were selected based on 10-fold cross validation. Then, using the selected predictive factors, multivariable logistic regression analysis was performed to obtain the final clinical prediction model. Moreover, the performance of the model was evaluated from receiver operating characteristic curve, calibration curve, and decision curve analysis. Further assessment was conducted through internal validation.
Results
Six predictive factors were selected from 20 variables through LASSO, including body mass index, age, triglyceride, taking cognitive-improving drugs, controlling nutritional status, and geriatric nutritional risk index. The area under the receiver operating characteristic curve of the training cohort was 0.91, while the validation cohort was 0.88, indicating that the model constructed with 6 predictors had moderate predictive ability. The decision curve analysis showed that the threshold range for both groups was 0.00–0.80, with the highest net benefit 0.76 for training cohort, while 0.77 for validation cohort.
Conclusions
Introducing six predictive factors, the risk nomogram is useful for predicting nutritional risk of cognitive impairment.
Keywords
Introduction
Cognitive impairment refers to one or more functional impairments in memory, sensation, perception, language, thinking, imagination and other cognitive functions caused by various reasons.1,2 Cognitive decline occurs throughout the aging process and can result in mild cognitive impairment (MCI) and dementia. 3 Dementia is a syndrome characterized by acquired cognitive impairment that leads to significant decline in patients’ daily living, learning, work, and social skills. 4 There are several different types of dementia in clinical practice, among which Alzheimer's disease (AD) is the most common type of dementia in clinical practice. 5 According to the World Trade Organization, about 50 million people worldwide suffer from dementia, and the number will triple by 2050. 6
According to the definition of the World Health Organization, malnutrition refers to an individual's insufficient, excessive, or unbalanced intake of energy and/or nutrients, including malnutrition (emaciation, developmental delay, underweight), vitamin or mineral deficiencies, overweight/obesity, and the resulting diet-related non-communicable diseases. Cognitive impairment patients may have difficulty planning their diet due to memory loss or decreased decision-making ability. The accompanying psychological and behavioral symptoms, such as agitation, depression, or hallucinations, may lead to loss of appetite or refusal to eat in cognitive patients. All of the above can lead to malnutrition. Studies have shown that malnutrition will further contribute to cognitive decline and affect the prognosis of cognitive dysfunction. 7 In cognitive impairment patients, there is a bidirectional, reciprocal relationship between malnutrition and cognitive impairment. 8 Therefore, the nutritional status of the older adults is closely related to their health, and good nutritional status is an important factor in determining their survival advantage, and timely detection and correction of malnutrition is crucial. 6 According to a meta-analysis published in The Lancet, malnutrition is a risk factor for cognitive decline, and comprehensive modulation of lifestyle and other factors may prevent or delay the onset of dementia by 35–40%. 9 Maintaining a high-quality diet can help improve cognitive function and slow cognitive decline in older adults.1,10
Cognitive impairment patients are unable to accurately answer the subjective questions in the nutritional screening scale, which tends to bias the information and is cumbersome and time-consuming, resulting in some missed diagnosis or misdiagnosis in the initial screening of malnutrition. At present, objective nutrition assessment tools include geriatric nutritional risk index (GNRI), prognostic nutritional index (PNI), and controlling nutritional status (CONUT).11–13 GNRI has been widely used to assess the nutritional status of clinically elderly patients. As an early screening tool for malnutrition and a continuous status monitoring tool during treatment in hospitalized patients, CONUT is suitable for all populations. PNI is an indicator for evaluating the nutritional status of surgical patients, predicting surgical risks and prognosis. Therefore, GNRI, CONUT and other objective indicators were studied as influencing factors of nutritional risk in elderly patients with cognitive impairment in our study, so as to analyze the value of objective nutritional evaluation indicators in the nutritional assessment of elderly patients with cognitive impairment. Meanwhile, by establishing a nutritional risk prediction model for these patients, we expect that it can be used as an effective tool to help evaluate the nutritional status of cognitively impaired patients during hospitalization, which can provide a theoretical basis for further improvement of prognostic assessment and adjustment of nutritional treatment plan.
Methods
Study patients
In this study, objective nutritional evaluation indicators were collected from 307 patients (July 2023 to June 2024) with cognitive impairment (including MCI and AD) aged 65 years and above who were hospitalized in the geriatrics department at Chongqing Mental Health Center. The inclusion criteria were as follows: (1) According to the following criteria, the geriatrics of our hospital should make a clear diagnosis of cognitive impairment patients: Diagnostic criteria of MCI: According to the diagnostic criteria of MCI proposed by the Diagnostic and Statistical Manual of Mental Disorders (DSM-IV) of the American Psychiatric Association; and Diagnostic criteria of AD: According to the diagnostic criteria of AD proposed by DSM-IV of the American Psychiatric Association. (2) Age ≥ 65 years old. (3) Patients with complete case data and auxiliary examination information. Exclusion criteria were as follows: (1) Acute infectious diseases such as lung infection. (2) Malignant tumor diseases in various systems such as multiple myeloma. (3) Severe consumptive diseases such as cirrhosis. (4) Other diseases that can cognitive impairment, such as vascular dementia, hypothyroidism, neurosyphilis, HIV infection, etc. (5) Patients with incomplete case data and auxiliary examination information. The study was approved by the Ethics Committee of Chongqing Mental Health Center on 30 June 2023. The consent procedures for participants in this study were as follows: (1) Participants or participants’ guardians were fully informed. (2) Participants or participants’ guardians were completely voluntary. (3) Protecting the privacy of the participants.
Data collection
We have identified 20 objective evaluation indicators for nutritional risk in cognitive impairment patients through nutrition assessment tools and corresponding research.14–17 Basic data were collected, including age, gender, body mass index (BMI), education level, history of hypertension, history of diabetes, history of coronary heart disease, hemoglobin, serum sodium, fasting blood sugar, high density lipoprotein, low density lipoprotein, serum albumin, total cholesterol, triglyceride (TG), total lymphocyte count, and whether to take lipid-lowering or cognitive-improving drugs. In addition, CONUT and GNRI were calculated for further analysis.
Statistical analysis
In this study, R software was used for all statistical analyses, which can be downloaded at http://www.r-project.org/. All eligible patients were divided into a training cohort and a validation cohort, with a segmentation ratio of 7:3. The data from the training cohort was used for logistic regression analysis and constructing a nomogram, while the data from the validation cohort was used to validate the model. Continuous variables were represented by mean and standard deviation (x ± s), and t-tests or rank sum tests were used for comparison depending on the situation. Categorical variables were represented as frequency and percentage (n, %). These data were compared using chi square test or Fisher's exact test. After screening variables by least absolute shrinkage and selection operator (LASSO) regression, a Logistic regression clinical prediction model was constructed, and a Nomogram plot was drawn. The receiver operating characteristic (ROC) curve was used. The area under ROC curve evaluation model was calculated. The calibration curve was used to evaluate the correction of the nutritional risk nomogram. Based on the net benefit at different threshold probabilities, decision curve analysis was used to determine the clinical utility of nomogram.
Results
Patient characteristics
The final analysis included 307 cognitive impairment patients aged 65 years and above. Table 1 displays patient demographics and baseline characteristics. The baseline clinicopathologic features of patients in the training cohort and the validation cohort were similar. Nutritional risk was present in 75% (162/215) of patients in the training cohort and 77% (71/92) of patients in the validation cohort.
Patient demographics and baseline characteristics.

n(%).
Welch Two Sample t-test; Pearson's Chi-squared test.
Independent risk factors in the training cohort
All 20 characteristics were considered as potential predictors. We applied LASSO regression algorithm based on each characteristic to the training cohort for characteristic selection. 6 potential predictors were selected and had with non-zero coefficients in the LASSO regression model (Figures 1(a) and 2(b)). LASSO regression results showed that BMI, age, taking cognitive-improving drugs, TG, CONUT, and GNRI were risk factors for nutrition.

Variable selection by LASSO binary logistic regression model. A coefficient profile plot was produced against the log(lambda) sequence (a). Six variables with nonzero coefficients were selected by optimal lambda. By verifying the optimal parameter (lambda) in the LASSO model, the partial likelihood deviance (binomial deviance) curve was plotted versus log(lambda) and dotted vertical lines were drawn based on 1 standard error criteria (b).

Development of the risk nomogram. The nutritional risk nomogram was developed with the predictors including age, BMI, taking cognitive-improving drugs, TG, CONUT, and GNRI.
Prediction model development
The logistic regression analysis results of BMI, age, taking cognitive-improving drugs, TG, CONUT and GNRI are shown in Table 2. By introducing 6 independent predictors mentioned above, we plotted a nutritional risk nomogram as shown in Figure 2.
Predictors for the nutritional risk of patients with cognitive impairment.

OR: Odds Ratio; CI: Confidence Interval.
Prediction model verification
The merged area under the nomogram's ROC curve in the training cohort was 0.91, and the merged area in the validation cohort was 0.88 (Figure 3), indicating that the prediction model performs well. The nomogram calibration curve for predicting nutritional risk in cognitive impairment patients also showed good consistency (Figure 4(a) and (b)). Based on the above verification results, the nomogram of the model has good predictive ability.

ROC curves of the nutritional risk nomogram derived from the training and validation set. The x-axis is the “1-Specificity”, and the y-axis is “Sensitivity”.
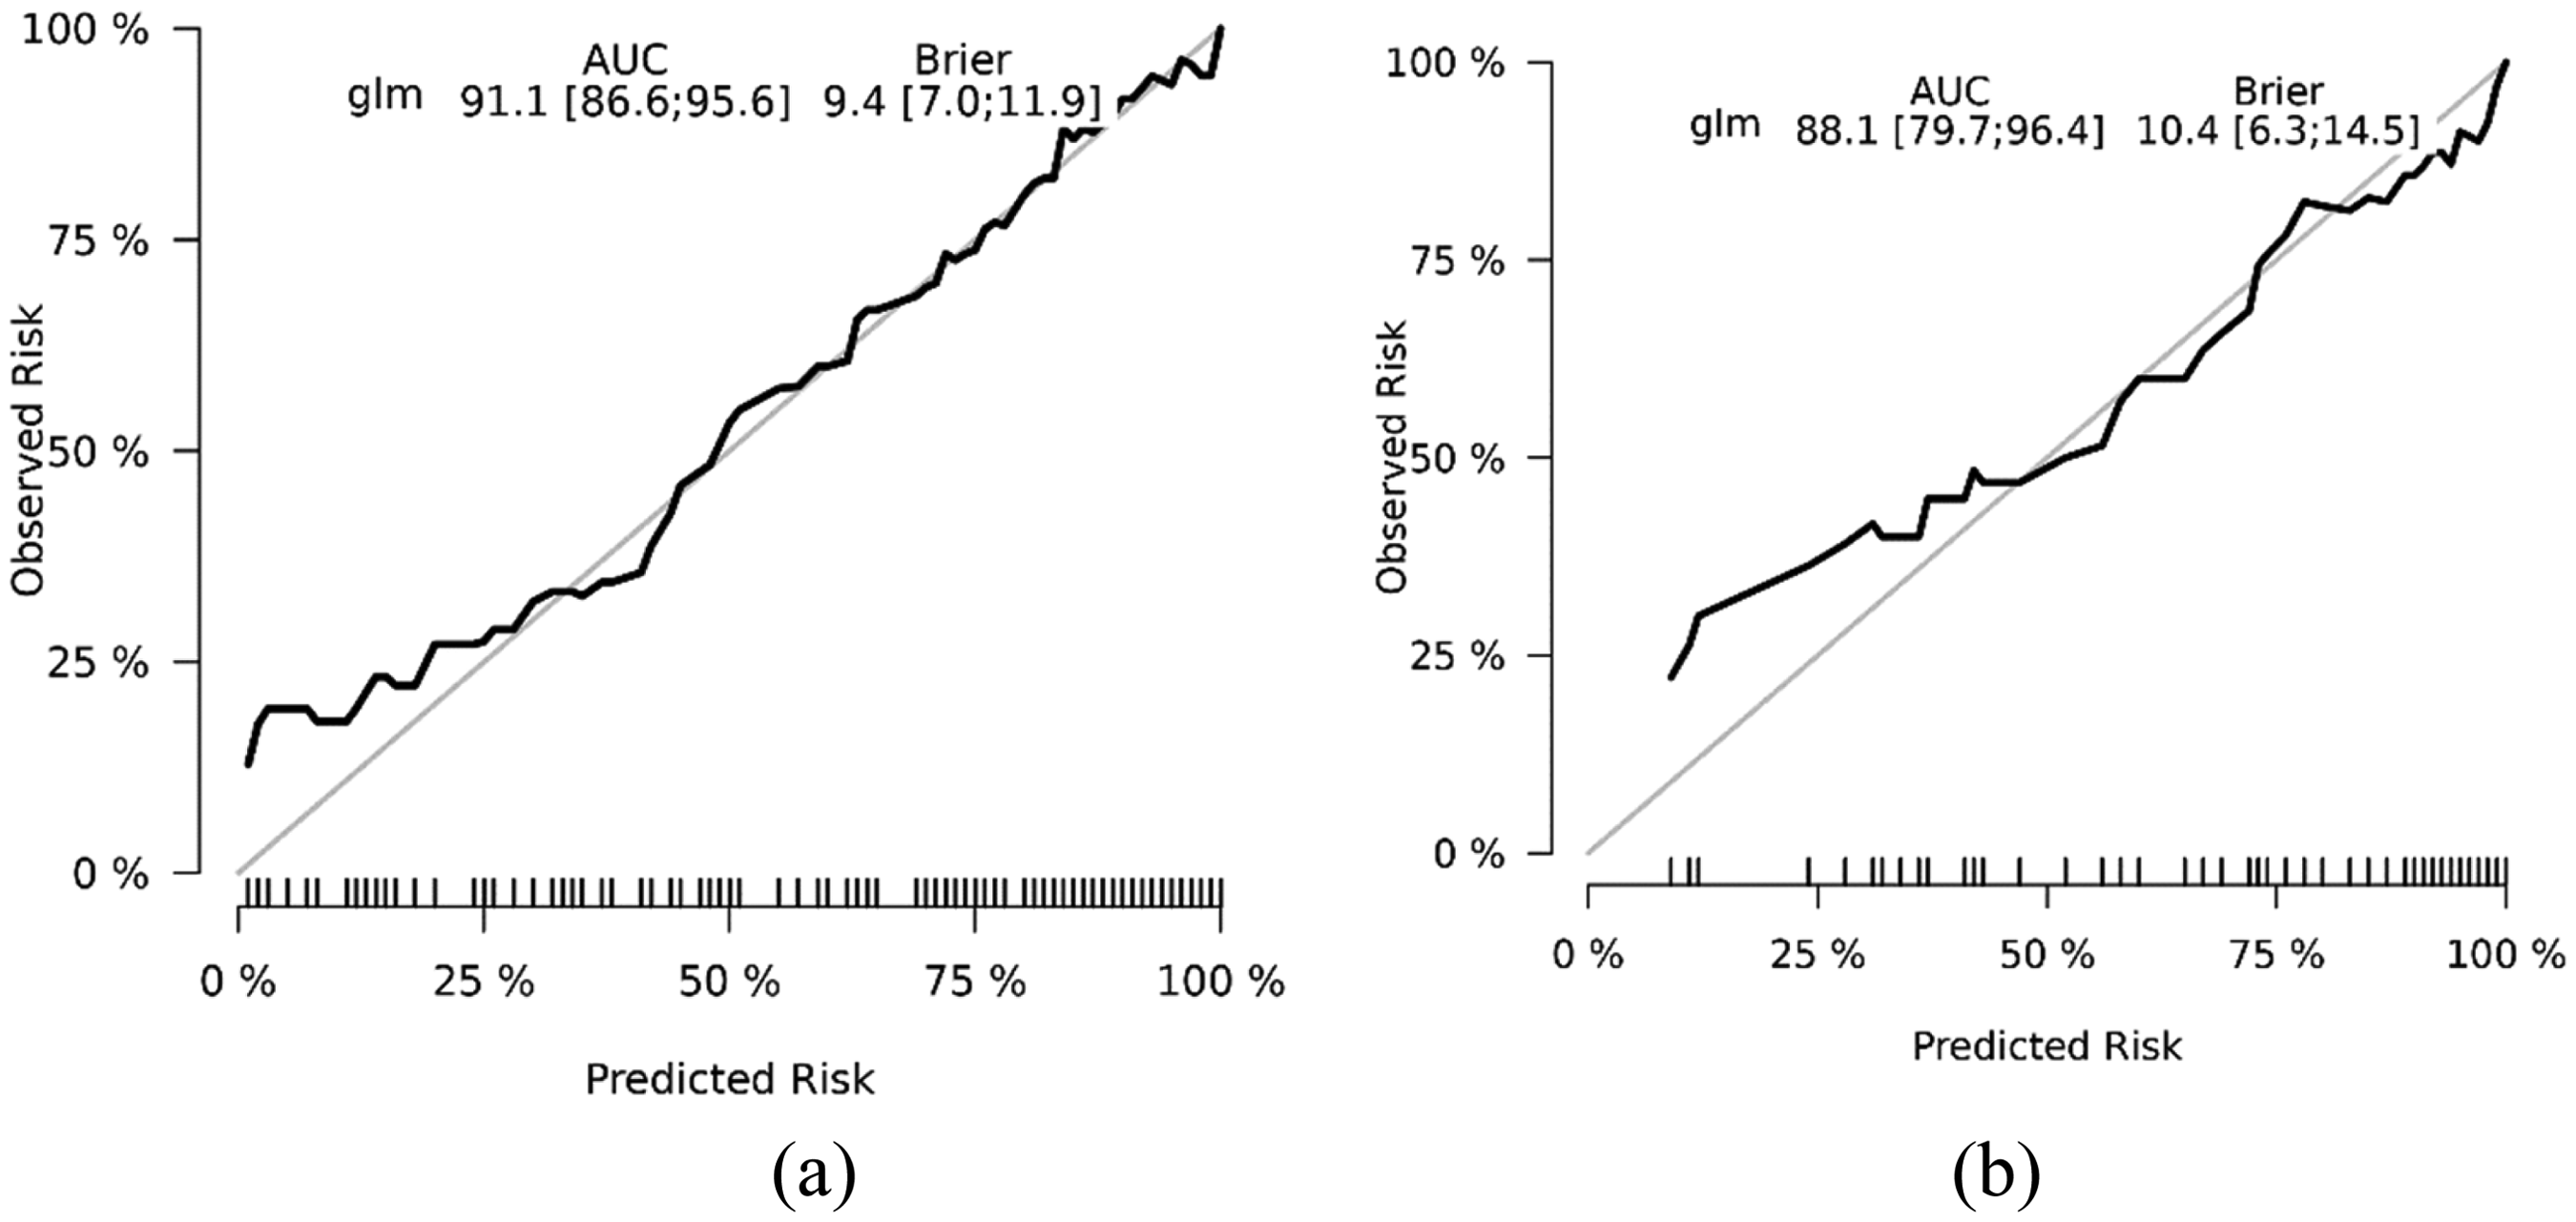
Calibration curves of the nutritional risk nomogram prediction. The y-axis meant the actual diagnosed malnutrition. The x-axis meant the predicted risk of nutrition. The thin solid line meant a perfect prediction by an ideal model. The thick solid line represented the performance of the training set (a) and validation set (b), which indicated that a closer fit to the diagonal regular line represented a better prediction.
As the decision curve analysis shown in Figure 5(a) and (b), the threshold range for both groups was 0.00–0.80, with the highest net benefit 0.76 for training cohort, while 0.77 for validation cohort. The results indicated that this nomogram in this study provided high benefit value for patients with cognitive impairment.

Decision curve analysis for the nutritional risk nomogram. The y-axis measured the net benefit. The thick solid line represented the assumption that all patients were not malnourished. The thin solid line represented the assumption that all patients were malnourished. The red line represented the risk nomogram. (a) From the training set and (b) from the validation set.
Discussion
Nomograms assigns scores to each independent variable based on the size of their partial regression coefficients in the multi-factor model, and then adds the scores of each independent variable to obtain the total score. Based on the total score, the prediction of individual outcome events is estimated. Nomograms is a commonly used tool for evaluating prognosis and decision-making, capable of generating clinical event predictions by combining different prognostic and determinant variables, 18 and quantifying individual risk by incorporating multiple significant prognostic factors. 19 Nomograms fulfill our need for comprehensive models of biology and clinical practice and enable us to drive personalized healthcare. The nomogram is calculated quickly through user-friendly digital interfaces, providing greater accuracy and easier to understand prognostic information than conventional staging. 20 Overall, the nomogram provides strong support for clinical decision making through its intuitive and easy to understand characteristics, as well as powerful data analysis capabilities.
In this study, approximately 76% of the patients with cognitive impairment are malnourished. In the analysis of risk factors, BMI, age, taking cognitive-improving drugs, TG, CONUT, and GNRI were connected with the risk of developing malnutrition in cognitive impairment patients. Based on this, 6 available variables were used to construct and validate a new nutritional risk prediction tool for cognitive impairment patients. This predictive model showed that lower BMI, older age, lower TG, taking cognitive-improving drugs, CONUT and GNRI were key individual factors determining nutritional risk in cognitive impairment patients. Introducing basic information and biochemical indicators into the nutritional risk nomogram is beneficial for facilitating individualized prediction of nutritional risk in patients with cognitive impairment. Our study provided a relatively accurate nutritional risk prediction tool for cognitive patients. It exhibited good discriminative and calibration abilities, indicating that the nomogram can be widely applied and accurately used because of its substantial sample size. The study focused on a specific geographic area, which might limit the generalizability of the findings. So, more efforts are needed to improve the model, making it more accurate and practical.
Weight loss is a significant clinical feature of cognitive impairment, which begins even before the disease is diagnosed and becomes more ordinary as the disease progresses. Loss of smell, taste, and appetite are classical symptoms of early cognitive impairment and are also associated with early weight loss. 8 BMI is one of the most commonly used methods for evaluating the nutritional status of the human body and is globally recognized as an important indicator of physical health. A study on cognitive impairment found that for patients with early cognitive impairment, a higher body mass index indicates good nutritional status and cognitive function. 21 These are consistent with the results of this study.
On the one hand, the condition of patients with cognitive impairment gradually worsens with age, 22 and the more severe the condition will lead to reduced food intake and deterioration of nutrition. On the other hand, patients with cognitive impairment are perhaps affected by age-related impairments, disabilities, and comorbidities (e.g., loss of appetite, chewing problems, digestion and absorption problems), resulting in reduced food intake and severe muscle loss, leading to malnutrition. 8 Age is a separate item in the NRS 2002 score, and in this study, age is consistent as one of the factors affecting the nutritional risk of cognitive impairment.
High triglycerides are widely regarded as the enemy of health. 23 High triglycerides increase the risk of cardiovascular diseases in young and middle-aged people. But in older adults, high triglycerides mean better nutrition and better physical health. Triglycerides account for 95% of dietary fat and are the main source of energy for the brain. Older adults with low triglyceride level experience more significant tissue atrophy in the memory area of the brain. That is to say, compared to people with lower triglyceride level, those with higher triglyceride level are less likely to suffer from cognitive impairment. Cognitive impairment patients with lower triglyceride level are more prone to have lighter weight, malnutrition, and weakened health status, and higher triglyceride level may reflect better lifestyle behaviors. 24 Taking cognitive improvement drugs can improve patients’ cognitive function or delay the decline of cognitive function. However, cognitive improvement drugs also have corresponding adverse reactions. Adverse gastrointestinal reactions such as anorexia and gastrointestinal dysfunction can cause nutritional deficiencies in patients with cognitive impairment. The sedative effect of the drugs may reduce eating motivation and dietary intake, ultimately leading to swallowing disorders and malnutrition.
CONUT is composed of serum albumin concentration, total number of peripheral blood lymphocytes and total cholesterol level, which is one of the scoring tools for objectively evaluating nutritional status. Its prognostic value is also clear in hospitalized patients. Serum albumin in the scoring can be used as an indicator of protein reserve, cholesterol as a parameter of calorie expenditure and energy reserve, and total lymphocyte count as an indicator of immune defense loss caused by malnutrition. Research has shown that the biochemical parameters used in CONUT are not only indicators of disease severity, but also indicators of malnutrition. 13 GNRI is composed of serum albumin, height, and weight, and is a nutritional screening tool for evaluating elderly hospitalized patients. It is generally believed that the accumulation of beta amyloid protein can interfere with communication between neurons and activate immune cells, leading to impaired brain cell function. Albumin can bind to beta amyloid protein and inhibit its aggregation to form sticky plaques, thereby preventing damage to brain function and cognitive decline.25,26 Therefore, GNRI can be used for nutritional assessment of older adults with cognitive impairment. In our study, GNRI and CONUT were identified as one of the influencing factors for nutritional assessment in patients with cognitive impairment, which indirectly reflects the feasibility of objective nutritional assessment tools.
Conclusion
In this study, we constructed a simple, objective, and reliable nomogram combining BMI, age, taking cognitively improving drugs, TG, CONUT, and GNRI to help clinical physicians and cognitive impairment patients evaluate nutritional risk. Based on the evaluation results, clinical physicians and patients can adopt more targeted medical interventions in a timely manner. Due to the limitations of the predictive model, there is still much room for improving the nomogram and increasing its clinical utility.
Footnotes
Acknowledgments
Data used in this study was from geriatrics department at Chongqing Mental Health Center.
Author contributions
Yuhang Chen (Data curation; Methodology; Software); Junlin Diao (Formal analysis); Xuezhuang Ren (Formal analysis); Chunxiang Wei (Formal analysis); Xue Zhou (Data curation; Methodology; Writing – original draft; Writing – review & editing).
Funding
The authors disclosed receipt of the following financial support for the research, authorship, and/or publication of this article: This study is funded by Chongqing Shapingba District Technology Innovation and Application Development Project, grant 202379.
Declaration of conflicting interests
The authors declared no potential conflicts of interest with respect to the research, authorship, and/or publication of this article.
Data availability
The dataset supporting the conclusions of this article is included within the article.