
Abstract
Background
Diet plays an important role in the risk of Alzheimer's disease (AD) and dementia. Adherence to the Mediterranean diet is regarded as one way to reduce risk. Fish is a component of the Mediterranean diet. Participant variables change with time, resulting in “regression dilution”.
Objective
The objective is to investigate the role of follow-up period after measurement of dietary fish intake with risk of AD and dementia.
Methods
A recent meta-analysis of prospective cohort studies is used to examine this effect for dietary fish and incidence of dementia and AD.
Results
For seven dementia studies with mean follow-up periods from one to ten years, the regression fit to the data is relative risk (RR) = 0.19 + (0.087 × Follow up [years], r = 0.84, adjusted r2 = 0.66, p = 0.009). However, when mean age of the participants was added to the analysis, the effect of follow-up period became non-significant. For five AD studies with follow-up periods from 3.9 to 9.8 years, the regression fit to the data is RR = 0.11 + (0.095 × follow up [years]), r = 0.93, adjusted r2 = 0.87, p = 0.02). The RR for the regression fit to the shortest follow-up periods are 40% greater for dementia than the standard meta-analysis suggests and 70% greater for AD.
Conclusions
Prospective cohort studies of diet and health outcomes should reassess variables every few years. Meta-analyses should consider the effect of mean follow-up periods and mean age of the participants during follow up.
Keywords
Introduction
Diet plays a very important role in the risk of dementia and Alzheimer's disease (AD). Among the dietary patterns, the Mediterranean diet (Med Di) stands out as one that significantly reduces risk of dementia and AD. 1 Fish is an important component of the Med Di. 2
There has been interest in the effect of fish consumption on risk of AD for some time. A 1997 multi-country ecological study reported that for seven European and North American countries, the regression coefficient for AD prevalence with respect to dietary fish was r = −0.75, p = 0.054. 3 For a multiple-linear regression analysis, fat and fish, r = 0.97, p = 0.004. A 2002 French study found weekly consumption of fish or seafood associated with reduced incidence of AD. 4 A 2003 study in the US by Morris and colleagues found that consumption of at least one serving of fish per week versus no consumption was associated with a significant reduction in incident AD. 5 An editorial accompanying the Morris et al. publication discussed some of the health benefits of fish as well as some of the early epidemiological findings regarding fish intake and AD. 6 It noted that a study of Cree in Manitoba, Canada, a population with high levels of fish intake, had a low rate of AD. 7 The AD rate for the Cree was 0.5% in contrast to and age-adjusted rate of 3.5% in an English-speaking population in Winnipeg.
A recent dose-response meta-analysis of observational studies of fish consumption, cognitive impairment, dementia, and AD provides the basis for the present study. 8 The authors conducted traditional meta-analyses of cognitive outcomes for the highest versus the lowest fish consumption. Such meta-analyses are generally produced using software packages (e.g., 9 ). The relative risks (RRs) were averaged with weight for each study proportional to the numbers of cases and controls. In this meta-analysis, the number of studies for dementia, AD, and cognitive impairment were 15, 10, and 18 studies, respectively (see Figure 1 in 8 ). The types of studies included prospective cohort, case-control, and cross-sectional studies.
Overlooked from this study was the fact that as the mean follow-up period increases, the apparent RR tends to decrease due to the drift of the independent variable for each participant. The classic demonstration of this effect, called “regression dilution” was published in 1999. 10 The authors plotted paired measurements from participants in the Framingham Study as a function of the time interval between the measurements for systolic blood pressure, diastolic blood pressure, and blood cholesterol. They showed that uncorrected associations with disease with baseline measurements underestimate the strength of the real associations with usual levels of these risk factors by about one-third in the first decade and by one-half in the second decade. As a result, failure to include the effect of follow-up period in the meta-analysis underestimates the effect of the variable on health outcomes.
It has been shown that meta-analyses of cognitive impairment, dementia, and AD with respect to serum 25-hydroxyvitamn D [25(OH)D] concentration also display linear reductions in calculated RR with increasing follow-up period from about four to about 14 years. 11 For dementia, using data for ten prospective cohort studies with follow-up period <14 years from Zhang and colleagues (2024), 12 relative risk (RR) = 2.9 – 0.14 × years, r = 0.73, p = 0.02. For AD, using data for six prospective cohort studies with follow-up period <14 years, regression fit to the data was RR = 2.9 – 0.14 × years, r = 0.69, p = 0.13. Similar results have also been reported for all-cause mortality rates and cancer incidence as noted in Ref. 11 as well as stroke incidence and major cardiovascular events. 13
The goal of this study is to examine the effect of follow-up period for incidence of dementia and AD with respect to fish consumption.
Methods
The data from the studies in Godos and colleagues (2024) 8 form the basis for the present analysis. Additional papers were found through searches at Google Scholar and Pubmed.gov.
Table 1 from Godos and colleagues 8 shows the baseline information for each of the studies included in this analysis. The studies used were selected based on the following criteria: 1) prospective cohort; 2) sufficient number of cases so that the 95% confidence intervals were relatively small.
Baseline data for Alzheimer's disease and dementia in prospective cohort studies listed in Godos and colleagues 8 used in this study and listed by increasing follow-up period with respect to completing food frequency questionnaires.
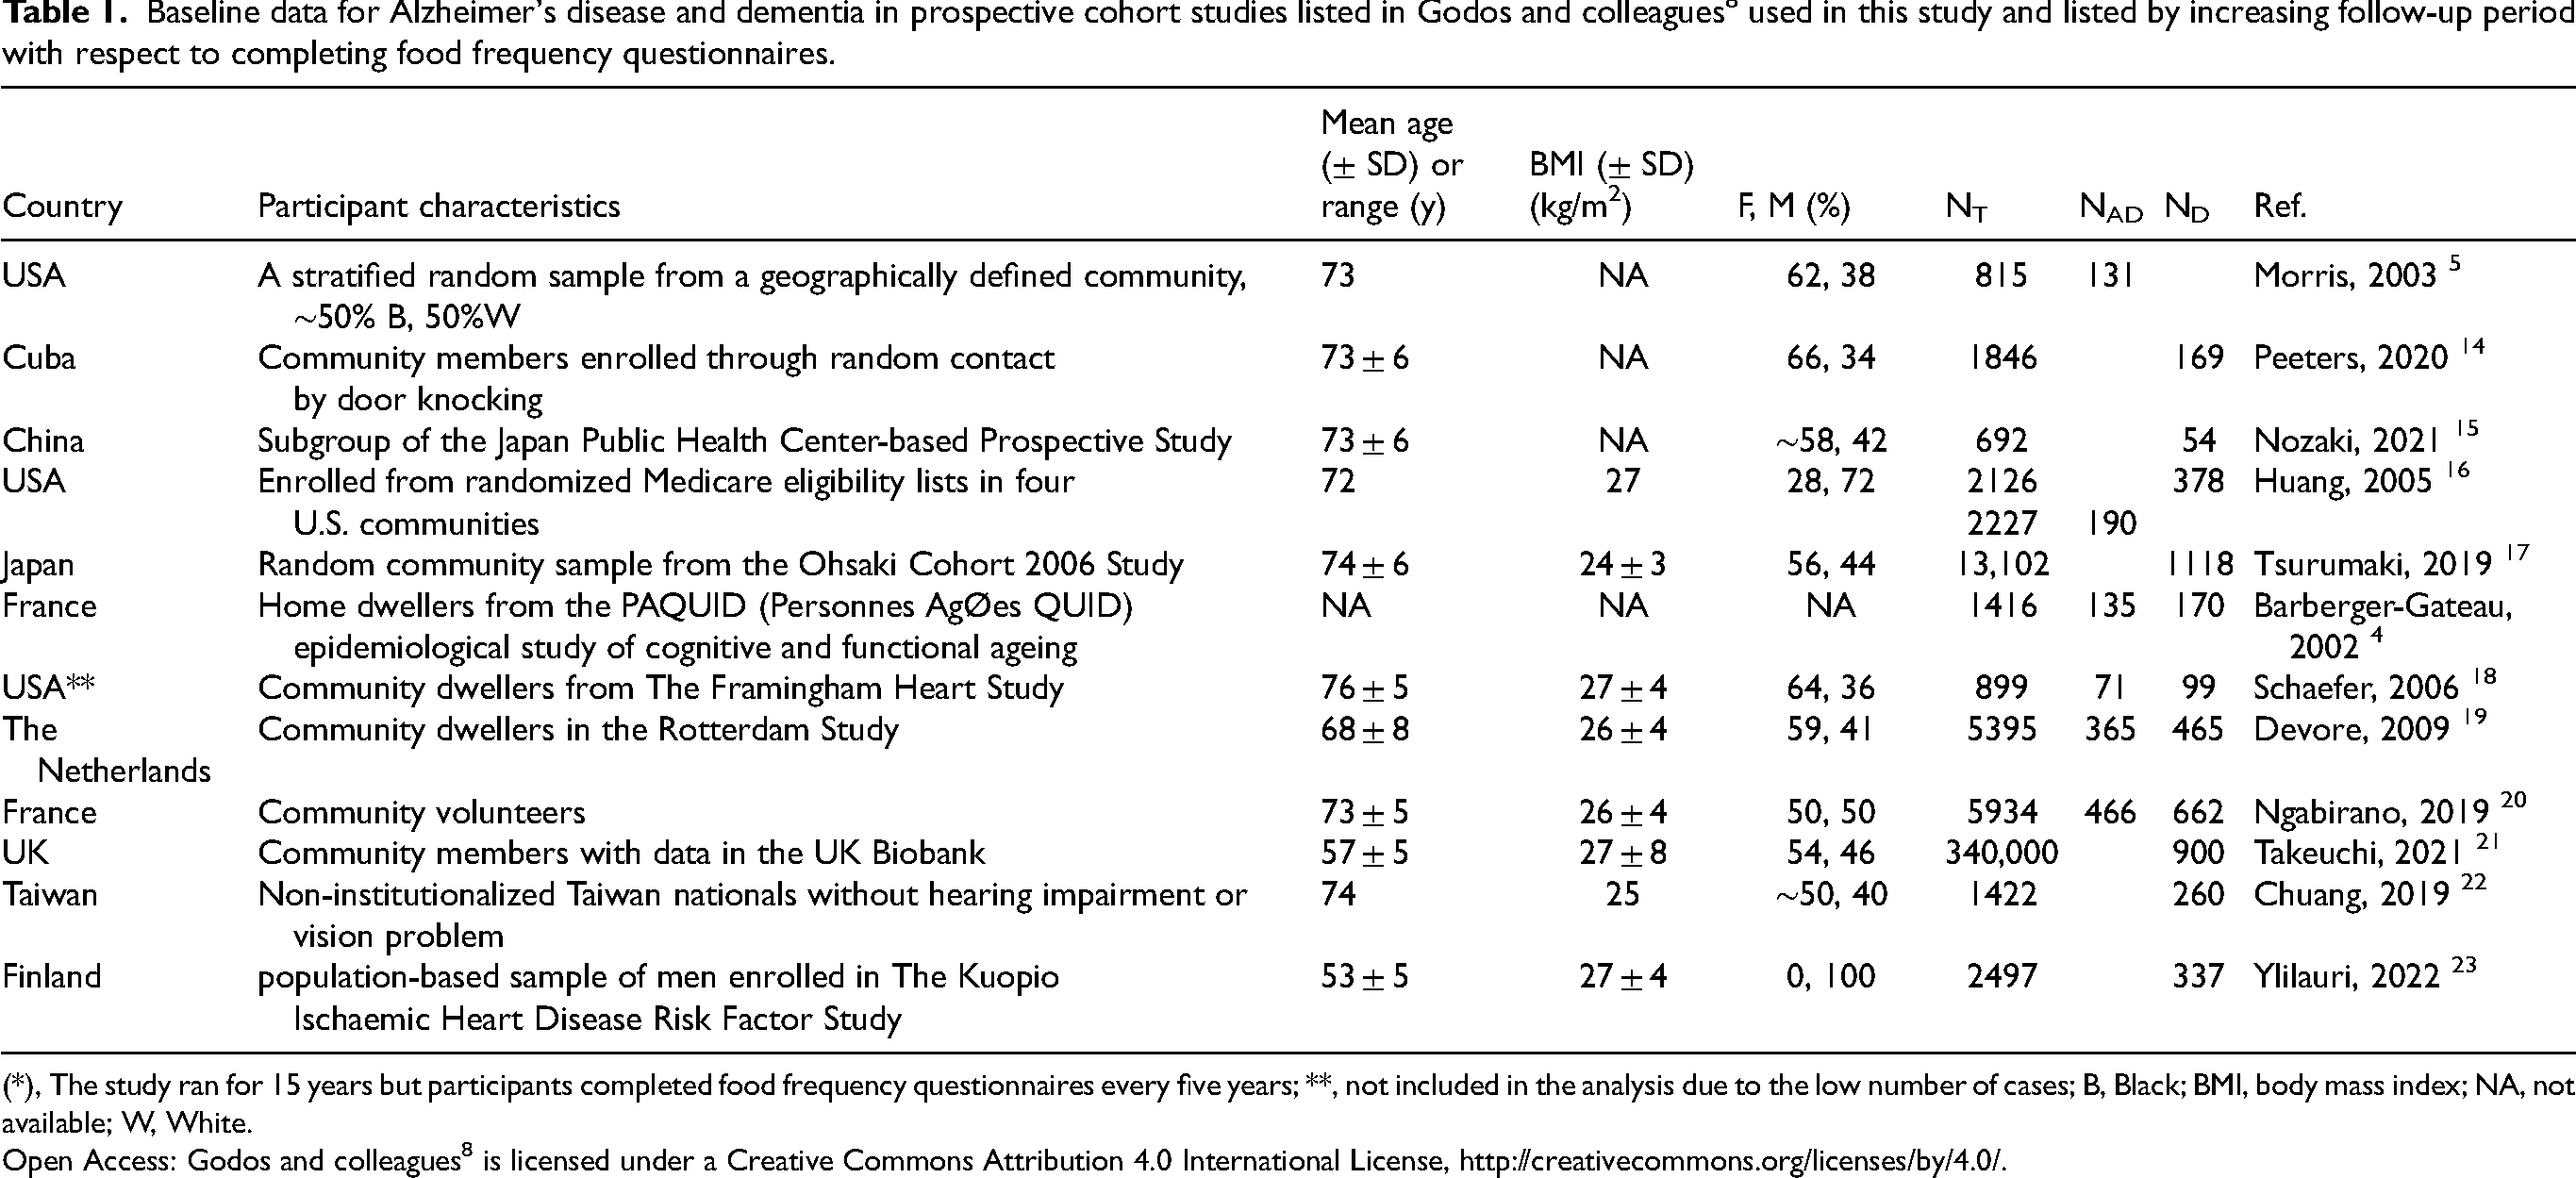
(*), The study ran for 15 years but participants completed food frequency questionnaires every five years; **, not included in the analysis due to the low number of cases; B, Black; BMI, body mass index; NA, not available; W, White.
Open Access: Godos and colleagues 8 is licensed under a Creative Commons Attribution 4.0 International License, http://creativecommons.org/licenses/by/4.0/.
Table 2 gives the findings for AD and dementia for the studies used in the present analysis.
Findings for Alzheimer's disease and dementia in prospective cohort studies from Godos and colleagues 8 used in this study and listed by increasing follow-up period with respect to completing food frequency questionnaires.
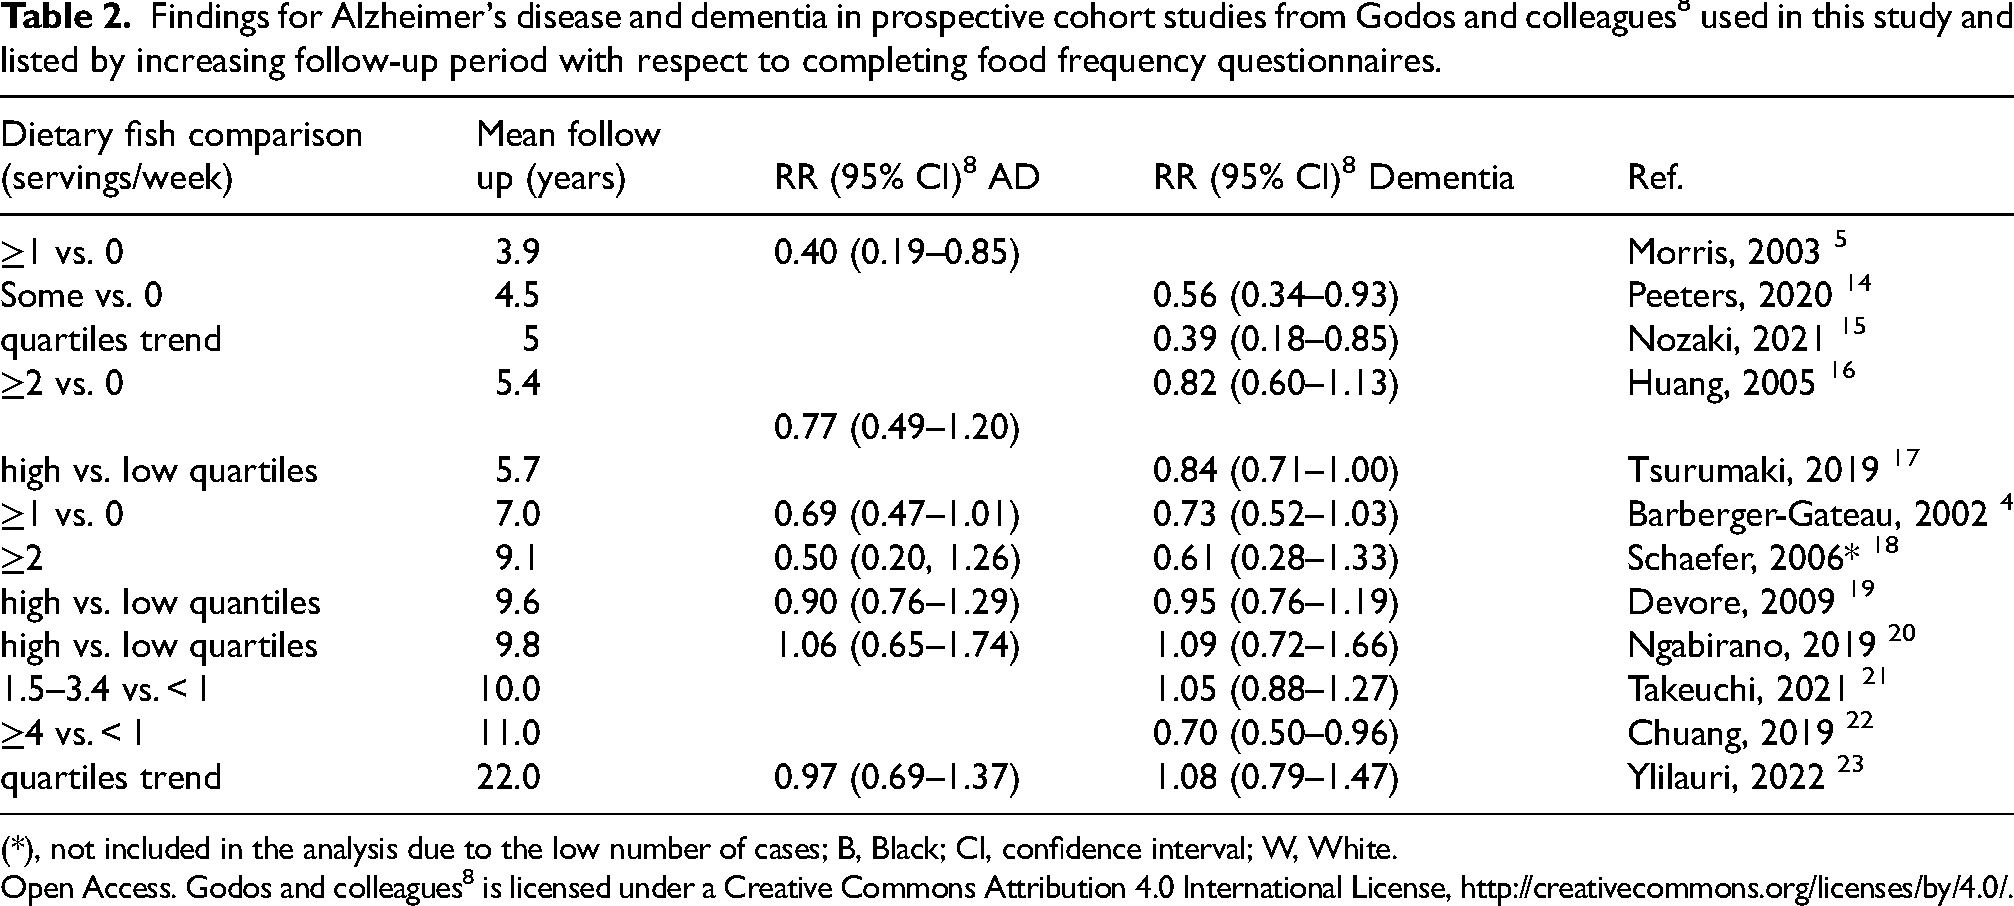
(*), not included in the analysis due to the low number of cases; B, Black; CI, confidence interval; W, White.
Open Access. Godos and colleagues 8 is licensed under a Creative Commons Attribution 4.0 International License, http://creativecommons.org/licenses/by/4.0/.
(Table 3).
Findings for Alzheimer's disease and dementia in prospective cohort studies listed in Godos and colleagues 8 used in this study and listed by increasing follow-up period.
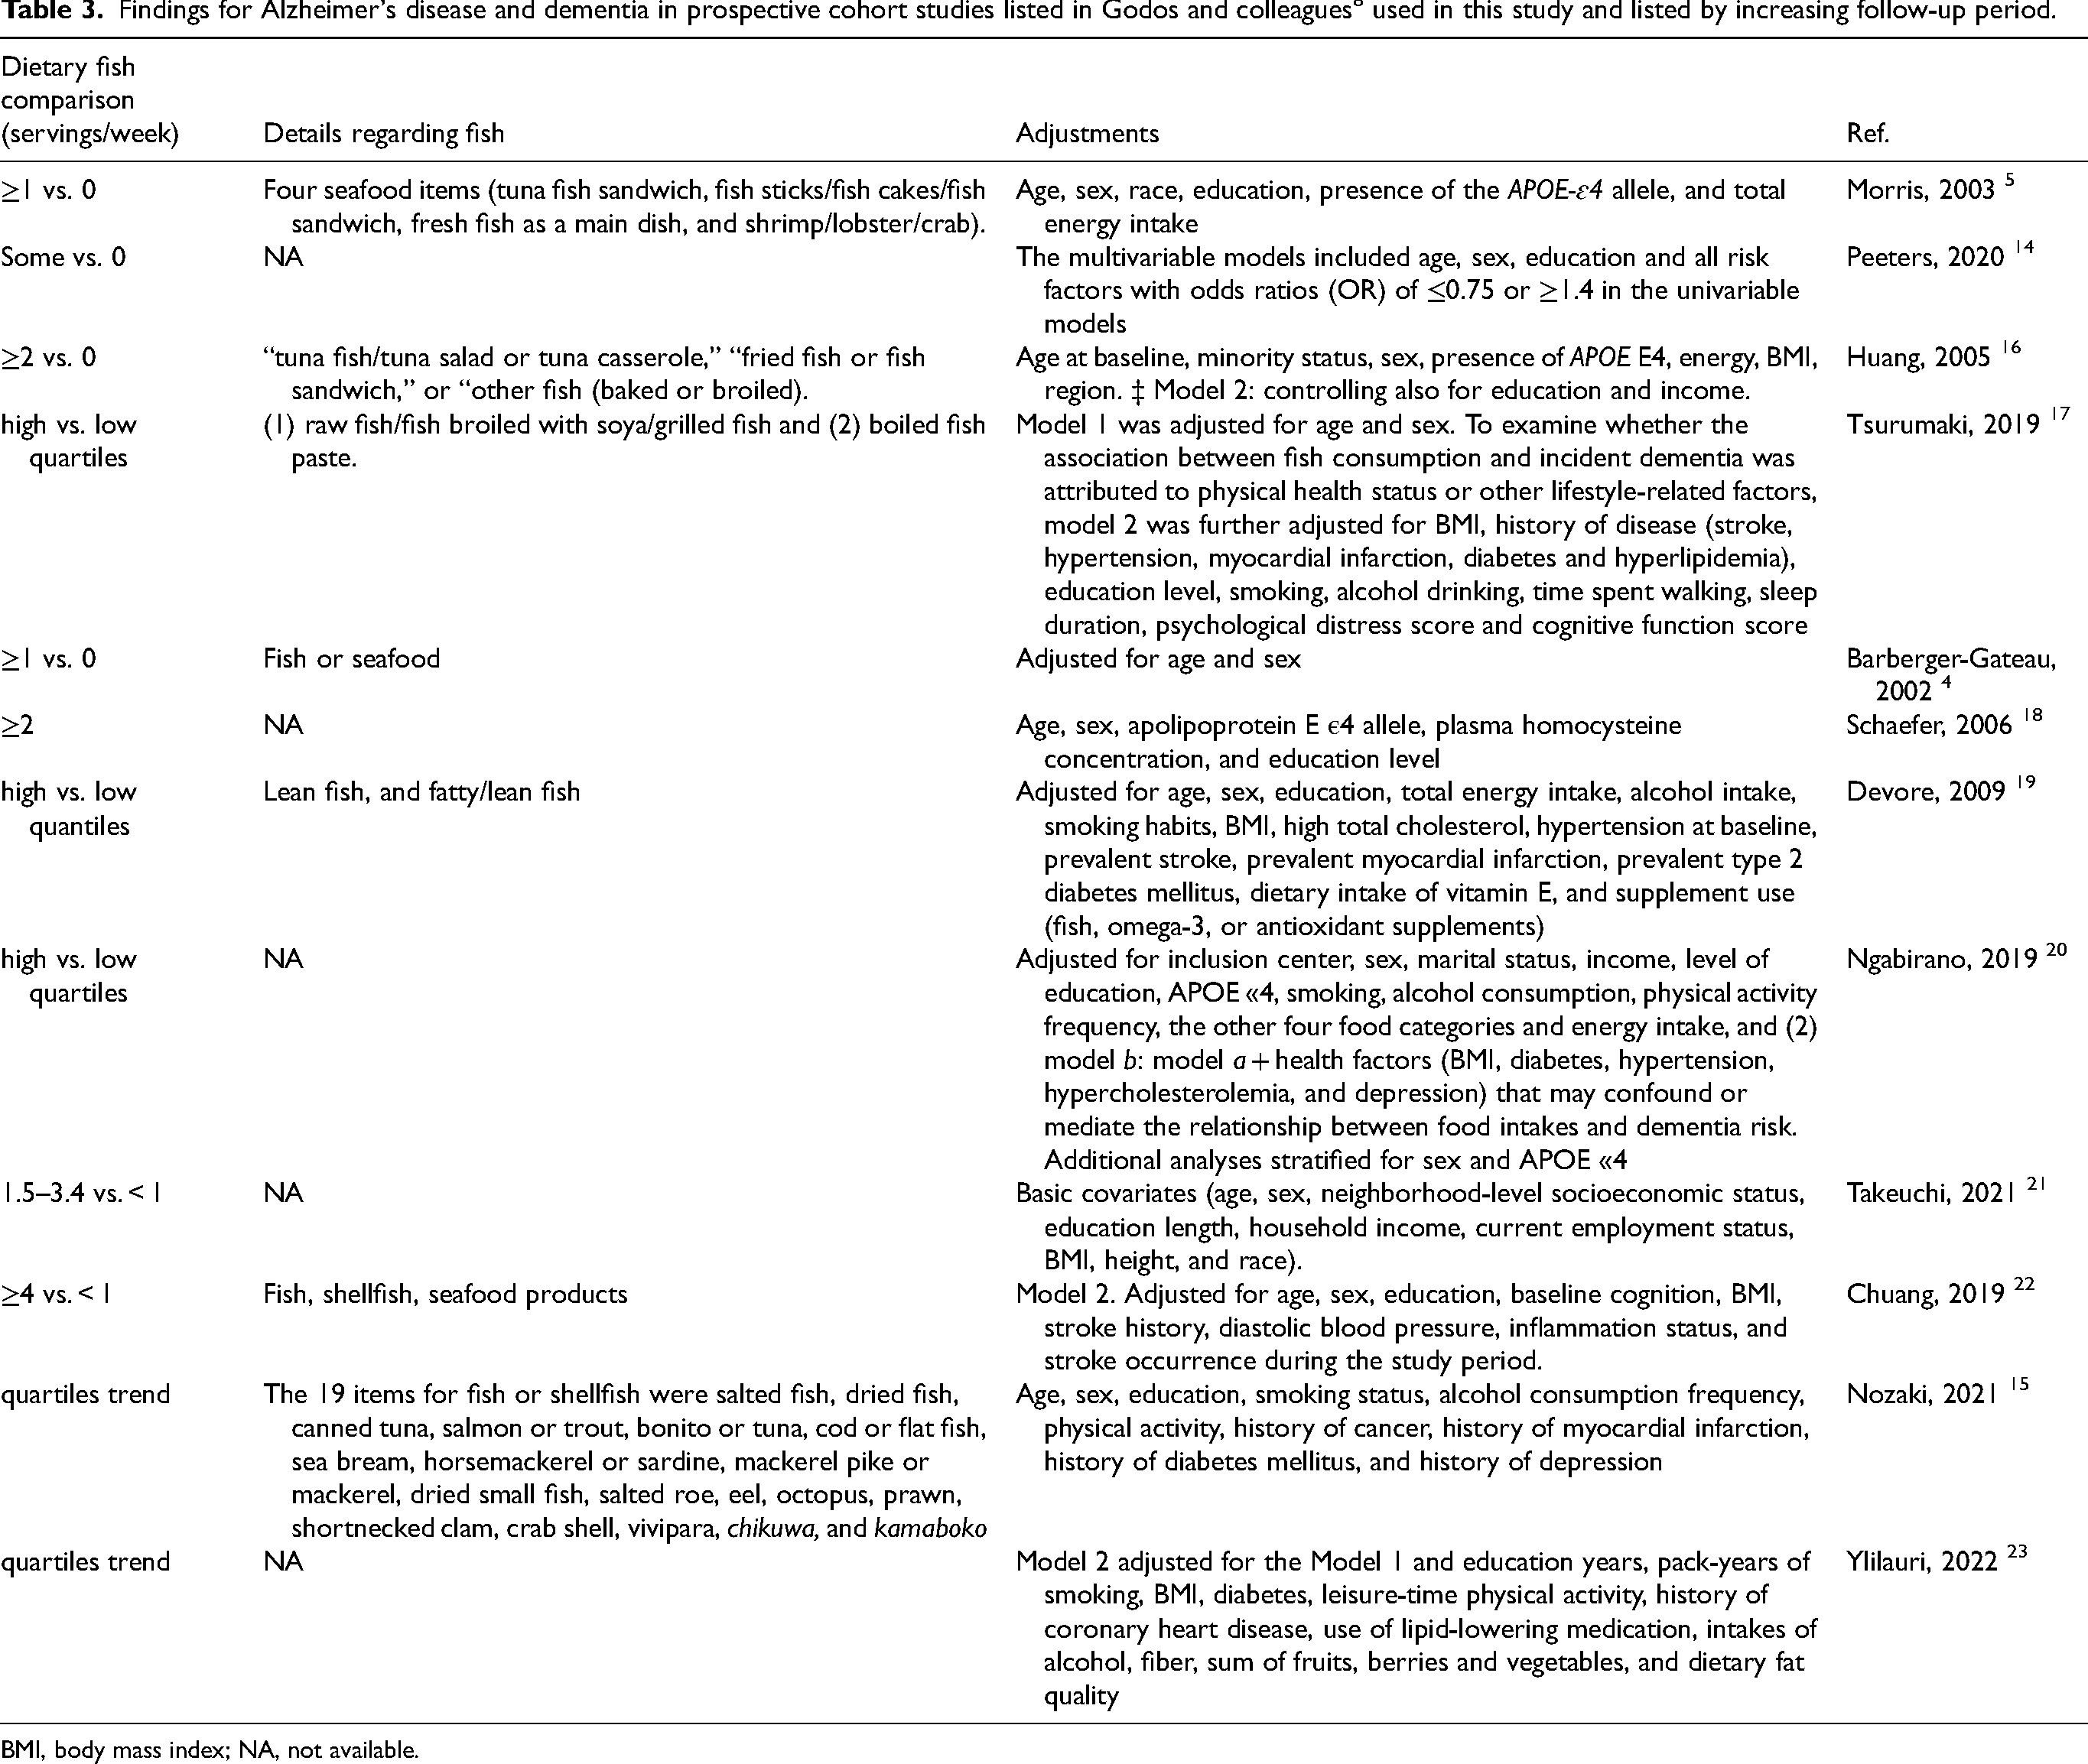
BMI, body mass index; NA, not available.
Results
For this study, relative RRs for the prospective studies were plotted versus mean follow-up period. It was determined that the RRs increased to near 1.0 by about ten years, after which they tended to vary independently of follow-up period. Next, linear regression analyses were conducted for the studies with mean follow-up period between four and ten years. For dementia, seven studies were included. Figure 1 shows the linear regression results for dementia for follow-up periods <10 years and the data for >10 years. The regression fit to the data is RR = 0.19 + (0.087 × Follow up [years], r = 0.84, adjusted r2 = 0.66, p = 0.009). For the shortest follow-up period, 4.5 years, RR = 0.58 (95% CI, 0.42–0.95). These values compare to RR = 0.82 (95% CI, 0.73–0.93) in Godos and colleagues. 8 The results for follow-up periods greater than ten years are shown in Figure 1 but are not considered meaningful.

Scatter plot and linear regression results for dementia for studies listed in Godos and colleagues 8 with linear regression results for follow-up periods shorter than ten years.
For AD, five studies were included as shown in Figure 2. The regression fit to the data is RR = 0.11 + (0.095 × follow up [years]), r = 0.93, adjusted r2 = 0.87, p = 0.02). The regression fit for the shortest follow-up period, 3.9 years, is RR = 0.48 (95% CI, 0.26–0.88). These values compare to RR = 0.80 (95% CI, 0.67–0.96) in Godos and colleagues. 8 No significant regression results were found for cognitive impairment.

Scatter plot and linear regression results for Alzheimer's disease for studies listed in Godos and colleagues 8 with linear regression results for follow-up periods shorter than ten years.
During the review process, it was suggested that confounding factors might explain the associations between follow-up period and risk of dementia and AD. A dataset was found that provides an excellent set of data for the effect of age and follow-up period regarding the MIND diet and risk of dementia. 24 Figure 1 in that article shows the HR for dementia with respect to follow-up time for two study populations enrolled 20 years apart but analyzed in the same manner. The mean ages at time of enrollment were 68 ± 8 years for the first population and 75 ± 6 years for the second population. Figure 3 is a plot of the HR for dementia with higher adherence to the Med Di with respect to follow-up period for two populations of different age in prospective studies along with regression fits to the data. As can be seen, increasing the mean age of the participants from 68 to 75 years increases the HR by about 0.15 for each follow-up period. This result is reasonable since risk of dementia increases with age. An analysis of crude mean incidence rate of dementia in The Netherlands for 1992–2014 found 1.13/1000 person years for the age group 65–69, 3.19/1000 person years for the age group 70–74 years, and 8.18/1000 person years for the 75–79 age group. 25 If there were no cases, the HR would be zero.

Plot of the HR for dementia with higher adherence to the Med Di with respect to follow-up period for two populations of different age in prospective studies in The Netherlands. 24
For the present study, values for RR for dementia and AD were plotted versus mean/median age of the participants in each study plus one-half of the follow-up period (the 7.0 year follow-up study did not provide age data 4 ). For dementia, the regression fit with six studies is RR = 2.08 –0.016 × Age + 0.0.5 Follow up [years], r = 0.55, p = 0.26.
With five studies, omitting one with mean age at baseline of 56.4 years, RR = 3.39 + 0.033 × Age + 0.0.5 Follow up [years], r = 0.48, p = 0.42.
In an analysis of dementia risk with respect to fish for five studies limited to participants aged 72–77 years at time of enrollment, the linear fit to the data is RR = 0.29 + 0.079 × Follow up [years], r = 0.85, p = 0.07.
In a multiple linear regression analysis for dementia, the regression fit to the data with six studies is RR = 0.47 + 0.066 × Follow up [years] + 0.0012 × Age + 0.0.5 × Follow up [years], r = 0.90, p = 0.08. The p-values were 0.07 for Follow up [years] and 0.91 for Age + 0.0.5 × Follow up [years].
For AD, the regression fit to the data for four studies is RR = 1.1 + 0.025 × Age + 0.0.5 Follow up [years], r = 0.17, adjusted r2 = 0. There were too few studies to do a multiple linear regression analysis.
Discussion
These results demonstrate the concept of “regression dilution” for a dietary component for risk of dementia and AD. Interestingly, the type or quantity of fish and seafood seemed to be much less important than the follow-up period.
It is reasonable to expect that the same effect should be found for dietary patterns as well. A preliminary analysis of the effect of mean/median follow-up period on risk of AD with respect to the Med Di was conducted (unpublished). The data for the hazard ratio for high versus low adherence to the Med Di were obtained from Figure 4 in the paper by Fekete and colleagues. 26 Values were given for 11 studies. The values were confirmed for ten of the studies, which were used in the analysis. Mean/median follow-up periods were obtained from the studies referenced in that review. Follow-up periods ranged from 0.5 years 27 to 12 years 28 and longer, with five six studies having mean/median follow-up periods from 1.5 to 5.0 years. In the meta-analysis of these studies HR = 0.70 (95% CI, 0.73–0.83). Plotting the HR versus follow-up period for eight studies with follow-up periods from 0.5 to 12 years gives a regression fit to the data = 0.44 + 0.042 × years. I assume that the most likely value for HR is for shorter follow-up periods. Assuming two years, HR = 0.52, which is lower than 0.70 calculated by Fekete and colleagues. 26 This analysis indicates that the “regression dilution” can be demonstrated for defined dietary patterns as well. However, the effect of age should also be added to the analysis. Thus, prospective observational studies should consider redoing the food frequency questionnaire every few years.
Four-to-five years might be an optimal follow-up period for prospective cohort studies. It is generally long enough to obtain sufficient case numbers for the health outcome of interest to result in reasonable 95% CI values. Four years is the interval used in the Harvard cohort studies regarding dietary variables and health outcomes. 29 Nozaki and colleagues 15 used five years for their study of dementia risk with respect to fish consumption and it fit well with the other such studies. Four-to-five years would also be associated with dietary values over a period a few years longer, based on an idea of the time it takes for disease to develop. For example, an observational study of dietary components at baseline and incidence dementia five years after baseline was able to determine that a high intake of bread, moderate total meat and total fish intake and low vegetable and fruit intake were thus associated with a small but significant decrease in the onset risk of dementia, while poultry and cereal were not. 21
It could be possible that the reduced risk of dementia and AD associated with dietary fish consumption could be due to confounding by other factors such as reduced consumption of meat or increased consumption of coffee, fruit, and vegetables. However, the relative importance of various food groups in the dietary patterns considered in the Harvard study 29 indicates that the effects of different food groups can be separated.
Roles of omega-3 fatty acids and vitamin D in reducing risk of dementia and Alzheimer's disease
There are several nutrients in fish that might be involved in reducing risk of dementia and AD. Omega-3 fatty acids, docosahexaenoic acid (DHA) and EPA, are very important. A 2023 review discusses the role of DHA in reducing risk of ischemic stroke, thereby reducing risk of dementia and AD. 30 Fish consumption has been found associated with reduced risk of stroke in prospective cohort studies. 31 For ischemic stroke, for high versus low fish intake, the RR = 0.81 (95% confidence interval [CI], 0.70–0.94). However, since the mean follow-up periods were around 12 years, the beneficial effect of fish in reducing risk of ischemic stroke is higher. No effect was found for hemorrhagic stroke. A pooled analysis of stroke risk with respect to omega-3 blood levels based on data from 183,291 participants from 29 prospective studies found significant reductions based on quintiles trends for total and ischemic stroke for DHA, EPA, and EPA + DHA. 32 The reduction for the highest versus lowest quintile of EPA + DHA for ischemic stroke was HR = 0.82 (95% CI, 0.74–0.91), ptrend = 0.006.
A 2023 review suggested that eating fish such as sardines results in stronger cardiovascular benefits than just from omega-3 fatty acids. 33 They mentioned calcium, potassium, magnesium, zinc, iron, taurine, arginine and other nutrients that together modulate mild inflammation and exacerbated oxidative stress. A 2017 review also discussed the nutritional value of fish. 34
Type 2 diabetes mellitus (T2DM) is considered a risk factor for AD. For example, a meta-analysis of 17 prospective cohort studies found that subject with T2DM had an increased risk of developing AD: in 12 Western countries RR = 1.36 (95% CI, 1.18–1.53) and in five Eastern populations, RR = 1.62 (95% CI, 1.49–1.75). 35 It is noted that AD may follow T2DM due to sharing common risk-modifying factors, rather than that T2DM is a causal risk factor for AD. An analysis of data from the UK Biobank found that oily fish consumption was associated with an adjusted HR for T2DM = 0.84 (95% CI, 0.78–0.86) while non-oily fish was not. 36 Fish oil consumption was associated with a 9% (4–14%) risk of T2DM.
There is also support for vitamin D from fish being associated with higher serum 25(OH)D concentrations. A 2007 article reported measured values of vitamin D in several fish species. 37 Amounts ranged from 100 ± 20 IU/ounce for cod to 1000 ± 500 IU/ounce for wild salmon. Farmed salmon had only 240 ± 110 IU/ounce. A study in the UK involving Caucasian native residents found that both fish and meat eaters had much higher vitamin D intake and serum 25(OH)D concentrations than vegetarians and vegans. 38 The adjusted mean 25(OH)D concentrations were 77 nmol/L for meat eaters, 72 nmol/L for fish eaters, 66 nmol/L for vegetarians, and 56 nmol/L for vegans. Thus, the vitamin D content of fish is one of the reasons why the benefit of fish consumption is greater than the benefit from the omega-3 fatty acids.
An analysis for cognitive impairment (CI) versus 25(OH)D concentration as a function of follow-up period used 6 of the 10 studies in Figure 3(b) from Zhang and colleagues (2024), 12 with one study omitted that had very large 95% CI values and three with follow-up times less than 5 years. 11 The regression fit to the data is RR = 2.3–0.11 × years, r = 0.88, p = 0.02. (If three studies with mean follow-up period between 4.0 and 4.6 years are added, RR = 1.8–0.066 × years, r = 0.72, p = 0.03.) Figure 4 is a scatter plot of the data used in the analysis.

Cognitive impairment versus 25(OH)D concentration with regression fit to follow-up period for six studies with mean follow-up periods from 5 to 13 years from Figure 3(b) in Zhang and colleagues (2024). 12 (Figure 3 in 11 ) 95% CI, 95% confidence interval; RR, risk ratio. This figure is from an open-access article distributed under the terms and conditions of the Creative Commons Attribution (CC BY) license (https://creativecommons.org/licenses/by/4.0/, accessed on 10 December 2024).
Based on an understanding of the role of eating fish on omega-3 fatty acid and vitamin D intake, it seems that eating fish with reasonable amounts of both substances should also help reduce risk of many other types of disease. The evidence is presented in Table 4. Observational studies were favored for this table for several reasons including that larger numbers of cases can be found.
Evidence that dietary fish, fish oil, and vitamin D reduce risk of chronic diseases not already discussed.
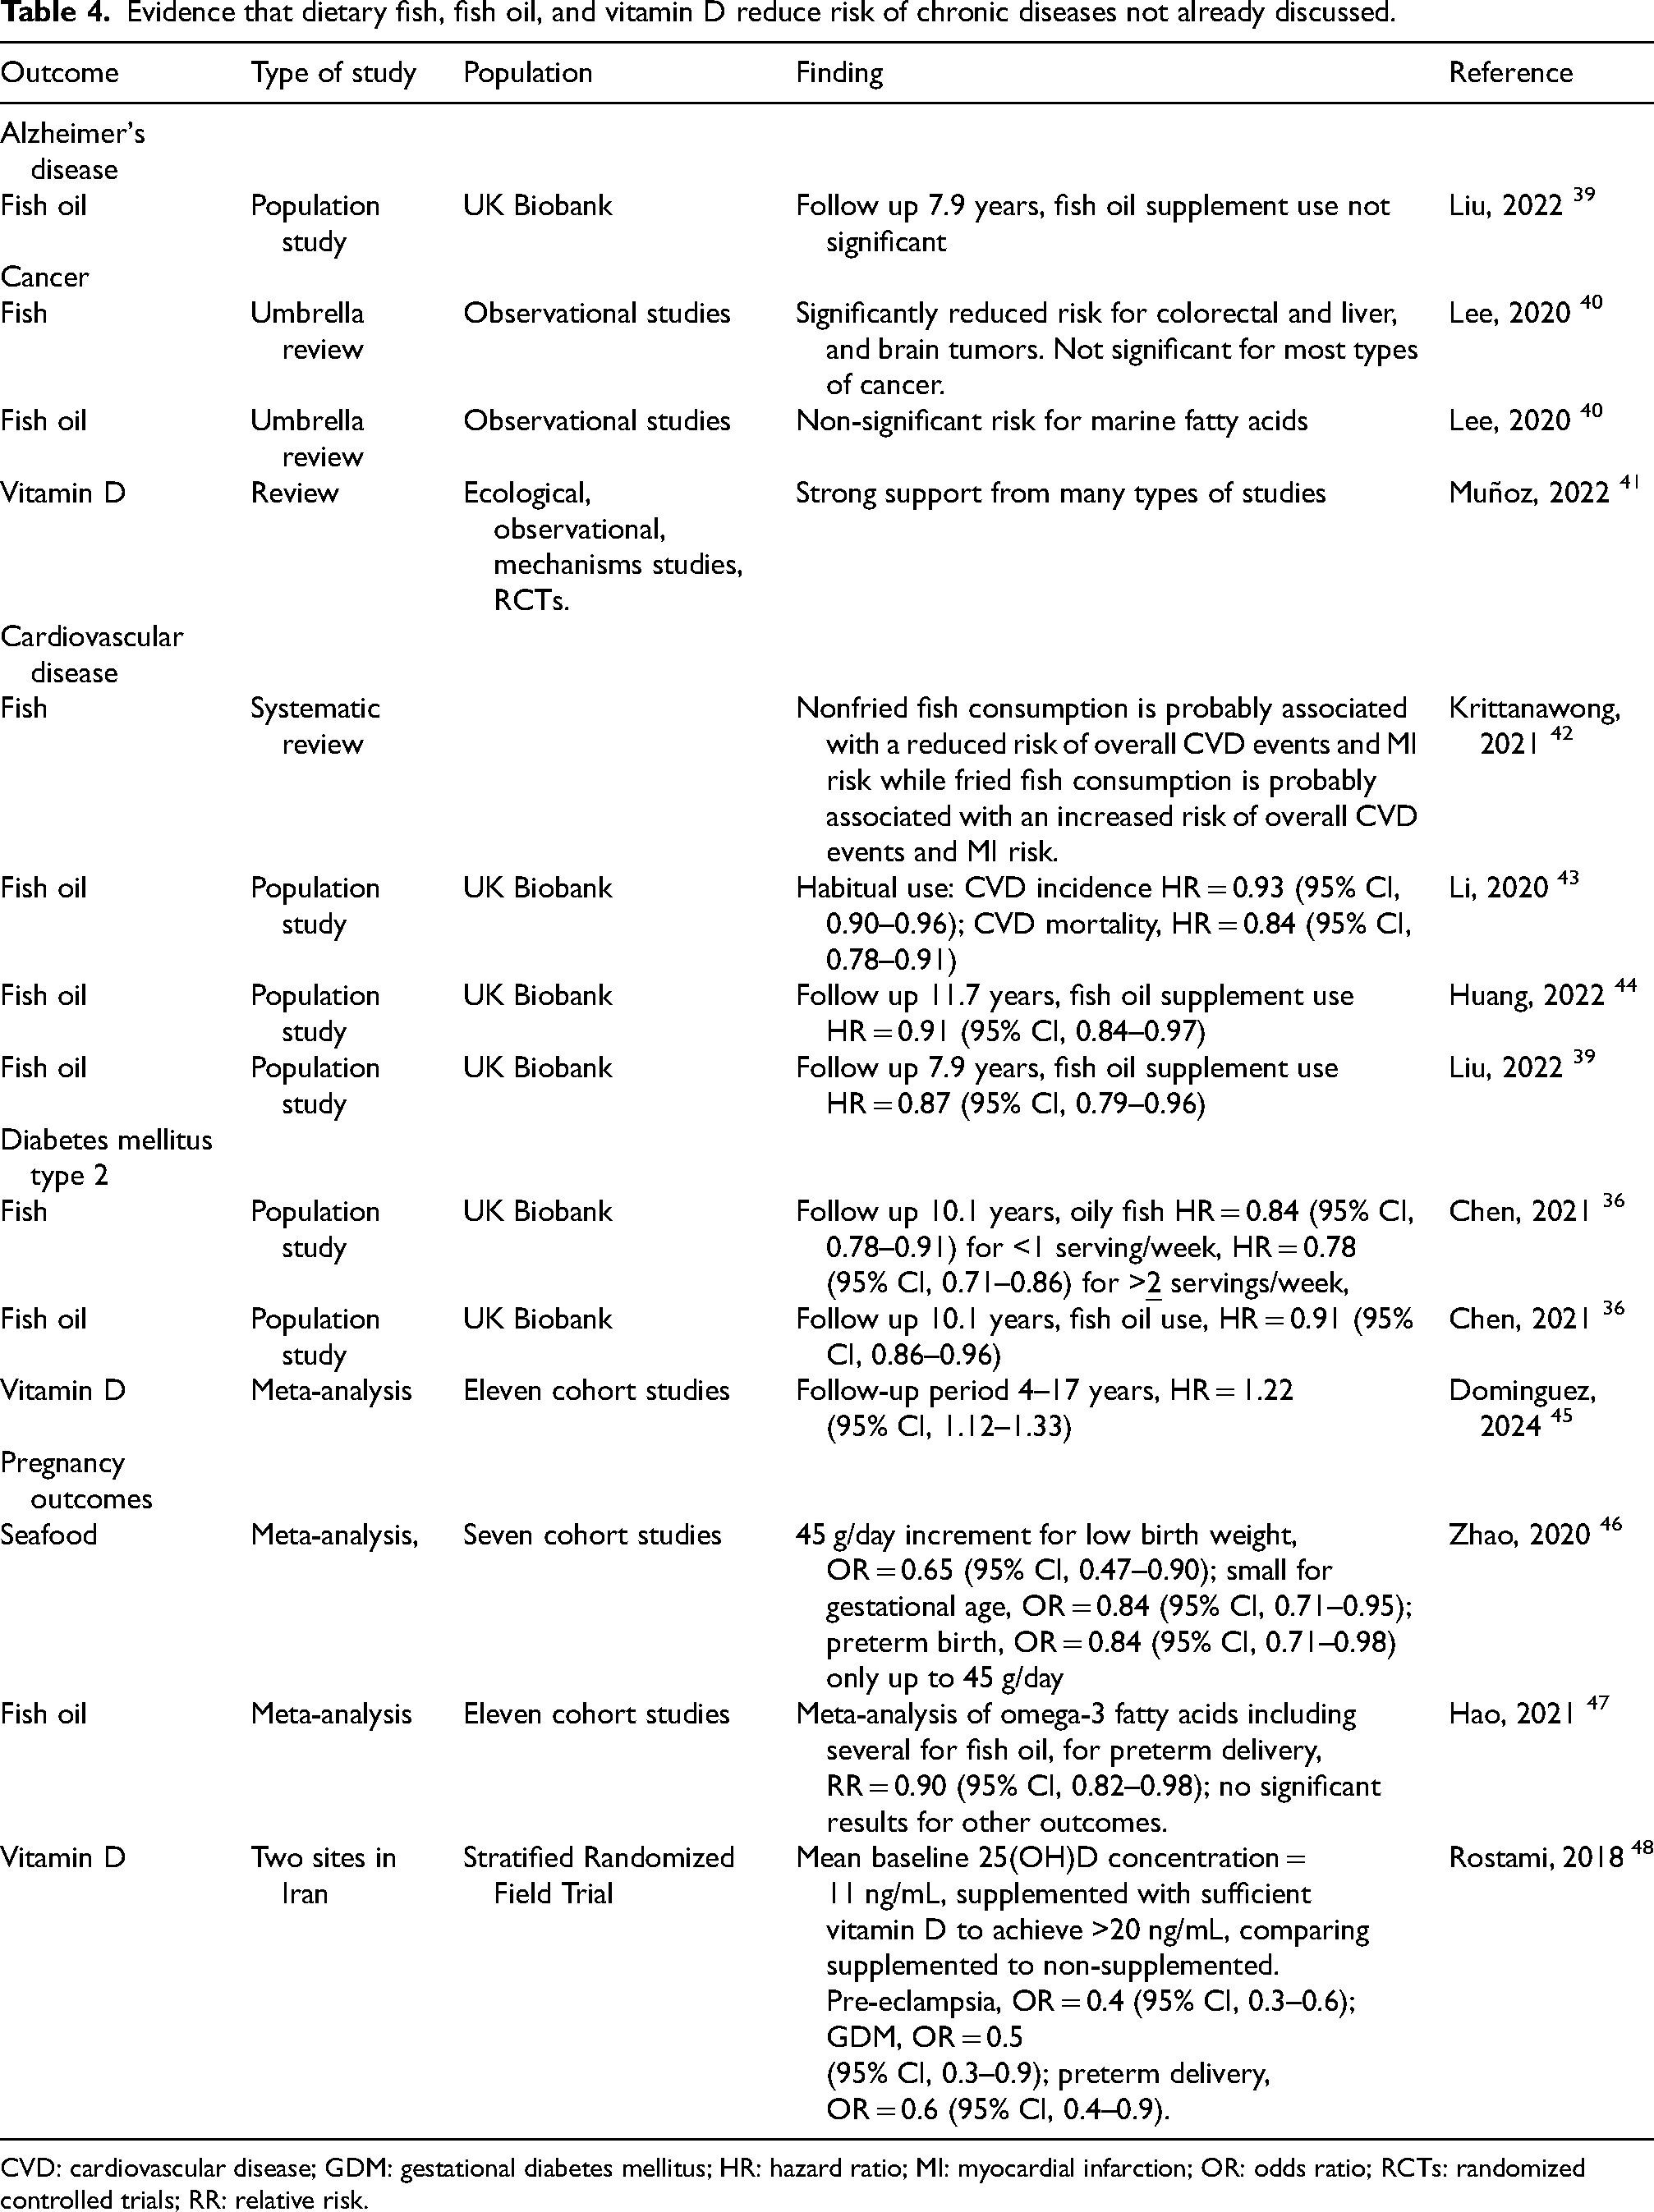
CVD: cardiovascular disease; GDM: gestational diabetes mellitus; HR: hazard ratio; MI: myocardial infarction; OR: odds ratio; RCTs: randomized controlled trials; RR: relative risk.
Conclusion
This study shows that modest fish consumption compared to no fish consumption is significantly associated with reduced risk of dementia and AD, with stronger association for shorter follow-up periods. The change in the strength of the association arises from “regression dilution” due to changes in the dietary variables follow-up periods. This effect is commonly associated with prospective cohort studies but seldom acknowledged in either single studies or meta-analysis of prospective studies. One way to reduce the effect of follow-on period is to remeasure the variables after a few years, perhaps four-to-five. It might also be able to develop estimates of the regression dilution effect for dietary variables from an analysis of several different health outcomes related to a single variable such as fish consumption and apply that value to individual studies.
In addition, mean age of the participants also affects the outcomes of prospective cohort studies. Since disease rates generally increase with age, the fraction of participants experiencing disease events will be higher, generally resulting in larger effects of the variables of interest.
It is hoped that those who conduct and/or review prospective cohort studies of health outcomes with respect to dietary and biomarker variables will include mean follow-up period in the design, conduct, and analysis of the results. Doing so should result in more accurate determination of the associations between the variables and the health outcomes.
Footnotes
Acknowledgments
The author has no acknowledgments to report.
Author contributions
William B Grant (Conceptualization; Formal analysis; Methodology; Writing –original draft).
Ethical considerations
Not applicable.
Consent to participate
Not applicable.
Consent for publication
Not applicable.
Declaration of conflicting interests
WBG received funding for research on vitamin D from Bio-Tech Pharmacal, Inc. (Fayetteville, AR, USA) for several years up to the end of 2023.
Funding
The author received no financial support for the research, authorship, and/or publication of this article.
Data availability
No datasets were generated or analyzed during the current study.