
Abstract
Background
Alzheimer's disease (AD) is a severe neurodegenerative disorder, yet its molecular mechanisms remain incompletely understood. It is known that the joint action of a number of genetic and other factors is involved in the pathogenesis of this disorder.
Objective
In the past years, extensive research has focused on identifying novel AD predictors and genetic markers. However, our understanding of the molecular features of AD is still incomplete, and it is essential to discover novel genes and their interaction involved in the etiology and development of AD.
Methods
Here, we developed GRESA (Gene RElationship Sequence Analyzer), to predict novel genes related to disease by a combination of machine learning algorithm Skip-gram and Monte Carlo Tree Search (MCTS). First, we extracted gene association information contained in Kyoto Encyclopedia of Genes and Genomes (KEGG) pathway database and generated gene relationship sequences. Then, Skip-gram neural network was trained and combined with MCTS to predict genes potentially associated with diseases like AD.
Results
The performance of GRESA was evaluated on breast cancer and gastric cancer. We further constructed the gene network underlying AD pathogenesis via GRESA, by which 164 potential gene candidates were predicted and their molecular function and biological features were investigated.
Conclusions
Results from this study provided insights for understanding the molecular feature underlying AD. As a useful systematic method, our approach can also be applied to construct gene networks for other complex diseases.
Introduction
Alzheimer's disease (AD) is the most prevalent neurodegenerative disorder in the elderly population, and it affects approximately 10% of people of 65 or older.1,2 Globally, about 50 million people are affected by AD or other dementias, and the number is estimated to be as high as 152 million in 2050; and the number of deaths caused by the disease will increase from approximately 2.38 million to 5.8 million per year.3,4 Currently, there are no drugs or interventions that can cure AD, and the available drugs only have modest benefits and work best for people in the early or middle stages of the disease. 5 Clinically, AD can be diagnosed by symptoms like memory loss, learning impairments and disruption in daily activities. 6 However, the clinical symptoms and pathological features of AD are not synchronous. Some pathological hallmarks of the disease, such as the accumulation of extracellular amyloid-β (Aβ) plaques and intracellular neurofibrillary tangles, as well as function and structure changes in certain brain regions, may appear years before the symptoms can be detected.7–9 The existence of long latent phase preceding the onset of clinically obvious symptoms makes the early diagnosis, treatment and tracking of AD challenging. 10
Currently, the cause of AD is still not fully understood. It is agreed that the disease develops from a combination of age-related changes in the brain, combined with genetic, environmental, and lifestyle factors. Among these factors, genetics plays a strong role, with late-onset AD showing heritability of 60–80% and early-onset AD of over 90%. 11 Thus, characterization of the genetic landscape of AD provides a unique opportunity for understanding the pathophysiological processes associated with the disease. 12 Some established genetic causes of the disease include mutations in genes encoding amyloid precursor protein (APP), presenilin 1 (PSEN1), PSEN2, and apolipoprotein E (APOE). However, the pathogenesis of AD in only a small fraction of patients can be attributed to these genes. Genetic analyses reveal that for complex disorders like AD, disease susceptibility may be related to many genes and their variants, with each gene or variant having a moderate or small effect.13–16 In line with this view, a considerable number of genes potentially associated with AD have been identified by human genetic studies.13,17–19 Especially, with the rapid development and application of high-throughput methods like genome-wide association study (GWAS) and whole-exome/whole-genome sequencing (WES/WGS) in recent years, an increasing number of common and rare variants associated with AD across multiple genomic loci have been identified.12,20
As a heterogeneous disease, AD arises from the combined effects of aging, genetic predisposition, and environmental factors.21–23 While heritability significantly contributes to AD risk and numerous disease-associated mutations have been identified, genetic factors alone explain only a portion of overall risk.24,25 Studies have revealed that non-genetic influences triggered by environmental factors also play significant roles in the etiopathology of AD. 25 Consequently, exploring gene expression patterns or epigenetic alterations in specific cells/tissues can also provide insights on the genes or genomic elements involved in the development of AD.16,26,27
Nevertheless, identification of genes involved in the etiology and development of AD remains a challenge. While genetic and genomic studies have uncovered numerous AD-associated susceptibility loci—some well-replicated and others potentially spurious or exerting minor effects—prioritizing functionally relevant genes is crucial. Moreover, the identified genes and genetic variants can only partially explain the biological processes underlying the disease, it is still necessary to discover novel susceptibility genes. In such a situation, different strategies can be adopted. In some studies, a combination of genetic and functional genomic methods is used to explore the roles of factors screened by genetic analysis in a biological and genomic context as they are usually involved in AD by affecting specific genes, cell types or tissues.16,26–28 Some studies analyze the potential causal genes within a pathway and/or a network framework.29–32
Although these studies have greatly improved our understanding of the molecular mechanisms of AD, they usually rely on extensive genetic or transcriptomic datasets, or protein-protein interaction data. As one of the primary objectives of AD study is to explore the underlying pathophysiological pathways, 19 existing biological pathway knowledge offers a unique resource for investigating the disease's molecular characteristics. Here, we present GRESA (Gene Relationship Sequence Analyzer), a machine learning method integrating Skip-gram and Monte Carlo Tree Search (MCTS)33,34 to identify AD-associated genes using pathway relationship data. Briefly, the Skip-gram algorithm was adopted to learn the gene relationships in the pathway through the principle of semantic analysis and to predict genes biologically related to given genes. The MCTS algorithm was utilized to discover the most relevant genes to construct the optimal gene relationship sequence.
Methods
The procedure utilized in this study included several parts, i.e., 1) the framework of GRESA and its training; 2) collection of gene-association data; 3) evaluation of the search accuracy of GRESA and its application in AD (Figure 1).

Overview of GRESA. A biological pathway can be viewed as a set of gene relationship sequences, with the genes next to each other in a sequence having close relationships. Similar to human language sentences formed by words, the relationships of genes can be learned and inferred by machine learning algorithm like Skip-gram. Based on the learned gene relationship rules, the Monte Carlo Tree Search method is used to build the gene relationship sequences for a given set of seed genes associated with a disease or phenotype. By this way, the potential risk genes related to a disease or phenotype can be predicted.
The framework of GRESA
Basically, GRESA includes two modules. In the first module, genes are represented by vectors and their relationships are learned by Skip-gram. For a given target gene, the output is a list of genes ranked by their relatedness with the target genes measured by probability values. In the other module, genes biologically associated with the target gene are predicted based on the gene relationships via a MCTS.
Learning gene relationship with Skip-gram
Skip-gram is a powerful model in natural language processing and is used to predict the surrounding context words of a given word in a sentence or a document. 35 As a language modeling technique, Skip-gram represents words or phrases in a continuous vector space of numbers, and words that occur in similar context tend to be closer to each other in the vector space. It can accurately learn both syntactic and semantic regularities through training of a double-layer neural network with natural statement set.
Mathematically, for a training sequence of words (w1, w2, w3, … , wT), the objective of the Skip-gram model is to maximize the average log probability,
35

In biological system, biological functions are usually performed by a series of genes and their products cooperatively through pathways. 36 In a pathway, genes are related to each other via actions such as inhibition or activation to complete specific tasks. Thus, pathways are fundamental for the proper function of a biological system and their dysregulation is often related to dysfunction or diseases. In the past years, hundreds of pathways associated with various biological procedures have been uncovered and genes involved in these pathways have been identified, which provides a valuable resource to explore the functional relevance of genes.
If we treat a pathway as “text” composed of genes as biological “words”, each branch in the pathway can be viewed as a “sentence” with specific meaning. In the example pathway (Supplemental Figure 1), starting from gene IP6K1, a series of gene relationship sequences, such as “IP6K1, IPPK, ITPK1, PIK3CB, INPP5D, MOTOR, RPS6, UCP1” and “IP6K1, PPIP5K2, IP6K2, ITPK1, SYNJ1, INPP4A, ISYNA1”, with each gene regulating (i.e., activating or inhibiting) the downstream gene next to it. By this way, a pathway can be viewed as a combination of a series of gene relationship sentences of specific biological functions, with genes close in the sentences being more functionally related. Thus, if we use the gene relationship sentences retrieved from a set of pathways as the training data of Skip-gram model, the relationship rules between the genes can be learned and used to predict the genes biologically related to a given gene.
Skip-gram was trained by the following steps:
Step 1: Encoding the genes in the training set by one-hot encoding vectors, i.e., each gene in the training set was mapped to vectors represented by 0 and 1. In the one-hot encoding of each gene, the position corresponding to its index was assigned a value of 1, and the other positions were assigned 0. For example, if the index of a gene is 3, the one-hot encoding of the gene was expressed as [0 0 1 0 0 …… 0 0 0]. By this way, each of the n genes in the training set was represented by a unique 1 × n dimensional vector, which would be used as the input layer of the neural network. Step 2: Initialization of the mapping matrix and weight matrix. The mapping matrix generates the embedding vectors of the genes, while the weight matrix is used to calculate the similarity of the genes. The dimension of the mapping matrix is n × d, where d is the characteristic dimension of the gene. The value of the hidden layer of the Skip-gram neural network is obtained by multiplying the 1 × n dimensional vector in the form of one-hot encoding and the n × d dimensional mapping matrix. The result is a 1 × d dimensional vector, which represents the corresponding value of each gene after passing through the hidden layer. The output layer of the Skip-gram neural network is obtained from the result of the above process, that is, the multiplication of a 1 × d dimensional vector and d × n dimensional weight matrix, and finally returns a 1 × n dimensional vector.
The mathematical model of the process is as follows: Step 3: Passing the result of the output layer through the softmax regression classifier. Each element in the vector corresponds to an output value between 0 and 1, representing its correlation probability with respect to the target gene, and the sum of all neuron nodes is 1.
37
The candidate genes corresponding to the output nodes are ranked according to their probability statistics. It is calculated as:
where gt and gb respectively represent the input target gene and the related gene found by the algorithm, ui represents the vector corresponding to the i-th gene in the weight matrix. In this step, the algorithm finds the downstream genes that are closely related to the target gene and outputs their corresponding probabilities. The output of the Skip-gram neural network is the probability that all genes except the target gene become the downstream genes of the target gene, and the higher the probability, the higher the correlation between the gene and the target gene.


In training the Skip-gram model, two parameters need to be determined, that is, the dimension of each gene feature vector and the number of neural network iterations. In this study, we selected two criteria to evaluate the parameters, i.e., whether the gene-gene interaction pair formed the given target gene and the most likely related gene predicted by Skip-gram algorithm can be found in existing pathways, and whether these two genes appear in the same pathway. In the training process, we utilized negative samples to improve the training speed and to improve the quality of gene vector. Hyperparameters were tuned via grid search prioritizing pathway validation metrics. We evaluated vector dimensions (100, 150, 200, 250, 300) by measuring the percentage of top-10 predicted gene pairs co-occurring in KEGG pathways (Supplemental Figure 2). The 150-dimensional space optimally balanced specificity and computational cost. Iterations (110–500) were monitored via early stopping when pathway recovery rates plateaued. The settings of other hyperparameters of Skip-gram model followed the general rules, e.g., the number of negative samples was set to 2, window size was 5, learning rate of the optimizer (adaptive moment estimation) was 0.001.38,39 Finally, the Skip-gram neural network model with the smallest loss was obtained and the parameters was kept. 40
Construction of Monte Carlo Tree Search
By Skip-gram, the relatedness between genes can be quantitatively measured. Then, for a given gene, the downstream genes that may be regulated by it can be selected based on their biological relatedness measured by probability values. To computationally build a relationship sequence from a given gene, we need to select a downstream gene from multiple candidates (in our case, the downstream genes potentially interact with the target gene are ranked by their relatedness measured by probability values); when a gene potentially regulated by the target gene is selected, we need to select the downstream gene further. And these steps are repeated until no more genes can be selected or reaching the termination rules. Actually, this procedure is equivalent to searching an optimal solution (i.e., a most likely gene relationship sequence in biological system) in a search tree with sequence length as the depth and the number of genes downstream to a gene as breadth. An analysis on the pathways curated in pathway databases or publications shows that there are about 19 genes per pathway on average, and many pathways include more than 100 genes. 41 At the same time, in biological system, a gene usually interacts with multiple genes. For example, analyses on the incomprehensive human protein-protein interaction data reveal that a gene may have 10–14 interactions on average, and genes involved in diseases may have much more interactions.32,42 Thus, an exhaustive search of all the possible gene relationship sequences would be quite time-consuming, if not infeasible. Since MCTS has shown great power in solving similar problems,43,44 it was adopted in this study to exploring the gene relationship space.
In this work, MCTS determines the appropriate search direction from multiple available genes (nodes) according to preset rules and constructs the search tree recursively until the best result is found or the termination condition is reached. Each node in MCTS records its number of visits, parent and target node composition, whether the root node is at the end of the search tree. Importantly, we combine the MCTS with the Skip-gram neural network. At each step, MCTS checks the gene relationships according to the Skip-gram training data to guide the next search. Moreover, we designed nested evaluation and scoring procedures in MCTS since there are usually multiple genes associated with target gene. When MCTS searches for the downstream gene associated with the current gene according to the training results of Skip-gram, the more frequently it appears in the same pathway with the target node, the higher the score will be and finally select the target node with the highest score and perform the next round of search. Each search from scratch involves traversing four processes, namely selection, extension, assignment, and update:
Step 1: Selection. Starting from the root node (a gene of interest), MCTS selects the most promising child node in the target node set (the downstream genes it may regulate) according to the Upper Confidence Bound (UCB). The UCB formula is as follows: Step 2: Extension. The purpose of this step is to create a child node set for the current node, that is, to extract the genes that may be biologically regulated by the current gene according to the gene relationship measured by Skip-gram neural network, and add these genes as target nodes of the current node. Step 3: Assignment. The purpose of this step is to assign a correlation strength value to each target node of the current node. This is based on the scoring function constructed by the path from the current node to the root node. From the multiple target nodes obtained by the extension step, the one with the highest possibility is selected for assignment. In order to make the screened gene more likely to be downstream of the target gene, that is, the candidate gene should not only be given a higher probability, but should also have a strong correlation in molecular function. In the scoring function, scoring is performed according to whether the target node belongs to the same path as the parent node and the frequency of the association between them in all paths. If both belong to the same pathway, the more frequently they appear, the higher the score will be. This step can balance the probability and functional correlation of genes, avoiding the situation where the probability is high but the functional correlation is not large. Step 4: Update. After the above three steps are completed, the algorithm updates the entire MCTS according to the calculation results and assigns the updated attribute value to each node. Furthermore, convert the candidate gene with the highest UCB value into the target gene to continue a new round of search until the termination condition is met.
where i is the index of the current node; V is the node attribute value, that is, the association strength obtained from the assignment step; N and n are the total access times of MCTS and the access times of the current node, respectively; C is a constant and a value of 2.0 was found to work well.

To prevent the gene search tree from falling into an infinite loop due to problems such as node conversion iterations and repeated selection between nodes, we will control the depth of the MCTS and the frequency of occurrence of each gene. Therefore, we used the average number of genes contained in the gene link as the termination threshold of the search depth. In addition, if two gene cycles are found to be mutually selective in the search and their association values are much greater than other candidate genes, the search will be terminated. By this way, the GRESA algorithm can find a set of genes biologically related to the given gene.
Collection of gene-gene interaction from pathways
In this study, we collected gene-gene interaction data from the KEGG database (https://www.genome.jp/kegg/), 45 which included 6360 unique genes and 17,708 gene relationship sequences retrieved from 308 human pathways. In each gene pair, the two genes are linked by a directed edge (from regulator to target gene) corresponding to activation or inhibition. The genes that can regulate one or more genes in a pathway are upstream genes and often play important roles in the normal operation of biological processes. 46 Genes that are activated or inhibited by upstream genes are target genes of their upstream genes. The relationship between genes in a pathway is directed, which means starting from one or several upstream genes, the other genes in the pathway are regulated successively to complete a specific function. Therefore, by comparing these gene relationship pairs, we can find one or more genes that are upstream of other genes in the set. They are used as root genes (seed genes) for constructing pathways, which are the initiation of pathways. Among these genes, 5772 upstream genes were isolated as the root genes with one or more genes located downstream of them and regulated by them (e.g., catalyzed, activated or inhibited) and the remaining 588 genes had no downstream genes, indicating that they can only appear at the end of the gene regulating sequence. Since the frequency of occurrence of genes in each sentence sequence is different, for the sake of fairness, we randomly generated 120 gene sentences for each root gene and obtained 479,669 sentence sequences, including a total of 9,593,380 genes and 5753 root genes. These gene sentence sequences provided an important basis for us to carry out subsequent research on gene association characteristics.
The gene sentences we collected were used to train the Skip-gram neural network model, randomly selecting 1438 genes (25% of 5753) as the training set, and the remaining 4315 genes were then compared to random selection to verify reliability.
Evaluate the search accuracy of GRESA
The proposed method was evaluated on breast cancer and gastric cancer. As two typical and well-studied human cancers, genetic factors play essential roles in the occurrence and development of breast cancer and gastric cancer, and the pathogenic genes of both diseases are relatively clear. We retrieved the risk genes of the two diseases through the literature (https://pubmed.ncbi.nlm.nih.gov/) as the seed genes of GRESA. Then, the genes predicted by GRESA were compared with the gene-disease databases (Phenolyzer and GeneCards). Phenolyzer (http://phenolyzer.wglab.org/) incorporates a list of gene-disease databases, pre-compiled from several data sources, including OMIM, Orphanet, ClinVar, Gene Reviews and GWAS Catalog. 47 GeneCards (https://www.genecards.org/) is an integrative database that provides comprehensive information on all annotated and predicted human genes, including genomic, transcriptomic, genetic, clinical and functional information. 48 Due to the large number of disease-related genes in the database (filtered to retain the protein-coding genes), we only kept the top 30% of the genes according to the gene-disease correlation scores to test the reliability of GRESA, and detected proportions of these genes in the top of the database (top 1%, top 5%, top 10%, etc.). In addition, the Jackknife method was used to evaluate the performance and stability of the algorithm. 49
Results of GRESA was compared with the PINA database (https://omics.bjcancer.org/pina/), which is based on aggregating and collating unique physical interaction information from publicly available protein interaction databases, including IntAct, BioGRID, MINT, DIP, and HPRD. 50 Gene nodes in PPIN have one-level or multi-level nodes connected to them. The first-level nodes have a direct relationship with the central node and have more significant correlations than other level nodes. In this study, we used the seed genes of breast cancer and gastric cancer as the central node of PPIN, without setting a conditional termination threshold, obtained all the first-level nodes related to it in the interaction network. Moreover, a certain number of genes were intercepted according to the centrality score (consistent with the number of GRESA) as the search results of genes related to the two cancers respectively. Subsequently, we compared prediction accuracy of disease-related genes between GRESA and PPIN in the Phenolyzer database to further test its reliability.
Similarly, we also compared the results of GRESA with PPIN in cancer databases, including COSMIC, GSCALite, and KM Plotter, to further evaluate whether the genes searched by our algorithm were meaningful. A list of 736 human cancer genes were collected in the COSMIC (https://cancer.sanger.ac.uk/cosmic), and these functional characteristics depict the extraordinary complexity of cancer biology, and suggest multiple cancer-related functions for many genes, which are often highly tissue- or tumor stage-dependent. 51 GSCALite (http://bioinfo.life.hust.edu.cn/web/GSCALite/) is an integrated platform for gene set cancer analysis at genomic, pharmacogenomic and immunogenomic levels. 52 KM Plotter (http://kmplot.com/analysis/) is capable to assess the correlation between the expression of all genes and survival from 21 tumor types including breast, gastric, lung, and ovarian cancer. Sources for the databases include GEO, EGA, and TCGA. 53
Application of GRESA to Alzheimer's disease
We first retrieved the seed genes for AD through the literature (https://pubmed.ncbi.nlm.nih.gov/) and input them into GRESA to obtain the genes potentially related to the disease. The functional features of these genes were analyzed through AlzData (http://www.alzdata.org) 54 and protein-protein interaction (PPI) network in Metascape (http://metascape.org). 55 Moreover, transcription factors (TFs) regulation network of these genes was constructed by TRRUST v2 (https://www.grnpedia.org/trrust/), 56 a database for predicting TFs target regulatory relationships, and a threshold of adjusted p-value < 0.05 was adopted. Different brain regions are functionally related and each includes various types of cells with different gene expression patterns. Moreover, we further explored the expression features of the genes to check whether their expressions were correlated with those of specific brain regions or developmental stages. Briefly, Cell Type-Specific Expression Analysis (CSEA; http://genetics.wustl.edu/jdlab/csea-tool-2/) 57 was chosen to compare the gene-expression profiles of the genes. The analysis was performed using the Fisher's exact test at a specificity index threshold (pSI) of 0.05. This threshold measures the possibility of the expression of a specific gene in the given cell type, brain region, and developmental stage. The flowchart was shown in Supplemental Figure 4.
Results
Training of GRESA
GRESA searches genes from a root gene to build a biological meaningful gene relationship sequence can be regarded as a process of constructing a genetic "vocabulary" sentence for the biological system. In this sequence, the degree of correlation (e.g., biological connection of molecular functions) between adjacent genes should be stronger than that of the non-adjacent genes. For this purpose, we selected 5772 upstream genes for different times until the result of random selection included almost all the genes we collected. The result of selecting 1–150 times of each upstream gene is shown in Supplemental Figure 2B. We found that the optimal result was achieved when each upstream gene generates 120 gene relationship sequences, which contains 5753 upstream genes, 479,669 gene relationship sequences, and a total of 9,593,380 genes. These genes sentences were used to train the Skip-gram neural network model of GRESA by randomly selecting 1438 genes (25% of 5753) as the training set, and the remaining 4315 genes were then compared to random selection to verify reliability.
In this study, two criteria were adopted to evaluate the parameters, i.e., whether the given target gene interacts with the most probable related gene found by the Skip-gram algorithm in the existing pathway, and whether the two genes appear in the same pathway. We traced the step-by-step changes in the accuracy of gene prediction by altering parameters of the Skip-gram model. Analysis revealed that when the number of iterations was 150 and the feature dimension was 440, the Skip-gram algorithm could achieve the best accuracy of gene interaction of 0.732 and same pathway rate of 0.894 (Figure 2 and Supplemental Tables 1 and 2). Therefore, these parameters were adopted for the model in subsequent analyses.

The accuracy of the Skip-gram model. (A, B) Number of interaction (A) and number of same pathway (B) of different embedding in 60–100 epochs. (C) The accuracy of multiple epochs in 150 feature embedding.
To further verify the accuracy and effectiveness of Skip-gram neural network, we compared the final results of epochs = 150 and dimensions = 440 as models with the results of random selection. Random selection means that in the test set including 4315 genes, different numbers of genes are randomly selected, and the accuracy of interaction and the same pathway with the target gene (1438 genes) are calculated. Certainly, the range of candidate genes obtained through the Skip-gram network is gradually expanded, and the accuracy rates are calculated from the top 1 to the top 200 candidate genes according to correlation probability, thereby verifying the performance of the Skip-gram model and random selection. Our findings further demonstrated that Skip-gram neural network could predict the gene relationship with high accuracy (Figure 3). The improvement of the accuracy rate in Skip-gram neural network is obvious when the number of candidate genes continues to increase and is always higher than that of random selection. In the assessment of the most relevant gene of the target gene (top 1), Skip-gram model accuracy was 0.732 and 0.894, respectively, compared with 0.013 and 0.073 for random selection. When the number of candidate genes increased to the top 200, the accuracy of Skip-gram model reached 0.929 and 0.999, respectively, while random selection was only 0.423 and 0.629. It is suggested that Skip-gram neural network exhibits high prediction accuracy and effectiveness.

Comparison of Skip-gram and random selection in finding genes in pathways. (A) The percentage of interaction between target gene and candidate gene. (B) The percentage of target gene and candidate gene in the same pathway. The abscissa is the number of different candidate genes selected, and the ordinate is the accuracy rate.
Predicting disease-related genes by GRESA
The performance of the algorithm was evaluated on breast cancer and gastric cancer, two commonly diagnosed cancers with high morbidity and mortality. 58 Both diseases have been extensively studied and the major genes underlying their pathogenesis have been identified.
For breast cancer and gastric cancer, we retrieved 14 genes from the literature, respectively (Supplemental Table 3 and 4). These genes were used as seed genes for GRESA and 79 and 101 unique genes were predicted breast cancer and gastric cancer, respectively (Supplemental Table 5). The top 30% of the genes showed that there were 72 and 61 hits for breast cancer, and 91 and 86 hits for gastric cancer in Phenolyzer and GeneCards, respectively (Figure 4A and B, and Supplemental Tables 6–9). Furthermore, most of the genes hit almost in the top 20% of the database genes. Simultaneously, we sequentially removed the seed genes one by one, and the remaining genes are calculated through the model. In the Jackknife evaluations of 14 seed genes, the number of genes obtained by GRESA remained stable and the accuracy did not fluctuate greatly for both cancer-associated genes (Figure 4C, D). The results of Jackknife test evidence that the GRESA model has outstanding performance in terms of stability when predicting genes and its accuracy is not reduced due to the absence of a certain gene.

Evaluate the search accuracy of the GRESA. (A, B) The number of hitting BC-associated genes (A) and GC-associated genes (B) by GRESA in database rank. (C, D) Jackknife evaluations of 14 seed genes were performed for BC (C) and GC (D) cancer-associated genes.
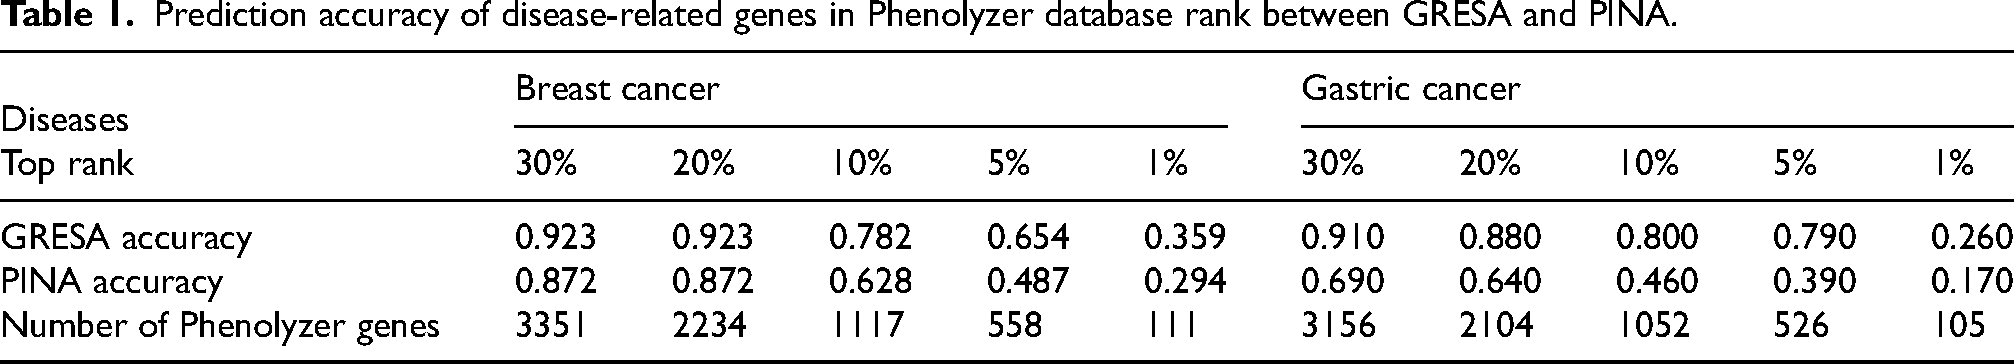
In particular, we also compared prediction accuracy of disease-related genes between GRESA and PPIN in the Phenolyzer database to further test its reliability (Supplemental Tables 10 and 11). Our data indicated that the accuracy of hitting breast cancer associated genes going from the top 30% to the top 1% dropped from 0.923 to 0.359 for GRESA, and from 0.872 to 0.294 in PINA; the accuracy of hitting gastric cancer associated genes going from the top 30% to the top 1% dropped from 0.910 to 0.260 for GRESA, and from 0.640 to 0.170 in PINA (Table 1). It is worth noting that most of the genes obtained by GRESA model have higher ranks in the database and are more closely associated with disease. Most importantly, we also detected clinically relevant information in the cancer database, including clinically-relevant cancer susceptibility genes, differential expression and patient prognosis. We found that the number of genes hit by GRESA model was more than that of PINA in COSMIC, GSCALite, and KM Plotter database, respectively (Table 2). In the above results, the GRESA algorithm can accurately construct the pathway network of disease-related genes, which lays a solid foundation for follow-up research.
Prediction accuracy of disease-related genes in Phenolyzer database rank between GRESA and PINA.
Hit genes accuracy of GRESA and PINA in database.

COSMIC: contains clinically-relevant cancer susceptibility genes; GSCALite: contains differential expression of cancer-associated genes (LogFC > 1, p < 0.05); KM Plotter: contains comprehensive information of patient prognosis (p < 0.05).
The application of GRESA in Alzheimer's disease
Then, GRESA was used to discover the potential risk genes for AD. We retrieved 12 seed genes of AD from the literature and input them into GRESA (Supplemental Table 12). The results included 164 unique genes (Table 3). To better understand the functional role of the AD genes pathway network, there were generated the detailed information of these genes through AlzData and relevant studies on the biological functions of these genes were retrieved. We used convergent functional genomic (CFG) score as a measurement that the higher the CFG score is, the more likely the candidate genes are to be AD targets. Our data confirmed that 143 genes with CFG score, the remaining 20 genes have CFG score of 0, and 33 genes have no AD-related studies retrieved (Supplemental Table 13). We also found that 110 genes differentially expressed in frontal cortex (FC), hippocampus (HP), temporal cortex (TC), or entorhinal cortex (EC) of AD samples compared to controls (all p < 0.05). These results suggest that most of the 164 genes in the pathway network are closely related to the progression of AD, while a small fraction of predicted genes need to be further studied.
Target list search of AD related genes in GRESA model.

Based on the 164 genes and the PPI network constructed in them, a network containing 2034 nodes and 18 pathway interaction pairs was generated (Supplemental Figure 3). Our analysis revealed that pathways involved in AD and meurodegeneration-multiple diseases were the most significantly enriched, followed by those related to Parkinson's disease, human cytomegalovirus infection, cGMP-PKG signaling pathway and renin-angiotensin-aldosterone system. Furthermore, based on the TRRUST v2 database, we obtained the top 10 transcription factors (TFs) potentially involved in the regulation of these 164 genes (Table 4). We found that three TFs (i.e., SP1, NFKB1, and HDAC1) were highly expressed in AD samples. They coordinately participated in the regulation of four genes (i.e., AR, EGFR, TP53, and CDKN1A).
Key transcriptional factors (TFs) of 164 AD-related genes.

To check whether the expressions of the 164 genes were correlated with the characteristics of specific brain regions and developmental stages, we further performed a spatio-temporal and cell type specific expression analysis. Of these genes, 162 genes could be identified in the brain cell type expression dataset CSEA. As a result of this expression analysis, most of them demonstrated substantial overrepresentation (pSI = 0.05, Supplemental Table 14) in astroglia of cerebellum, glia and oligodendrocytes of cerebellum, Drd1+ medium spiny neurons of striatum (D1 MSNs), and others (Figure 5A). Moreover, 41 genes (i.e., RAC2, WNT7B, ITPR1, AKT2, CREB3L4, DKK4, PIK3R3, WNT11, SP1, FZD3, CAMK2A, RYR2, WNT7A, PIK3R1, DKK1, CAMK2G, CREB3L1, TRADD, F5, CDKN1A, CALML4, WNT10A, THBD, WNT6, TF, NFATC2, F3, WNT2B, APOE, EGFR, CAMK2D, CALML3, AR, CREB3L3, WNT5B, WNT3, PIK3CD, WNT2, PLAUR, WNT9B, WNT4) showed substantial overrepresentation in the brain regions of different development stages (Figure 5B and Supplemental Table 15). Further, some genes, such as TP53, EGFR, and RAC3, were only detected in brains before birth (i.e., early fetal-late fetal), but some genes, such as APOE, PLAUR, RYR2, and CALML3, were only detected in brains after birth (i.e., neonatal early infancy-young adulthood) (Figure 5C and Supplemental Table 15). From a holistic perspective, most of these genes were significantly expressed in the brain or brain cell lines and changed with different ages, suggesting they could play important roles in the development or normal function of brain.

Spatio-temporal expression of the 164 genes. (A-C) Number of the 164 genes with substantial overrepresentation in brain cell types (A), brain regions (B) and specific developmental period (C).
Discussion
Genetic biomarkers are not only a bridge between clinical findings and molecular mechanisms of diseases, but also a sharp sword to achieve precision diagnosis and treatment. 59 Likewise, a comprehensive understanding of the biological basis of AD is the key for early diagnosis and intervention. Recent applications of high throughput technologies (genome-wide genetic analyses and expression profiling) have obtained some insights of the genetic and molecular mechanisms underlying the disease. However, it is still elusive to translate the data accumulated in the field to reliable knowledge. Here, we propose a powerful algorithm GRESA for semantic analysis that starts from experimentally and literature-verified known genes for disease, generating a network of disease-associated gene sets from fewer seed genes. Thereby further revealing the risk genes involved in the occurrence of the disease and the potential targets of the treatment process.
By combining machine learning and bioinformatics, this study attempts to interpret the search method of disease-related genes from a new perspective. We selected Skip-gram for its superior ability to model high-dimensional, non-linear gene interactions compared to traditional correlation-based methods (e.g., Pearson/Spearman) or linear dimensionality reduction techniques (e.g., PCA), which often overlook biologically meaningful pairwise dependencies. For network exploration, MCTS was preferred over greedy algorithms or reinforcement learning due to its balanced exploration-exploitation strategy, mitigating local optima while maintaining computational efficiency. Compared with other gene prediction methods, our research uses gene interaction to generate gene sentence sequences, and integrates Skip-gram and MCTS algorithms to obtain disease-related genes with higher reliability and stability. As the core of GRESA, the Skip-gram neural network played a guiding role in the search for target genes. Its training data comes from 479,669 sentence sequences generated by 5772 upstream genes being randomly selected 120 times, including total 9,593,380 genes. The 5753 unique genes in these statements covered 99.7% of the 5772 genes we collected, including gene relationships within pathways to the greatest extent. As cancer is a disease widely and deeply studied at present, 58 typical breast cancer and gastric cancer were selected to evaluate the algorithm. Comparative performance analysis revealed GRESA's superior accuracy over PINA in predicting cancer risk genes. This advantage stems from GRESA's dynamic pathway crosstalk integration and Skip-gram-based architecture, which outperformed PINA's static protein-interaction approach and linear regression model, particularly in handling sparse genomic signals. Apart from it can accurately search for genes closely related to both cancers and is also applicable to the exploration of other disease-related genes. This also provides a new reference basis for further understanding the overall genetic characteristics and the molecular mechanisms of AD.
In AlzData database, our data confirmed that 143 genes with CFG score, the remaining 20 genes have CFG score of 0, especially 110 genes differentially expressed in brain. These results reveal that most of the 164 genes in the pathway network are closely related to the progression of AD, while we also predicted a small fraction of disease-related genes. Through PPI network analysis of the 164 genes, we found that most of them were mainly concentrated in the modules of nervous system diseases including AD. Based on the TRRUST v2 database, we also found that SP1, RELA, and NFKB1 regulate the transcription of most genes. It is noteworthy that SP1, RELA, and NFKB1 are known to be involved in DNA dependence, immune responses, cell differentiation, cell growth, anti-apoptosis, inflammatory responses, cytokines and chemokines mediate signal transduction pathways.60,61 From the functional point of view, chronic inflammatory pathways and immune responses are the emerging factors involved in the pathogenesis of AD. The activation of inflammatory markers, participated in the development of lesions, can be detected prior to the onset of AD clinical symptoms, while accumulation of inflammatory mediators can also be observed in AD patients. 62 In AD, sequential Aβ deposition and hyperphosphorylated tau accumulation induce parenchymal innate immune activation. These pathological changes affect the integrity of blood-brain barrier, CSF/ISF flow, and lymphatic drainage, including expansion of IFN-responsive and antigen-presenting microglia, increased inflammatory cytokine and antigen accumulation, and T cell parenchymal infiltration, activation, and TCR clonal expansion. These changes in the innate and adaptive immune system and their responses would therefore serve as a foundation for therapeutic development for AD. 63
Biologically, spatio-temporal expression of the 164 genes observed that PIK3CB, WNT2, PIK3R2, CAMK2B, PPP3R1, PPP3CA, MAPK1, CAMK2A, ITPR1, and LRP1 expressed in D1 MSNs, especially APOE, AKT2, TNFRSF1A, C2, F3, CALML4, CREB3L1, ORAI1, and CDKN1A expressed in astroglia of cerebellum and glia and oligodendrocytes of cerebellum. Our findings on genes (e.g., TP53, TNF AKT2, APP, APOE, ATF4, and EGFR) agree with those reported by the study of Perkovic et al., which identified well-studied AD genes.64,65 Considering the developmental stages, we also found that the expression of TP53, FZD3, C3, SP1, RAC3, and DKK1, etc. tended to decrease during the adolescence and young adulthood. Functional enrichment analysis of the 164 candidate genes highlighted their involvement in amyloid-beta metabolism (e.g., LRP1, APOE), tau-related processes (e.g., PPP3CC), and neuroinflammation (e.g., IKBKB/CHUK), corroborating their roles in canonical AD pathways.66–68 Additionally, VDACs, SLC25A family novel genes were enriched in mitochondrial permeability transition, a mechanism previously understudied in AD. 69 Notably, MTOR/AKT1 are druggable nodes in insulin signaling pathways, with repurposing potential for AD (e.g., Metformin trials; NCT04098666). 70 While these findings strengthen the biological plausibility of our network, further validation of less-characterized genes is warranted. Intriguingly, one advantage of the GRESA is that characterization can not only construct gene-gene interaction networks but also map the gene link of a certain seed gene (APOE: LRP1, APOE, VDAC1, VDAC2, VDAC3, SLC25A5, SLC25A31, SLC25A4, SLC25A6, PPID, CYCS, CASP9, TG, PRKACA, PRKACG). The visualization results of this work, that is, the gene link of a certain seed gene and its associated genes, provides scholars with new ideas and strategies for studying the genetic characteristics of diseases, especially for rare diseases. In general, we have gained further new insights into the molecular features analysis in AD based on the GRESA model.
There are some limitations with our method. In the process of learning and training the Skip-gram neural network, there is a problem of imperfect data. Since the gene interaction relationship is available from human pathways databases like KEGG Pathway, the interaction data may be incomplete. For example, the interaction of some genes in a pathway does not occur between the gene and the genes in the pathway, but between the gene and a gene in other pathways. In addition, the absence of some genes in the human pathway can also lead to missing training data, in which case the neural network cannot assign a vector value to it, thus biases the final results. Our analysis relied primarily on KEGG pathways, which offer well-curated and standardized representations of biological processes. However, we acknowledge that alternative databases (e.g., Reactome, WikiPathways) may include additional interactions or different pathway boundaries that were not captured in our study. Although our preliminary comparisons suggested that KEGG provided more robust results for our specific analysis, future studies could further improve generalizability by integrating multiple pathway resources to generate consensus networks, applying meta-analysis approaches to reconcile database-specific variations, and incorporating experimentally validated PPIs to complement pathway-based findings. Although some of the genes discussed here appear to be good candidates for further investigation, it is still far from certain whether any of them would emerge as therapies targets for AD, and more systematic investigations at molecular and clinical levels are needed. Especially, the synergies between genes in AD progression should be verified by experiment in future.
In summary, this study uses the gene interaction relationship to generate gene relationship sequence and to identify gene candidates that could potentially be used for treating AD. The combination of Skip-gram neural network and MCTS model gives guidance to the exploration direction of disease-related genes. Although the result was still preliminary, it could provide clues for further investigation. The computational framework presented here might provide new ideas for exploring potential gene targets of other complex disease.
Supplemental Material
sj-docx-1-alr-10.1177_25424823251343812 - Supplemental material for A pathway-informed disease-related gene identification approach and its application to screen novel risk genes for Alzheimer's disease
Supplemental material, sj-docx-1-alr-10.1177_25424823251343812 for A pathway-informed disease-related gene identification approach and its application to screen novel risk genes for Alzheimer's disease by Xin Yuan, Lihui Gao, Hao Wang and Ju Wang in Journal of Alzheimer's Disease Reports
Supplemental Material
sj-xlsx-2-alr-10.1177_25424823251343812 - Supplemental material for A pathway-informed disease-related gene identification approach and its application to screen novel risk genes for Alzheimer's disease
Supplemental material, sj-xlsx-2-alr-10.1177_25424823251343812 for A pathway-informed disease-related gene identification approach and its application to screen novel risk genes for Alzheimer's disease by Xin Yuan, Lihui Gao, Hao Wang and Ju Wang in Journal of Alzheimer's Disease Reports
Footnotes
Acknowledgements
The authors have no acknowledgments to report.
Author contributions
Funding
The authors disclosed receipt of the following financial support for the research, authorship, and/or publication of this article: This study was supported in part by grants from National Key Research and Development Program of China (grant number No.2016YFC0906300).
Declaration of conflicting interests
The authors declared no potential conflicts of interest with respect to the research, authorship, and/or publication of this article.
Data availability statement
Supplemental material
Supplemental material for this article is available online.
References
Supplementary Material
Please find the following supplemental material available below.
For Open Access articles published under a Creative Commons License, all supplemental material carries the same license as the article it is associated with.
For non-Open Access articles published, all supplemental material carries a non-exclusive license, and permission requests for re-use of supplemental material or any part of supplemental material shall be sent directly to the copyright owner as specified in the copyright notice associated with the article.