
Abstract
Background
Resting-state functional magnetic resonance imaging (rsfMRI) is pivotal for mapping alterations in brain functional networks associated with neurodegenerative diseases, particularly Alzheimer's disease (AD). However, the causal mechanisms linking such network dysfunction to disease pathogenesis remain unresolved.
Objective
This study aimed to elucidate bidirectional causal relationships between 191 resting-state fMRI phenotypes (derived from 34,691 individuals) and six neurodegenerative diseases, specifically AD, amyotrophic lateral sclerosis (ALS), frontotemporal dementia (FTD), multiple sclerosis (MS), dementia with Lewy bodies (DLB), and Parkinson's disease (PD), using disease-specific GWAS data from European-ancestry cohorts.
Methods
Bidirectional two-sample Mendelian randomization (MR) was performed using rsfMRI phenotypes from Zhao et al. (2022) and GWAS summary statistics (AD: ieu-b-5067/ebi-a-GCST90027158, ALS: ebi-a-GCST90027164, FTD: ieu-b-43, MS: ieu-b-18, DLB: ebi-a-GCST90001390, PD: ieu-b-7). Instrumental variables were filtered for significance (p < 5 × 10^-8), with sensitivity analyses (MR-PRESSO, Cochran's Q, MR-Egger) to ensure robustness.
Results
Forward MR identified 26 rsfMRI phenotypes causally linked to neurodegenerative diseases. AD risk was associated with reduced cerebellum-subcortical connectivity (OR = 0.957, p = 0.004), while heightened cerebellar activity increased DLB risk (OR = 2.58, p = 0.0063). Reverse MR revealed 64 disease-to-network effects: AD altered default mode network connectivity (OR = 0.965, p = 0.034), and PD disrupted salience-central executive network interactions (OR = 0.950, p = 0.00011).
Conclusions
This study establishes robust bidirectional causal pathways between brain functional networks and neurodegenerative diseases, with AD showing unique vulnerability in cerebellar-subcortical and default mode circuits. These findings highlight network-specific therapeutic targets for AD and related disorders.
Keywords
Introduction
Neurodegenerative diseases are marked by a gradual decline in the function of neurons in the brain and spinal cord, leading to noticeable cognitive, motor, and other physiological impairments. Prominent examples of these diseases include Alzheimer's disease (AD), amyotrophic lateral sclerosis (ALS), frontotemporal dementia (FTD), multiple sclerosis (MS), dementia with Lewy bodies (DLB), and Parkinson's disease (PD). These conditions significantly affect patients’ quality of life and create substantial economic and psychological challenges for families and society as a whole.1,2 With the increasing incidence and mortality rates of these diseases globally, especially among older adults, there is a pressing need to investigate new strategies for prevention, diagnosis, and treatment to alleviate their social and economic consequences. 3
Despite advancements in research, the precise mechanisms behind neurodegenerative diseases remain unclear, which significantly hampers the development of effective treatment options. Previous studies have highlighted that structural abnormalities in the brain are crucial in conditions such as AD, ALS, and PD, 4 indicating that dysfunction in cortical structures may be a key factor in the onset of these diseases. To explore the potential links between brain structure and neurodegenerative diseases, Mendelian randomization (MR) studies have identified several associations, including a notable correlation between decreased gray matter volume in the right ventral striatum and an increased risk of developing AD. 5 This finding underscores the intricate and indirect relationships that exist between brain structure and its functional outcomes.
Notably, brain functional networks are dynamic multidimensional systems that undergo significant changes in their connectivity patterns and information exchange mechanisms during neurodegenerative diseases. These alterations are essential for understanding cognitive decline, behavioral variations, and impairments in emotional and social functions.6,7 The use of resting-state functional magnetic resonance imaging (rsfMRI) technology enables non-invasive observation of brain activity patterns while at rest. This technique helps identify various resting-state networks (RSNs), including the salience network (SN) and the default mode network (DMN), which are fundamental to spontaneous brain activity.8,9
Existing research highlights a significant connection between neurodegenerative diseases and irregularities in brain functional networks. For example, AD patients show reduced connectivity between the hippocampus and the medial temporal lobe,10,11 as well as abnormal connectivity within the DMN. 12 A recent MR study by Nassan et al. (2025) systematically evaluated causal relationships between intrinsic functional networks and four neurodegenerative diseases (AD, FTD, semantic dementia, and Lewy body dementia), reporting no significant associations after multiple testing correction, except for a nominal link between visual network activity and Lewy body dementia (LBD). 13 However, the bidirectional causal mechanisms between network dysfunction and disease pathogenesis remain unresolved.
In patients with ALS, there is a noted weakening of functional connectivity in motor areas and a decrease in connectivity within cognitive control networks.14,15 Similarly, other conditions such as FTD, MS, DLB, and PD also display unique alterations in network connectivity.16–20 These observations indicate that neurodegenerative diseases not only affect the brain's structure but also lead to significant reorganization of functional networks. This underscores the importance of investigating these connectivity changes to better understand the neurobiological mechanisms underlying these diseases and to inform the development of new therapeutic approaches.
This study aims to analyze the unusual patterns of brain functional connectivity in neurodegenerative diseases, specifically investigating the potential causal relationships between brain functional networks and these conditions. While many studies have examined the interactions between these two areas,21–24 the precise causal mechanisms are still not well understood. By combining large-scale genetic data with rsfMRI and utilizing the MR analysis method, this research intends to offer fresh insights and evidence into this important scientific question.
Specifically, we employed an innovative bidirectional two-sample MR analysis to thoroughly explore potential causal relationships between 191 rsfMRI phenotypes and seven neurodegenerative diseases. Through comprehensive data mining, we uncovered 91 significant causal pathways. This included 26 rsfMRI phenotypes that exhibited direct causal effects on the risk of developing neurodegenerative diseases, as well as reverse causal effects from six disease states impacting 64 rsfMRI phenotypes. These results enhance our understanding of the causal mechanisms that contribute to brain functional impairments associated with neurodegenerative diseases. Furthermore, they provide important insights for treatment and early intervention strategies, particularly by identifying potentially functional brain regions that could inform future therapeutic approaches.
Methods
GWAS of rsfMRI
In this study, we used rsfMRI datasets from Zhao et al. (2022), 25 which explored the relationships between 1777 intrinsic brain activity phenotypes and over 9 million common genetic variants in a sample from the UK Biobank (UKB), comprising 34,691 participants. The researchers noted that the genetic influence on brain functional networks tends to be weaker than that of structural influences.26–28 Consequently, they selected 191 traits that were significantly influenced by genetic variation (with a significance threshold of p < 5 × 10^-8) for their genome-wide association study (GWAS) analysis. These traits included 75 amplitude traits (representing nodes), 111 pairwise functional connectivity traits (representing edges), and 5 global functional connectivity traits. The networks examined included the salience, default mode, central executive, somatomotor, attention, limbic, and visual networks. For more detailed information about the dataset, please refer to the original publication and Supplemental Table 2.
GWAS of neurodegenerative diseases
To systematically explore the causal relationships between brain functional networks and neurodegenerative diseases, we performed MR analyses utilizing publicly available GWAS data. We excluded diseases characterized by small sample sizes and those that did not report genome-wide significant loci, such as mild cognitive impairment and certain types of epilepsy. Additionally, we meticulously removed samples from the UKB and FinnGen projects to reduce the risk of overlapping effects. Our analysis focused exclusively on GWAS datasets that included individuals of European ancestry, encompassing a range of conditions such as AD, ALS, FTD, MS, DLB, and PD, as detailed in Table 1.
Overview of multiple neurodegenerative diseases included in this study.

EUR: European.
In our analysis of AD, we conducted a meta-analysis using two significant datasets from the GWAS Catalog, specifically GWAS ID ieu-b-5067 and ebi-a-GCST90027158. This approach allowed us to achieve substantial statistical power, drawing from a total of over 975,000 samples. To enhance the sample size and statistical effectiveness for conditions such as ALS, FTD, MS, DLB, and PD, we utilized datasets sourced from either the GWAS Catalog or relevant research consortia.
Instrument selection
MR analysis is built on three fundamental assumptions: first, that instrumental variables (IVs) are linked to the exposure; second, that these IVs are not influenced by confounding factors; and third, that the IVs impact the outcome exclusively through the exposure. 29 To ensure these assumptions are met, we carefully selected our instrumental variables. Initially, we identified single nucleotide polymorphisms (SNPs) that had a strong correlation with the exposure, specifically those with a p-value of less than 5 × 10^-8. Following this, we employed the clump function from the R package TwoSampleMR to perform linkage disequilibrium (LD) pruning, using parameters of r² = 0.001 and a window size of 10,000 kb, based on the 1000 Genomes Project European population. Previous research has indicated that factors such as alcohol consumption, smoking habits, education level, and socioeconomic status can significantly influence neurodegenerative diseases30,31 and brain functional networks.32–34 Consequently, we utilized the R package phenoscanner (version 1.0) to filter out SNPs from the PhenoScanner v.2 database that showed significant associations with these four phenotypes.35,36
Data harmonization
Before conducting the MR analysis, we organized the exposure and outcome data using the TwoSampleMR package. This process involved filtering out palindromic SNPs that had a minor allele frequency close to 0.5. By doing so, we ensured that the IVs were derived from the same DNA strand and were suitable for use within the dataset.
Quality control of instrumental variables
To ensure the quality of the IVs, we conducted a heterogeneity analysis using the Q Test within the inverse variance weighted (IVW) model, utilizing the RadialMR package. 37 In this analysis, we excluded outliers with a p-value of less than 0.05. Additionally, we assessed the strength of the IVs by calculating the F-statistics, where an F-statistic greater than 10 suggests a low risk of weak instrument bias in the MR analysis. The F-statistic was computed using the formula F_pow_beta_se = (β/se)², where β denotes the genetic effect size derived from the GWAS data for the exposure, and se represents the standard error of that effect size. 38
Bidirectional two-sample MR analysis
In this study, we utilized a bidirectional two-sample MR analysis to explore the potential causal relationships between neurodegenerative diseases and rsfMRI phenotypes. In our forward MR analysis, we treated rsfMRI as the exposure variable and neurodegenerative diseases as the outcome variable. Conversely, in the reverse MR analysis, neurodegenerative diseases were considered the exposure variable, while rsfMRI was viewed as the outcome variable. The analyses were performed using R software version 4.3.3 (available at http://www.R-project.org) along with the “Mendelian Randomization” package (version 0.4.3). We employed several methods, including weighted median, weighted mode, and IVW approaches. Given its superior statistical power, the IVW method was chosen as the primary method for causal inference.37,39 However, it is crucial to acknowledge that the presence of non-zero level pleiotropy could potentially bias the results. 40
To improve the reliability of MR estimates, three additional MR methods were introduced. The MR-Egger method is designed to address potential pleiotropic effects when estimating causal relationships; its regression intercept acts as a marker for the presence of horizontal pleiotropy. 41 The weighted median method calculates causal effects by determining the median of a weighted distribution of SNPs, and it can accommodate up to 50% of genetic variation that may exhibit horizontal pleiotropy. 42 Lastly, the weighted mode method groups SNPs according to the similarity of their causal effects and estimates the causal effect based on the densest cluster, making it particularly effective when multiple SNPs are used as valid instrumental variables. 43
To assess the variability of the chosen instrumental variables, we used Cochran's Q statistic along with its corresponding p-value. When the null hypothesis of homogeneity was rejected, we chose to apply random-effects IVW rather than fixed-effects IVW. 44 Additionally, we employed the MR-PRESSO tool to identify and adjust for horizontal pleiotropic outliers, re-evaluating the causal relationships after removing instrumental variables linked to heterogeneity. 45 To address the risk of false positives due to multiple hypothesis testing, we implemented the false discovery rate (FDR) as a reliable method for correcting statistical biases associated with multiple comparisons. 46 After applying FDR correction, our bidirectional MR analysis indicated only a few statistically significant effects. However, in the uncorrected data from low p-value phenotypes, we noted several interesting observations that deserve further exploration. Overall, this study provides strong and trustworthy estimates of the causal relationships between neurodegenerative diseases and rsfMRI phenotypes through the thorough application of various MR techniques, thereby deepening our understanding of the fundamental mechanisms behind these associations.
Data availability
This study employed a range of publicly available GWAS summary statistics to perform MR analyses on several neurodegenerative diseases, including AD, ALS, FTD, MS, DLB, and PD. For AD, we utilized two GWAS datasets, namely ieu-b-5067 and ebi-a-GCST90027158, which together included over 970,000 cases and control samples. In the case of ALS, data were obtained from the GWAS Catalog's ebi-a-GCST900271 dataset, encompassing more than 240,000 cases and control samples. FTD data were sourced from the GWAS Catalog's ieu-b-43 dataset, which included 5533 cases and control samples. For MS, we relied on summary data from the International Multiple Sclerosis Genetics Consortium (IMSGC) available in the ieu-b-18 dataset, covering over 180,000 cases and control samples. The study on DLB utilized the ebi-a-GCST90001390 dataset, which comprised 2591 LBD cases and 4027 control samples. For PD, we analyzed the ieu-b-7 dataset provided by the International Parkinson Disease Genomics Consortium (IPDGC), which included nearly 930,000 cases and control samples of European ancestry. Additionally, the rsfMRI dataset used in this study is publicly accessible on the Zenodo platform (URL: https://zenodo.org/record/5775047, cited in Reference 102), 47 promoting transparency and reproducibility of our findings. The accompanying manuscript includes the relevant raw data.
Code availability
All analyses in this study were conducted using R software (version 4.3.3) along with several packages, specifically TwoSampleMR (version 0.6.0), MendelianRandomization (version 0.8.0), and MRPRESSO (version 1.0). These tools, including R software, are available for download from their official websites, with R software accessible at https://www.R-project.org.
Results
Study overview
Dysfunction in brain functional networks has been commonly observed in various neurodegenerative diseases. To investigate the potential causal relationships between resting-state functional brain networks and these diseases, this study conducted a bidirectional two-sample MR analysis. This analysis utilized rsfMRI phenotype data from Zhao et al. (2022) alongside summary statistics from GWAS covering seven neurodegenerative diseases. 25 Considering the minimal influence of genetic variation on brain functional networks,26–28 we identified 191 phenotypes that were significantly affected by genetic variation out of a total of 1777 phenotypes, using a significance threshold of 5 × 10^-8. These included 75 traits associated with the amplitude of spontaneous neural activity (nodes), 111 traits related to paired functional connectivity (edges), and 5 measures of global functional connectivity.
Detailed datasets for neurodegenerative diseases are available in the GWAS Catalog and related literature (Table 1 and Supplemental Table 1), while a summary of fMRI phenotypes can be found in Supplemental Table 2. The study design framework is depicted in Figure 1. To ensure the validity of the MR analysis, we carefully filtered the IVs by including only SNPs that had a significant association with the exposure (p < 5 × 10^-8). We assessed the strength of these IVs by calculating the F-statistic (Supplemental Tables 3 and 4), to confirm their robustness.

Bidirectional Mendelian randomization analysis workflow of brain rsfMRI and neurodegenerative diseases. This workflow provides a concise overview of our bidirectional Mendelian randomization (MR) analysis approach involving 191 resting-state functional magnetic resonance imaging (rsfMRI) phenotypes and 6 neurodegenerative diseases. Initially, single nucleotide polymorphisms (SNPs) significantly associated with the exposure were selected as instrumental variables (IV), while confounding factors related to the exposure were excluded. Following rigorous quality control, we performed MR analysis on the selected instrumental variables to deduce causal relationships between rsfMRI phenotypes and neurodegenerative diseases. Finally, we assessed the robustness of MR inference through sensitivity analysis to ensure the reliability of our results.
To ensure the robustness of bidirectional MR inferences, we systematically performed four sensitivity analyses (Supplemental Tables 5, 6, 10–13).
To evaluate the reliability of MR findings, we conducted statistical power analyses using the MR Power Calculator (https://sb452.shinyapps.io/power/) (Supplemental Tables 14 and 15). In
Additionally, we included height 48 (GWAS ID: ieu-a-89) and birth length 49 (GWAS ID: ieu-a-29) as negative control phenotypes, given their lack of established biological relevance to neurodegenerative mechanisms (Supplemental Table 9). The GWAS data for height were derived from the Genetic Investigation of Anthropometric Traits (GIANT) consortium (N = 253,288 European individuals), and birth length data were obtained from the Early Growth Genetics (EGG) Consortium (N = 28,459 European participants). No significant associations were observed between these traits and neurodegenerative diseases or fMRI features (p > 0.05), further validating the robustness of our MR design.
Forward MR analysis of rsfMRI features on neurodegenerative diseases
The forward MR analysis revealed 26 potential brain functional networks, identified through rsfMRI phenotypes, that may have causal influences on five neurodegenerative diseases: AD, ALS, MS, DLB, and PD. This discovery offers important insights into how these brain functional networks contribute to the development of neurodegenerative diseases (Figure 2 and Supplemental Table 7).

Causal relationships in forward Mendelian randomization. Left: The forest plot illustrates the significant causal relationship results predicted using four MR methods (MR-IVW, MR Egger, weighted median, and weighted modal). In analyses utilizing the MR-IVW method, p-values less than 0.05 were considered significant. The odds ratio (OR) represents the effect size corresponding to each standard deviation change in average rsfMRI, reflecting the impact of phenotypes on the risk of neurodegenerative diseases. Error bars indicate the 95% credible intervals, providing a confidence range for the estimated values. Right: The pattern maps highlight the distribution of representative rsfMRI phenotypes within specific neuroanatomical regions, providing insights into their relationships with neurodegenerative diseases.
Impact of brain functional networks on AD
AD, a progressive neurodegenerative condition, is characterized by cognitive decline, memory loss, and impairment of daily functions. 50 This study utilized rsfMRI to investigate brain functional networks associated with AD, identifying several phenotypes with causal relationships.
In Pheno1, enhanced activity in the cerebellar and precuneus regions significantly decreased the risk of AD (IVW OR = 0.999, 95% CI: 0.998–1.000, p = 0.0476), suggesting a regulatory role of the DMN in AD pathology. 51 For Pheno61, increased activity in the frontal cortex was negatively correlated with AD risk (IVW OR = 0.999, 95% CI: 0.998–1.000, p = 0.0354), indicating the protective importance of frontal function in cognitive integrity. 52 In Pheno609, increased joint network activity in the superior frontal cortex and parietal cortices was positively correlated with AD risk (IVW OR = 1.002, 95% CI: 1.000–1.004, p = 0.0043), revealing that changes in integrated network activity may predict AD risk. 53 Pheno1293 and Pheno1300 indicated that activity in the parietal and temporal regions correlates with the risk of AD, suggesting that perceptual and motor disturbances may emerge as early symptoms (Pheno1293: IVW OR = 1.002, p = 0.0300; Pheno1300: IVW OR = 0.998, p = 0.0392). 54 In Pheno1325, interactions between the parietal and postcentral regions, along with the attention and DMNs, confirmed that attention influences the risk of AD (IVW OR = 1.003, 95% CI: 1.000–1.005, p = 0.0268). 55
Impact of brain functional networks on ALS
ALS is a neurodegenerative disorder marked by the gradual loss of motor neurons. 56 This study utilized rsfMRI to explore various phenotypic features linked to ALS. Notable findings include a significant positive correlation between cerebellar activity and ALS risk, particularly in Pheno15, where amplitude characteristics in the cerebellum were associated with an IVW OR of 1.27 (p = 0.0087), indicating the cerebellum's critical role in ALS pathology and its dysfunction's close connection to motor neuron damage. 57 Additionally, analyses of Pheno27 and Pheno51 revealed that increased amplitude in the postcentral, precentral, and paracentral regions correlated with a heightened ALS risk, with an increase of up to 41.8% (IVW OR = 1.42, p = 0.0003), underscoring the significance of motor network activity in the likelihood of developing ALS.14,58,59 Furthermore, investigations of Pheno1328 and Pheno1359 showed that heightened activity in the frontal and temporal regions was linked to an increased risk of ALS (IVW OR = 1.21, p = 0.044), while activity in the superior frontal and mid temporal/angular regions appeared to offer a protective effect (IVW OR = 0.77, p = 0.022), illustrating the complex roles these brain areas play in ALS pathology. 60 Lastly, an analysis of Pheno1697 indicated a negative correlation between the overall activity of the DMN and ALS risk (IVW OR = 0.91, p = 0.0143), suggesting that normal DMN functioning may have a protective effect against ALS progression. 61
Impact of brain functional networks on MS
MS is a chronic autoimmune disease that primarily impacts the central nervous system, resulting in various neurological deficits. 62 This study utilized rsfMRI to investigate changes in brain functional networks related to MS, with a particular emphasis on the visual network, alertness network, and DMN. The key findings of the study indicate that in the visual network (Pheno19), there is a significant positive correlation between increased spontaneous neural activity and MS risk (IVW OR = 1.90, p = 0.0050), suggesting that abnormal activity in visual regions may be closely tied to the pathological processes of MS. 63 Additionally, analysis of the salience and DMNs revealed that heightened activity in the supplementary motor area and frontal cortex, as seen in Pheno49 and Pheno66, significantly raised the risk of MS (IVW OR = 1.23, p < 0.04), underscoring their crucial role in the onset of the disease.64–66 Furthermore, in the mid-temporal region (Pheno70), increased activity in the mid-temporal cortex and angular gyrus was linked to nearly a 49% increase in MS risk (IVW OR = 1.49, p = 0.0149), highlighting the potential involvement of this region in the pathophysiology of MS, particularly concerning language and cognitive impairments.67,68 Lastly, the study identified synergistic effects among multiple brain regions in the comprehensive phenotype (Pheno1161), where a one standard deviation increase in the activity of key areas resulted in a 52.9% rise in MS risk (IVW OR = 1.53, p = 0.0358), indicating the collaborative significance of the frontal cortex and other regions in the pathology of MS. 69
Impact of brain functional networks on DLB
DLB is a progressive neurodegenerative disease characterized by cognitive impairments, visual hallucinations, and motor dysfunctions. 70 This study employed rsfMRI phenotype analysis to investigate changes in brain functional networks associated with DLB, uncovering several critical brain regions whose activities are closely linked to the risk of developing DLB. Notably, visual network abnormalities were observed in both Pheno22 and Pheno29, which are associated with visual networks. These phenotypes showed significantly heightened neural activity in the visual cortices, including the calcarine, lingual, and cuneus regions, correlating with an increased risk of DLB. Specifically, in Pheno22, a one standard deviation increase in activity (IVW OR = 2.12, p = 0.0437), while in Pheno29, the increase raised the risk by 65% (IVW OR = 2.56, p = 0.0095). These results highlight the crucial role of visual system abnormalities in the visual hallucinations commonly experienced by individuals with DLB. 71 Furthermore, increased activity in the frontal cortex and cerebellum, as noted in Pheno33, was linked to a heightened risk of DLB (IVW OR = 1.52, p = 0.0347), emphasizing the importance of these regions in executive functions, which are vital for understanding cognitive impairments in DLB. 72 An expanded analysis of visual networks, specifically Pheno35, focused on the activity of the cuneus and occipital lobes, revealing that increased activity in these areas was associated with a remarkable 158% increase in the risk of developing DLB (IVW OR = 2.58, p = 0.0063). This finding further underscores the strong connection between abnormalities in visual networks and cognitive as well as visual impairments in DLB.73,74 Additionally, Pheno45 highlighted the central executive and attention networks, showing that heightened activity in the parietal region correlated positively with DLB risk; notably, a one standard deviation increase in activity led to approximately a 16% rise in risk (IVW OR = 1.57, p = 0.0432). This suggests that changes in the central executive network (CEN), particularly regarding attention and cognitive control, may play a significant role in worsening cognitive challenges faced by DLB patients.75,76 Lastly, Pheno1175 provided a comprehensive overview by integrating the activities of multiple brain regions, demonstrating that increased overall brain activity was significantly linked to a higher risk of DLB (IVW OR = 3.05, p = 0.0212). This highlights the intricate interactions between the frontal cortex and various networks involved in the pathology of DLB. 77
Impact of brain functional networks on PD
PD is a neurodegenerative disorder that manifests through movement disorders, tremors, rigidity, and balance disturbances. 78 In this study, rsfMRI was utilized to investigate how brain functional networks influence PD, leading to the identification of significant phenotypic features. The analysis of the motor network revealed that Pheno10 and Pheno11 were notably linked to the activities of the postcentral gyrus and precentral gyrus, which are central to the motor network. An increase in neural activity within these areas was associated with a heightened risk of developing PD. Specifically, for Pheno10, a one standard deviation increase in activity was correlated with a 30.4% increase in PD risk (IVW OR = 1.304, p = 0.039). Pheno11 showed a similar pattern (IVW OR = 1.388, p = 0.032), underscoring the importance of the motor network in the context of PD. 78 Additionally, the study explored the interactions between the DMN and the CEN, particularly in Pheno810, which revealed a complex relationship involving the precuneus, angular gyrus, and cingulate cortex. The findings indicated that disrupted connectivity between these networks was associated with an increased risk of PD (IVW OR = 0.600, p = 0.047), suggesting that alterations in connectivity patterns may serve as potential biomarkers for cognitive impairments related to PD. 79
Reverse MR analysis of rsfMRI features in neurodegenerative diseases
The risk of neurodegenerative diseases may influence neuronal activity in associated brain regions along with the connectivity of functional networks. To investigate the causal effects on brain functional networks, we conducted a reverse MR analysis focusing on the relationship between neurodegenerative diseases and rsfMRI phenotypes. This study identified six neurodegenerative diseases (AD, ALS, MS, LBD, and PD) and their potential causal associations with 64 rsfMRI phenotypes.
The risk of neurodegenerative diseases primarily affects various brain regions, such as the DMN, CEN, motor network, visual network, and SN, thereby influencing spontaneous neuronal activity and connectivity. Specifically, these risks led to significant alterations in connectivity and neural activity in regions such as the parietal and temporal lobes across multiple functional networks, including the default mode, central executive, motor, visual, salience, and subcortical-cerebellum networks.
Furthermore, this impact may extend to the interactions between functional networks, potentially triggering extensive network reconfigurations at a global level (Figure 3 and Supplemental Table 8).
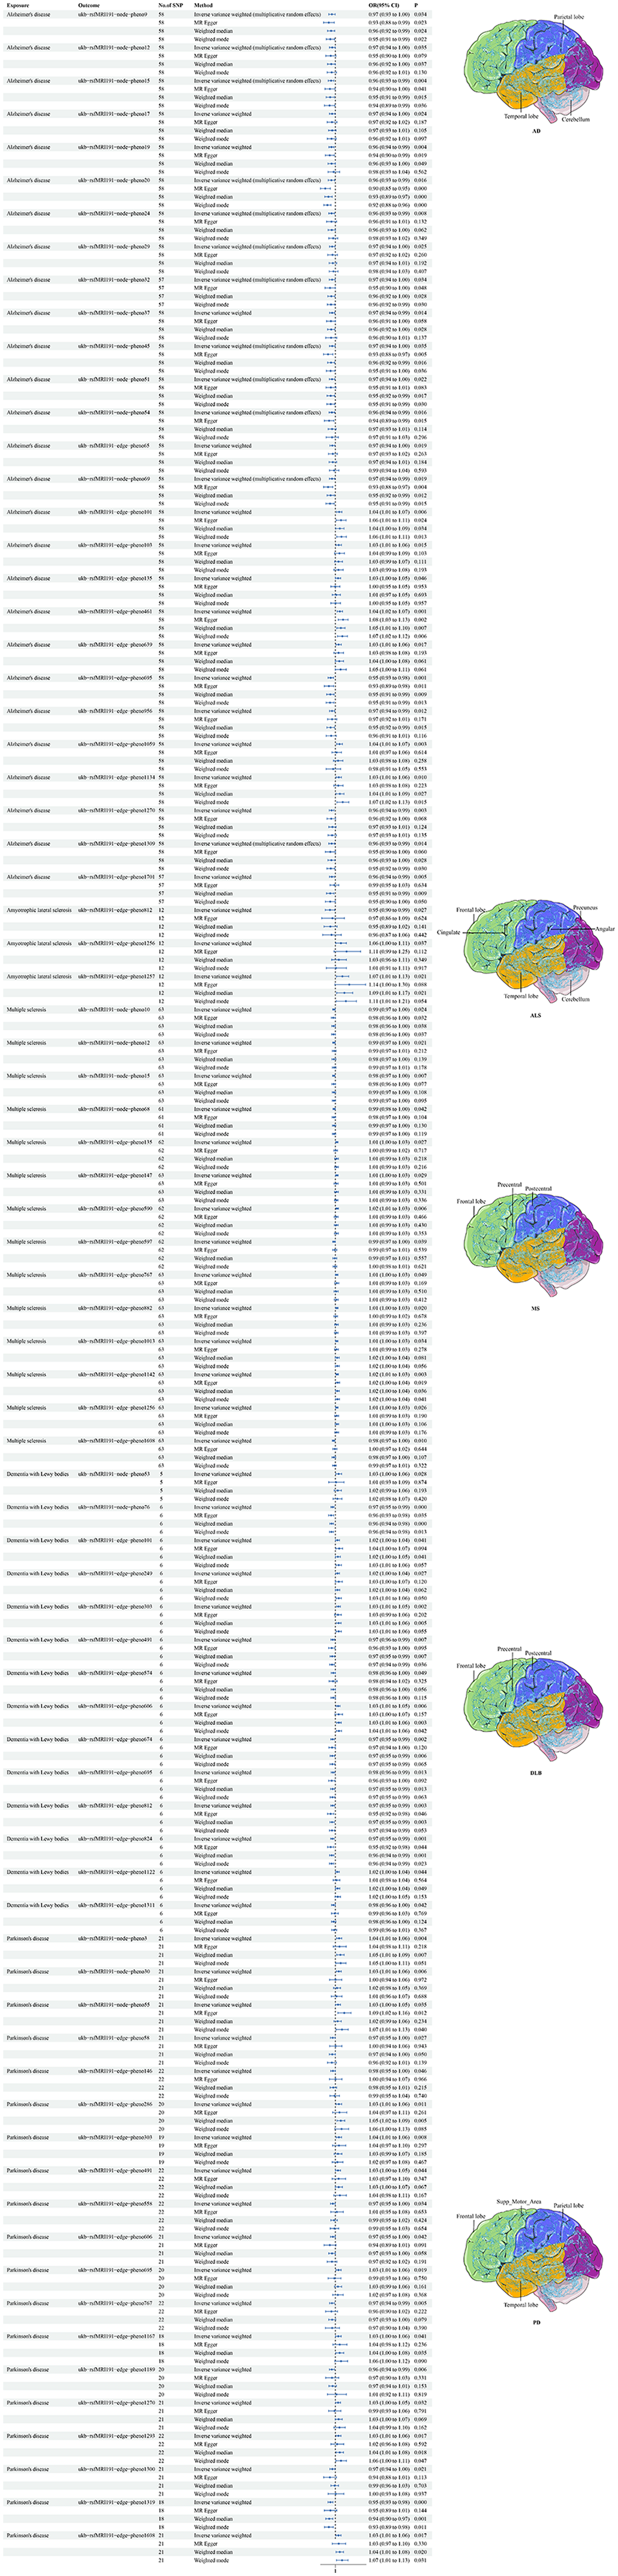
Causal relationships in reverse Mendelian randomization (MR). Left Panel: The forest plot displays significant causal relationships estimated using four MR methods (MR-IVW, MR Egger, weighted median, and weighted mode). For the MR-IVW method, p-values less than 0.05 are considered significant. The odds ratio (OR) represents the effect size of neurodegenerative disease risk (measured as standard deviation changes) on average resting-state functional MRI (rsfMRI) phenotypes, with error bars indicating 95% confidence intervals (CI). p-values originate from the Mendelian randomization analysis, and all analyses are conducted as bidirectional MR. Right Panel: A schematic representation of the anatomical brain regions illustrating the distribution of representative rsfMRI phenotypes within the brain structure.
Impact of AD on brain functional networks
AD is associated with notable alterations in brain functional networks, particularly a significant reduction in connectivity between the DMN and CEN (OR = 0.965, 95% CI: 0.934–0.997, p = 0.034), which may exacerbate cognitive and executive function impairments. 80 Additionally, AD leads to a decrease in connectivity between the cerebellum and subcortical networks (OR = 0.957, 95% CI: 0.929–0.986, p = 0.004), adversely affecting motor coordination and cognitive integration. 81
Impact of ALS on brain functional networks
ALS risk is correlated with weakened connectivity between the DMN and the limbic system (IVW OR = 0.945, 95% CI: 0.900–0.994, p = 0.027), significantly impacting emotional regulation and self-awareness. 82 Moreover, ALS is associated with increased connectivity within the central executive and salience networks (IVW OR = 1.056, 95% CI: 1.003–1.111, p = 0.037), which may reflect adaptive enhancements in information processing. 83
Impact of PD on brain functional networks
PD profoundly alters brain functional networks. Our comprehensive analysis of Pheno1319 revealed significant changes in connectivity patterns. The lesions primarily impact the supplemental motor area (SMA), frontal lobe, and temporal lobe—regions essential for both motor and cognitive functions. Connectivity between the SN, DMN, and CEN shows a marked reduction (b = −0.0512, se = 0.0133, p = 0.00011), with this decrease being highly significant (95% CI: −0.0772 to −0.0252) and OR = 0.9501, indicating a 4.99% reduction in connectivity (95% CI: 0.9257–0.9751), remaining significant after multiple comparisons and FDR adjustment (p_fdr = 0.0212). These findings underscore the damaging impact of PD on critical network structures, suggesting an increased risk of cognitive and behavioral impairments. 84 Additionally, we observed an increase in connectivity within the parietal network among PD patients (IVW OR = 1.0370, 95% CI: 1.0117–1.0629, p = 0.0039), potentially reflecting improved attentional control. Conversely, connectivity between the frontal CEN and the SN decreased (IVW OR = 0.9734, 95% CI: 0.9504–0.9970, p = 0.0271), possibly indicating impairments in executing complex cognitive tasks. 85
Impact of other neurodegenerative diseases on brain functional networks
The study examined the effects of MS and DLB on brain functional networks, alongside AD, PD, and ALS, revealing unique connectivity patterns for each condition. In the case of MS, it was found that connectivity within the motor network was significantly reduced (IVW OR = 0.985, p = 0.024), which may hinder the execution and coordination of daily motor activities. 86 Additionally, MS showed weakened connectivity between the frontal cortex and cognitive networks (IVW OR = 0.988, p = 0.0425), potentially leading to cognitive dysfunction in task execution and situational judgment. 87 For DLB, there was an enhancement in connectivity within both motor and attention networks (IVW OR = 1.032, p = 0.028); however, a significant reduction in connectivity was observed in areas such as the frontal lobe (IVW OR = 0.971, 95% CI: 0.955–0.987, p = 0.0004), indicating impairments in executive function and cognitive flexibility. 88
Discussion
In this study, we utilized bidirectional two-sample MR analysis to explore the potential bidirectional causal relationships between 191 brain functional phenotypes obtained from rsfMRI and seven neurodegenerative diseases. Our results revealed significant bidirectional causal effects between these resting-state functional networks and neurodegenerative diseases, opening new research avenues and enhancing our understanding of the pathophysiological mechanisms involved in neurodegenerative disorders. Notably, we present the first direct evidence that brain functional networks not only influence the risk of neurodegenerative diseases in a unidirectional manner but are also influenced in return by factors associated with disease risk. This discovery of a bidirectional interaction mechanism provides robust theoretical support and fresh insights for developing more targeted strategies for disease prevention and treatment.
Contrary to Nassan et al. (2025),
13
who found no significant causal effects of intrinsic functional networks on four neurodegenerative diseases (AD, FTD, semantic dementia, LBD) after stringent multiple testing correction (adjusted p > 0.0019), our bidirectional MR analysis identified 26 rsfMRI phenotypes causally linked to six neurodegenerative diseases (AD, ALS, FTD, MS, DLB, PD) and 64 reverse disease-to-network effects. Key methodological differences likely explain this divergence: (1)
Notably, both studies converge on the role of visual network abnormalities in LBD. Nassan et al. reported a nominal association between visual cortex connectivity and LBD (p = 0.01), aligning with our finding that heightened activity in visual regions (calcarine, lingual) increases LBD risk (OR = 2.58, p = 0.0063). The stronger effect size observed here (OR = 2.58 versus 1.23) may stem from differences in phenotype definition (e.g., stricter clinical criteria for DLB in our study) or genetic instrument selection. This consistency across MR frameworks suggests visual network dysfunction may precede clinical manifestations in LBD. However, our identification of cerebellar-DMN connectivity alterations uniquely impacting AD risk highlights disease-specific network vulnerabilities not resolved in prior studies. Specifically, reduced cerebellar-subcortical connectivity (OR = 0.957) may reflect early compensatory mechanisms against amyloid toxicity, a hypothesis supported by preclinical models showing cerebellar neuroprotection in amyloidogenic pathways. 81
Our research provides a strong theoretical basis for creating new non-invasive treatment strategies and exploring innovative therapeutic approaches. For example, by combining technologies like repetitive transcranial magnetic stimulation, non-invasive brain stimulation, and neurofeedback training with advanced monitoring tools such as electroencephalography, we can more effectively intervene in and adjust brain functional networks to treat or ease the symptoms of neurodegenerative diseases. Additionally, the emergence of advanced techniques like optogenetics offers remarkable opportunities and broad potential for addressing these conditions.
We conducted a comprehensive investigation into key regions within brain functional networks, focusing on the DMN, CEN, and SN. Our study examined how these networks’ activities change and their intricate causal relationships with risk factors in various neurodegenerative diseases, including AD, ALS, MS, PD, and DLB. For each condition, we pinpointed specific network activities that are closely associated with the symptoms of the disease. These findings not only enhance our understanding of the underlying pathophysiological mechanisms but also provide valuable insights that could aid in the development of early diagnostic methods and intervention strategies.
For instance, in the context of AD, we found that dysfunction within the DMN, CEN, and SN is tightly correlated with cognitive impairments in AD patients. 90 Specifically, heightened parietal lobe activity was indicative of increased AD risk, 91 while heightened cerebellar activity was associated with lowered risk. These findings not only elucidate the pathophysiological mechanisms of AD but also present potential targets for future therapeutic strategies. 81 Similarly, in the investigation of DLB, abnormalities in the internal connections of the DMN, SN, and CEN were associated with diminished social attention, abnormal self-referential thinking, and decreased cognitive flexibility. 92 Increased cerebellar activity was linked to a heightened risk of DLB, 72 while connectivity within the visual network also positively correlated with increased DLB risk. These findings highlight the critical role of network connectivity in the pathophysiology of DLB. 93
In our study on ALS, we observed that increased cerebellar activity was positively correlated with ALS risk, while the frontal and temporal regions exhibited complex roles in ALS pathology. These findings underscore the pivotal roles of the cerebellum, as well as the frontal and temporal regions, in the pathophysiology of ALS, potentially paving the way for new therapeutic avenues in ALS treatment. 94 Regarding MS, our research revealed that internal connectivity abnormalities in the DMN, SN, and CEN were closely associated with cognitive and motor impairments in MS patients. 95 These findings deepen our understanding of the pathogenesis of MS and pave the way for the development of novel therapeutic approaches for the disorder.
In the study of PD, abnormalities in the internal connections of the DMN and CEN were similarly closely associated with various symptoms experienced by PD patients.96,97 Increased activity in the precuneus is considered a positive factor linked to a reduced risk of PD, 98 whereas decreased neural connectivity within the CEN may elevate risk and is closely related to social cognitive deficits in PD patients. These findings underscore the importance of neural network integrity in the symptomatology and risk assessment of PD. 99 Collectively, these insights enhance our understanding of the pathophysiological mechanisms underlying various neurodegenerative diseases, such as AD, DLB, and PD, providing crucial references for future research and therapeutic strategies.
This study utilized bidirectional MR analysis to systematically uncover changes in brain functional networks among patients with various neurodegenerative diseases and to elucidate their intricate relationships with disease risk. The findings provide fresh insights into the biological mechanisms underlying these diseases and highlight critical potential targets for interventions and treatment strategies focused on brain functional networks. Future research should delve deeper into the interactions and dynamic alterations among these networks to improve our understanding of neurodegenerative diseases and offer more accurate clinical support for diagnosis and treatment.
A key strength of this study is its use of rsfMRI data for MR analysis, which allows for a direct observation of the functional activity levels in different brain regions. This approach reveals the stable network structures present in the human brain. 16 Unlike traditional MRI, which mainly focuses on the structural characteristics of brain regions, rsfMRI offers a more detailed and insightful perspective. For instance, in the case of PD, even though there may not be significant structural differences between PD patients and a control group, there are notable variations in functional network connectivity. This highlights the unique benefits of rsfMRI in identifying alterations in brain networks associated with the disease.100,101
Despite the significant findings of this study, several limitations must be acknowledged. Firstly, the GWAS dataset is derived from specific populations, which raises questions about its broader applicability and necessitates further validation. Additionally, there may be age mismatches between participants in the rsfMRI and the GWAS data, which could affect the accuracy of any causal inferences drawn. Furthermore, the absence of individual-level data limits our ability to thoroughly evaluate unobserved confounding factors that could influence the results. Moreover, the methodology used in MR relies on several assumptions, and the genetic variations examined may not fully capture environmental changes, potentially affecting the interpretation of the results. 102 Lastly, while we have identified potential causal relationships, these findings are primarily based on statistical inference and must be validated through clinical longitudinal studies to confirm their validity.
Conclusions
In conclusion, this study significantly explores the potential causal relationship between resting-state functional MRI (rsfMRI) characteristics and neurodegenerative diseases, highlighting its critical importance. We reveal the strong connections between brain functional networks and these diseases, identifying various rsfMRI phenotypes that are causally linked to disease risk. These findings not only enhance our understanding of the mechanisms behind neurodegenerative diseases but also lay important theoretical groundwork for developing new therapies. Future research should focus on furthering our comprehension of brain functional networks and investigating their potential applications in treating neurodegenerative diseases, with the goal of achieving more precise and effective clinical interventions and treatment strategies.
Supplemental Material
sj-xlsx-1-alr-10.1177_25424823251348844 - Supplemental material for Exploring causal links between brain functional networks and neurodegenerative disease risk using Mendelian randomization
Supplemental material, sj-xlsx-1-alr-10.1177_25424823251348844 for Exploring causal links between brain functional networks and neurodegenerative disease risk using Mendelian randomization by Xiangzan Wei and Weirong Qin in Journal of Alzheimer's Disease Reports
Footnotes
Acknowledgements
The authors have no acknowledgments to report.
Ethical considerations
This study utilized publicly available summary-level GWAS data. Ethical approval and informed consent were obtained in the original studies.
Author contributions
Consent to participate
Not applicable
Consent for publication
Not applicable
Author contributions/CRediT
Funding
The authors disclosed receipt of the following financial support for the research, authorship, and/or publication of this article: Inclusive Talent Support Policy of the Guangxi Zhuang Autonomous Region, commonly referred to as the "Seedling Program", Education Department of Guangxi Zhuang Autonomous Region, Fund of Natural Science Foundation of China grants, Outstanding Doctoral Talent Support Program and the Doctoral Startup Fund at Guangxi Medical University, Fund of the Natural Science Foundation of Guangxi Province, Scientific Research Fund of the Guangxi Education Department, Fund of Young Elite Scientists Sponsorship Program by GXAST, (grant number No award number, GXSWFZ202302, 22467006, 2024JJB120121, 2024JJB140454, 2023KY0124, 2025YESSGX203).
Declaration of conflicting interests
The authors declared no potential conflicts of interest with respect to the research, authorship, and/or publication of this article.
Data availability statement
This study employed a range of publicly available GWAS summary statistics to perform MR analyses on several neurodegenerative diseases, including AD, ALS, FTD, MS, DLB, and PD. For AD, we utilized two GWAS datasets, namely ieu-b-5067 and ebi-a-GCST90027158, which together included over 970,000 cases and control samples. In the case of ALS, data were obtained from the GWAS Catalog's ebi-a-GCST900271 dataset, encompassing more than 240,000 cases and control samples. FTD data were sourced from the GWAS Catalog's ieu-b-43 dataset, which included 5533 cases and control samples. For MS, we relied on summary data from the International Multiple Sclerosis Genetics Consortium (IMSGC) available in the ieu-b-18 dataset, covering over 180,000 cases and control samples. The study on DLB utilized the ebi-a-GCST90001390 dataset, which comprised 2591 LBD cases and 4027 control samples. For PD, we analyzed the ieu-b-7 dataset provided by the International Parkinson Disease Genomics Consortium (IPDGC), which included nearly 930,000 cases and control samples of European ancestry. Additionally, the rsfMRI dataset used in this study is publicly accessible on the Zenodo platform (URL: ![]() , cited in Reference 102),
47
promoting transparency and reproducibility of our findings. The accompanying manuscript includes the relevant raw data.
, cited in Reference 102),
47
promoting transparency and reproducibility of our findings. The accompanying manuscript includes the relevant raw data.
Supplemental material
Supplemental material for this article is available online.
References
Supplementary Material
Please find the following supplemental material available below.
For Open Access articles published under a Creative Commons License, all supplemental material carries the same license as the article it is associated with.
For non-Open Access articles published, all supplemental material carries a non-exclusive license, and permission requests for re-use of supplemental material or any part of supplemental material shall be sent directly to the copyright owner as specified in the copyright notice associated with the article.