
Abstract
Background
Emergency-department (ED) visits capture diagnostic data that could flag patients at heightened risk for Alzheimer's disease (AD) long before cognitive symptoms are formally recognized.
Objective
To examine how age and multimorbidity interact to predict AD and to test whether explainable machine learning enhances risk stratification using national ED data.
Methods
We analyzed 554,985 ED visits (2010–2014 National Emergency Department Sample) from adults ≥ 60 y. ICD-9-CM codes identified AD and 17 chronic conditions. Logistic regression estimated odds ratios (ORs) for single and combined comorbidities across five age bands. Predictive performance of logistic regression, decision tree, random forest and XGBoost was compared; Shapley Additive exPlanations (SHAP) interpreted model output.
Results
Urinary-tract infection (UTI; OR = 2.74), depression (1.93), hypothyroidism (1.68) and anemia (1.57) independently increased AD odds. Possessing all four “red-flag” conditions tripled risk (OR = 3.31), and each additional red-flag raised risk by 74%. Age showed a steep gradient: relative to 60–65 y, ORs climbed from 2.58 (66–70 y) to 25.8 (86–90 y; all p < 0.001). XGBoost performed best (AUC = 0.782; recall = 0.821), and SHAP confirmed age and red-flag multimorbidity as dominant predictors.
Conclusions
Routine ED codes reveal an age-dependent, dose–response relationship between specific multimorbidity clusters and AD. An interpretable XGBoost model accurately identifies high-risk patients, outlining a practical pathway for real-time cognitive-risk alerts in acute-care settings.
Introduction
Alzheimer's disease (AD) is the leading cause of dementia globally and represents one of the most pressing public health challenges in aging societies. 1 In the United States alone, over six million individuals are currently living with AD, a number projected to rise steeply in coming decades as the population continues to age.2,3 Beyond its devastating impact on memory and functional independence, AD imposes substantial emotional and financial burdens on families, caregivers, and healthcare systems. 4 The absence of curative therapies has placed growing emphasis on early detection, risk stratification, and the development of scalable strategies for preventative care.5–9
Clinical diagnosis of AD typically occurs in the later stages of the disease, often after considerable neurodegeneration has already taken place.10,11 This diagnostic delay limits opportunities for early intervention, patient counseling, care planning, and enrollment in clinical trials. 11 As a result, identifying risk indicators that can signal cognitive vulnerability before overt symptoms emerge has become a critical priority. 12 Increasing attention has focused on routinely collected clinical data, such as comorbid diagnoses recorded in emergency department or primary care visits, as a potentially valuable but underleveraged source of predictive information. 13
Age remains the most well-established risk factor for AD.14–16 However, mounting evidence has highlighted a broad array of chronic comorbidities that may either contribute to the pathophysiological cascade or serve as prodromal indicators of neurodegeneration. Conditions such as hypertension, coronary artery disease, type 2 diabetes, and chronic kidney disease have been linked to AD through mechanisms involving cerebral hypoperfusion, metabolic dysfunction, and systemic inflammation.17–21 Neuropsychiatric and endocrine disorders, particularly depression and hypothyroidism, are also implicated, with known associations with hippocampal atrophy, neurotransmitter imbalance, and impaired neuroplasticity.22,23 Urinary tract infections (UTIs), while typically viewed as acute events, are common among older adults and can precipitate delirium or exacerbate underlying cognitive impairment.24,25 Anemia, atrial fibrillation, and fatigue-related syndromes may further compromise cognitive reserve by contributing to cerebral hypoxia, vascular instability, or systemic energy depletion.26,27
Rather than examining these conditions in isolation, there is increasing interest in identifying multimorbidity patterns, defined as the co-occurrence of two or more chronic conditions, that may act synergistically to elevate the risk of AD.28,29 These syndromic clusters may reflect shared biological mechanisms, including systemic inflammation, oxidative stress, hormonal dysregulation, and vascular pathology, all of which have been implicated in the progression of neurodegenerative disorders.30–32 Appreciating how these combinations of conditions interact to heighten cognitive vulnerability is crucial for developing clinically relevant screening strategies that can be deployed in real-world healthcare settings.
Emergency departments (EDs) offer a unique opportunity for such early identification efforts. As high-throughput clinical environments, EDs serve as key points of contact for older adults, including many who may not receive regular outpatient follow-up. The availability of structured administrative data, including age, sex, and ICD-coded diagnoses, presents a practical foundation for scalable risk stratification tools. However, traditional statistical models may fall short in capturing the complex, nonlinear relationships that characterize multimorbidity. Machine learning approaches, particularly tree-based classifiers such as XGBoost, offer enhanced predictive performance by modeling high-order interactions without prespecification. 33 Yet, concerns about algorithmic opacity have limited their clinical adoption. Recent advances in explainable artificial intelligence, including SHapley Additive exPlanations (SHAP), now enable transparent interpretation of machine learning models, making them more suitable for use in healthcare settings where clinical interpretability is paramount.34,35
To address these gaps, we conducted a comprehensive analysis of nearly 550,000 emergency department visits from the National Emergency Department Sample (NEDS). Our objectives were fivefold: first, to identify specific chronic conditions and their co-occurrence patterns significantly associated with AD diagnosis; second, to assess whether increasing comorbidity burden confers a dose-dependent increase in AD risk; third, to examine whether these associations differ by sex; fourth, to evaluate whether the comorbidity-AD association persists across finer age strata (60–65, 66–70, 71–75, etc.); and fifth, to evaluate and interpret the predictive performance of traditional and machine learning models trained on routine clinical data. By integrating statistical inference with explainable machine learning, including age-stratified logistic regression analysis, our goal was to inform the development of practical, scalable tools for cognitive risk stratification in time-constrained, high-volume healthcare environments.
Methods
Data source and study population
We analyzed data from the 2012–2014 Nationwide Emergency Department Sample (NEDS), a component of the Healthcare Cost and Utilization Project (HCUP). NEDS captures a nationally representative sample of all U.S. hospital-owned ED visits, regardless of admission status, encompassing approximately 30 million unweighted and 145 million weighted records annually. Its extensive scale and diagnostic granularity make NEDS particularly well suited for examining relatively rare comorbidity patterns in older adult populations.
Our study population included adults aged 60 years and older. Eligible records contained at least one diagnosis, among up to 15 ICD-9-CM fields, indicating AD and/or one of 17 chronic comorbid conditions of interest.
Balanced dataset for comparative modeling
To address the extreme class imbalance and improve model estimation, we constructed a secondary analytic sample (N = 554,985) by randomly under-sampling non-AD visits to match the number of AD cases. This balanced dataset was used exclusively for multivariable regression and supervised machine learning models, allowing for more stable coefficient estimation and improved classification sensitivity. By balancing the dataset, we also ensured that analyses could be performed efficiently on standard computational systems, without compromising predictive accuracy or clinical representativeness. Importantly, descriptive statistics—such as comorbidity prevalence, mortality comparisons, and age distribution—were calculated using the original full dataset to reflect real-world prevalence patterns. Table 1 presents a side-by-side comparison of comorbidity rates between the original and balanced samples, confirming that the balancing procedure preserved the essential clinical characteristics of the population.
Prevalence of comorbidities in the original large dataset (N = 20,528,117).

Outcome definition
The primary outcome, AD, was defined via ICD-9-CM code 331.0. This binary variable (1 = AD, 0 = non-AD) was used to maintain diagnostic specificity by excluding other dementia codes.
Predictor variables
Seventeen chronic comorbidities were identified using specific ICD-9-CM codes, selected based on biological plausibility, literature precedent, and exploratory data patterns (see Supplemental Material).
We captured all diagnoses from each patient's record, up to 15 ICD-9-CM diagnosis slots, to ensure comprehensive comorbidity capture. Patient age (modeled as a continuous variable) and sex (modeled as binary) were included as foundational demographic covariates. To quantify clinical burden and examine disease patterns, we constructed several derived measures: first, we created binary indicators for clinically relevant condition clusters, for example, one marking the co-occurrence of urinary tract infection, depression, and anemia, and another marking the expanded cluster that also includes hypothyroidism. Second, we derived a comorbidity count ranging from zero to four, reflecting the cumulative presence of the four core conditions. Third, we flagged “multimorbidity” as a binary variable to denote patients with two or more of these conditions. Finally, we introduced an interaction term between sex and multimorbidity to investigate whether the impact of multimorbidity on AD risk differed by sex.
Statistical analysis
We developed a series of ten logistic regression models using maximum likelihood estimation (via Python's statsmodels) to evaluate the relationship between comorbidity patterns and AD diagnosis. Model 1 assessed the unadjusted association between the triad of UTI, depression, and anemia (uti_depr_anemia) and AD. Model 2 extended this by adjusting for age and sex. To quantify the influence of comorbidity burden, Model 3 examined the total count of the four core conditions (0–4) as a continuous predictor with demographic covariates, while Model 4 categorized this count into 1, 2, 3, or 4 conditions. Model 5 dichotomized burden into a binary multimorbidity flag (≥ 2 conditions) and adjusted for age and sex. Model 6 explored effect modification by including a sex × multimorbidity interaction term. We then conducted a subgroup analysis in Model 7, restricted to individuals meeting multimorbidity criteria, modeling only age and sex. Models 8 and 9 mirrored Models 1–2 but focused instead on an expanded cluster (uti_depr_hypo_anemia). Finally, Model 10 evaluated the independent association of comorbidity count while replacing continuous age with detailed age groups (60–65 as reference, 66–70, 71–75, 76–80, 81–85, 86–90 years) and adjusting for sex.
For all models, we reported odds ratios (ORs), 95% confidence intervals (CIs), and p-values. Model fit was evaluated using McFadden's, Cox & Snell's, and Nagelkerke's pseudo-R2, alongside likelihood ratio (LLR) tests comparing each model to its intercept-only counterpart. Diagnostic checks confirmed model adequacy: Variance Inflation Factors (VIFs) for primary predictors, including comorbidity count, age (continuous or categorical), and sex, were all approximately 1, implying negligible multicollinearity. As expected, the foundational Model 1 showed minimal explanatory power (McFadden's R2 = 0.0006), consistent with the low pseudo-R2 often observed in epidemiologic models without covariates. The addition of age and sex in Model 2 substantially improved model fit (McFadden's = 0.1828; Cox & Snell's = 0.2239; Nagelkerke's = 0.2985), aligning with acceptable discriminatory power in clinical risk settings. All models demonstrated highly significant LLR statistics (p < 0.001), confirming enhanced predictive validity over null models. Formal calibration tests were not conducted here, but will be included in future external validation efforts, following recommended practices in dementia risk modeling.
Machine learning analysis
To evaluate predictive performance, we trained four supervised machine learning classifiers: logistic regression, decision tree, random forest, and XGBoost. Each model was trained on a common set of features, including age, sex, and the 17 chronic comorbidities. The dataset was randomly partitioned into training (80%) and testing (20%) sets using stratified sampling to preserve class balance.
All input features were scaled using standard normalization techniques, and hyperparameters for decision tree, random forest, and XGBoost models were optimized through internal validation. Model performance was evaluated using five classification metrics: accuracy, precision, recall, F1 score, and area under the receiver operating characteristic curve (AUC). The XGBoost model, which yielded the highest AUC and recall, was selected for further interpretation using SHAP analysis.
SHAP analysis
To enhance model transparency and interpretability, we applied SHAP (SHapley Additive exPlanations) to the final XGBoost classifier. SHAP summary plots were used to visualize the most influential predictors and to understand the additive impact of both individual comorbidities and their interactions on AD risk.
Software and tools
All statistical and machine learning analyses were performed using Python 3.10 in a Google Colab environment. Core libraries included pandas for data management, scikit-learn and xgboost for machine learning, statsmodels for regression analysis, matplotlib and seaborn for data visualization, and SHAP for model interpretability. Data cleaning, ICD-9-CM code translation, and exploratory data analysis for dataset characteristics and comorbidity profiles were conducted using STATA 16.
Results
Dataset characteristics and comorbidity profiles
To address the low prevalence of AD in ED visits, we first examined the original dataset consisting of 20,528,117 patient records. In this large sample, AD accounted for only 1.96% of total visits (Table 1). This figure reflects the real-world prevalence of AD among ED patients and highlights the class imbalance challenge for predictive modeling.
To enable effective application of machine learning methods, we constructed a balanced dataset by randomly selecting a subset of non-AD cases to match the number of AD cases. The prevalence of AD in the 60–65, 66–70, and 86–90 age groups was nearly identical between the original dataset (2.30%, 4.32%, and 40.92%, respectively) and the balanced dataset (2.29%, 4.36%, and 41.11%, respectively), confirming the representativeness of the age distribution in the balanced sample.
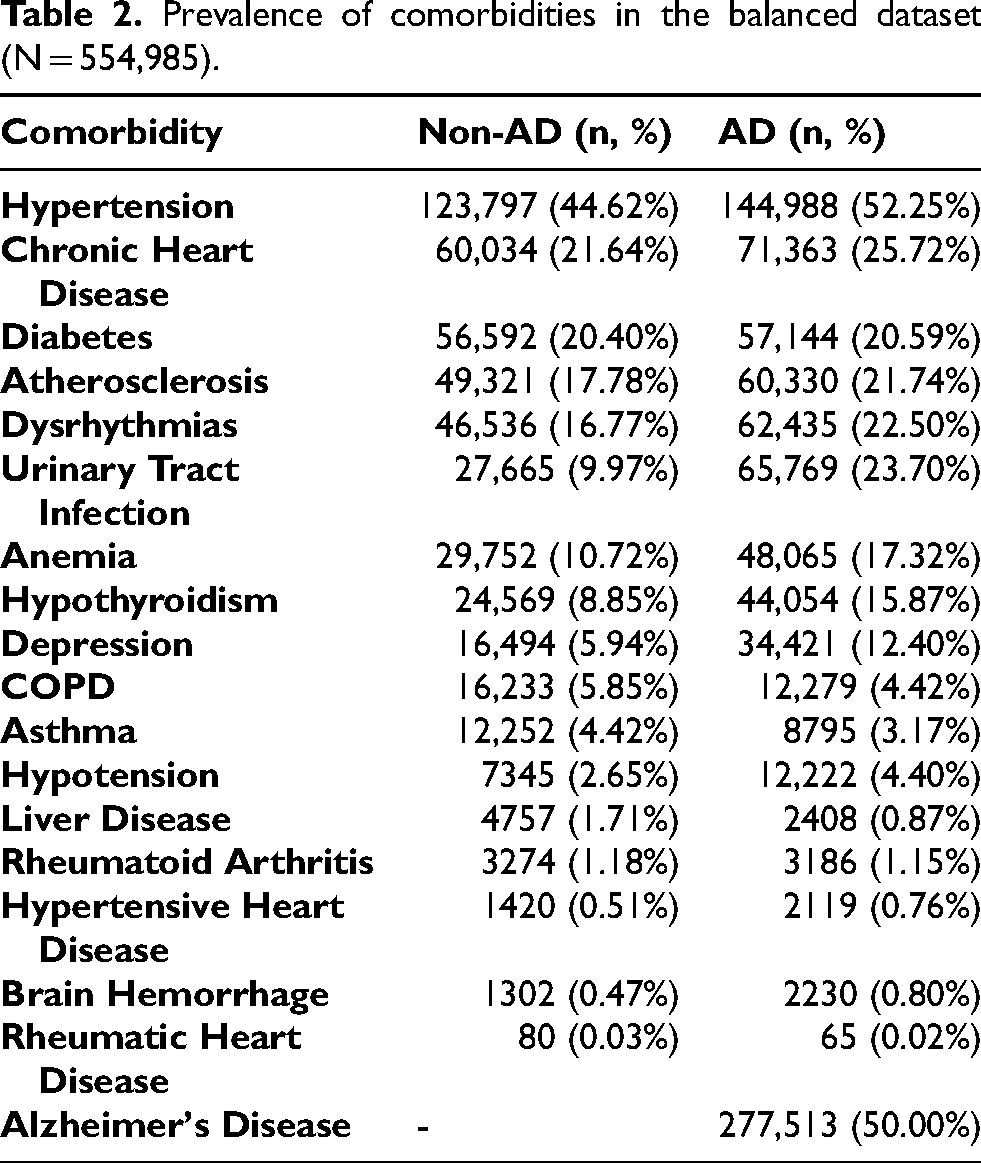
The prevalence of key comorbid conditions remained highly consistent between the original and balanced datasets (Tables 1 and 2). UTI, anemia, hypothyroidism, and depression were more frequently observed in AD cases than non-AD cases in both samples (Figure 1).

Prevalence of chronic conditions among patients with and without AD. This bar chart illustrates the percentage of selected chronic comorbidities among ED visits, stratified by AD status. The x-axis displays 18 chronic conditions, while the y-axis represents the proportion of comorbid diagnoses (%) within each group. AD patients show higher prevalence of urinary tract infection (UTI), depressive disorder, hypothyroidism, and anemia. In contrast, non-AD patients exhibit higher rates of hyperlipidemia, controlled type 2 diabetes, and back pain. These contrasting comorbidity profiles informed the selection of predictor variables for subsequent regression and machine learning analyses.
Prevalence of comorbidities in the balanced dataset (N = 554,985).
Individual chronic condition effects
Single-condition logistic regression models (Figure 2) revealed that UTI was most strongly associated with AD (OR = 2.742; 95% CI: 2.699–2.785; p < 0.001), followed by depression (OR = 1.926), hypothyroidism (OR = 1.681), and anemia (OR = 1.574). hypertension, hyperlipidemia, chronic kidney disease, atrial fibrillation, coronary artery disease, fatigue, gastroesophageal reflux disease, congestive heart failure, and anxiety all showed significant but smaller positive associations. Back pain (OR = 0.592; p < 0.001) and controlled type 2 diabetes (OR = 0.930; p < 0.001) displayed inverse associations, while chronic obstructive pulmonary disease and osteoarthritis had no significant association with AD. Among all comorbidities examined, four conditions including UTI, depression, hypothyroidism, and anemia, exceeded the predetermined OR threshold of 1.5 and were selected as candidate predictors for subsequent multimorbidity and machine learning analyses (see Supplemental Table 1).

Odds ratios of chronic conditions associated with AD. This horizontal bar plot displays adjusted odds ratios (ORs) with 95% confidence intervals for 17 chronic conditions based on multivariable logistic regression analysis. An OR greater than 1 indicates increased odds of an AD diagnosis associated with the respective condition, while an OR less than 1 indicates reduced odds. The x-axis is presented on a logarithmic scale to enhance interpretability. Urinary tract infection (UTI; OR = 2.74), depression (OR = 1.93), hypothyroidism (OR = 1.68), and anemia (OR = 1.57) showed the strongest positive associations with AD. In contrast, conditions such as controlled type 2 diabetes and back pain were inversely associated with AD.
Triadic comorbidity and AD association
In the base logistic regression model (Model 1) evaluating the presence of UTI, depression, and anemia simultaneously (uti_depr_anemia), we found a marked increase in AD risk (OR = 3.906; 95% CI: 3.390–4.500; p < 0.001), indicating that individuals with this exact combination had nearly four times the odds of an AD diagnosis compared to those without. All 9 model values were presented in Supplemental Table 2.
Adjustment for demographics
After including demographic covariates in Model 2, the odds associated with the triad decreased but remained significant (OR = 2.909; 95% CI: 2.495–3.392; p < 0.001). Female sex contributed independently (OR = 1.136; 95% CI: 1.122–1.150; p < 0.001), as did increasing age, with each year corresponding to a 12.7% higher odds of AD (OR = 1.127; 95% CI: 1.127–1.128; p < 0.001).
Comorbidity burden models
Model 3 assessed the influence of cumulative comorbidity (as a continuous factor), revealing that each additional red-flag condition raised AD odds by 73.2% (OR = 1.732; 95% CI: 1.715–1.749; p < 0.001), while female sex (OR = 1.036; p < 0.001) and age (OR = 1.123; p < 0.001) retained significance.
Model 4 introduced categorical counts of comorbidities: one, two, three, or four conditions corresponded to ORs of 1.948, 2.683, 3.292, and 3.291 respectively (all p < 0.001). Beyond three conditions, the risk increase plateaued. Female sex and age remained significant (both p < 0.001).
Model 5 dichotomized comorbidity burden. Individuals with ≥1 condition had over double the AD odds (OR = 2.221; 95% CI: 2.168–2.275; p < 0.001), alongside significant effects of age (OR = 1.126; p < 0.001) and sex (OR = 1.095; p < 0.001).
Interaction with sex
Model 6 incorporated an interaction term between multimorbidity and female sex. A modest yet significant interaction showed that the effect of multimorbidity was slightly reduced in females (interaction OR = 0.921; 95% CI: 0.870–0.976; p = 0.005). The main effects of multimorbidity (OR = 2.364), female sex (OR = 1.100), and age (OR = 1.126) remained strongly significant (all p < 0.001).
Multimorbid subgroup analysis
Model 7, restricted to multimorbid subjects, revealed that age continued to significantly predict AD (OR = 1.098; 95% CI: 1.095–1.101; p < 0.001); notably, female sex ceased to be significant (OR = 1.040; 95% CI: 0.985–1.098; p = 0.155).
Expanded comorbidity cluster
We then augmented the cluster to include hypothyroidism. The unadjusted Model 8 showed strong association (OR = 3.906; 95% CI: 2.880–5.297; p < 0.001). Upon adjustment (Model 9), the OR decreased but remained significant at 2.460 (95% CI: 1.777–3.406; p < 0.001), with female sex (OR = 1.137) and age (OR = 1.127) again showing independent contribution (both p < 0.001).
Age groups, sex, and comorbidity count
In Model 10 (Table 3), we replaced continuous age with six categorical age bands, 60–65, 66–70, 71–75, 76–80, 81–85, and 86–90 years, using 60–65 as the reference. After excluding an empty 91 + category, this model showed a clear dose-response pattern in AD risk: compared to the referent, odds increased 2.58-fold (95% CI: 2.49–2.66) in ages 66–70 and escalated to 25.79-fold (95% CI: 25.07–26.54) in ages 86–90 (all p < 0.001). Female sex was not significantly associated (OR = 1.06, 95% CI: 1.05–1.08; p < 0.001), and the core comorbidity count remained highly predictive, each additional condition increased odds by 73.5% (OR = 1.735, 95% CI: 1.718–1.752; p < 0.001). Fit statistics for Model 10 indicated slight improvement over earlier models: McFadden's pseudo-R2 reached 0.1958, Cox & Snell's was 0.2377, and Nagelkerke's was 0.3169, all displaying significant likelihood ratio test results (p < 0.001), confirming a well-performing model suitable for dementia risk stratification.
Logistic regression results for age groups and comorbidity count.

Age bands compared to reference group (60–65 years); adjusting for sex and the count of core red flag conditions (UTI, depression, hypothyroidism, anemia).
Predictive modeling performance
Four predictive models were assessed on test data (Figure 3). The logistic regression model achieved an AUC of 0.780, accuracy of 71.5%, precision of 70.0%, recall of 75.2%, and F1 score of 72.5%. Tree-based classifiers yielded comparable AUCs, decision tree (0.777), random forest (0.781), and XGBoost (0.782), with slightly improved recall and F1 scores, peaking with XGBoost (recall 82.1%, F1 = 74.4%).

Receiver operating characteristic (ROC) curves for predicting AD. This figure compares the classification performance of four supervised learning models in predicting AD diagnosis using ROC curves. Each curve shows the trade-off between sensitivity (true positive rate) and 1–specificity (false positive rate) across various thresholds. XGBoost and Random Forest models yielded the highest area under the curve (AUC = 0.783), followed closely by Logistic Regression (AUC = 0.782) and Decision Tree (AUC = 0.778). The diagonal dashed line represents the baseline performance of a random classifier (AUC = 0.5).
XGBoost interpretability via SHAP
SHAP analysis (Figure 4) of the XGBoost model confirmed age as the top predictor, followed by UTI, depression, hypothyroidism, and anemia. High-order feature interactions, particularly combinations like UTI plus depression, were shown to drive individualized risk, reinforcing the clinical relevance of comorbidity patterns and the integrity of model predictions.

SHAP summary plot for the XGBoost model predicting AD. This summary plot displays SHAP values quantifying the contribution of each feature to the AD prediction model. Each point represents an individual case; color denotes the magnitude of the feature value (red = high, blue = low), and horizontal position reflects the impact on model output (log-odds of AD). Age was the most influential predictor, followed by urinary tract infection (UTI), depression, hypothyroidism, and anemia. Higher-order interaction terms (e.g., UTI + Depression + Anemia) were also among the top contributors, underscoring the additive risk conveyed by multimorbidity clusters. This plot highlights both the global importance and directional influence of features in the model's decision-making process.
Discussion
Dataset design and validity
In this study, we employed a two-phase strategy to investigate the association between chronic comorbidities and AD using emergency ED data. Our initial analysis drew from a large, nationally representative dataset comprising over 20 million visits. Within this original cohort, AD accounted for just 1.96% of all visits, reflecting its true prevalence in the ED population. However, this substantial class imbalance poses a known challenge for predictive modeling using machine learning techniques. To address both the imbalance and computational demands, we constructed a balanced dataset by matching the number of AD visits with an equal number of non-AD visits. This approach ensured that analyses could be conducted efficiently on standard CPU-based systems without compromising predictive performance or clinical representativeness.
To address this, we constructed a balanced dataset by matching the number of AD visits with an equal number of non-AD visits. While this artificial balancing does not reflect the actual prevalence of AD, we verified the representativeness and utility of the dataset by comparing it against the original population. Specifically, we found that the age-based distribution of AD cases remained highly consistent between the two datasets (Table 4), and the prevalence of major comorbidities in both AD and non-AD groups was similarly preserved (Tables 1 and 2). These validations support the methodological soundness of the balanced dataset for examining comorbidity patterns and for training machine learning models to predict AD risk.
Age-Specific AD prevalence in both datasets.

Clinical interpretation and significance
In this study of nearly 550,000 older adult ED visits, we demonstrated that specific comorbidity clusters, especially UTI, depression, hypothyroidism, and anemia, were each independently associated with AD, with odds ratios ranging from 1.57 to 2.74 (for anemia and UTI, respectively) after adjusting for chronic conditions, age, and sex. Notably, UTI emerged as the most potent predictor, potentially reflecting systemic inflammation or acute-on-chronic cognitive vulnerability triggered by infection. 24
Multimorbidity compounded this risk. Patients with all four red-flag conditions exhibited a 3.3-fold increase in AD diagnosis likelihood, even after adjusting for demographic variables. This cumulative effect was further confirmed in dose-response analyses: each additional index condition conferred a 73% increase in the odds of AD. These results reinforce the hypothesis that the total burden of systemic physiological stress plays a key role in cognitive decline. 36 Conditions such as depression and hypothyroidism, both linked to neurotransmitter imbalance and hippocampal dysfunction, may exacerbate the effects of infections or hematologic insufficiency on brain health.22,37 Likewise, anemia, through chronic hypoxia, may render the aging brain more vulnerable to neurodegenerative cascades. 38
Sex-stratified analyses revealed a subtle but statistically significant interaction effect, wherein multimorbidity was slightly less predictive of AD among females. While the effect size was small (interaction OR = 0.92), this may reflect differences in resilience, hormonal influences, or diagnostic bias between men and women. Nonetheless, the overall predictive utility of comorbidity clusters remained robust across sexes, suggesting that the identified patterns are broadly generalizable.
These associations are biologically plausible. UTIs are well known to precipitate delirium and transient cognitive changes, particularly in elderly patients, and may indicate broader immune system dysfunction.25,39,40 Depression is both a prodromal symptom and a potential risk factor for dementia, with shared pathophysiological pathways including HPA axis dysregulation and reduced neurotrophic support.25,41 Hypothyroidism, if untreated, leads to metabolic slowing and can mimic early dementia symptoms, 42 while anemia compromises oxygen delivery to critical brain regions. The co-occurrence of these conditions likely reflects overlapping risk mechanisms that, when combined, heighten neurocognitive susceptibility.
By introducing finer age stratification (60–65 reference) alongside comorbidity count and sex, Model 10 reaffirmed known age-related AD risk: compared to ages 60–65, AD odds rose progressively, from 2.6-fold in ages 66–70 to 25.8-fold in ages 86–90. Crucially, even after controlling for both age and sex, each additional core comorbidity increased AD odds by 74%. This joint modeling furthers our understanding by quantifying the independent and cumulative impact of multimorbidity across aging cohorts. Clinically, this enables more precise risk stratification, highlighting that older adults with multiple red-flag conditions are significantly more likely to have AD, independent of their age.
Integration of machine learning approaches
To evaluate the predictive potential of these clinical patterns, we trained four supervised learning models using demographic and diagnostic variables. All models demonstrated moderate to strong performance in classifying AD status, with area under the curve (AUC) values ranging from 0.777 to 0.782. Among them, the XGBoost classifier achieved the highest performance, with a recall of 0.821 and F1 score of 0.744, suggesting its utility for high-sensitivity identification of at-risk individuals.
The consistency of model performance, across logistic regression, decision tree, random forest, and XGBoost, validates the predictive signal embedded in routine clinical data. While logistic regression offered strong interpretability and remains valuable for clinical deployment, tree-based models excelled in capturing nonlinear interactions among comorbidities and demographic variables. The superior recall of XGBoost, in particular, positions it as a viable tool for risk screening in high-volume settings such as emergency departments.
To enhance transparency and interpretability, we applied SHAP analysis to the XGBoost model. SHAP analysis revealed that age was the most influential predictor of AD risk, followed by UTI, depression, hypothyroidism, and anemia. These results aligned with our regression findings and provided case-level insight into how individual features shaped risk predictions. SHAP also demonstrated that while individual conditions carried the greatest weight, comorbidity interaction terms, such as the co-presence of UTI and depression, also meaningfully contributed to risk assessment in certain subgroups.43,44 This level of interpretability is essential for translating machine learning findings into actionable clinical practice.
Implications for clinical practice
These findings have immediate implications for improving cognitive risk identification in older adults. Emergency departments and primary care settings, which often lack the resources for comprehensive cognitive evaluations, may benefit from the integration of comorbidity-based risk flags into their electronic health record (EHR) systems. A patient presenting with UTI, anemia, and depression, particularly if over the age of 75, should be viewed as having a significantly elevated risk for underlying or impending cognitive decline. Such identification does not imply diagnosis, but rather prioritization for further assessment, monitoring, or referral to memory care specialists.
In high-throughput clinical environments, automated triage tools leveraging logistic or XGBoost models could help flag high-risk patients using only age, sex, and diagnostic codes. These models, while not a substitute for diagnostic confirmation, can offer real-time risk estimation that supports early detection efforts, particularly in systems strained by workforce shortages or lacking geriatric expertise. Moreover, these tools can support population health initiatives, helping to stratify older adults by cognitive risk and direct preventive interventions where they are most needed.
The identification of syndromic comorbidity clusters also opens the door for clinical awareness and earlier patient education. Clinicians can be trained to recognize combinations of common conditions, especially the red-flag quartet identified here, as potential precursors to cognitive symptoms. This can facilitate proactive planning, earlier lifestyle interventions, or timely engagement with cognitive health services.
Limitations
Several limitations warrant consideration. First, the cross-sectional nature of our data precludes inference about causality or temporal sequencing. Although our findings suggest that specific comorbidities are associated with increased odds of AD, we cannot determine whether these conditions preceded, co-occurred with, or resulted from the neurodegenerative process. Prospective studies are needed to clarify directionality and mediation pathways.
Second, while we adjusted for key demographic variables, our dataset lacked information on important confounders such as APOE genotype, educational attainment, physical activity, or medication use, all of which may influence both comorbidity profiles and cognitive outcomes. The absence of biomarker data or formal neuropsychological testing also limits the diagnostic precision of AD coding within administrative datasets.
Third, while our models demonstrated strong internal validity, they have not yet been externally validated in other populations or clinical contexts. Additionally, our reliance on ICD-9-CM codes may have introduced misclassification bias due to undercoding or variation in diagnostic practices. Future research using ICD-10 or SNOMED-coded EHR systems may enhance generalizability and granularity.
Finally, although SHAP analysis improved interpretability, the implementation of machine learning models in real-world settings will require significant workflow integration, clinician buy-in, and regulatory oversight to ensure ethical and equitable use.
Future directions
This study highlights the need for prospective validation of multimorbidity-based risk scores in predicting incident AD and tracking progression over time. Longitudinal cohort studies enriched with cognitive assessments, neuroimaging, and biomarker data would allow for more precise modeling of temporal and causal relationships. Future research should also evaluate whether management of these comorbid conditions, such as aggressive treatment of hypothyroidism or structured follow-up for UTI, can modify cognitive trajectories or delay disease onset.
On the implementation front, studies exploring the feasibility, usability, and impact of integrating machine learning risk scores into EHR systems are critical. These tools must be tested in diverse clinical settings, with attention to disparities in access, data quality, and trust among patients and providers. Further exploration into sex- and age-specific patterns of multimorbidity may also yield refined, subgroup-targeted models with improved accuracy.
From a health systems perspective, our findings support the development of scalable cognitive risk surveillance programs that leverage existing administrative data. Such programs could facilitate early detection, resource allocation, and public health planning in the face of a rapidly aging population.
Conclusion
In summary, our analysis of over half a million older adult ED visits demonstrates that common clinical conditions, UTI, depression, hypothyroidism, and anemia, are independently and cumulatively associated with increased odds of AD diagnosis. These red-flag comorbidities, particularly when present in combination, confer meaningful risk that can be detected using routine clinical data. Predictive models, including interpretable machine learning algorithms such as XGBoost, show promise in identifying high-risk individuals with moderate to high sensitivity. While these models are not diagnostic, they offer valuable tools for scalable, early risk stratification and may support more proactive, personalized approaches to cognitive health in aging populations. Our findings underscore the importance of multimorbidity not just as a clinical burden, but as a window into latent neurocognitive vulnerability that warrants closer clinical attention.
Supplemental Material
sj-docx-1-alr-10.1177_25424823251392474 - Supplemental material for Red-flagging multimorbidity clusters for Alzheimer's disease risk using explainable machine learning: Evidence from a national emergency department sample
Supplemental material, sj-docx-1-alr-10.1177_25424823251392474 for Red-flagging multimorbidity clusters for Alzheimer's disease risk using explainable machine learning: Evidence from a national emergency department sample by Tursun Alkam, Ebrahim Tarshizi and Andrew H Van Benschoten in Journal of Alzheimer's Disease Reports
Footnotes
Acknowledgements
The authors would like to thank the Healthcare Cost and Utilization Project (HCUP) for providing access to the Nationwide Emergency Department Sample (NEDS) database.
Ethical considerations
This study used publicly available, de-identified data from the Nationwide Emergency Department Sample (NEDS) database managed by the Healthcare Cost and Utilization Project (HCUP) and did not involve direct human subject research. As such, it was deemed exempt from institutional review board (IRB) approval.
Consent to participate
Not applicable
Consent for publication
Not applicable
Author contribution(s)
Funding
This research received no specific grant from any funding agency in the public, commercial, or not-for-profit sectors.
Declaration of conflicting interests
The authors declared no potential conflicts of interest with respect to the research, authorship, and/or publication of this article.
Data availability statement
The data used in this study are available from the Healthcare Cost and Utilization Project (HCUP) Nationwide Emergency Department Sample (NEDS) database. Restrictions apply to the availability of these data, which were used under license for the current study and are not publicly available. The machine learning code and preprocessed feature sets used for analysis are available upon request.
Supplemental material
Supplemental material for this article is available online.
References
Supplementary Material
Please find the following supplemental material available below.
For Open Access articles published under a Creative Commons License, all supplemental material carries the same license as the article it is associated with.
For non-Open Access articles published, all supplemental material carries a non-exclusive license, and permission requests for re-use of supplemental material or any part of supplemental material shall be sent directly to the copyright owner as specified in the copyright notice associated with the article.