
Abstract
Background
Previous observational studies have suggested a potential association between amyloid marker levels and the risk of developing cerebral small vessel disease (CSVD), but this relationship remains incompletely understood.
Objective
This study was conducted to assess the impact of amyloid marker levels on the risk of developing CSVD via Mendelian randomization (MR) design.
Methods
Using the latest genome-wide association study summary statistics for 5 plasma amyloid markers and 4 CSVD traits, a two-sample MR study was conducted to assess the genetic relationship between amyloid marker levels and CSVD risk. Furthermore, reverse MR analysis was utilized to establish the causal relationship between CSVD traits and the levels of the identified plasma amyloid markers to explore potential bidirectional causality.
Results
After FDR correction, greater amyloid-β (Aβ) 42 levels were associated with an increased risk of developing lobar cerebral microbleeds (CMBs) (odds ratio = 2.311, 95% confidence interval 1.403–3.809, p = 0.001, p FDR = 0.040). Potential positive correlations were detected between Aβ40 levels and the risk of developing intracerebral hemorrhage, between Aβ42 levels and the risk of developing all CMBs, and between serum amyloid P component levels and white matter fractional anisotropy status. In reverse MR analysis, no effect of CSVD traits on amyloid marker levels was detected.
Conclusions
Our study suggests potential causal relationships between amyloid marker levels and different CSVD traits. Our results contribute to a greater understanding of the pathophysiology of CSVD, particularly in relation to amyloid deposition.
Keywords
Introduction
Cerebral small vessel disease (CSVD) is a series of clinical, imaging and pathologic syndromes caused by lesions in intracranial small arteries, arterioles, capillaries, venules, and small veins. 1 Clinical manifestations include both acute manifestations of small vessel stroke (SVS) and intracerebral hemorrhaged (ICH) and chronic manifestations of cognitive, motor, affective, and diaphoretic disorders. 2 Imaging features commonly associated with CSVD include white matter hyperintensities (WMHs) and cerebral microbleeds (CMBs). 3 Epidemiological studies indicate that CSVD has imposed a significant health burden, particularly in low- and middle-income countries, in recent years. 4 Despite its prevalence, the pathophysiologic cause of CSVD is currently unknown. Hypertension and amyloid deposition are thought to be the main causes.5–8
The amyloid deposition hypothesis has gained increasing attention in CSVD research. 4 Amyloid-β protein precursor protein (AβPP) is hydrolyzed to amyloid-β (Aβ) by β- and γ-secretase enzymes. Then, Aβ combines with serum amyloid P component (SAP) to form amyloid plaques. Ultimately, it is deposited in small- and medium-sized arteries, causing a series of pathophysiological changes.9–12 Traditional methods for detecting amyloid include autopsy, positron emission tomography (PET), and cerebrospinal fluid (CSF) analysis. 13 However, owing to the high cost of PET and the invasive nature of CSF collection, plasma amyloid testing has become a more attractive method of mass screening. 14 Several studies have shown a role for plasma Aβ in CSVD. However, the results of previous observational studies are conflicting. Some research has shown increased plasma Aβ levels in patients with CSVD compared with those in normal control participants.15–21 Other studies have reported no significant differences in plasma Aβ levels among patients with CSVD. 22 Reverse causality interference, confounding variables, and varying sample sizes could be the causes of these contradictory results. Importantly, these studies do not clarify whether plasma amyloid is a cause or a consequence of CSVD development.
Randomized controlled trials (RCTs) have the potential to address the drawbacks of observational research. However, RCTs have high economic and time costs and may not be conducted strictly. Mendelian randomization (MR) can be used to establish a relationship between exposure and outcome by using genetic variants as instrumental variables (IVs). 23 Since genetic alleles are randomly assigned during conception, the confounding bias and reverse causal associations present in observational studies are avoided. 24 Therefore, MR enables investigators to draw conclusions about causality, particularly when RCTs are not possible.
To investigate the relationships between plasma amyloid marker levels (AβPP, amyloid precursor-like protein 2 (APLP2), SAP, and Aβ peptide levels) and CSVD traits (ICH, SVS, CMBs, and WMH), we performed a two-sample MR study. The most recent and extensive genome-wide association study (GWAS) datasets were utilized in our analysis. It is worth emphasizing that biomarkers for CSVD encompass multiple domains including imaging, body fluids, and genetics. 25 This study aims to investigate the causal relationship between amyloid deposition and CSVD, thus focusing on the amyloid pathway. Furthermore, limiting the analysis to biologically coherent amyloid pathways helps ensure the robustness of causal inference and enhances the clarity of mechanistic explanations.
Methods
Data source
Genetic predictors of APP, APLP2, and SAP were derived from a recent human plasma proteomic GWAS, which included data on more than 3600 proteins from 3301 individuals of European ancestry from the INTERVAL study. The mean age of the study population was 43.7 years, and 51.1% of the participants were male. Genotyping and genotype imputation were performed in this study, and plasma protein levels were quantitatively measured using the SOMAscan platform. Genome-wide association analyses were then conducted to identify genetic variants associated with protein levels. 26 To ensure the reliability of results, we supplemented genetic variants for APP and APLP from the most recently published databases. Genetic predictors were derived from a large-scale GWAS of human plasma proteomics, which included data from 35,559 Icelandic participants. The study population had a mean age of 55 years (standard deviation = 17 years), with 57% being female. Plasma protein levels were quantified using the SomaScan 4.0 platform. A GWAS was then conducted to examine associations between 27.2 million sequence variants and plasma protein levels, ultimately identifying protein-associated quantitative trait loci (PQTLs) where sequence variants showed significant correlations with protein levels. 27 The three-city (3C) study, Rotterdam study, Pittsburgh Cardiovascular Health Study–Cognition Study (CHS-CS), and Alzheimer's Disease Neuroimaging Initiative (ADNI) study, which included a total of 3528 healthy people of European descent with a mean age of 71.5 years and a male proportion of 59.8%, provided genetic predictors of plasma Aβ40 and Aβ42 levels. These predictors were derived through a standardized genotyping and imputation pipeline, harmonized Aβ quantification procedures, and fixed-effects meta-analysis, resulting in robust genetic instruments 28 (Figure 1A).
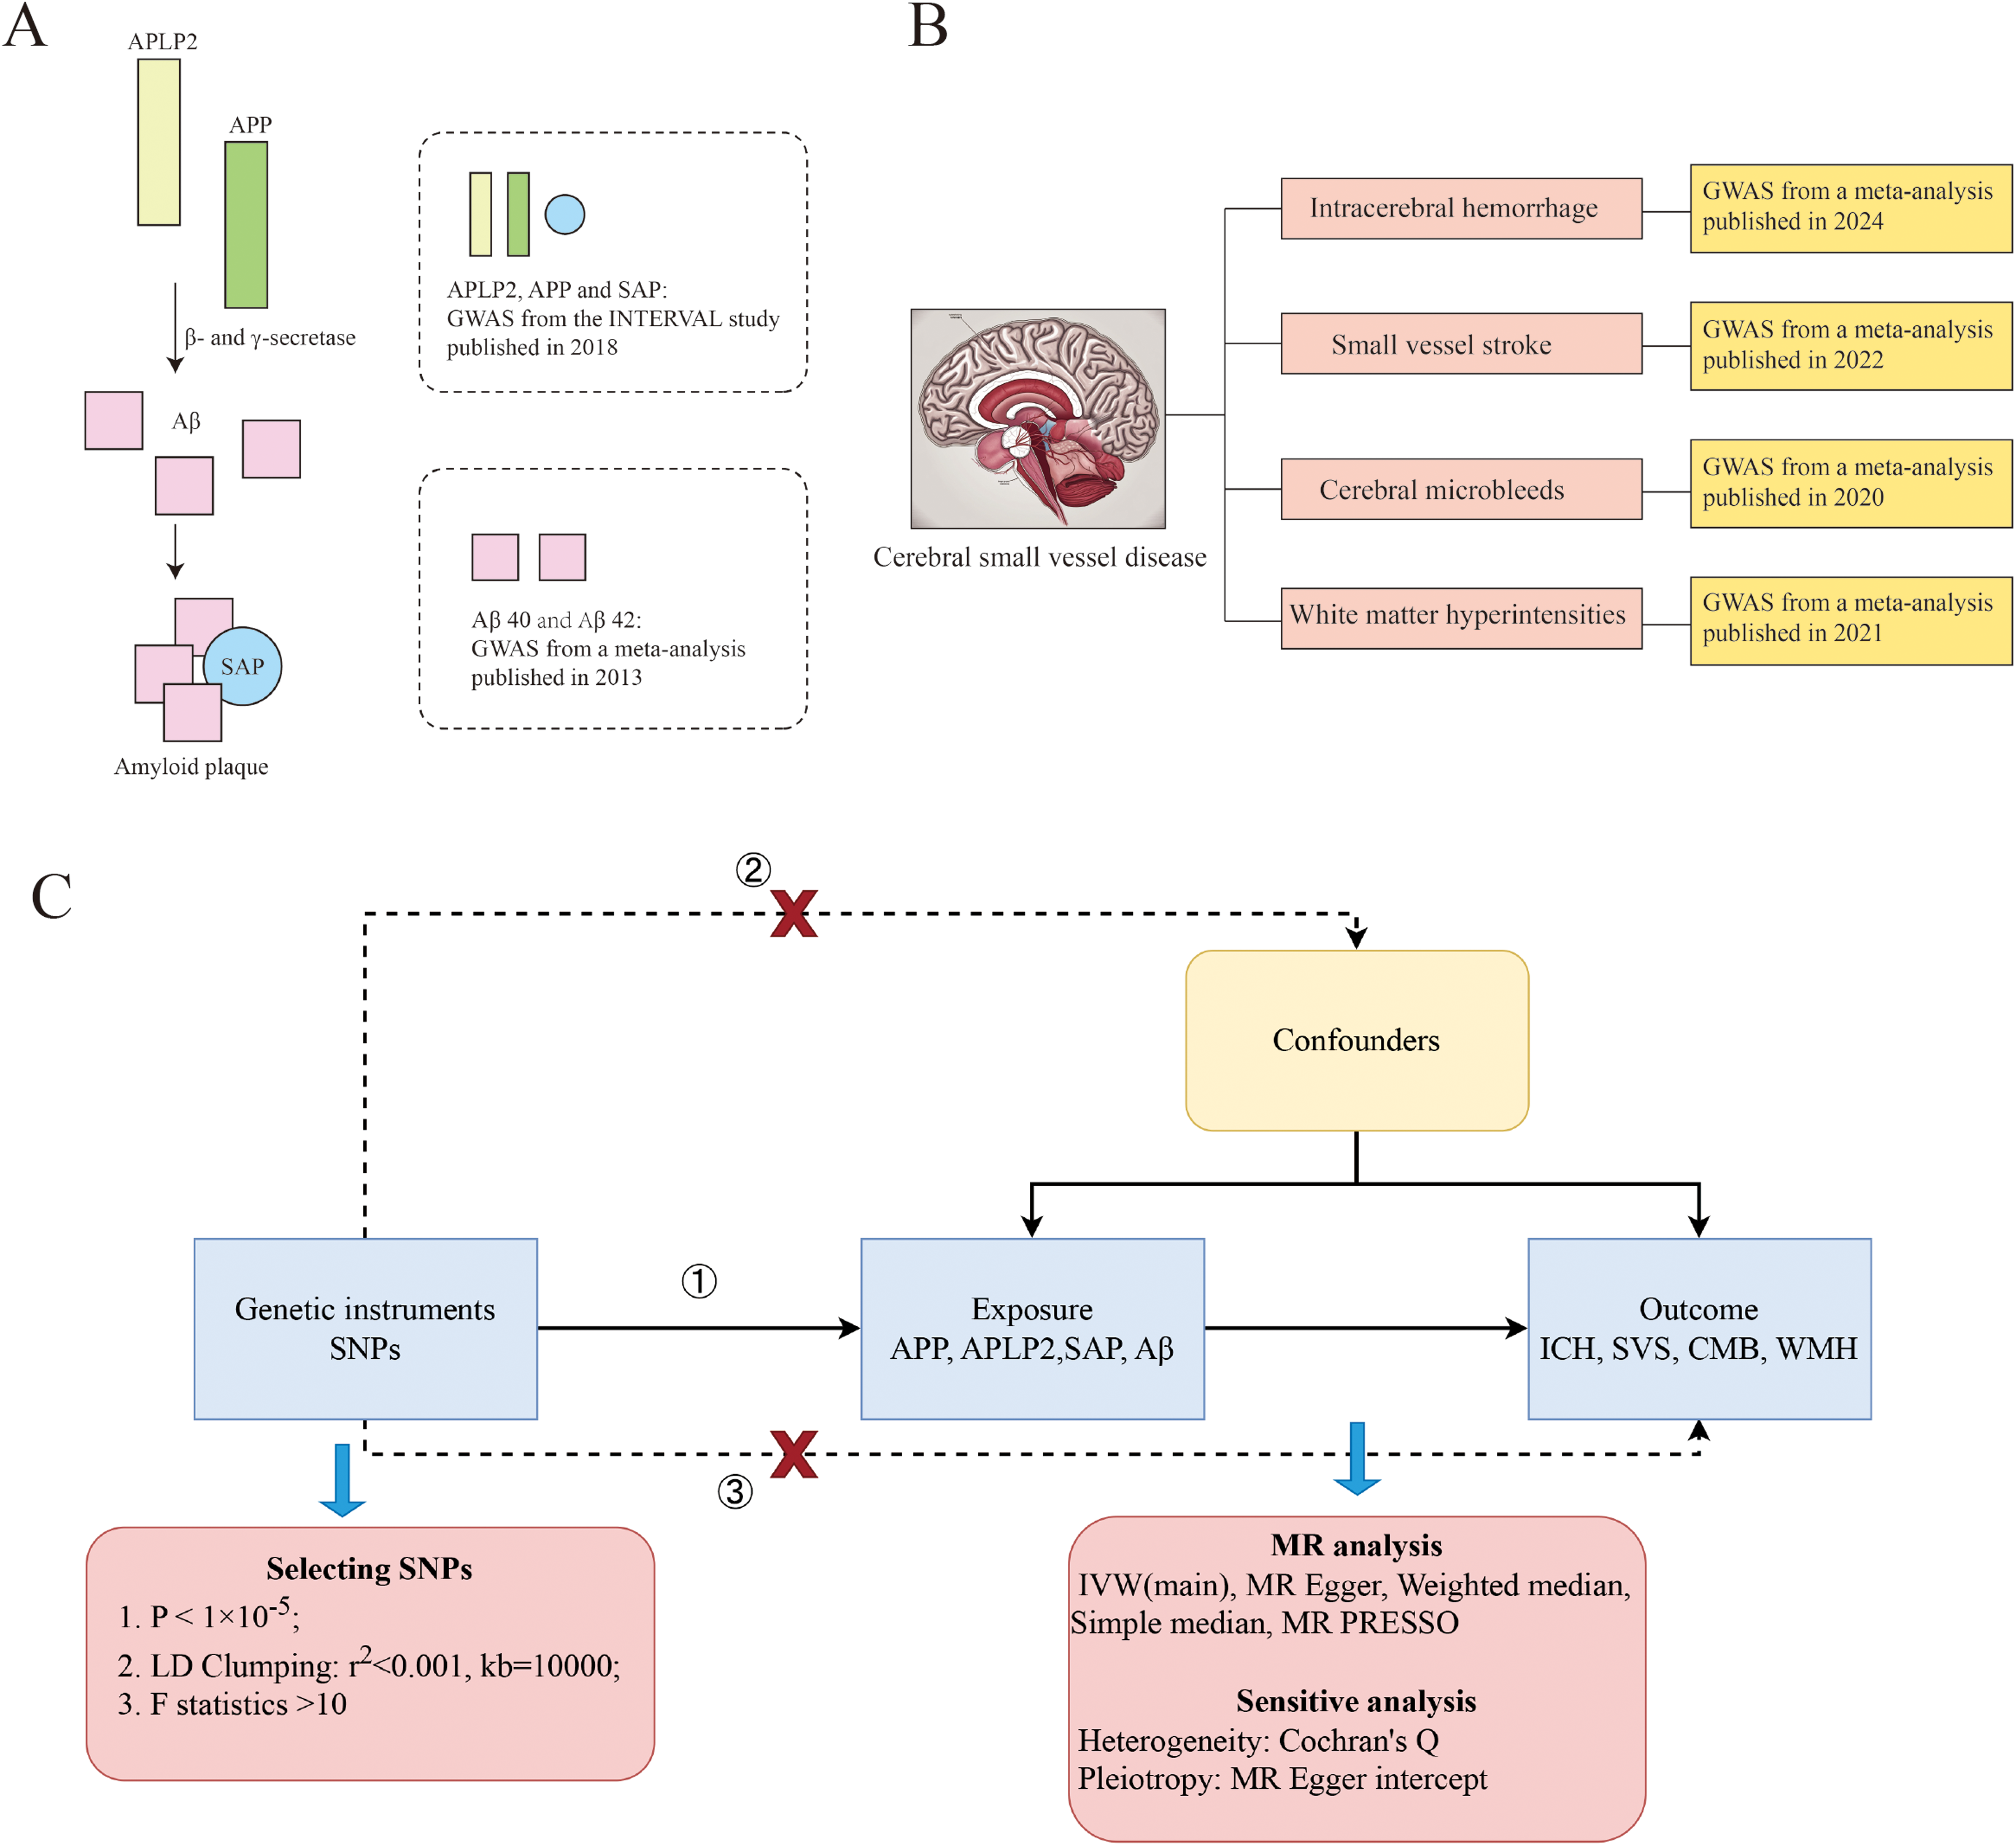
Overview of the study design. (A) Description of the amyloid markers used for exposure. (B) Description of the cerebral small-vessel disease traits used as outcomes. (C) MR framework. APLP2: amyloid precursor-like protein 2; APP: amyloid-β protein precursor; Aβ: amyloid-β; SAP: serum amyloid P component; GWAS: genome-wide association study; SNP: single-nucleotide polymorphism; ICH: intracerebral hemorrhage; SVS: small vessel stroke; CMB: cerebral microbleeds; WMH: white matter hyperintensities; IVW: inverse-variance weighting; MR: Mendelian randomization.
The CSVD data included genetic variants associated with ICH, SVS CMBs, and WMH. The GWAS data from three European biobanks, which included data from 711,818 normal control participants and 7605 ICH patients, were meta-analyzed to produce the ICH data. The ICH phenotype was defined by clinical diagnosis and confirmed by acute neuroimaging, with secondary hemorrhages excluded. Genotypes were obtained through SNP arrays, imputed, and rigorously quality-controlled. Within each cohort, association analyses were conducted using logistic regression or mixed models, and results were subsequently combined via fixed-effects meta-analysis. 29 The SVS data were derived from a meta-analysis published by the GIGASTROKE consortium. SVS was discovered in 13,620 of the 1,241,619 participants. For SVS, each study applied standardized case definitions and quality control procedures. After performing GWAS, robust genetic loci were identified through meta-analysis and cross-population validation. 30 Eleven population-based cohort studies and three case‒control or case‒only stroke cohorts that were included in a GWAS provided the data for CMB. Among the 24,354 individuals, 3172 had CMBs: 1932 were lobar, and 1240 were deep. Phenotypes were determined using MRI GRE/SWI sequences, distinguishing lobar and deep CMB types. Genotype data were processed through arrays, imputation, and quality control, and association analyses followed by meta-analysis revealed significant signals in the APOE region. 31 GWAS WMH data were obtained from the UK Biobank, the Cohorts for Heart and Ageing Research in Genomic Epidemiology (CHARGE) consortium, and a meta-analysis of WMH studies in stroke patients, including 42310 individuals. GWAS data on the mean diffusivity (MD) and mean fractional anisotropy (FA) of 21 main white matter bundles were utilized to indicate the integrity of the microstructure of white matter. Phenotypes were uniformly extracted and quality-controlled following the ENIGMA-DTI protocol, and robust genetic loci were ultimately identified through meta-analysis 32 (Figure 1B, Supplemental Table 1).
Selection of genetic predictors
Single-nucleotide polymorphisms (SNPs) that met the genome-wide significance threshold of p < 1× 10⁻⁵ were selected as potential IVs. We tested their independence by performing a linkage disequilibrium (LD) analysis (r2 < 0.001, window size = 10,000 kb). Furthermore, the strength of each SNP was evaluated via the F statistic. When the F statistic is greater than 10, the likelihood of weak tool bias is reduced. 33 F = beta2/SE2 was the formula used to determine the F statistic for each variant. 34 The characteristics of the IVs are summarized in Supplemental Table 2. In addition, to increase the strength of the instrumental variables, we further selected SNPs reaching the genome-wide significance threshold (p < 5 × 10⁻⁸) for analysis. When only one SNP was available under this stricter threshold, the Wald ratio method was applied.
Study design
We used a bidirectional two-sample MR study to analyze causal relationships between amyloid markers and CSVD and vice versa. MR analyses must satisfy the following 3 hypotheses. Hypothesis 1: There is a significant association between IVs and exposure factors. Hypothesis 2: There are no associations between IVs and any confounders affecting outcome and exposure. Hypothesis 3: Exposure is the only route by which IVs affect outcome. 35 (Figure 1C) This study was conducted in adherence to the STROBE-MR guidelines as shown in Supplemental Material.
MR analysis
The principles and methods of MR have been described in previous studies.36–38 In the present study, the main method used to analyze causality was the inverse-variance weighting (IVW) method. Simple median, weighted median, MR‒Egger, and pleiotropy residual sum and outlier (MR–PRESSO) were used as complementary methods.39–41 We tested for heterogeneity via Cochran's Q test. 42 For exposures where there was heterogeneity, we used a random-effects IVW model; otherwise, we used a fixed-effects IVW model. The MR–PRESSO and MR‒Egger intercepts were used to detect and assess horizontal pleiotropic outliers. The impact of each individual SNP on overall causation was independently evaluated via the leave-one-out (LOO) approach.
To conduct our analyses, we used the “TwoSampleMR” package in R version 4.0.3. p < 0.05 was considered to indicate statistical significance. We corrected the p values using the false discovery rate (FDR).
Results
Associations of plasma aβPP, APLP2, SAP, and Aβ peptide levels with the risk of developing CSVD
Before performing all analyses, we detected heterogeneity in the IV effects of plasma Aβ42 with ICH, all CMBs, deep CMBs, WMH and WM MD (ICH: Cochran's Q = 54.240, p < 0.001; all CMBs: Cochran's Q = 27.489, p < 0.001; deep CMBs: Cochran's Q = 14.229, p = 0.02; WMH: Cochran's Q = 43.391, p = 0.001; WM MD: Cochran's Q = 30.246, p = 0.035), AβPP and WM FA (Cochran's Q = 34.119, p = 0.048), and SAP and WM MD (Cochran's Q = 26.298, p = 0.035) (Table 1). Therefore, for those analyses, we used the random-effects IVW model. The other analyses yielded no heterogeneity and were thus assessed via fixed-effects IVW models.
Summary of the additional MR analysis for the effect of amyloid marker levels on the risk of developing CSVD.

APP: amyloid-β protein precursor; APLP2: amyloid precursor-like protein 2; SAP: serum amyloid P component; Aβ: amyloid beta; ICH: intracerebral hemorrhage; SVS: small vessel stroke; CMB: cerebral microbleeds; WMH: white matter hyperintensities; FA: fractional anisotropy; MD: mean diffusivity
High plasma Aβ42 levels predicted by genetics were associated with a greater risk of developing lobar CMBs (IVW odds ratio (OR) = 2.311, 95% confidence interval (CI) 1.403–3.809, p = 0.001) (Figure 2). This result remained stable after FDR correction (p = 0.040). All sensitivity analyses yielded consistent results (weighted median, OR = 2.005, 95% CI 1.093–3.677, p = 0.025; MR–Egger, OR = 5.953, 95% CI 1.719–20.620, p = 0.037; simple median: OR = 1.941, 95% CI 1.027–3.666, p = 0.041; MR–PRESSO: p = 0.017) (Figure 3A). The heterogeneity test revealed no significant heterogeneity among the SNPs (Cochran's Q = 10.844, p = 0.093). The MR–PRESSO method showed no outliers in the IVs. The MR–Egger intercept (−0.095, p = 0.171) showed no evidence of directional pleiotropy, suggesting that the results are robust (Supplemental Table 3).

Causal effects of amyloid marker levels on the risk of developing CSVD identified via inverse-variance weighting. The red dots represent the OR value, and the straight line represents the 95% CI. SNP: single-nucleotide polymorphism; OR: odds ratio; 95% CI, 95% confidence interval; FDR: false discovery rate; APLP2: amyloid precursor-like protein 2; APP: amyloid-β protein precursor; Aβ: amyloid-β; SAP: serum amyloid P component; ICH: intracerebral hemorrhage; SVS: small vessel stroke; CMB: cerebral microbleeds; WMH: white matter hyperintensities; FA: fractional anisotropy; MD: mean diffusivity.

Scatterplot of the effects of amyloid marker levels on the risk of developing cerebral small vessel disease. The slope of each line corresponds to the estimated MR effect of each method. (A) Aβ42 and lobar cerebral microbleeds. (B) Aβ42 and all cerebral microbleeds. (C) Aβ40 and intracerebral hemorrhage. (D) Serum amyloid P component and white matter fractional anisotropy. IVW: inverse-variance weighting; MR: Mendelian randomization.
According to our findings, genetically predicted increased plasma Aβ42 levels were associated with an increased risk of developing all CMBs (IVW, OR = 1.920, 95% CI 1.096–3.362, p = 0.023) (Figure 2), and sensitivity analyses yielded directionally consistent results (Figure 3B). There was no multiplicity of IVs (MR–Egger's intercept = 0.046, p = 0.574), and the MR–PRESSO analysis revealed no outliers (Supplemental Table 3).
There was a potential positive correlation between genetically predicted increased plasma Aβ40 levels and the risk of developing ICH. The IVW analysis revealed that for every one-unit increase in genetically predicted Aβ40, there was a 4% greater probability of ICH occurrence (OR = 1.040, 95% CI 1.003–1.079, p = 0.032) (Figure 2). However, the sensitivity analyses performed via MR–PRESSO yielded significantly different results (p = 0.012). Other sensitivity analyses yielded directionally consistent results (Figure 3C). The MR–Egger intercept did not reveal pleiotropy in the IVs (MR–Egger's intercept = −0.0004, p = 0.949) (Supplemental Table 3).
Genetically predicted increased SAP levels were also a potential risk factor for WM FA (IVW, OR = 1.260, 95% CI 1.075–1.478, p = 0.004) (Figure 2). The MR–PRESSO results were consistent (p = 0.012), and the sensitivity analyses yielded the same trend (Figure 3D). No pleiotropy or heterogeneity was detected (MR–Egger's intercept = 0.004, p = 0.908) (Supplemental Table 3).
In summary, our research indicates that gene-mediated changes in plasma Aβ42, Aβ40, and SAP levels are potential risk factors for CSVD development. However, we do not have sufficient evidence to suggest a causal relationship between plasma AβPP or APLP2 levels and the risk of developing CSVD (Figure 2).
In addition, we further selected instrumental variables using the standard threshold (p < 5 × 10⁻⁸). After FDR correction, genetically predicted higher plasma Aβ42 levels were associated with increased risks of ICH, all CMBs, deep CMBs, lobar CMBs, WMH, and WM MD. No associations were observed between other amyloid markers and CSVD (Supplemental Table 4).
Effects of CSVD status on AβPP, APLP2, SAP, and Aβ peptide levels
Before performing the reverse MR analysis, we also performed a heterogeneity test. We found heterogeneity in the association between all CMBs and SAP levels (Cochran's Q = 40.910, p = 0.023), as well as for the associations of all CMBs, lobar CMBs, and ICH with Aβ42 (all CMBs: Cochran's Q = 70.455, p < 0.001; lobar CMBs: Cochran's Q = 45.951, p < 0.001; ICH: Cochran's Q = 70.704, p < 0.001) (Table 2). Therefore, we used a random-effects IVW model.
Summary of the additional MR analysis for the effect of CSVD traits on amyloid marker levels.

APP: amyloid-β protein precursor; APLP2: amyloid precursor-like protein 2; SAP: serum amyloid P component; Aβ: amyloid-β; ICH: intracerebral hemorrhage; SVS: small vessel stroke; CMB: cerebral microbleeds; WMH: white matter hyperintensities; FA: fractional anisotropy; MD: mean diffusivity
We used reverse MR analysis with CSVD as the exposure and plasma amyloid marker levels as the outcome to investigate the impact of CSVD traits on these factors. Our analysis revealed that the incidence of all CMBs was associated with increased SAP levels (IVW, OR = 1.116, 95% CI 1.021–1.220, p = 0.016) (Figure 4). However, MR–Egger yielded the opposite results (OR = 0.999, 95% CI 0.760–1.315, p = 0.997). The MR‒Egger intercept was not significant (MR–Egger's intercept = 0.024, p = 0.412), indicating that there was no significant pleiotropy (Supplemental Table 5). This relationship needs to be interpreted with caution. Furthermore, there was no evidence in our research that other CSVD traits and amyloid marker levels were causally related.

Causal effects of CSVD traits on amyloid density identified by inverse-variance weighting. The red dots represent the OR value, and the straight line represents the 95% CI. SNP: single-nucleotide polymorphism; OR: odds ratio; 95% CI, 95% confidence interval; FDR: false discovery rate; ICH: intracerebral hemorrhage; SVS: small vessel stroke; CMB: cerebral microbleeds; WMH: white matter hyperintensities; FA: fractional anisotropy; MD mean diffusivity; APLP2: amyloid precursor-like protein 2; APP: amyloid-β protein precursor; Aβ: amyloid-β; SAP: serum amyloid P component.
Similarly, when instrumental variables were further selected using the standard threshold (p < 5 × 10⁻⁸), no available instruments were identified for deep CMBs and lobar CMBs; thus, these traits were not included in the analysis. After FDR correction, the results showed that the occurrence of ICH and all CMBs increased plasma Aβ42 levels (Supplemental Table 6).
Discussion
We examined possible causal links between plasma amyloid marker levels and CSVD traits via two-sample MR analysis of genetic IVs from a large-scale GWAS. We discovered that after FDR correction, genetically predicted increased plasma Aβ42 levels were linked to an increased risk of developing lobar CMBs. In addition, there were potential positive causal associations between Aβ42 and all CMBs, between Aβ40 and ICH, and between SAP and WM FA. In reverse MR analysis, no effect of CSVD traits on amyloid marker levels was detected.
This study revealed a significant and stable positive causal relationship between plasma Aβ42 levels and lobar CMBs. Additionally, there were potential associations between plasma Aβ40 and ICH and between Aβ42 and all CMBs. These results suggest that the plasma Aβ peptide plays a harmful role in hemorrhagic lesions. The relationship between Aβ and lobar CMBs has been extensively studied. The most common cause of lobar hemorrhage in elderly individuals is cerebral amyloid angiopathy (CAA). The pathophysiologic mechanism of CAA is the deposition of Aβ in the leptomeningeal and neocortical vessels, which causes lobar hemorrhages and microbleeds. In contrast, hypertensive angiopathy involves the perforator arteries of deep areas first, which causes deep hemorrhages and microbleeds. 43 However, the relationship between plasma Aβ levels and the risk of developing CSVD is complex and controversial. Therefore, in the present discussion, we focused on 3 aspects: the relationships of plasma Aβ levels with CSVD imaging phenotypes, ICH, and CAA. (1) The Swedish Bio FINDER study revealed that individuals with CMBs presented increased plasma Aβ42/Aβ40 ratios. In addition, one study revealed elevated Aβ40 levels, but not Aβ42 levels, in patients with CMBs. 16 However, elevated plasma Aβ42 was found to be related to new-onset CMBs in a subsequent longitudinal study. 19 Moreover, several studies have demonstrated that plasma Aβ is linked to other CSVD imaging markers, including WMH and lacunar stroke.15,17 (2) The association between Aβ40 and ICH in our investigation are comparable with those of a study that indicated that patients with CAA-associated ICH had higher levels of plasma Aβ42, the Aβ42 truncated segment, and Aβ40 than normal control participants did. 44 Nevertheless, in a different study, there were 42 elderly control subjects, 25 patients with CAA-related bleeding, and 21 patients with bleeding that may have been caused by hypertensive vascular lesions. The investigators did not report any difference in plasma Aβ among the three groups of patients. 22 This may be due to the small sample size and lack of assay sensitivity. (3) Piccarducci et al. included 20 patients with CAA and 20 normal control participants. They reported that patients with CAA had higher plasma Aβ40 levels, which explained their lower plasma Aβ42/40 ratio than that of normal control participants. The inclusion criteria for CAA patients in this study were based on modified Boston criteria, including CMBs or ICH and cortical superficial siderosis. 21 To some extent, these findings are also consistent with our results. However, Chatterjee et al. reported that plasma Aβ40 levels decreased before symptoms were present in patients with Dutch-type hereditary CAA. 45 This inconsistency with our findings could be attributed to differences in the study populations. Hereditary CAA may not be fully representative of sporadic CSVD cases. Previous studies had observational designs and could not assess causality between plasma Aβ peptide levels and the risk of developing CSVD. However, our analysis revealed that plasma Aβ peptides are risk factors for the occurrence of CSVD (including ICH and CMBs, especially lobar CMBs) using the largest plasma Aβ peptide and CSVD-related GWAS database available.
The mechanisms underlying the effects of plasma Aβ peptides on hemorrhagic lesions are not fully clear. First, a potential explanation is that the overproduction of plasma Aβ leads to increased accumulation of Aβ in the cerebral arterial media, weakening the vessel wall and leading to hemorrhage. 46 Second, Aβ may contribute to CAA-associated hemorrhagic lesions not only through direct effects but also by triggering an inflammatory response. Research has shown that amyloids activate perivascular astrocytes and microglia and lead to vascular remodeling, which may be responsible for hemorrhage. 47 Third, previous studies have reported the presence of CMBs in patients with AD, which might be explained by mixed age-related pathologies. 48 Interestingly, in our study, different Aβ peptides were associated with distinct events. Aβ42 was a risk factor for CMBs, whereas Aβ40 was linked to ICH. This may be due to the differing properties of these peptides. Aβ42 is less soluble and forms fibrils faster, 49 so it is more likely to accumulate in capillaries, thereby leading to microbleeds. In contrast, Aβ40 is more soluble, allowing it to diffuse during vascular drainage and deposit in vessel walls, which may lead to ICH. 11 Further experimental studies are needed to confirm these underlying mechanisms.
Our study suggests that SAP levels are positively correlated with the incidence of WM FA. SAP is synthesized mainly by hepatocytes, is released into the bloodstream, and can enter the brain through the compromised blood‒brain barrier. Once in the brain, SAP binds to amyloidogenic fibrils composed of Aβ, preventing their hydrolysis and promoting the formation of amyloid plaques.12,50 However, previous research on SAP and CSVD is limited. Proteomic analyses have shown increased SAP levels in brain tissues from autopsies of patients with CAA. 51 In contrast, no significant changes in serum SAP levels were observed in patients with cerebral autosomal dominant arteriopathy with subcortical infarcts and leukoencephalopathy (CADASIL). 52 Moreover, the relationship between plasma SAP and AD has been extensively studied. AD and CSVD share commonalities in the amyloidogenic pathways underlying their pathophysiology. 53 Elevated SAP levels have been observed in patients with dementia. 54 Additionally, a recently published MR investigation revealed that plasma SAP is a risk factor for the development of AD. 55 These results are consistent with the results of our study. To better understand the connection between SAP and the emergence of CSVD, more research is necessary, as the mechanisms behind these two phenomena have not been thoroughly examined.
In this study, we did not find an association between AβPP or APLP2 levels and CSVD traits. Both AβPP and APLP2 are single-pass transmembrane proteins. In vivo, they can be catabolized into Aβ by γ-secretase, which is a rapid and highly complex process. 56 Previous animal and human studies have shown that mutations in the APP gene are associated with the clinical and imaging manifestations of CSVD.57,58 The relationship between circulating AβPP and CSVD has not been reported. Interestingly, platelet AβPP has been identified as a diagnostic marker for AD. 59 The fact that circulating AβPP is present primarily in platelets (>95%) and that plasma free AβPP may not adequately reflect levels in the peripheral circulation could be the reason for the lack of relationship in our investigation. Further investigations into the relationship between platelet AβPP and CSVD are needed to clarify this potential association.
It is important to note that CSVD and AD exhibit multidimensional, complex interactions at the pathophysiological level. One shared feature is Aβ deposition. When Aβ accumulates in the vascular wall, it can lead to the development of CSVD; conversely, its deposition in brain parenchyma forms the characteristic plaques of AD. Imaging studies reveal that WMH and CMBs are common manifestations in both diseases. Genetic factors such as APOE ε4 can increase the risk of both CSVD and AD.11,60 Mendelian randomization analysis in this study further supports the possibility that the two disorders share amyloid-related pathways. Nevertheless, CSVD and AD exhibit distinct differences in anatomical distribution, biomarker characteristics, and clinical presentation. CSVD predominantly affects cortical and meningeal arterioles, often manifesting as lobar hemorrhages, lobar microbleeds, and superficial cortical iron deposition. In contrast, AD is primarily characterized by parenchymal Aβ deposition, accompanied by diffuse plaque formation and early hippocampal atrophy. Clinically, early AD symptoms predominantly involve memory impairment, whereas CSVD more commonly manifests as stroke, cerebral hemorrhage, or vascular injury ultimately leading to cognitive decline. 61 It is crucial to emphasize that mixed pathology often coexists in the early stages of both conditions, making accurate differentiation based on a single indicator challenging. Only through longitudinal dynamic assessment integrating imaging, CSF biomarkers, and clinical manifestations can precise differentiation be achieved. Therefore, multimodal longitudinal studies will become a key direction for elucidating the interrelationships and underlying mechanisms of these two conditions in the future.
Age is a key factor influencing amyloid levels and CSVD risk. While CSVD-related GWAS data did not provide detailed age information, we systematically reviewed the sources and cohort characteristics of the data used. The ICH GWAS drew from case-control studies or biobanks involving adult and elderly populations. 29 The SVS GWAS enrolled stroke patients or high-risk individuals, with peak incidence occurring primarily in those over 60 years of age. 30 CMBs GWAS included cohorts such as CHARGE, UK Biobank, and the Rotterdam Study, with average ages predominantly above 55 years. 31 WMH GWAS samples primarily originated from UK Biobank. Although some analyses integrated pediatric/adolescent cohorts, these constituted a small proportion of the sample size and did not influence the main findings. In summary, existing evidence indicates that the CSVD GWAS data used in this study predominantly represent middle-aged and elderly populations. Furthermore, all original studies adjusted for age as a covariate in their statistical models. Consequently, genetic causal inference is minimally affected by age-related systematic biases.
In the present study, we greatly reduced the interference of confounders and reverse causality by using an MR design. In addition, we used multiple methods to validate the accuracy of our findings and ensure robust effect estimation (F > 10) for each IV. Importantly, we used a large sample size of GWAS data, enhancing the reliability of the results. To our knowledge, this study is the first to elucidate the causal relationship between plasma amyloid marker levels and CSVD traits from a genetic perspective. This study enhances our understanding of the pathophysiologic mechanisms of CSVD, especially amyloid deposition, and offers potential targets for treatment. The findings of this study hold multifaceted potential clinical applications. First, plasma amyloid biomarker levels, particularly plasma Aβ, can serve as risk stratification indicators to help identify individuals with higher genetic risk. Second, they may be utilized in future clinical trials for screening or stratified enrollment to evaluate the efficacy of anti-amyloid or related pathway drugs in CSVD. Finally, the combined dynamic monitoring of plasma amyloid biomarkers and MRI imaging may facilitate the early detection of microbleed progression, thereby providing a basis for personalized interventions.
This study has several limitations. The p value cut-off for SNP selection was set at 1 × 10⁻⁵, which may have resulted in weak IV bias. This may have affected the results. Furthermore, our results are mainly based on data from a European population and therefore may not be generalizable to other populations. In addition, the ICH GWAS database we used was not separated into lobar and nonlobar hemorrhages according to the site of hemorrhage, so we could not analyze the relationship between Aβ levels and the risk of developing cerebral hemorrhage at different sites (implying different etiologies). Finally, GWASs using ICH, SVS, CMBs, and WMH genetic variants may not fully capture the overall status of CSVD. Since the GWAS exposure identified only one eligible instrumental variable under strict significance thresholds (p < 5 × 10⁻⁸), the MR estimates in this study essentially correspond to Wald ratio estimates. Although the results demonstrate statistical significance, their causal inferential power is limited due to the inability to test for pleiotropy and heterogeneity. These findings should be interpreted with caution, and future validation using larger samples or more lenient thresholds is recommended.
In conclusion, our study provides suggestive evidence that plasma amyloid marker levels may increase the risk of developing CSVD. Future RCTs are necessary to validate these findings. Our results contribute to a greater understanding of the pathophysiology of CSVD, particularly in relation to amyloid deposition, and offer insights into potential biomarkers and therapeutic targets.
Supplemental Material
sj-docx-1-alr-10.1177_25424823251403565 - Supplemental material for Amyloid marker levels and the risk of developing cerebral small vessel disease: A Mendelian randomization study
Supplemental material, sj-docx-1-alr-10.1177_25424823251403565 for Amyloid marker levels and the risk of developing cerebral small vessel disease: A Mendelian randomization study by Zhuoya Wang, Kailin Xia, Xin Huang, Dongsheng Fan and Qiong Yang in Journal of Alzheimer's Disease Reports
Footnotes
Acknowledgements
We thank all GWAS studies for publicly providing summary data and express our gratitude to all participants who contributed to these studies. We also appreciate the support from the National Natural Science Foundation of China.
Ethical considerations
The Mendelian randomization approach was adopted in this study. All research data were derived from publicly published datasets, which had obtained ethical approval.
Consent to participate
This study was based on publicly available summary-level GWAS data, and no individual-level data were used. Therefore, additional informed consent from participants was not required.
Consent for publication
Not applicable
Author contribution(s)
Funding
QY was funded by the National Natural Science Foundation of China (81901204), Clinical Cohort Construction Program of Peking University Third Hospital (BYSYDL2024019). DF was funded by the National Natural Science Foundation of China (81873784 and 82071426), Clinical Cohort Construction Program of Peking University Third Hospital (BYSYDL2019002 and BYSYZD2021004). This work was supported by the special fund of the National Clinical Key Specialty Construction Program, P. R. China (2024).
Declaration of conflicting interests
The authors declared no potential conflicts of interest with respect to the research, authorship, and/or publication of this article.
Data availability statement
The exposure and outcome GWASs are available in the corresponding previous research.
Supplemental material
Supplemental material for this article is available online.
References
Supplementary Material
Please find the following supplemental material available below.
For Open Access articles published under a Creative Commons License, all supplemental material carries the same license as the article it is associated with.
For non-Open Access articles published, all supplemental material carries a non-exclusive license, and permission requests for re-use of supplemental material or any part of supplemental material shall be sent directly to the copyright owner as specified in the copyright notice associated with the article.