
Abstract
Background
The Quick Mild Cognitive Impairment (Qmci) screen is a short cognitive screening instrument developed to detect mild cognitive impairment (MCI). No conversion tables exist between the Qmci screen and commonly-used instruments such as the Mini-Mental State Examination (MMSE) or Montreal Cognitive Assessment (MoCA), limiting comparability across settings and studies.
Objective
To create bidirectional conversion tables between the Qmci screen, MMSE, and MoCA in a memory clinic cohort.
Methods
A secondary analysis of data from 551 older adults attending a single-center Irish university-hospital memory clinic (2012–2014) was performed. Participants were classified as normal (n = 101), subjective cognitive disorder (n = 73), MCI (n = 103), and dementia (n = 274). Qmci screen, MMSE, and MoCA scores were available for all participants. Equipercentile equating with log-linear smoothing generated score equivalencies and 95% confidence intervals (CI) between instruments.
Results
The Qmci screen demonstrated a broader scoring range and greater sensitivity in the mid-range of cognitive performance than either the MMSE or MoCA. Conversion tables revealed a non-linear relationship between instruments, with ceiling effects observed for the MMSE and MoCA. At established cut-offs, an MMSE score of 24/30 equated to a Qmci screen score of 42/100, while a MoCA score of 26/30 corresponded to a Qmci screen score of 71/100 (95% CI: 68–74). Bidirectional tables allow translation of scores across tools.
Conclusions
This study provides validated conversion tables between the Qmci screen and two widely-used cognitive instruments, to support the use of the Qmci screen in research (facilitating cross-instrument comparability and harmonization across studies), and clinical settings (determining eligibility for disease-modifying therapies).
Keywords
Introduction
As the global population ages, the prevalence of cognitive impairment and dementia is increasing at an unprecedented rate.1–4 Alzheimer's disease (AD) accounts for the majority of dementia cases, representing the most common neurodegenerative cause of memory decline and functional impairment. 5 Mild cognitive impairment (MCI) represents a clinically important transitional state between normal cognitive aging and dementia, particularly AD, encompassing cognitive decline greater than expected for age but not severe enough to meet criteria for dementia. 6 Individuals with MCI are at elevated risk of progression to AD dementia, 7 highlighting the public health importance of early detection.8,9 Early identification of cognitive decline is critical, not only for prognostication and care planning, but also given the results of recent trials, to identify individuals eligible for emerging disease-modifying therapies (DMTs) for AD, which show the greatest benefit when initiated in prodromal stages of disease. 10 Understanding what proportion of any cohort may be suitable for DMTs can be facilitated by using cut-offs on cognitive screening instruments (CSIs) prescribed in appropriate use recommendations. 11
In this context, CSIs are important tools in the assessment of cognitive impairment across busy clinical and research settings. However, multiple different CSIs are in use across units and healthcare systems, making it difficult to interpret scores when care is transferred, especially if other instruments are used, or when monitoring change over time, applying cut-offs for eligibility for specific treatments or entry into clinical trials. Among the most widely used CSIs are the Mini-Mental State Examination (MMSE) 12 including its standardized version 13 and the Montreal Cognitive Assessment (MoCA), 14 with the MoCA being more sensitive to milder forms of impairment such as MCI. 15 However, both instruments require time to administer and may be less practical to use in busy clinical environments or community-based screening contexts. The Quick Mild Cognitive Impairment (Qmci) screen is a shorter, validated instrument developed to improve the detection of MCI and early dementia. 16 The Qmci screen includes a range of cognitive subtests, including logical memory and verbal fluency, while requiring significantly less administration time compared to the MoCA and MMSE. It has demonstrated strong diagnostic accuracy for MCI and dementia in both primary17,18 and secondary care settings.19,20
Given the widespread historical use of the MMSE and increasing adoption of the MoCA, it is important to understand how these scores correspond to those from the Qmci screen to support longitudinal research, transitions in clinical practice, and meta-analytic comparisons. Fasnacht and colleagues recently addressed this need for the MoCA by generating conversion tables between the MMSE and MoCA using equipercentile equating with log-linear smoothing in a large German-speaking sample in Switzerland. 21 A similar approach comparing these two CSIs was used more recently in a sample of patients with AD and Parkinson's disease in Italy. 22 Prior to these, a large multi-center study in Canada's Québec region including English and French speakers provided practical information on comparability, facilitating a straightforward comparison of scores on the same two instruments from initial screening and throughout the progression of neurocognitive disorders. 23 Further, in epidemiology the use of standardized cut-offs on CSIs across studies is required to harmonize data and facilitate better comparisons between populations.24,25
This study aims to replicate and extend these approaches using an Irish memory clinic dataset to develop conversion tables between the Qmci screen and the MMSE, and the Qmci screen and the MoCA. In doing so, we aim to enhance the interpretability and interoperability of these CSIs in a memory clinic sample, acknowledging that external validation may be required in other populations and settings.
Methods
Study design and participants
This was a secondary analysis of data from a previously published cross-sectional study involving 551 participants aged ≥45 years recruited from a university hospital memory clinic in Ireland between 2012 and 2014. 26 The study population included patients referred for cognitive assessment as well as cognitively healthy, normal controls (NC). Patients were referred by physicians from both primary and secondary care. Those with active depression, delirium, an unclear diagnosis and non-English speakers were excluded. Cognitive diagnoses were established using standard clinical criteria, which have been described in detail elsewhere. 26 In summary, consecutive attending patients with cognitive complaints were recruited along with caregivers and other supporters, who were included as NC. All participants underwent a comprehensive clinical assessment, including detailed demographic data, a full medical history, a battery of neuropsychological tests and routine neuroimaging. Three CSIs were administered to all participants as part of the assessment including the Qmci screen, MoCA and Standardized version of the MMSE. All assessments were administered in random order by trained raters using standard protocols and blinded to the diagnostic classification and the results of the neuropsychological testing. 26
Cognitive screens
The Qmci screen is a brief cognitive screen that includes six subtests; orientation (10 points), word registration (5 points), a clock drawing test (15 points), delayed recall (20 points), verbal fluency (20 points) and logical memory (30 points) with a total score range of 0 to 100, developed to detect MCI with higher sensitivity than the MMSE with similar diagnostic accuracy to the MoCA.16,27 It takes less than 5 min to administer (median 4.24 min). 27 Scores <65/100 are recommended to identify MCI. 26 Lower scores indicate greater likelihood of cognitive impairment.16,27 The MoCA is a well-established 30-point tool, particularly sensitive to early cognitive decline with scores less than 26, suggesting MCI with an adjustment (plus one point) for those with <12 years education. 14 The Standardized MMSE is one of the most widely used global cognitive assessment instrument, 13 although it is less sensitive to MCI. 15 It is also scored from 0–30 with lower scores indicating greater cognitive impairment and a cut-off of <24 suggesting dementia; cut-off scores vary by age and education. 28
Ethical considerations
Ethical approval for the original study was obtained from the local research ethics committee (Clinical Research Ethics Committee of the Cork Teaching Hospitals), reference number: ECM 4 [aa] 03/04/12, and all participants or their legal representatives provided written informed consent. The current secondary analysis used anonymized data and adhered to the same ethical approvals and governance procedures as the original study.
Statistical analysis
Descriptive statistics were used to characterize the study sample, including means, standard deviations, medians, and interquartile ranges for continuous variables. Cognitive scores were summarized for each instrument across the full sample. To compare the instruments, we used equipercentile equating with log-linear transformation (smoothing) to generate conversion tables between the Qmci screen and both the MMSE and MoCA. Qmci screen scores were transformed to equivalent MMSE and MoCA scores (and vice versa). MoCA scores incorporated the one-point adjustment into the total raw score to a total of 30 points. Equipercentile equating has been described in detail elsewhere 29 and has been widely used in the literature to find equivalent values between two CSIs.21,30 In brief, this statistical approach estimates what scores on a selected screen would produce the same percentile values that each individual score on the reference instrument has. These estimated values may fall between two whole numbers and for ease of interpretation all estimated values were rounded to the nearest whole number. As highlighted in prior equating studies comparing CSIs, equipercentile equating can result in irregular distributions of raw scores, so a log-linear transformation was applied to smooth the distribution of raw scores into a more regular distribution. 31 Missing data were minimal (n = 6 values for years in education) and pairwise deletion was used for missing scores within instruments. Equated values were presented with 95% confidence intervals (CI), derived using bootstrapping of 1000 resamples from the equating procedure. All analysis was carried out in R version 4.4.2 including the additional packages “equate” (version 2.0.8) for equipercentile equating 32 and “ggplot2” (version 3.5.2) for producing figures. 33
Results
Descriptive statistics
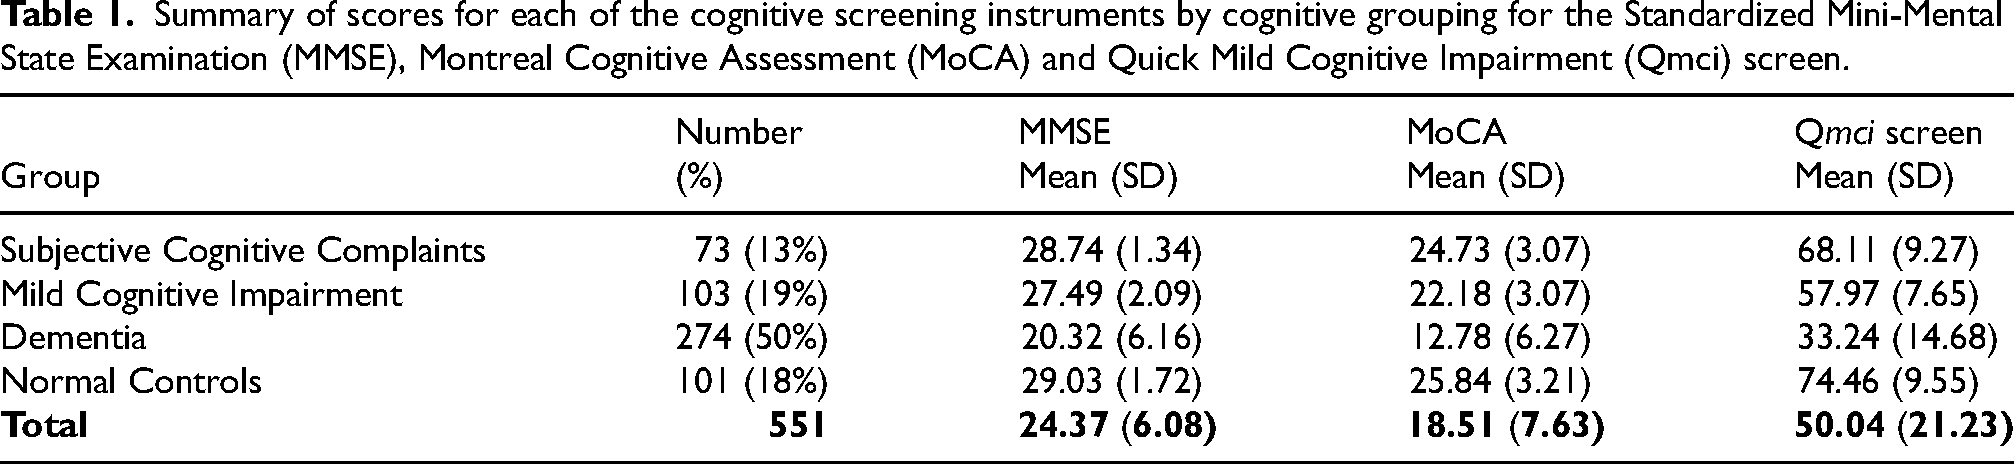
There was a total of 551 participants available including 73 (13%) with subjective cognitive complaints, 103 (19%) with MCI, 274 (50%) with dementia and 101 (18%) NC. Their mean age was 74.77 years (SD = 8.89) and 363 (66%) were female. The majority of those with dementia (64%) had a probable or possible AD subtype followed by vascular (15%), frontotemporal dementia (8%), Lewy Body dementia (4%), and others (9%). In all, 43% (236/545) had completed more than 12 years in formal education. The scores for each of the CSIs are summarized in Table 1 and the distribution of scores are presented graphically in Figure 1. The descriptive values represent raw scores without log-linear transformation.

Distribution of cognitive screening instrument (CSI) scores, comparing the Quick mild cognitive impairment (Qmci) screen, Standardized Mini-Mental State Examination (MMSE), and Montreal Cognitive Assessment (MoCA).
Summary of scores for each of the cognitive screening instruments by cognitive grouping for the Standardized Mini-Mental State Examination (MMSE), Montreal Cognitive Assessment (MoCA) and Quick Mild Cognitive Impairment (Qmci) screen.
Equipercentile equating: MMSE and MoCA to Qmci screen
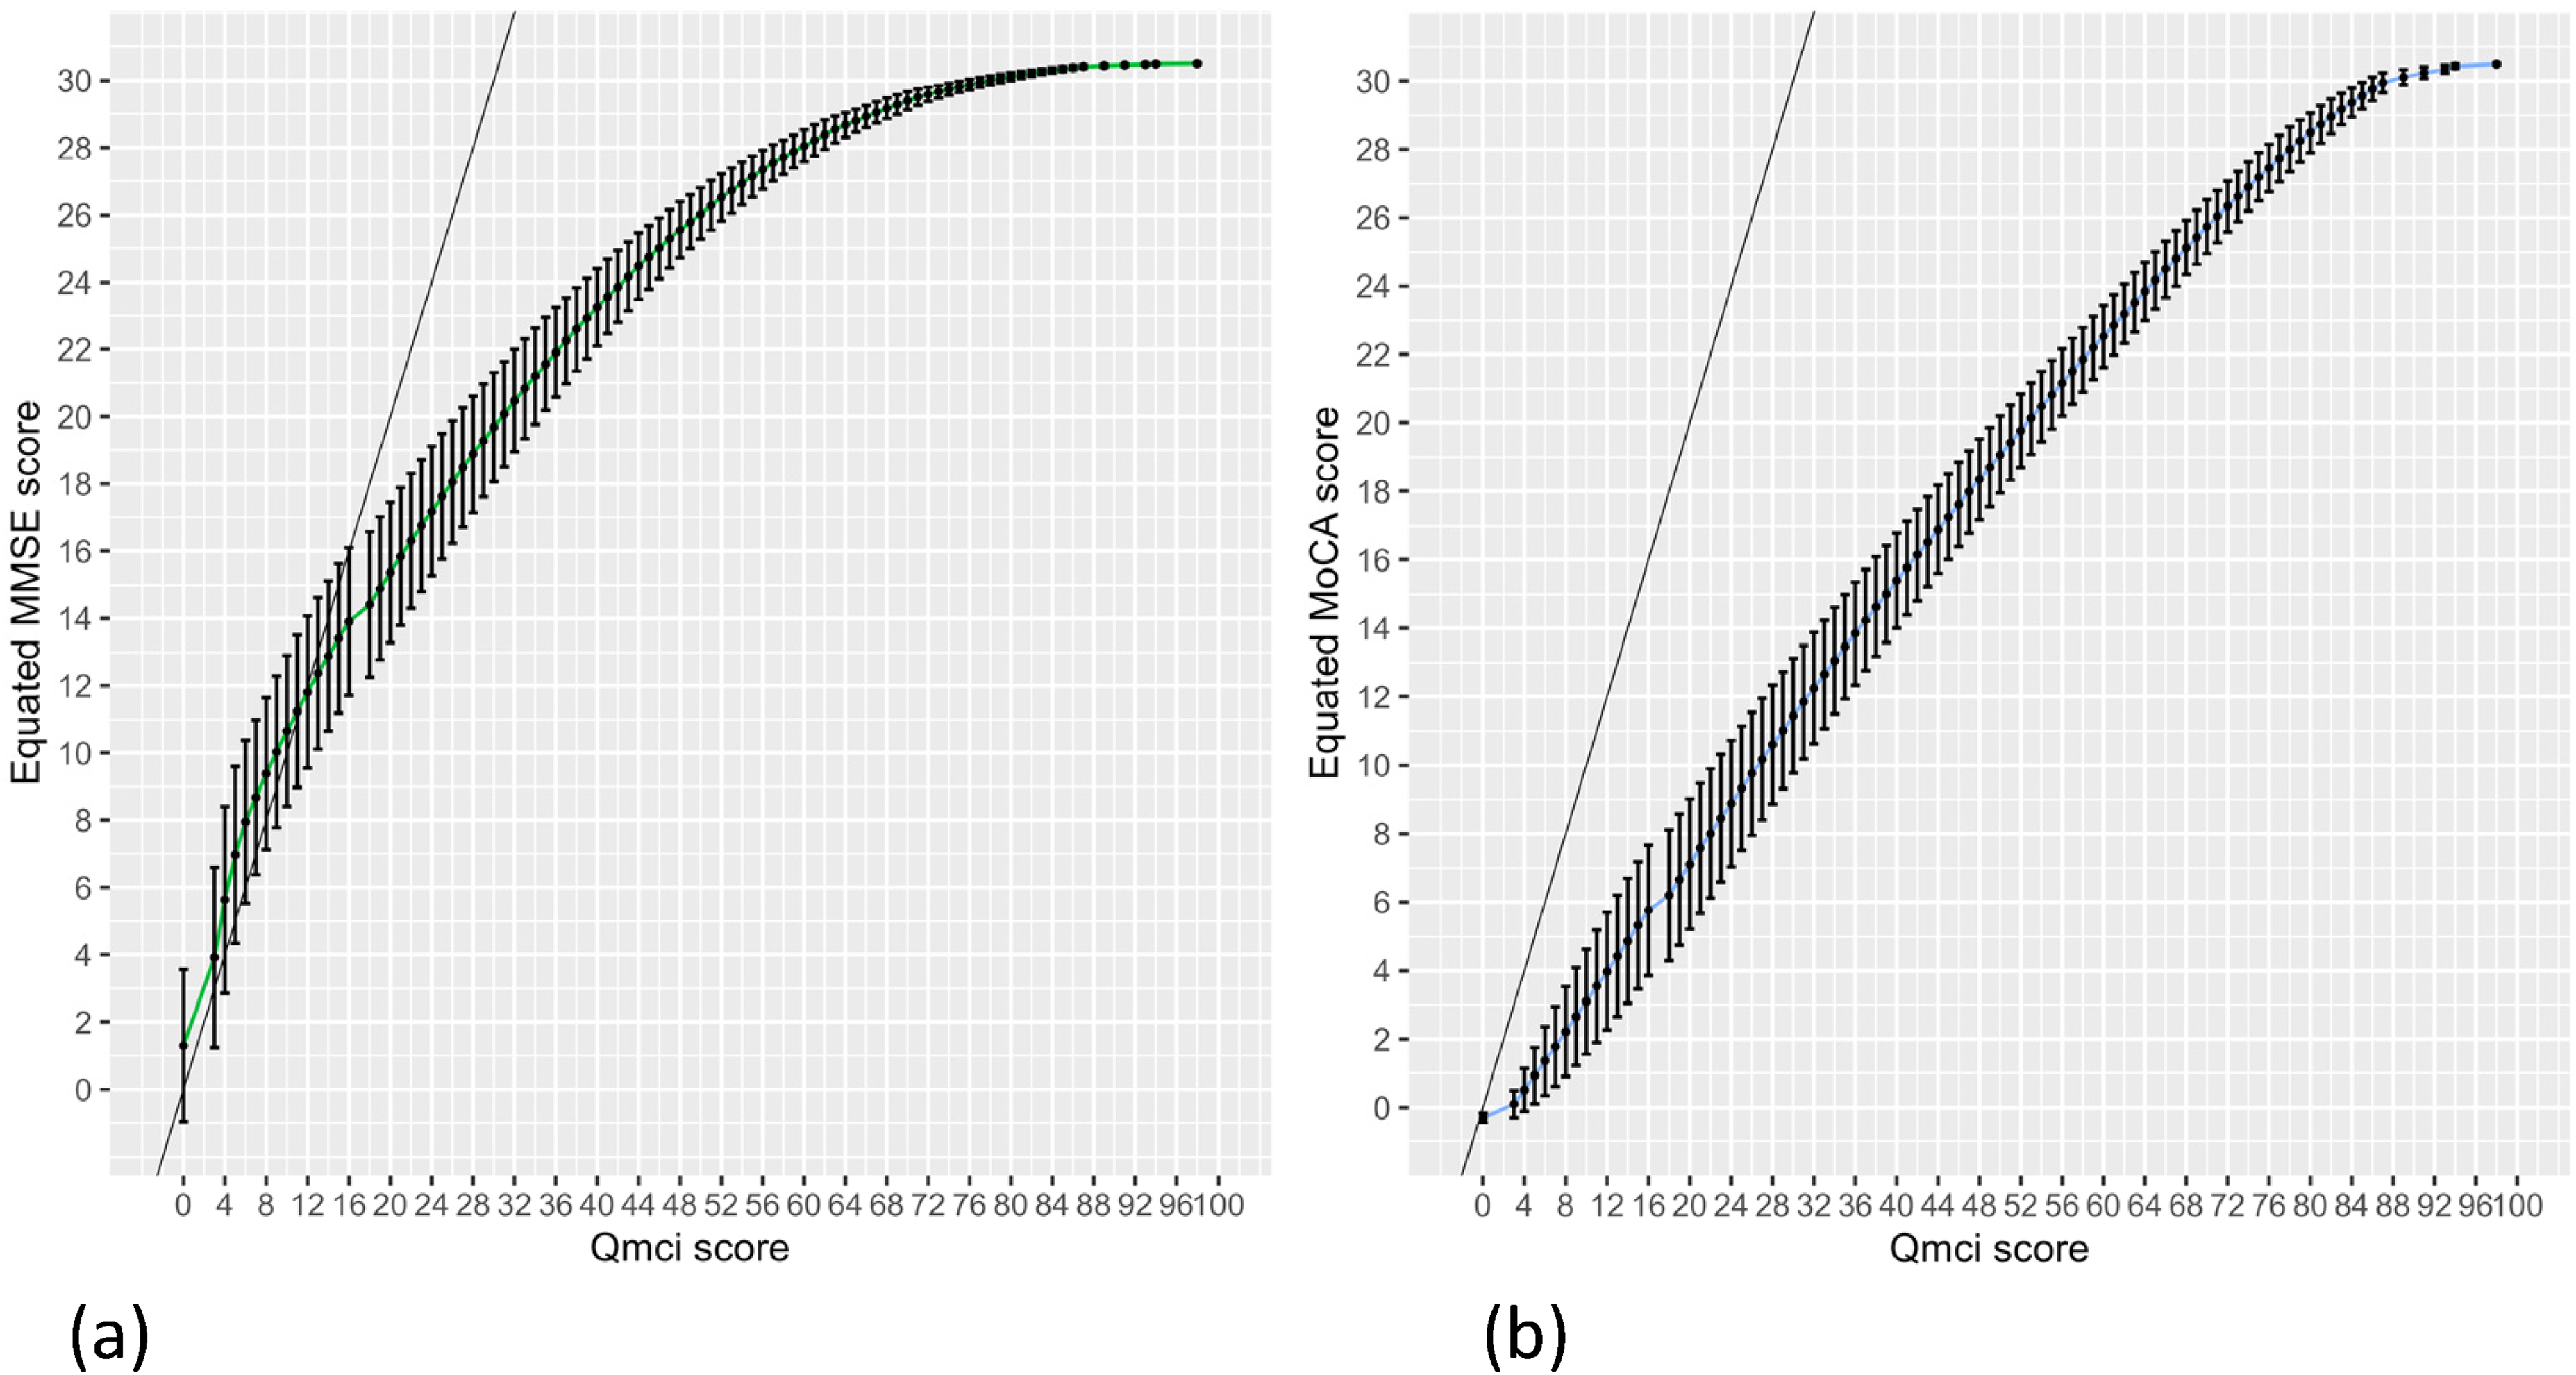
Bidirectional equipercentile equating with log-linear smoothing was conducted to map scores between instruments. Table 2 shows the equated Qmci screen scores for each MMSE and MoCA raw scores. The relationship between MMSE and Qmci screen scores was non-linear. Lower MMSE scores mapped to proportionally smaller increases in Qmci screen scores, while higher MMSE scores corresponded to more rapid increases in the Qmci screen. For example, an MMSE score of 10 equated to a Qmci screen score of 9 (95% CI: 6–12), while a mid-range MMSE score of 20 corresponded to a Qmci screen score of 31 (95% CI: 27–35). The highest MMSE score (30) equated to 78 (95% CI: 76–80), indicating an upper asymptote well below the Qmci screen maximum, reflecting its greater scale range and a possible ceiling effect in the MMSE. The commonly-used cut-off on the MMSE for cognitive impairment of <24/30 (i.e., 23 or lower)34,35 mapped to a Qmci screen score of 39/100 (95% CI: 36–43), while an optimized cut-off of 27/30 (26 and less) in those with more education and reported in other studies28,36 equated to a value of <50/100 (95% CI: 47–53), similar to the reported cut-off for dementia on the Qmci screen of <51/100 in older patients with ≥12 years education. 36
Conversion table for the Standardized Mini-Mental State Examination (MMSE) and Montreal Cognitive Assessment (MoCA) scores to the Quick Mild Cognitive Impairment (Qmci) screen including 95% confidence intervals (CI).

Similarly, MoCA scores mapped to Qmci screen scores with a non-linear trend. A MoCA of <26/30 (i.e., 25/30 or less), its established cut-off for MCI, 14 mapped to 68/100 (95% CI: 65–70), similar to the published Qmci screen cut-off of <67/100 for separating MCI from NC. 36 The recently recommended MoCA score of <24/30 for cognitive impairment (i.e., 23 or less)37,38 was equivalent to a score of 61/100 (95% CI: 59–64), again similar to validated Qmci screen cut-offs for cognitive impairment of <62/100. 36 A “perfect” MoCA score of 30/30 equated to a Qmci screen score of 88/100 (95% CI: 85–90). These results suggest that the Qmci screen captures a broader cognitive range than the MMSE or MoCA, particularly in individuals with moderate impairment. (Figure 2)

Equipercentile equating of (a) Standardized Mini-Mental State Examination (MMSE) and (b) Montreal Cognitive Assessment (MoCA) scores to Quick Mild Cognitive Impairment (Qmci) screen scores. Note: reference lines indicate where values on both are identical.
Reverse equating: Qmci screen to MMSE and MoCA scores
Reverse equating was also performed to enable interpretation of Qmci screen scores in terms of MMSE and MoCA equivalents (Table 3 and Figure 3). The relationships were again non-linear, with diminishing returns in MMSE or MoCA scores at higher Qmci screen values. This is consistent with the greater scoring resolution of the Qmci screen and the ceiling effects of the comparator instruments. Selected examples include:
A Qmci screen score of 40 equated to an MMSE score of 23 (95% CI: 22–24) and a MoCA score of 15 (95% CI: 14–17). A Qmci score of 50 equated to an MMSE score of 26 (95% CI: 25–27) and a MoCA score of 19 (95% CI: 18–20). A Qmci score of 74 corresponded to near-ceiling scores on the MMSE of 30 (95% CI: 30–30) and MoCA of 27 (95% CI: 26–28).
Equipercentile reverse equating of Quick Mild Cognitive Impairment (Qmci) screen scores to (a) Standardized Mini-Mental State Examination (MMSE) and (b) Montreal Cognitive Assessment (MoCA) scores. Note: reference lines indicate where values on both are identical.
Reverse conversion table comparing Quick Mild Cognitive Impairment (Qmci) screen scores to Standardized Mini-Mental State Examination (MMSE) scores and Qmci screen scores to Montreal Cognitive Assessment (MoCA) scores.

At very high Qmci screen scores (88–100), both MMSE and MoCA scores equated to 30/30, demonstrating ceiling saturation, while the Qmci screen continued to show gradations, implying its ability to differentiate even in high-functioning individuals. Downloadable conversions are provided in the Supplemental Material in CSV file format.
Equating curve interpretation
Plots of the equating functions demonstrated classic S-shaped non-linear relationships. The Qmci screen's larger score range resulted in wider separation of scores in the mid-range (scores between 40–70), particularly when mapping from the MoCA. This region is clinically important for differentiating MCI from normal cognition and suggests that the Qmci screen may be particularly useful in this diagnostic window. The curve from the MMSE to Qmci screen was less steep than the MoCA-Qmci screen relationship at lower scores, likely reflecting the MMSE's reduced sensitivity in detecting early cognitive deficits. In contrast, the MoCA and Qmci screen showed a steeper mid-range slope, indicating better alignment in detecting and separating MCI-level impairment.
Missing values
Some score levels within the Qmci screen range were not represented in the dataset given the sample size or had insufficient observations to allow reliable estimation (e.g., very low Qmci screen scores of <10/100). These gaps were few and largely occurred at the tails of the distribution, where clinical utility of equating may be less critical.
Clinical utility
As an applied example, we converted MMSE eligibility thresholds used in Phase 3 trials of DMTs for AD to their equivalent Qmci screen scores using the equipercentile equating function. For example, the CLARITY-AD trial of Lecanemab required participants to have MMSE scores ≥22 without a specified upper limit, allowing inclusion up to the maximum score of 30. 39 Using equipercentile equating, an MMSE score of 22 corresponded to a Qmci screen score of approximately 36 (95% CI: 33–40). The maximum MMSE score of 30 equated to a minimum Qmci score of 78 (95% CI: 76–80). Similarly, the TRAILBLAZER-ALZ trials for Donanemab included participants with MMSE scores ranging from 20 to 28. 40 Correspondingly, an MMSE score of 20 equates to a Qmci screen score near 31, and an MMSE of 28 points maps to a score of approximately 66 (95% CI: 63–69), serving as a practical upper reference point above which additional cognitive testing would be required to demonstrate a deficit.
Discussion
This study presents the first conversion tables between the Qmci screen, the MMSE, and the MoCA, using equipercentile equating with log-linear smoothing 29 in a well-characterized Irish university hospital memory clinic sample. 26 By enabling bi-directional score translation between instruments, this work facilitates cross-study and clinical comparability, particularly in research and care settings where different cognitive screening tools are used interchangeably or longitudinally. The results demonstrate a non-linear relationship between the Qmci screen and both the MMSE and MoCA, with the Qmci screen exhibiting a wider score range and greater score resolution (dispersion) in the mid-range. This was most notable when equating mid-range MoCA and MMSE scores to Qmci screen scores, where relatively small differences in MMSE or MoCA scores corresponded to larger gradients in Qmci screen scores. For example, a MoCA score of 20, a threshold often associated with moderate impairment, mapped to a Qmci screen score of 53, while a Qmci screen score of 74 equated to a MoCA score of 27, reflecting near-ceiling performance. The MMSE showed more compression at the upper end of the scale, with a score of 30 equating to a Qmci screen score of 78, suggesting ceiling effects in the MMSE and potential underestimation of high-functioning individuals’ abilities. The Qmci screen's greater dynamic range (0–100) compared to the 30-point scales of the MMSE and MoCA allows for finer resolution, where the MMSE and MoCA have a ceiling effect. The equating results also show that the Qmci screen may detect gradations of impairment that are missed by the MMSE or MoCA, particularly in those scoring at the threshold between normal cognition and MCI. This said, the MMSE was not designed for those with MCI unlike the MoCA and Qmci screen, which are MCI-specific tests. 26
Comparison with previous studies
This study closely replicates the methodology used by other studies, who equated MMSE and MoCA scores in memory clinic outpatient samples in Canada, 23 Germany, 21 and Italy. 22 Similarly, we applied equipercentile equating with log-linear smoothing to ensure robust, distribution-sensitive alignment of scores. The present findings extend this approach to a newer, brief cognitive tool (the Qmci screen), providing much-needed calibration for its clinical and research use. Compared to the German paper, 21 the current study included a lower proportion of individuals with dementia (18% here versus 44% with a major neurocognitive) but had a slightly older mean age (approximately 75 here versus 71 years), which may explain the somewhat lower average MoCA and MMSE scores observed. Despite these differences, the overall structure of the equating curves, especially the plateau at higher scores and the steep gradient in the mid-range was consistent with prior findings.
Clinical and research implications
These findings have practical applications for both clinical and research settings. Researchers using different instruments across cohorts can now use these tables to harmonize cognitive scores. For example, studies that originally used the MMSE or MoCA can estimate equivalent Qmci screen scores, facilitating pooled analyses and meta-analyses. Clinicians more familiar with the MMSE or MoCA can interpret Qmci screen scores using the equated values, serving as a template for helping integrate newer instruments into practice with greater confidence. The broader scoring range of the Qmci screen and its sharper mid-range slope suggest a potential advantage in detecting MCI or subtle decline. This aligns with previous findings showing higher accuracy of the Qmci screen for MCI compared to the more-widely used CSIs in some studies. 41
The clinical applicability of conversion between CSIs is underscored by recent regulatory approvals of anti-amyloid therapies for early AD, notably Lecanemab and Donanemab. In these pivotal Phase 3 trials for DMT in early AD, cognitive screening cut-offs have been used to help select appropriate participants. The CLARITY-AD Phase 3 trial 39 and corresponding prescribing information specify an MMSE inclusion cut-off of ≥22 but do not impose an upper limit on MMSE scores, allowing individuals with scores up to 30. Our study equates this lower threshold to a Qmci score of approximately 40 offering clinicians a relevant benchmark for patient selection when the MMSE is not available. Similarly, Donanemab's TRAILBLAZER-ALZ trials enrolled participants with MMSE scores between 20 and 28, 40 targeting a slightly narrower cognitive range reflective of early symptomatic AD, albeit recently published appropriate use recommendations have suggested that it should be considered in those with MMSE scores up to 30. 42 Our conversion indicates that these MMSE boundaries correspond to Qmci screen scores of between approximately 31 and 66.
Appropriate use criteria and consensus guidelines from expert panels further recommend using CSIs to identify individuals suitable for further evaluation with biomarkers and potential disease-modifying therapy.42,43 The availability of validated equating tables between the Qmci screen and the more widely-used MMSE and MoCA enhances the practical utility of the Qmci screen in memory clinics and community settings, including in primary care and community-based units, where time is limited and the Qmci screen has shown promise as a rapid tool with high accuracy for MCI,17,18 promoting consistency with trial-based inclusion criteria and regulatory guidance. Future research should validate these cut-offs prospectively in clinical populations undergoing biomarker evaluation and DMT consideration. Future studies could also examine how scores on CSIs correspond to performance on more comprehensive neuropsychological batteries or emerging computerized cognitive assessments, which may provide additional insight into how screening scores map onto broader cognitive profiles. Nevertheless, these findings provide a further step in standardizing cognitive assessments across different instruments, ensuring equitable patient access to emerging AD therapies. However, clinicians should exercise caution as equated scores are not interchangeable diagnoses, and conversions should not replace clinical judgment or comprehensive assessment. These ranges reflect the cognitive spectrum targeted by the trials and are only a guide to further assessment.
Strengths and limitations
This study has several strengths. It includes a large, well-characterized clinical sample, applied rigorous and replicable statistical methods, and offers the first published equating tables between the Qmci screen and the two most widely used CSIs globally. There are a number of limitations nevertheless. This study used a single-center design with all participants drawn from a single university hospital memory clinic in Ireland with data gathered by the developers of the Qmci screen, limiting generalizability to other settings (primary care and community samples), populations (different languages and literacy levels) and ethnic groups. Hence, additional validation of these findings across these settings is required. Reflecting the time of data collection, biomarker data were not routinely available and hence were not required to meet the diagnosis, which was based on clinical and imaging findings. As the cohort is derived from a memory clinic, there is a higher impairment prevalence, which may affect percentile mapping compared to community samples. There were missing data at score extremes. Due to sparse data at the lowest and highest ends of the Qmci screen score scale, some equated scores were not available. These gaps were most common for scores with few observations and may not affect typical clinical applications. To minimize this and expand generalizability, future study should include larger samples and ideally a systematic review and meta-analysis to compare values for a pooled samples, given the increasing number of studies comparing the Qmci screen to the MoCA and MMSE. 41 A further limitation relates to the structure of the three instruments. Each instrument has distinct cognitive subtests, which while similar do not overlap perfectly, meaning that score conversion cannot fully account for conceptual differences between tests. Similarly, scoring algorithms were different, particularly as the Qmci screen is scored out of 100 points, and equating cannot eliminate underlying conceptual differences between tools. Although the Qmci screen offers greater score resolution across the cognitive spectrum, the ability to detect meaningful change over time requires empirical evaluation using longitudinal data and appropriate indices such as the reliable change index, which were not possible using this dataset. Finally, the Qmci screen includes a relatively greater emphasis on memory tasks and that the predominance of patients with AD within the sample (two-thirds), may have influenced the relative performance characteristics. As CSIs may show different performance profiles across dementia aetiologies, 44 further research in non-Alzheimer's dementia populations would be valuable in larger samples that could effectively show these potential differences.
Conclusions
This study provides robust, bidirectional conversion tables between the Qmci screen, MMSE, and MoCA, using equipercentile equating with log-linear smoothing in a memory clinic population. The findings demonstrate that while the MMSE and MoCA are prone to ceiling effects and score compression, the Qmci screen provides greater scoring range and sensitivity across the cognitive continuum. These conversion tables offer a valuable resource for clinicians and researchers seeking to translate cognitive scores across instruments and underscore the potential utility of the Qmci screen in early cognitive impairment detection.
Supplemental Material
sj-zip-1-alr-10.1177_25424823261441514 - Supplemental material for Converting short cognitive screen scores: Comparing the Quick mild cognitive impairment screen, Montreal cognitive assessment, and Mini-mental state examination
Supplemental material, sj-zip-1-alr-10.1177_25424823261441514 for Converting short cognitive screen scores: Comparing the Quick mild cognitive impairment screen, Montreal cognitive assessment, and Mini-mental state examination by Rónán O’Caoimh, Eleanor Marks and Mark R O’Donovan in Journal of Alzheimer's Disease Reports
Footnotes
Ethical considerations
To conduct the research, approval was obtained from the Clinical Research Ethics Committee of the Cork Teaching Hospitals (Date: 03.04.2012, ECM 4 [aa] 3/4/12).
Consent to participate
Participants provided written informed consent.
Consent for publication
Not applicable
Author contribution(s)
Funding
The authors received no financial support for the research, authorship, and/or publication of this article.
Declaration of conflicting interests
The authors disclosed the following potential conflict of interest related to the publication of this article: Dr. Rónán O’Caoimh is a co-copyright holder for the Quick Mild Cognitive Impairment Screen. The authors report no other conflict of interest.
Data availability statement
Available on request.
Supplemental material
Supplemental material for this article is available online.
References
Supplementary Material
Please find the following supplemental material available below.
For Open Access articles published under a Creative Commons License, all supplemental material carries the same license as the article it is associated with.
For non-Open Access articles published, all supplemental material carries a non-exclusive license, and permission requests for re-use of supplemental material or any part of supplemental material shall be sent directly to the copyright owner as specified in the copyright notice associated with the article.