
Abstract
This study investigates the influence of ore particle size on gravity-driven flow behaviour and dilution at the drawpoint in sublevel caving operations using a particle-based modelling framework implemented in the Blender rigid body physics engine. Two representative case studies with non-uniform particle-size distributions are analysed: the Ernest Henry Mine, supported by ring marker trial data, and the DeGagné dilution curve derived from discrete element simulations calibrated against Ridgeway mine data. For both case studies, a systematic calibration procedure is conducted to identify suitable modelling configurations and evaluate the sensitivity of key physics-engine parameters. Half-geometry simulations are adopted to overcome hardware limitations. The results show that particle linear damping is the dominant parameter controlling flow behaviour, while particle friction and geometry also significantly influence flow responses. Simulations using purely spherical particles underestimate inter-particle contact effects and produce less realistic behaviour. The most representative results are obtained using lower damping for ore relative to waste particles and non-spherical dodecahedral particles. Following calibration, increasing ore particle size by 10% and 20% leads to higher dilution and lower ore recovery, particularly at intermediate extraction levels, due to reduced ore mobility and earlier waste breakthrough.
Keywords
Introduction
The comminution chain in metalliferous mining begins with in situ rock breakage, where the orebody rock mass is fractured and fragmented to sizes that can be loaded and transported, most commonly by drilling and blasting techniques. The post-blast fragmentation size distribution has a strong influence on the performance of downstream operations, including hauling, crushing and grinding (Aler et al., 1996; Campbell and Thurley, 2017; Grant et al., 1995; Hamdi et al., 2001; Jimeno et al., 1995).
Sublevel caving (SLC) is a mass-mining method that relies on the gravity flow of blasted ore and caved waste rock (Kvapil, 1992). In this method, blasting breaks the ore, while the rock above it fractures and caves because of mining-induced stresses and gravity (Bull and Page, 2000). The caved waste fills the space created as the ore is extracted. SLC was first used in soft ground in the iron ore mines of Minnesota and Michigan in the early 1900s (Hustrulid, 2000; Hustrulid and Kvapil, 2008). The modern form of SLC was developed in the 1950s in Sweden at the Grängesberg Mine (Janelid, 1972). In SLC, production drifts and associated infrastructure are typically developed in the footwall, while the overlying hanging wall rock is allowed to cave under gravity as ore is extracted from successive sublevels (Brunton, 2009; Lapčević and Torbica, 2017). Figure 1 shows the schematic diagram of an SLC operation. The main disadvantage of SLC is the potential high dilution of extracted ore caused by the caved waste rocks that can occur during the gravity flow process (Campbell, 2019).

Schematic layout of a sublevel caving operation (Shekhar, 2020).
Ring design and blast performance strongly influence the initial particle-size distribution (PSD) in SLC stopes. Fan-shaped ring patterns with eight to 12 holes are commonly used in SLC operations. After blasting, the fragmented ore and, later, the caved waste rocks flow under gravity through the stope towards the drawpoint in the production drift, which forms a gravity-flow system of blasted ore and caved waste rocks. Figure 2 illustrates the typical design of different fan-shaped ring patterns with seven to 10 holes. As can be seen, the closer charge spacing at the bottom and wider spacing at the top results in a lower powder factor toward the top of the ring, which in turn produces coarser fragmentation in the upper section after blasting. The influence of blast design, rock mass and explosive properties on post-blast particle size has been studied using empirical, numerical and statistical models, with most applications focused on open-pit blasting and fewer studies addressing underground mining methods, including sublevel caving (Onederra, 2004; Ouchterlony and Sanchidrián, 2018). Most recently, the underground ring blasting model (URBM) was developed by Khodayari et al. (2025) to predict post-blast fragment size distributions in SLC rings. In addition, the applicability of empirical fragmentation models such as Kuz-Ram, extended Kuz-Ram, the two-component model, and the Kuznetsov-Cunningham-Ouchterlony model (originally developed using open-pit blasting data) (Cunningham, 2005; Djordjevic, 1999; Ouchterlony and Sanchidrián, 2018; Sanchidrián and Ouchterlony, 2017), for the prediction of blast-induced particle sizes in sublevel caving has been discussed by Khodayari et al. (2026).
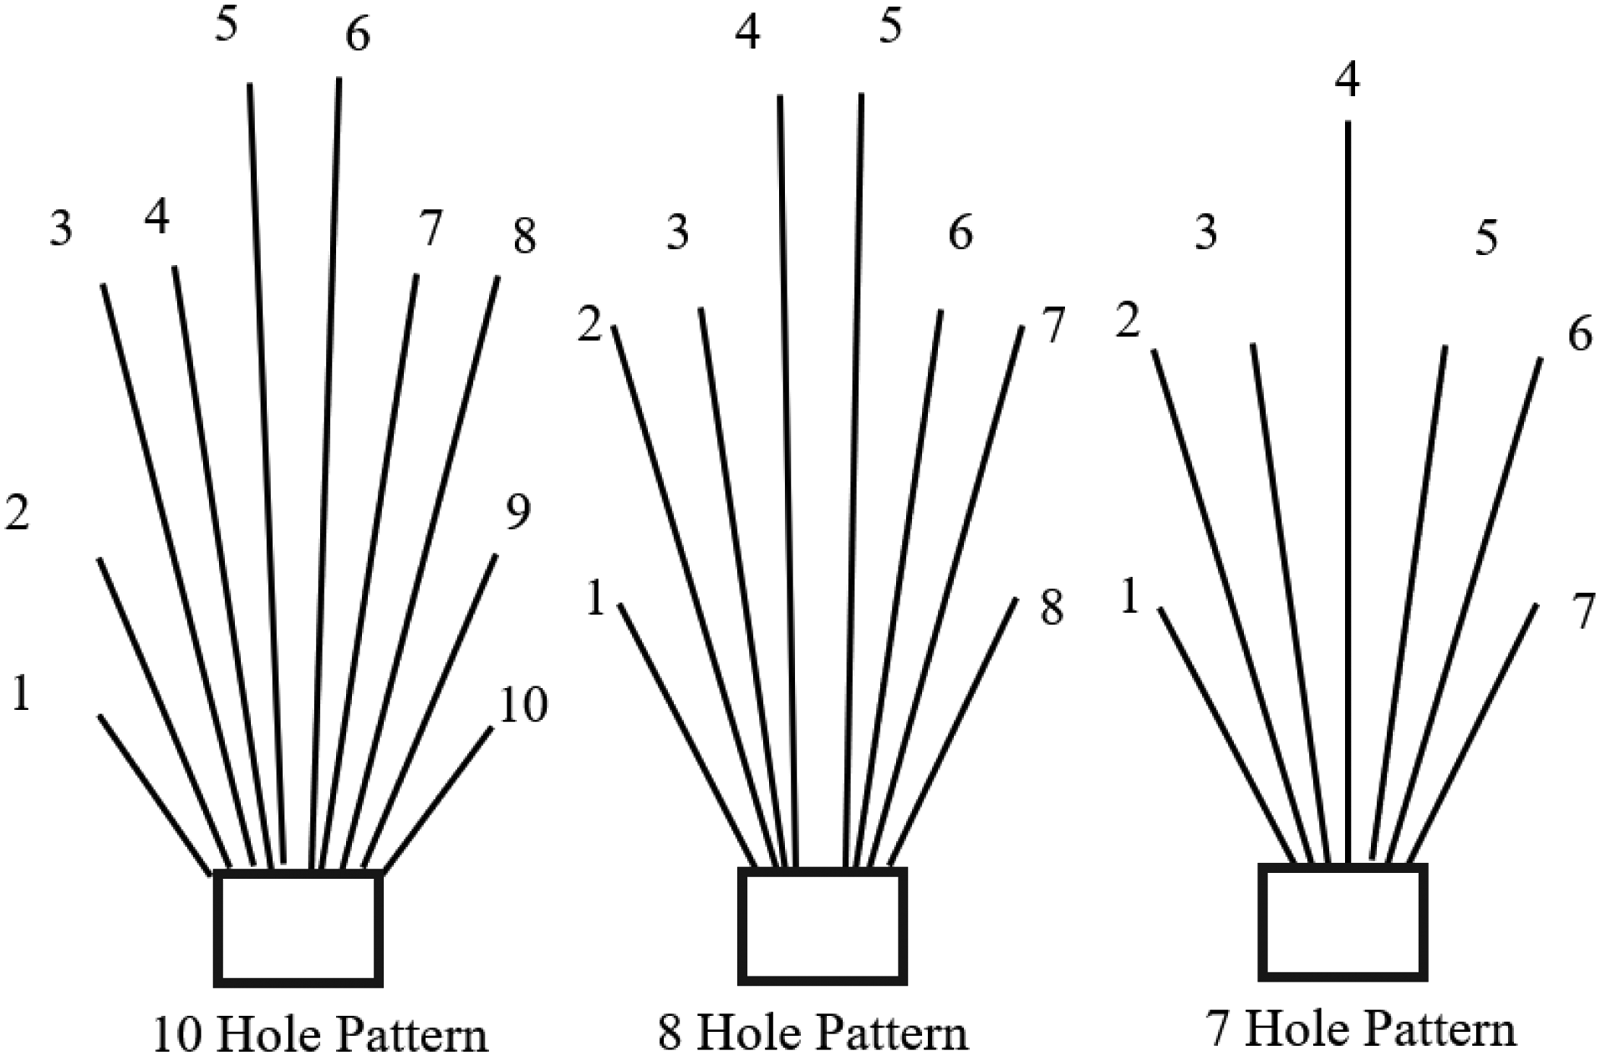
Different ring design blasthole patterns (Brunton, 2009).
Gravity flow, small and full scale
Flow behaviour in SLC has been studied for many years using mathematical models and small-scale experiments (Brady and Brown, 2006). Early research focused mainly on creating small flow tests and simple mathematical descriptions of how material moves. These concepts were later assessed and improved through full-scale marker trials carried out in several SLC mines (Power, 2004). Modelling methods for gravity flow in SLC were developed based on particle mechanics, small and large laboratory tests, and observations from operating mines (Brunton, 2009; Power, 2004), as understanding gravity flow is essential for the successful implementation of the SLC mining method. The first major theory of gravity flow in SLC was created by Janelid and Kvapil (1966). It was based on the behaviour of material flow of two-dimensional (2D) small bunker tests (Kvapil, 1965). The main idea of this theory is the ‘flow ellipsoid’, as shown in Figure 3.

Flow ellipsoid proposed by Janelid and Kvapil (1966).
This is one of the earliest attempts to describe material flow in a mathematical form. The shape of the ellipsoid is defined by its eccentricity, which depends on the lengths of its major and minor axes. The eccentricity is influenced by many factors, such as particle size and shape, surface roughness, friction angle, density, extraction rate and other particle properties such as strength and moisture (Kvapil, 1982). Later models increased in size and complexity to better represent the SLC geometry and investigations covered the effects of particle size, the ratio of ore particle size to waste particle size, outlet width, particle shape, compaction, drive dimensions, ring inclination and model-filling density (Airey, 1965; Caspar, 1960; Free, 1970; McCormick, 1968; Panczakiewicz, 1977; Redaelli, 1963). These tests revealed some useful features of cave flow, including that finer materials flow faster than coarse fragments, large blocks disturb or restrict flow, compaction increases the verticality of the draw zone, angular particles are more prone to hang-ups, and PSD strongly affects draw-zone geometry. Up till now, the modelling of granular flow remains an active field of research (Garzó, 2023).
Since the 1950s, a significant amount of research has been carried out to improve the understanding of how blasted rock moves in SLC mines (Brunton, 2009; Campbell, 2019; Gustafsson, 1998; Power, 2004; Rustan, 2000). The best design for an SLC operation is one that achieves reasonable ore recovery with an acceptable amount of dilution, while also maintaining mine stability and high productivity (Lapčević and Torbica, 2017). For this reason, the main purpose of studying gravity flow is to reduce dilution and increase ore recovery.
While access to suitable underground mining datasets is generally limited, full-scale marker trials have been conducted at several SLC mines to assess real material movement. These investigations consistently showed that real draw zones are highly irregular, asymmetric and strongly influenced by site-specific conditions. The first significant use of electronic markers in SLC research was conducted by Power at the Ridgeway Mine in Australia, where markers were installed to determine the true origin of blasted materials within the stope (Power, 2004). The results showed that early dilution entering from above the ore in front of the blasted ring, rather than from the sides or the back of the ring, which contradicted long-held assumptions. Based on these findings, Power (2004) proposed a new framework for modelling material flow in SLC operations that integrates full-scale marker trial data with extraction-zone delineation, highlighting irregular and asymmetric flow behaviour that departs from classical ellipsoidal flow assumptions. Brunton (2009) studied 69 full-scale ring marker trial datasets from the Ridgeway mine, which showed that extraction zones were irregular rather than ellipsoidal, with continuous flow near the blast ring plane and finger-shaped recovery extending outward. Backbreak recovery was common, indicating extraction of material from behind the blast ring plane, while secondary to quaternary recovery occurred in small, discrete zones that developed progressively as isolated pockets of recovery beyond the primary continuous flow zone due to irregular and non-uniform material flow. Neural network analysis and statistical testing showed that several blasting parameters were directly or inversely correlated with recovery and were more influential than geological or draw-point factors. The most likely explanation identified was a drill-and-blast design change involving a reduction in the number of blast holes per ring, which reduced primary recovery and, as a consequence, limited later stages of recovery.
Smart markers were used in a research project at the Ernest Henry Mine (EHM) conducted by Campbell (2019), in which six blast design parameters, including explosive density, ring burden, hole diameter and cross-cut height, were varied to investigate their effects on PSD and material flow behaviour. Fragmentation was measured at the drawpoint using a laser scanner, while material flow and recovery were quantified using electronic smart markers. The results showed that reducing explosive density increased mean recovery by ∼7.9% for primary recovery (including backbreak) and by about 10% for secondary recovery. In contrast, reducing the ring burden from 2.6 to 2.2 m led to a decrease in cumulative secondary recovery of around 6.2%, while increasing the burden from 2.6 to 3.0 m increased recovery by an average of 8.3%. Campbell (2019) demonstrated that these recovery trends were primarily governed by blast-induced compaction and swell of the blasted materials, rather than by fragmentation size alone. In particular, higher powder factors produced finer fragmentation but also increased material compaction, which restricted gravity flow and caused premature waste ingress, thereby reducing recovery. Consistent with this, no statistically significant relationship was identified between fragmentation metrics (P50 and P80) and primary recovery in the full-scale trials. Figure 4 illustrates material movement and marker recovery (markers shown by white dots) during draw at the EHM, generated using a cellular automata-based numerical gravity-flow model that tracks marker recovery and is calibrated against the spatial distribution of full-scale electronic marker data (Campbell, 2019, 2020; Campbell and Power, 2017; Campbell and Thurley, 2017).

Simulation of material movement and marker recovery (Campbell, 2019).
Numerical simulation
The numerical simulation of rock fragment interactions using the discrete element method (DEM) is commonly used to study the material flow pattern in SLC operations. DEM approach models granular material as an assembly of individual particles, with particle motion governed by Newtonian mechanics and contact forces computed explicitly. Consequently, normal and shear forces, as well as particle rotation, velocity and displacement, are determined for each particle (Brunton, 2009). Numerical models can overcome practical challenges of assessing flow behaviour in the field, including interruption to ore extraction, safety issues and inaccuracies due to missing markers. Hustrulid (1997) developed a three-dimensional (3D) DEM-based computational methodology to simulate large-scale sublevel caving at the Kiruna Mine operated by LKAB. A critical contribution of this work was the development of an improved grid-based contact-searching algorithm, which enabled feasible computational runtimes for large-scale simulations (Hustrulid, 1997). A 2D DEM model was developed by Nazeri and Rozgonyi (2003) to simulate gravity flow in ore passes, which showed that ore shape can significantly impact both dynamic and static loads on the ore pass gate assembly (Nazeri and Rozgonyi, 2003). Lapcevic and Torbica (2017) used a discrete element model of an SLC stope to investigate the combined influence of inter-particle friction and particle size on gravity-flow behaviour and the resulting ore recovery and dilution. Their results showed that reducing inter-particle friction increases dilution due to enhanced particle mobility and mixing. They further demonstrated that dilution is not governed by fragmentation alone; depending on the frictional state of the material, finer fragmentation may either increase or decrease dilution, with the direction of the response controlled by whether the initial friction remains below or has evolved to the basic friction level. An example of their DEM model for cave-flow simulations is shown in Figure 5 (Lapčević and Torbica, 2017).

Example of a discrete element method (DEM) model for cave flow simulations (Lapčević and Torbica, 2017).
In another study by Lapcevic et al. (2024), the effect of misfires within the ring blast on dilution in SLC operations was examined. The results showed that, in a normal ring design with seven holes, a misfire in the middle charge of the ring had a greater impact on dilution compared to misfires in any of the other charges (Lapčević et al., 2024). DeGagné (2005) used Particle Flow Code 3D (PFC3D) to examine the effects of non-uniform PSD on material flow by considering four different ore size classes. The results were compared with the classical Kvapil curves (Kvapil, 1982, 1992). The findings indicated that early dilution originates predominantly from behind the ring, while later dilution develops from above the ring, with material flow broadly consistent with an extended Kvapil ellipsoidal framework rather than a strict ellipsoidal form (DeGagné, 2005).
LS-DYNA has also been used to simulate the flow of blasted materials by coupling a particle blast model with the DEM geometry. The gravity flow results showed that larger fragments may cause the flow pattern to deviate from the elliptical shape (Yi et al., 2022). Figure 6 shows the displacement contours in the Z-direction for fragmented ore and waste at the 54.9% extraction rate from the model.

Displacement contours in the Z-direction of fragmented (a) ore and (b) waste unit at the 54.9% extraction rate (Yi et al., 2022).

Sublevel caving (SLC) models with the ring inclination angle at (a) 70°, (b) 80° and (c) 90° (Firouzabadi et al., 2023).

Schematic representation of the ring design (left) used to model the effect of particle size on cave flow, where smaller particles within the ring boundary represent blasted ore and larger particles outside the ring boundary represent caved waste.
YADE is another DEM program that can be used to simulate material flow in SLC operations. Firouzabadi et al. (2023) used YADE to investigate the effects of ring porosity, as well as ring inclination, on gravity-driven material flow and dilution in a sublevel cave mine. Their results showed that increasing ring porosity reduces dilution and increases the longitudinal extent of the extraction zone, whereas lower ring porosity of the blasted ore material leads to earlier dilution entry and expansion of the extraction zone toward the caved waste. The study also demonstrated that increasing ring inclination results in higher dilution and alters the shape of the extraction zone (Firouzabadi et al., 2023). Figure 7 shows an example of Firouzabadi et al. (2023) simulations with different ring inclination angles.
Despite the extensive use of DEM with explicit contact-force formulations to investigate gravity flow and dilution in sublevel caving, their high computational cost often limits large-scale parametric analyses and repeated calibration studies. Blender is a new tool based on a rigid-body physics engine which can potentially provide a significant improvement in computational efficiency. In Blender, contact deformation is represented through particle penetration constraints, whereas in conventional DEM formulations, deformation is commonly simulated through particle overlap; while in both approaches, particle rigidity is assumed to simplify the calculations. The key distinction, however, lies in the level of physical resolution and computational cost. Conventional DEM explicitly resolves contact forces and force–displacement relationships, which is essential for detailed contact-mechanics studies but computationally expensive for large particle assemblies. In contrast, Blender employs a reduced-order, constraint-based rigid-body formulation that preserves the essential kinematic behaviours governing gravity-driven flow while enabling significantly faster model setup, calibration, and simulations. Accordingly, the objective of this research is not to replace high-fidelity DEM, but to develop and evaluate a computationally efficient particle-based modelling framework suitable for systematic investigation of gravity-driven particle flow, dilution, and ore recovery at the drawpoint in SLC operations, with particular emphasis on the influence of PSD. Fragmentation size distributions used as input to the stope flow simulations may be obtained from blast design and fragmentation prediction models, such as the URBM, or from field measurements. The modelling framework is verified and calibrated using full-scale marker trial data from the EHM (Campbell, 2019) and DEM-based dilution results calibrated to the flow characteristics of the Ridgeway Mine (DeGagné, 2005). In this context, Blender is positioned as a complementary and conceptually consistent reduced-order DEM tool for large-scale parametric studies rather than a substitute for detailed contact-force modelling.
Methodology
As discussed, much of the previous research has relied on DEM-based models to simulate the flow of blasted particles to the drawpoint in sublevel caving operations. In this research, the Blender physics engine is adopted to evaluate its capability for simulating material flow within the same DEM-based conceptual framework. Blender employs contact interactions resolved through simplified contact constraints governed by physically motivated parameters such as friction, coefficient of restitution and damping. In practice, similarly to conventional DEM-based approaches, it also relies on calibrated parameters and involve simplifying assumptions, particularly when applied at field scale. Given that gravity is the dominant driver of particle motion in caving systems, a suitably calibrated system is necessary to realistically reproduce the essential flow behaviour relevant to dilution analysis. The primary advantages of the Blender-based approach include its computational efficiency, fully three-dimensional implementation, and the ability to monitor particle motion in real time throughout the simulation. Recent applications of Blender in geomechanics and granular modelling include simulations of unreinforced masonry behaviour during earthquakes (Han, 2023); simulation of soil movement (He and Zheng, 2020); and simulation of packing of aggregates (Roberto and Elisa, 2022).
Blender physics engine
The Blender physics engine is a sophisticated integration of computational physics within a comprehensive 3D content creation suite. This physics engine integrates the open-source Bullet Physics Library (Coumans, 2014) for rigid body dynamics alongside separate solvers for soft body deformation, cloth and fluid mechanics (Foundation, 2024). Bullet uses a constraint-based, impulse-driven approach to handle contact between bodies, covering broad- and narrow-phase collision detection, non-penetration enforcement, Coulomb friction, restitution and linear/angular damping, with particle states advanced through a semi-implicit Euler integration scheme. The complete mathematical treatment of rigid body kinematics, contact force decomposition and collision impulse formulation is provided by Coumans (2014) and Catto (2005).
This research investigates the application of Bullet Physics Engine (BPE) as a computationally efficient alternative to conventional DEM implementations for simulating particle interactions relevant to material flow in sublevel caving. In both DEM and BPE-based simulations, particles are represented as rigid bodies. In DEM frameworks, however, particles may be treated as either elastic or rigid depending on the adopted contact formulation; in simulations involving spherical or near-spherical particles, rigid-particle representations are commonly used. Classical DEM formulations compute contact forces using prescribed normal and shear force laws based on particle overlaps, where the overlap is interpreted as a measure of contact deformation. In contrast, the Bullet engine resolves particle interactions using a constraint-based contact formulation that enforces non-penetration conditions through iterative constraint solvers rather than explicit force–displacement contact laws. As a result, BPE can reproduce bulk granular behaviour and gravity-driven flow patterns with substantially lower computational cost, making it suitable for large-scale parametric studies, while not explicitly resolving particle-scale contact mechanics in the same manner as physically based DEM models.
Modelling setup in Blender
This section outlines a complete workflow for establishing a stope cave flow model.
Firstly, all geometry transformations must be applied. For the bunker-shaped stope geometry, a cuboid type was selected as the base and modified accordingly. The geometry must form a continuous, enclosed volume to contain all particles during the simulation. After preparing the stope shape to accommodate both ore and waste materials, a separate geometry was created within the stope for the ore body. The ore body geometry should reflect the case study ring blast design parameters, including burden size (geometry depth), height and width. It is essential to pack ore and waste separately to avoid premixing.
After establishing the stope geometry, a surface mesh is applied to represent the solid boundaries of the model. The mesh is used solely to define the collision surface, and particles interact with it as a continuous solid boundary rather than through discrete openings between mesh elements. However, excessively coarse or poorly defined meshes, particularly those with thin walls, non-manifold edges or insufficient temporal resolution, can lead to missed collision detection (often referred to as particle leakage or tunnelling), allowing particles to pass through the boundary during the simulation. Therefore, appropriate mesh quality and collision settings are required to ensure stable and physically consistent particle containment during the cave flow process. Based on the stope shape and particle-size variations derived from the ring design, particles of different sizes are generated and positioned within the geometry. Finer particles are assigned to locations with higher powder factors (smaller charge spacing), while coarser particles are placed in areas with lower powder factors. Figure 8 shows the EHM ring design (left) with the corresponding Blender simulation representation (right), showing how the particle sizes vary based on the charge spacing within the model ring layout, which influences particle-size variations in the model.

Modelling setup in Blender.
Once particles of different shapes and sizes are applied to the geometry, several model parameters must be defined for active particles, including friction, mass, bounciness, linear and angular damping and collision margin.
In addition, the collision shape of particles must be specified to define how particles interact during the simulation. In this study, a convex hull collision shape was used for all particles, as it enables accurate detection of multi-face contacts while maintaining reasonable computational efficiency, which is critical for realistically capturing particle interactions during gravity flow.
After the physics parameters are defined, an initial packing stage is performed prior to simulating cave flow. Ore and waste particles are first packed separately within the stope using an internal separator surface that temporarily prevents mixing and ensures controlled initial placement of the two materials. Once a stable packing configuration is achieved, the separator surface is removed, and the waste material is allowed to settle under gravity against the ore. After the combined packing has stabilised, the temporary retaining surface (cap) at the bottom of the stope geometry is removed, enabling gravity-driven flow of particles towards the drawpoint.
Particles presenting at the drawpoint were removed periodically to simulate the extraction of material through the action of a bucket loading. The simulation continues until a specified tonnage of material was extracted. Blender stores all particles with their unique IDs and locations during the simulation. Using a Python script, particle locations across different time steps can be extracted. This data file is then used for subsequent analysis related to dilution calculation and cave flow behaviours.
Figure 9 presents a flowchart showing the sequential steps applied in Blender to prepare the model. The ore and waste particles can be modelled using either uniform or non-uniform PSDs.
Discussion and results
Two case studies were carried out to investigate the effects of particle-size variations on the dilution at the draw point in SLC operations. The first case study is based on the marker-trial data from the EHM reported by Campbell (2019). The second case study compares dilution results obtained from a PFC model (DeGagné, 2005), where the cave flow geometry was calibrated against data from the Ridgeway Mine. For both cases, the initial step involved calibrating modelling parameters for the physics engine. Subsequently, different particle sizes were applied using the same calibrated setup to evaluate the effects of particle sizes on dilution.
Access to a reliable dataset is essential to calibrate the model. Material-flow datasets in SLC operations generally fall into two categories. The first category is marker-trial data, which captures the cave flow characteristics in the ore, but usually does not provide detailed dilution–extraction curves. This limitation often occurs because, in many mines, it is difficult to consistently differentiates between ore and waste during mucking. In some cases (e.g. Kiruna iron ore mines (Wimmer, 2012)), density differences between ore and waste can allow dilution to be derived from bucket weights, but this is not common practice. The second category includes datasets or published studies that provide quantitative calibration targets beyond cave-flow geometry, most commonly in the form of dilution versus extraction relationships derived through numerical modelling rather than direct underground measurements. In such cases, flow characteristics are first calibrated against available marker-trial or flow-envelope data, and the calibrated models are then used to infer dilution behaviour, as exemplified by the DeGagné (2005) case. Fully resolved dilution-extraction datasets based solely on underground measurements remain rare for sublevel caving operations. In this study, both calibration pathways are considered.
Before the calibration, it is useful to identify model parameters that most strongly control particle flow behaviours. Two indicators were used to assess the behaviours, including (1) the angle of repose of the material at rest at the drawpoint, and (2) the particle movement (displacement) after the early stage of extraction. In Blender rigid body simulation, each frame represents one visualisation step. Within each frame, the solver performs five sub-steps with 10 iterations per sub-step to calculate particle interactions and positions. Particle displacement was evaluated at frame 200, at which point a mass equivalent to 10% of the original ore tonnage had been extracted (the extracted material included both ore and waste in varying proportions). A parameter sweep was conducted by varying the friction coefficient and damping values between 0 and 1. The bounciness was set to zero to represent perfectly inelastic collisions, as drawpoint flow in sublevel caving is dominated by sustained frictional contacts and confined sliding rather than free-flight elastic impacts. While laboratory drop tests on intact rock fragments may show significant rebound (high bounciness) for isolated collisions, such elastic behaviour is suppressed in the confined, dense granular flow conditions typical of drawpoint environments where particles remain in continuous contact. Initial results showed that the friction coefficient had minimal influence on the angle of repose in these simulations. Therefore, eight scenarios (Table 1A–H) assessed the influence of linear and angular damping values on how the material presents at the drawpoint after 10% of extraction. Here, the angle of repose at 10% extraction is defined as the inclination of the free particle surface relative to the horizontal plane, and particle movement distance is quantified as the average translational displacement of the particle relative to its initial position after 10% of the total extraction has occurred.
Effects of linear and angular damping on angle of repose and particle movement.
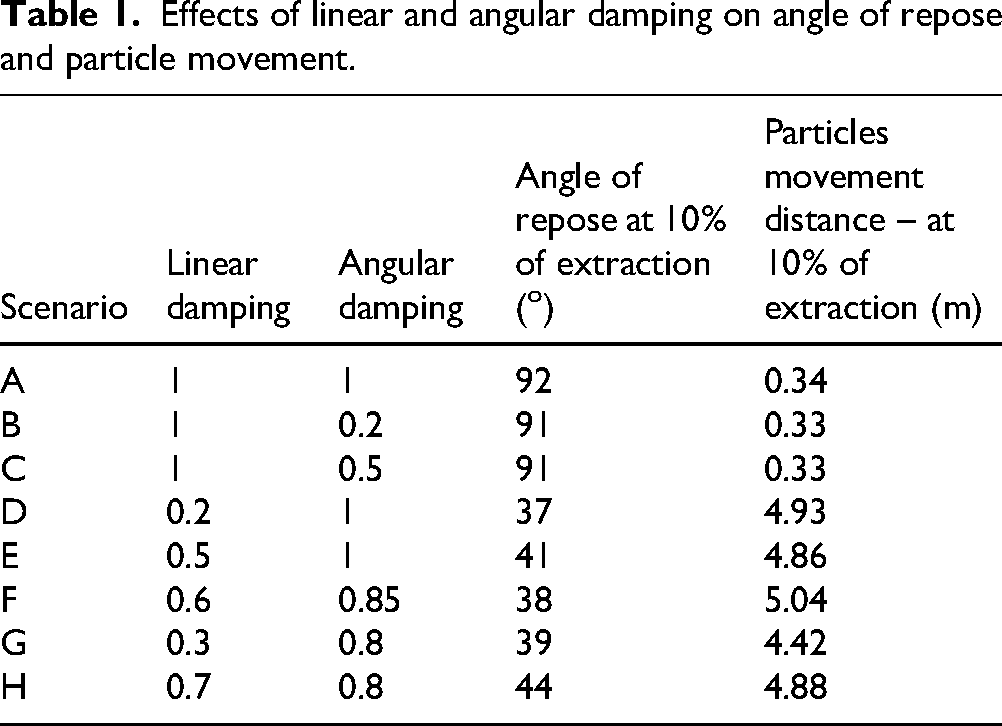
Figure 10 compares the particle flow of Scenarios A and G (Table 1). In Scenarios A–C, linear damping was set to 1.0, which produces an overdamped translational response that strongly suppresses particle movement. Under this extreme condition, particles are unable to slide or rearrange freely under gravity, leading to artificially stable and near-vertical particle configurations and an apparent angle of repose greater than or equal to 90°. This behaviour does not represent a physically realistic angle of repose for loose granular material; rather, it defines the upper bound of the linear-damping sensitivity analysis. As shown in Table 1, linear damping is the primary parameter controlling the angle of repose: decreasing linear damping reduces the angle of repose. Lower linear damping also increases particle movement because it allows particles to translate more freely. Under the tested conditions, where linear damping was held at a relatively high value, variations in angular damping had little influence on the angle of repose and produced only minor changes in particle displacement during the initial stage of extraction. This suggests that, within this parameter range, the effects of angular damping are largely secondary to those of linear damping. However, this does not imply that angular damping is unimportant; rather, its influence may become more evident through interactions with other parameters, whereby it can enhance or reduce the effect of changes in those parameters. Angular damping dissipates rotational kinetic energy and is explicitly implemented in discrete-element formulations to control the decay of particle rotation and its interaction with contact behaviour (Cundall and Strack, 1979). Figure 10 compares the particle flow of Scenarios A and G (Table 1).

Effects of linear and angular damping values on the angle of repose at 10% of extraction.
EHM case study
The first case study uses data from EHM, where marker trials were conducted with markers located within the blasted rings (Campbell, 2019). The marker trials reported recovery of the markers during the excavation of the ring. Along with the recovery of markers from the primary level, recovery of the markers was also recorded for secondary and tertiary levels, being the first and second levels below the blast. Three rings, with ring IDs 1550 XC09 (Ring 38) and 1550 XC11 (Rings 39 and 40), were used by Cambell to form the marker trail baseline. The ring geometries had a burden of 2.6 m, a ring height of 32 m and a maximum width of 15 m, with a charge spacing of 2.7 m and a hole diameter of 102 mm. The explosive density used was 1.1 g/cc. The rock mass was characterised by a tensile strength of 9.2 MPa and a fracture density of 2 fractures/m. The cave flow envelopes of the materials extracted at 200% of the ring tonnage of the three rings in the EHM dataset are presented in Figure 11, which shows that the reconstructed primary-recovery envelopes are concentrated around the central draw region, while the lateral “wings” of the ring are not fully captured in the field-derived envelopes. As reported by Campbell (Campbell, 2019), the primary recovery marker trial results were obtained after more than 4500 t of extraction, while the ore in the blasted ring was only 2850 t. This corresponds to a total extraction of 200% of the ring tonnage, and was therefore selected as the equivalent comparison point between the model results and the actual data.

Primary ore recovery from the stope, where the green area represents the envelopes of extracted ore materials at 200% extraction tonnage for (a) 1550 XC11 Ring 39, (b) 1550 XC11 Ring 40 and (c) 1550 XC09 Ring 38 after Campbell (2019).
Eight simulations were performed with the Blender physics engine using the same geometry while varying the friction and damping parameters. All the scenarios used the same arrangement of particle sizes: ore particles with the radii of 100, 150 and 200 mm, and waste particles with the radii of 250, 300 and 450 mm. The model has ∼90,000 particles.
For the simulations, the friction coefficient was varied from 0.3 to 1.0, and all damping parameters were varied from 0.03 to 0.8. The eight simulation scenarios and their corresponding input parameters are summarised in Table 2.
Input parameters of the Blender simulation.

In Scenarios S1–S3, different damping values were assigned to different particle sizes within each material. For ore, 0.03 was applied to the finest particles, 0.06 to the median-size particles, and 0.09 to the coarsest particles. For waste, 0.5 was applied to the finest waste particles, 0.6 to the median-size waste particles, and 0.7 to the coarsest waste particles. Therefore, the ranges in Table 2 reflect the minimum-to-maximum damping values across the defined particle sizes, rather than a single uniform value applied to all particles.
Figure 12 illustrates the recovery envelopes for the simulations, showing the original location of all the particles that have been extracted after 200% of the ore tonnage. Among these, Scenarios S2 and S7, where higher damping values were applied to the coarser particles regardless of whether they are ore or waste, show the largest recovery envelopes, indicating that a greater proportion of the blasted ring had been recovered. Scenario S8 also produces a comparably large recovery envelope; however, in this case, a uniform linear damping value of 0.3 was applied to all particles (ore and waste), rather than using size-dependent damping. Overall, friction exerts the first-order control on the envelope. The largest envelopes occur at moderate friction (friction = 0.6), whereas smaller envelopes are produced at lower friction at S1 (friction = 1.0) and S5 (friction = 0.3). The comparison between S3 and S5 (friction = 0.3 in both scenarios) further shows that the damping configuration modifies the envelope, as lower ore damping in S3 leads to a greater recovery envelope. To enable comparison with the EHM data, the primary recovery envelopes shown in Figure 11 were first converted to 2D front view images and then superimposed onto the simulation results. As an example, Figure 12 presents the primary recovery envelopes for Ring 40, where the green hatched lines represent the envelopes of caved material derived from marker trial data.

The ore recovery envelopes for the simulations at 200% extraction (red) with the marker trial envelope for Ring 40 (green) overlaid.
The consistently strong wing recovery in the simulations, compared with the typically lower wing recovery suggested by the marker-trial envelope, should be interpreted cautiously because the field envelope is reconstructed from recovered markers only and marker trials rarely achieve 100% recovery, so the lateral margins (‘wings’) are often less well constrained than the central draw region. In the real stope, it is also probable that some wing material was temporarily hanged up during flow, reducing its apparent recovery at the measurement point, even if its eventual recovery footprint could be closer to the simulated shape. Finally, the Blender rigid-body representation involves simplifications of particle contact and deformation processes, which may reduce lateral arching effects and, therefore, over-predict wing mobilisation relative to the field interpretation.
For a more detailed statistical analysis of the variation between the measured and modelled envelopes, a uniform grid with a cell area of 2 m2 was applied to the plots, as illustrated in Figure 13. For each ring, the green area derived from the marker trial is treated as the ground truth for the envelope of the extracted materials from the ring. The following quantities are determined:
True Positives (TP): Grid cells that are inside the marker-trial (green) envelope and also inside the simulated caved envelope (red dots). False Positives (FP): Grid cells that are outside the marker-trial (green) envelope but inside the simulated caved envelope. Total ground-truth cells (NGT): The total number of grid cells inside the marker-trial (green) envelope (i.e. the marker-recovered draw region). False Negatives (FN): Ground-truth cells not captured by the simulation, calculated as FN = NGT − TP.

S1 scenario with a uniform grid applied, considering the boundaries of (a) Ring 38, (b) Ring 39 and (c) Ring 40.
As examples, the values of NGT for the three rings shown in Figure 13 are Ring 38 = 55, Ring 39 = 48 and Ring 40 = 51.
For all scenarios, Precision, Recall, F1-score and Intersection over Union (IoU) were calculated.
Precision (equation (1)) describes how ‘clean’ the simulation is with respect to the field boundary. A high precision means that most of the grid cells predicted as part of the draw by the simulation fall inside the marker-recovered boundary, while a low precision means that a larger portion of the simulated draw area extends outside the field-data boundary (i.e. more over-extension beyond the true draw envelope). Therefore, higher precision is desirable because it indicates less simulated draw occurring in locations not supported by the marker trials. Precision is calculated as follows:
Recall (equation (2)) describes how completely the simulation captures the field draw shape. A high recall means the simulation covers most of the green (marker-recovered) draw region, while a low recall means the simulation misses part of the true draw region (under-coverage). Physically, higher recall indicates the model reproduces the extent of the observed draw more completely, whereas lower recall suggests the simulated draw is too small or does not reach parts of the draw zone that are observed in the mine. Recall is defined as follows:
The F1-score (equation (3)) combines precision and recall into a single measure of agreement. It is not exactly the same as overlap, but it is strongly related: F1 becomes high only when the simulation both covers most of the field draw region (high recall) and does not extend too much outside the field boundary (high precision). In this work, a higher F1-score means the simulated draw shape has a better overall match to the marker-recovered draw envelope, while a lower F1-score indicates either missing parts of the true draw (low recall), extending beyond the field boundary (low precision), or both. Because it balances these two error types, F1 is used as the primary metric for selecting the best calibration scenario. The F1-score is computed as follows:
Finally, IoU (equation (4)), also known as the Jaccard index, is a direct measure of spatial overlap between the simulated and field draw regions (Padilla et al., 2021). IoU can be interpreted as ‘the fraction of the combined area that overlaps’: it increases when the intersection between simulation and field boundary becomes larger and decreases when either the simulation extends outside the field boundary (FP increases) or misses parts of the field draw region (FN increases). Therefore, higher IoU indicates stronger geometric agreement (greater overlap), whereas lower IoU indicates poorer agreement due to over-extension, under-coverage or both. IoU is calculated as follows:
Although recall is related to overlap, it is not the same as IoU. In this application, recall measures how completely the simulated draw covers the marker-recovered (green) draw region, that is, the proportion of green grid cells that are captured by the simulation. Therefore, a higher recall indicates less under-coverage (fewer parts of the field draw region missed by the model), but it does not penalise the simulated draw area that extends outside the field boundary. In contrast, IoU is a stricter overlap measure because it accounts for both under-coverage (missed green cells) and over-extension beyond the field-data boundary. For this reason, recall is useful for evaluating whether the model reproduces the draw extent, while IoU evaluates the overall geometric overlap between simulated and field draw shapes.
Tables 3 to 5 present the results of the statistical analysis for Rings 38, 39 and 40. The ranking of different scenarios is based on their F1 value.
Ring 38 statistical metrics and ranking.
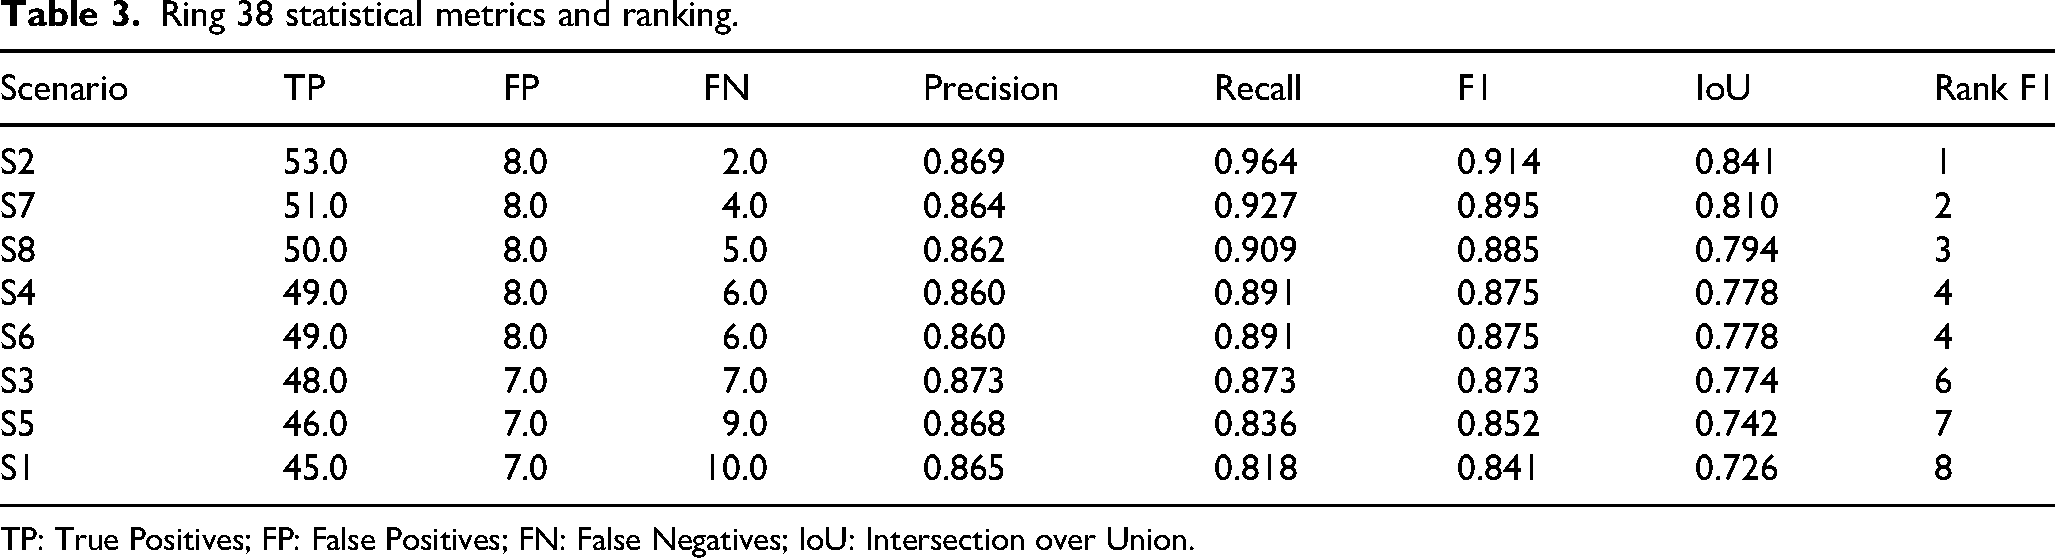
TP: True Positives; FP: False Positives; FN: False Negatives; IoU: Intersection over Union.
Ring 39 statistical metrics and ranking.
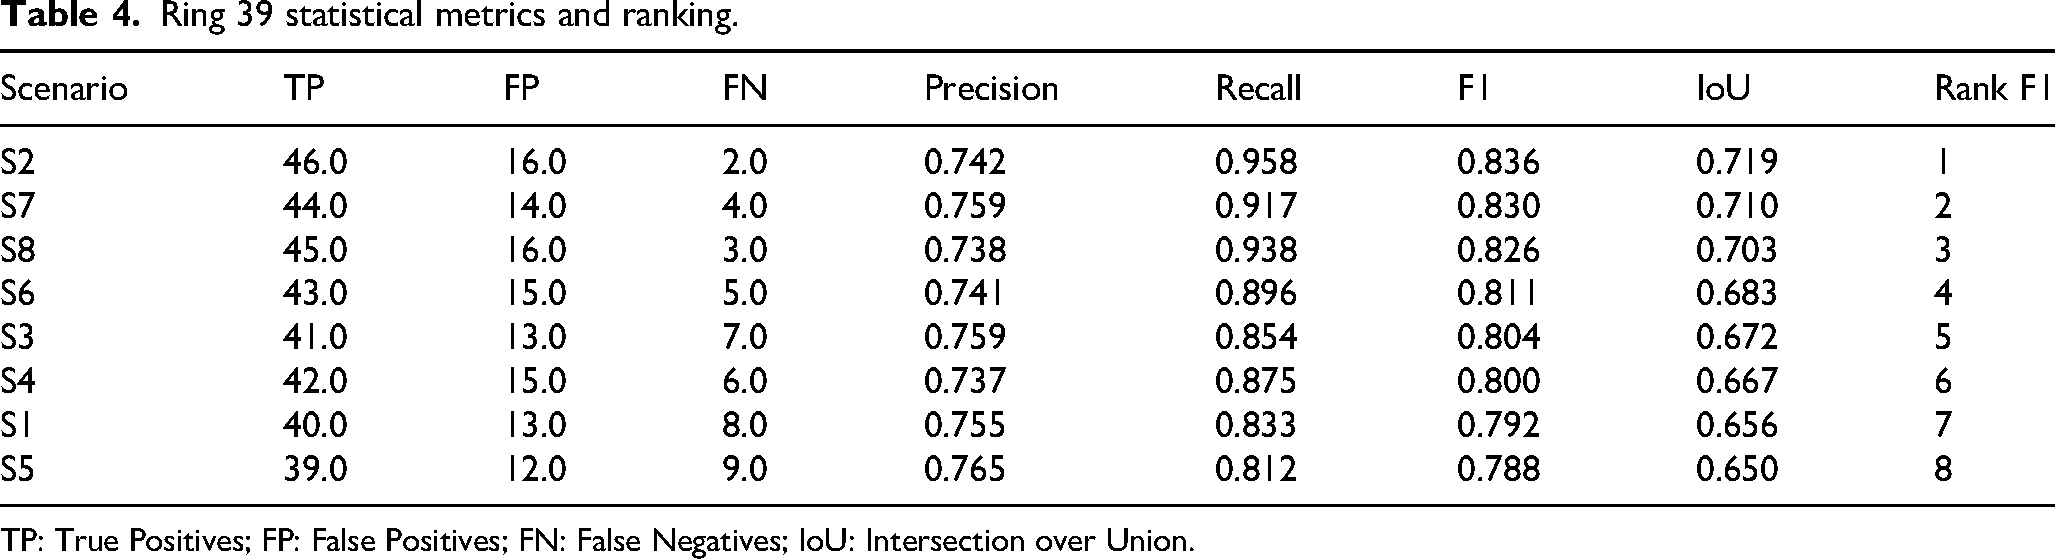
TP: True Positives; FP: False Positives; FN: False Negatives; IoU: Intersection over Union.
Ring 40 statistical metrics and ranking.
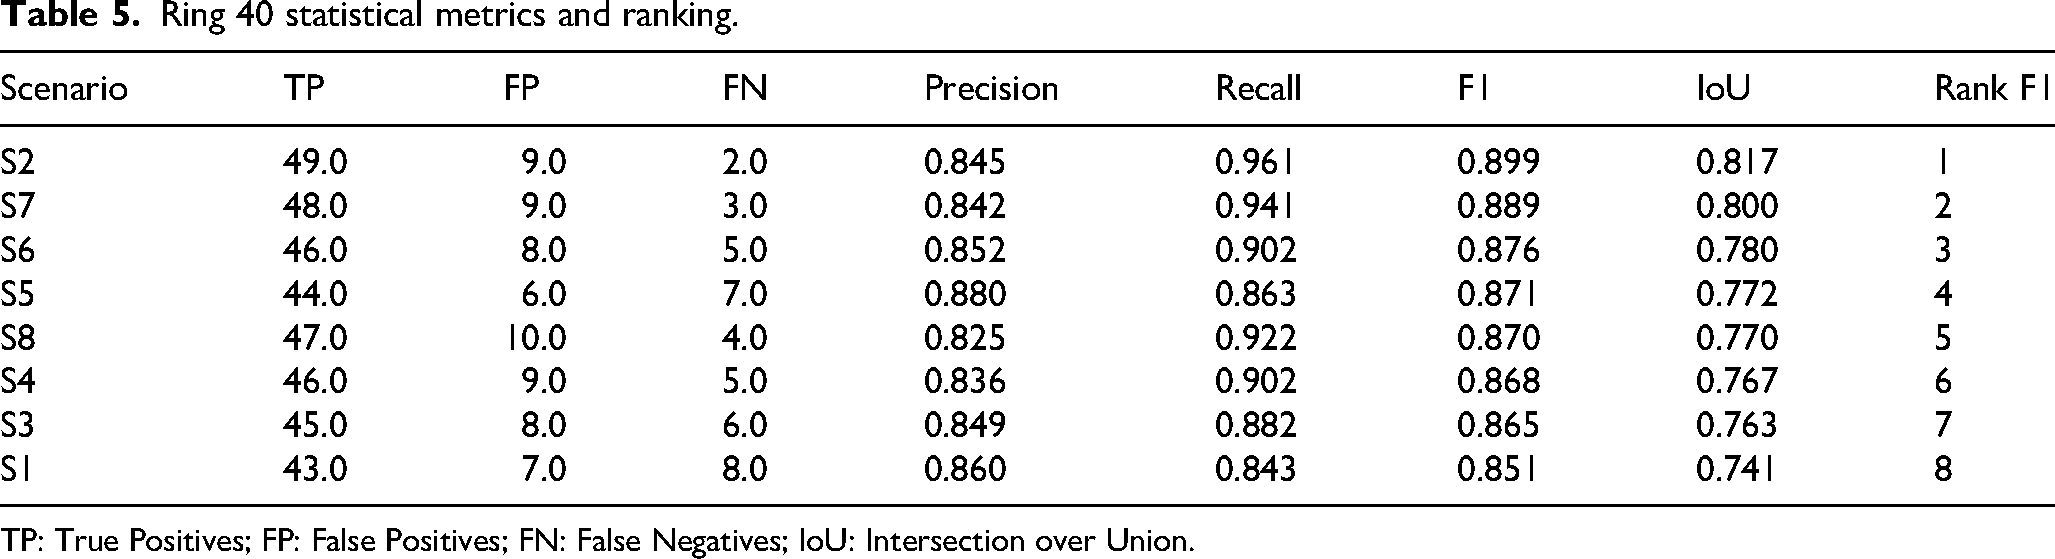
TP: True Positives; FP: False Positives; FN: False Negatives; IoU: Intersection over Union.
For Ring 38, Scenario S2 achieved the highest F1-score (0.914) and is ranked first. This scenario shows high recall (0.964) together with good precision (0.869), meaning that most of the true draw area is captured in the model while the part of the simulated flow shape that extends outside the Ring 38 marker trial boundary is limited. Scenario S7 is ranked second (F1 = 0.895), followed by Scenario S8 (F1 = 0.885). Scenarios S4 and S6 show identical performance (both F1 = 0.875), indicating only small sensitivity to parameter changes. Overall, Scenario S2 provides the best agreement with the ground-truth envelope for Ring 38. All three top-ranked scenarios for Ring 38 (S2, S7 and S8) share a particle-friction value of 0.6 (Table 2), which suggests that a moderate friction level provides the best overall match to the marker-trial envelope in this calibration set, rather than this being purely coincidental. In contrast, the lowest-friction cases (S3 and S5; friction = 0.3) and the highest-friction case (S1; friction = 1.0) tend to deviate more from the ground-truth envelope, indicating that the model response is sensitive to friction and that extreme values can either over-mobilise or inhibit draw relative to the field envelope. Within the friction = 0.6 group, performance still varies because damping settings modify the recovery shape; for example, S7 applies size-dependent linear damping that increases from fine to coarse, whereas S8 uses a uniform linear damping value (0.3), which leads to a larger envelope but also increased waste entrainment. Overall, the results indicate that friction equal to 0.6 provides the most reliable baseline for reproducing the field recovery envelope, with damping acting as a secondary control on envelope extent and ore-waste mixing.
For Ring 39, Scenario S2 is again ranked first with the highest F1-score (0.836). This result is mainly driven by its very high recall (0.958), showing that the simulated draw closely covers the ground-truth reference area. Its precision is 0.742, indicating that a noticeable part of the simulated flow shape extends outside the Ring 39 boundary. Scenario S7 is ranked second with very similar performance (F1 = 0.830), followed by Scenario S8 (F1 = 0.826) and Scenario S6 (F1 = 0.811). Scenarios with lower overall balance, such as S1 (F1 = 0.792) and S5 (F1 = 0.788), are ranked lower. These results indicate that for Ring 39, scenarios that better capture the actual draw extent (higher recall) performs more favourably, provided the area extending outside the field-data boundary remains reasonably controlled. For Ring 39, the lower top F1-score reflects the fact that the marker-trial envelope shows less recovery from the ring wings than in Ring 38. In contrast, the simulations tend to show more complete wing recovery, which increases the area captured outside the field envelope. As a result, even though the best scenario for Ring 39 achieves very high recall, the mismatch at the wing margins reduces the overall F1-score compared with cases where the field envelope indicates stronger wing recovery.
For Ring 40, Scenario S2 is also ranked first with the highest F1-score (0.899). It combines high recall (0.961) with good precision (0.845), resulting in the best overall match to the ground-truth envelope while keeping the area of the simulated flow shape that extends outside the Ring 40 boundary relatively limited. Scenario S7 is ranked second (F1 = 0.889), followed by Scenario S6 (F1 = 0.876). The remaining scenarios show lower F1-scores, but the differences are relatively small, indicating moderate sensitivity of Ring 40 to changes in simulation parameters.
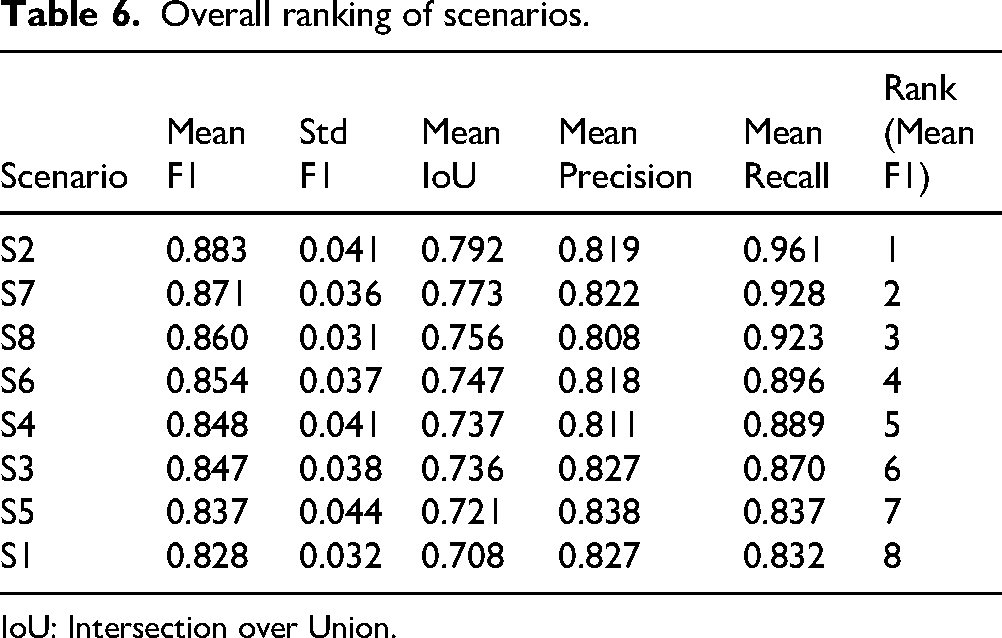
To determine the best-performing model overall, the results from all three rings were averaged, as shown in Table 6.
Overall ranking of scenarios.
IoU: Intersection over Union.
Considering all rings together, the overall ranking based on average F1-score shows that Scenario S2 performs the best overall, followed by Scenarios S7 and S8. Scenario S2 demonstrates consistently strong performance across all rings, with high average precision, recall and IoU values. This is likely because S2 applies higher damping to waste, which reduces waste mobility and allows a larger proportion of ore, particularly in the upper central draw column, to be mobilised and recovered, improving agreement with the marker-trial envelopes. In real mining conditions, after the completion of ore extraction from a previous stope, the overlying waste typically reaches a stable condition before the next ring is blasted. When a new ore ring is blasted, the fragmented ore pushes against this relatively stable waste mass and may cause a certain degree of compaction. As a result, the waste is less mobile, while the ore experiences greater movement. This behaviour is well represented in Scenario S2, where higher damping limits waste mobility and lower damping allows the ore to move more freely. In addition, finer particles are expected to move faster and more freely during cave flow. Therefore, lower damping was applied to finer ore particles, which further improves the representation of realistic material behaviour in the stope.
Scenario S7, which is ranked the second overall, follows a similar physical logic. In this scenario, lower damping is also applied to finer particles. Consequently, the overall flow behaviour in Scenario S7 is governed by the same mechanism as Scenario S2, where waste remains relatively stable while ore is more mobile.
From this point onward, Scenario S2 is referred to as the baseline case. Two additional scenarios using the same parameters were simulated, where the ore particle sizes were increased by 10% and 20% to evaluate the effect of particle size on dilution. In the 10% increase scenario, the ore particle radii were 110, 165 and 220 mm, and in the 20% increase scenario, the ore particle radii were 120, 180 and 240 mm, while in both of these two cases waste radii remained at 250, 300 and 450 mm.
Figure 14(a) shows that increasing ore particle size leads to higher cumulative dilution at a given extraction percentage, with the largest differences occurring at low to mid extraction. As extraction increases, the curves progressively converge, and the influence of ore size becomes small at high extraction levels. This trend can be explained by the reduced mobility of coarser ore fragments: larger ore particles are less mobilised and reach the drawpoint more slowly, which delays ore discharge and provides more time for waste to migrate from the sides, back, and top of the ore body and enter the draw, thereby increasing dilution. The smaller difference between the 10% and 20% cases compared with the difference between the baseline and 10% cases suggests a diminishing sensitivity of dilution to further increases in ore size, consistent with the system tending toward more similar flow behaviour as the ore–waste size ratio becomes less contrasted.

The effect of ore particle size on (a) dilution and (b) recovery in the Ernest Henry Mine (EHM) baseline models.
Figure 14(b) plots the cumulative percentage of ore recovered at each extraction percentage, are consistent with the dilution behaviour. At the same extraction percentage, scenarios with higher dilution contain a larger proportion of waste in the extracted material; therefore, the recovered ore percentage decreases as ore particle size increases. The cumulative dilution and recovered ore values at selected extraction stages are summarised in Table 7.
Dilution and recovery data for the baseline Ernest Henry Mine (EHM) model run with increasing ore particle sizes.
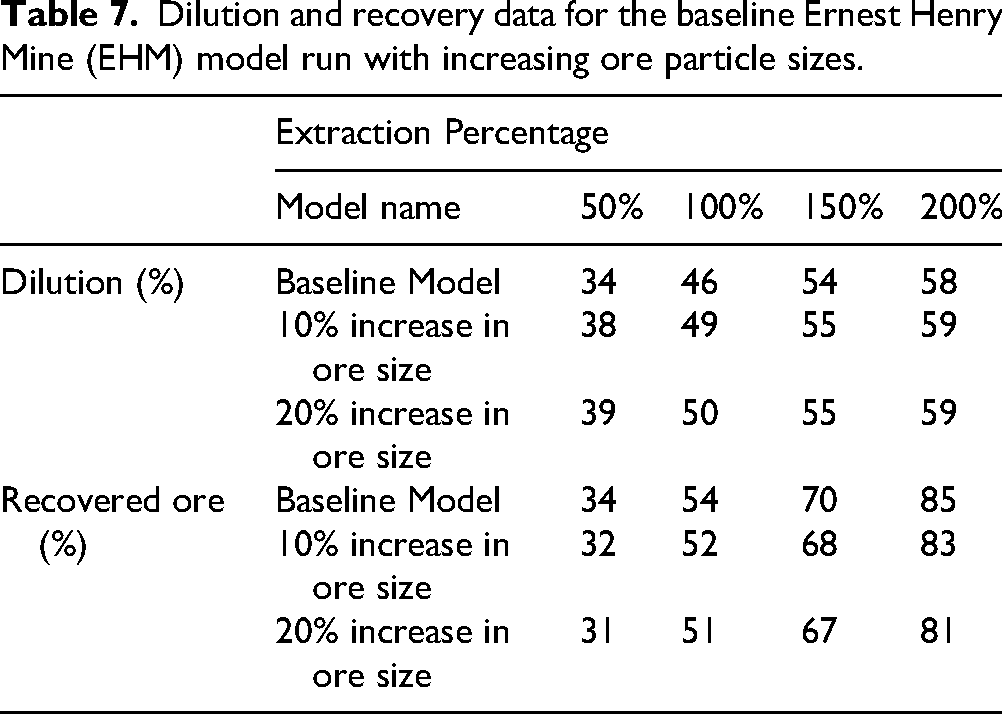
Table 7 and Figure 14(a) show that dilution increases with ore size at all reported extraction stages. At 50% extraction, dilution increases from 34% in the baseline model to 38% and 39% for the 10% and 20% size increase scenarios, corresponding to relative increases of 12.1% and 14.6%, respectively. The same trend continues at higher extraction levels (100%–200%). Dilution remains higher in the 10% and 20% ore-size-increase scenarios, with an overall increase of ∼6%–8% relative to the baseline model. Although the absolute differences between scenarios are small and the curves become closer at higher extraction levels, the trend is consistent, indicating that increasing ore fragment size leads to higher cumulative dilution throughout the draw. In addition, Figure 14(a) shows the occurrence of earlier dilution entry in the simulations with larger ore particles. The recovered ore results shown in Table 7 and Figure 14(b) are consistent with the dilution behaviour. Increasing ore particle size results in a lower recovered ore percentage at the same extraction percentage, because a larger fraction of the extracted material is waste when dilution is higher. The recovery at 50% extraction indicates that, in the first 50% of the draw, 34% of the total ore is recovered in the base case. At this extraction, recovered ore decreases to 32% and 31% for the 10% and 20% ore-size increase scenarios, corresponding to relative decreases of ∼5.1% and 7.6%, respectively, compared with the base model. At 100%, 150% and 200% extraction levels, recovered ore declines from 54% to 85% in the baseline model to 52%–83% for the 10% size increase and 51%–81% for the 20% size increase scenarios, representing relative reductions of ∼2.7%–4.9% and 4.3%–6.1%, respectively. Similar to the dilution curves, three recovery curves gradually converge as extraction increases, suggesting that the influence of ore size is most evident during the early to mid-stages of extraction and becomes less pronounced at high extraction levels.
DeGagné case study
In the DeGagné case study of the Ridgeway Mine (DeGagné, 2005), PFC3D was employed to simulate cave flow of non-uniform spherical particles with radii ranging from 0.15 to 0.45 m. A half-scale model was used, with a total height of 42 m including both ore and waste, and a width of 18.3 m, as illustrated in Figure 15. To replicate the effects of ring blasting, finer particles were placed at the bottom of the ring, and particle size was progressively increased with height. All waste particles are shown in yellow and have a radius of 0.45 m. The brown, purple and red particles represent ore spheres with radii of 0.15, 0.25 and 0.35 m, respectively.

DeGagné case study model, where brown, purple, red and yellow particles represent fine, medium, coarse and very coarse size particles, respectively, after (DeGagné, 2005).
The cave flow envelope obtained from the PFC simulations was compared with the draw shape derived from recovered markers. In the modelling setup, a burden of 4.3 m was applied. The specific gravity of the ore was assumed to be 3.2, while the specific gravity of waste was 2.7. A friction coefficient of 0.3 was applied to both the spherical particles and the walls.
In this work, a Blender model was used to replicate the DeGagné case study using the same geometry and PSDs. Both soft and hard boundaries between ore and waste were considered to identify the configuration that best reproduces the observed variation in dilution at different extraction tonnages. In total, 21 simulation scenarios were performed to determine the optimal setup in Blender. Both spherical particles and 12-faced dodecahedral particles were implemented. The soft and hard ore-waste boundary configurations are illustrated in Figure 16, where the black circles highlight the key difference in the boundary geometry between the models.

Differences in ore-waste boundary configurations: (a) hard boundary and (b) soft boundary.
In the hard-boundary configuration, the hashed blue region in Figure 16(a) is treated as intact rock (not blasted). This geometry is consistent with the mining sequence shown in Figures 1 and 5, where the lower ring remains solid during extraction of the current level and therefore acts as a rigid constraint on material movement. To the contrary, the soft-boundary configuration shown in Figure 16(b) may assist in isolating the behaviour of ring wing ore material adjacent to the drawpoint by reducing the geometrical constraints imposed by the lower-ring apex, thereby allowing the mobility of this marginal ore zone and its interaction with waste to be examined independently from the intact underlying rock.
The corresponding input parameters for 21 simulations are summarised in Table 8.
Input parameters to calibrate the Blender model against the DeGagné case study.
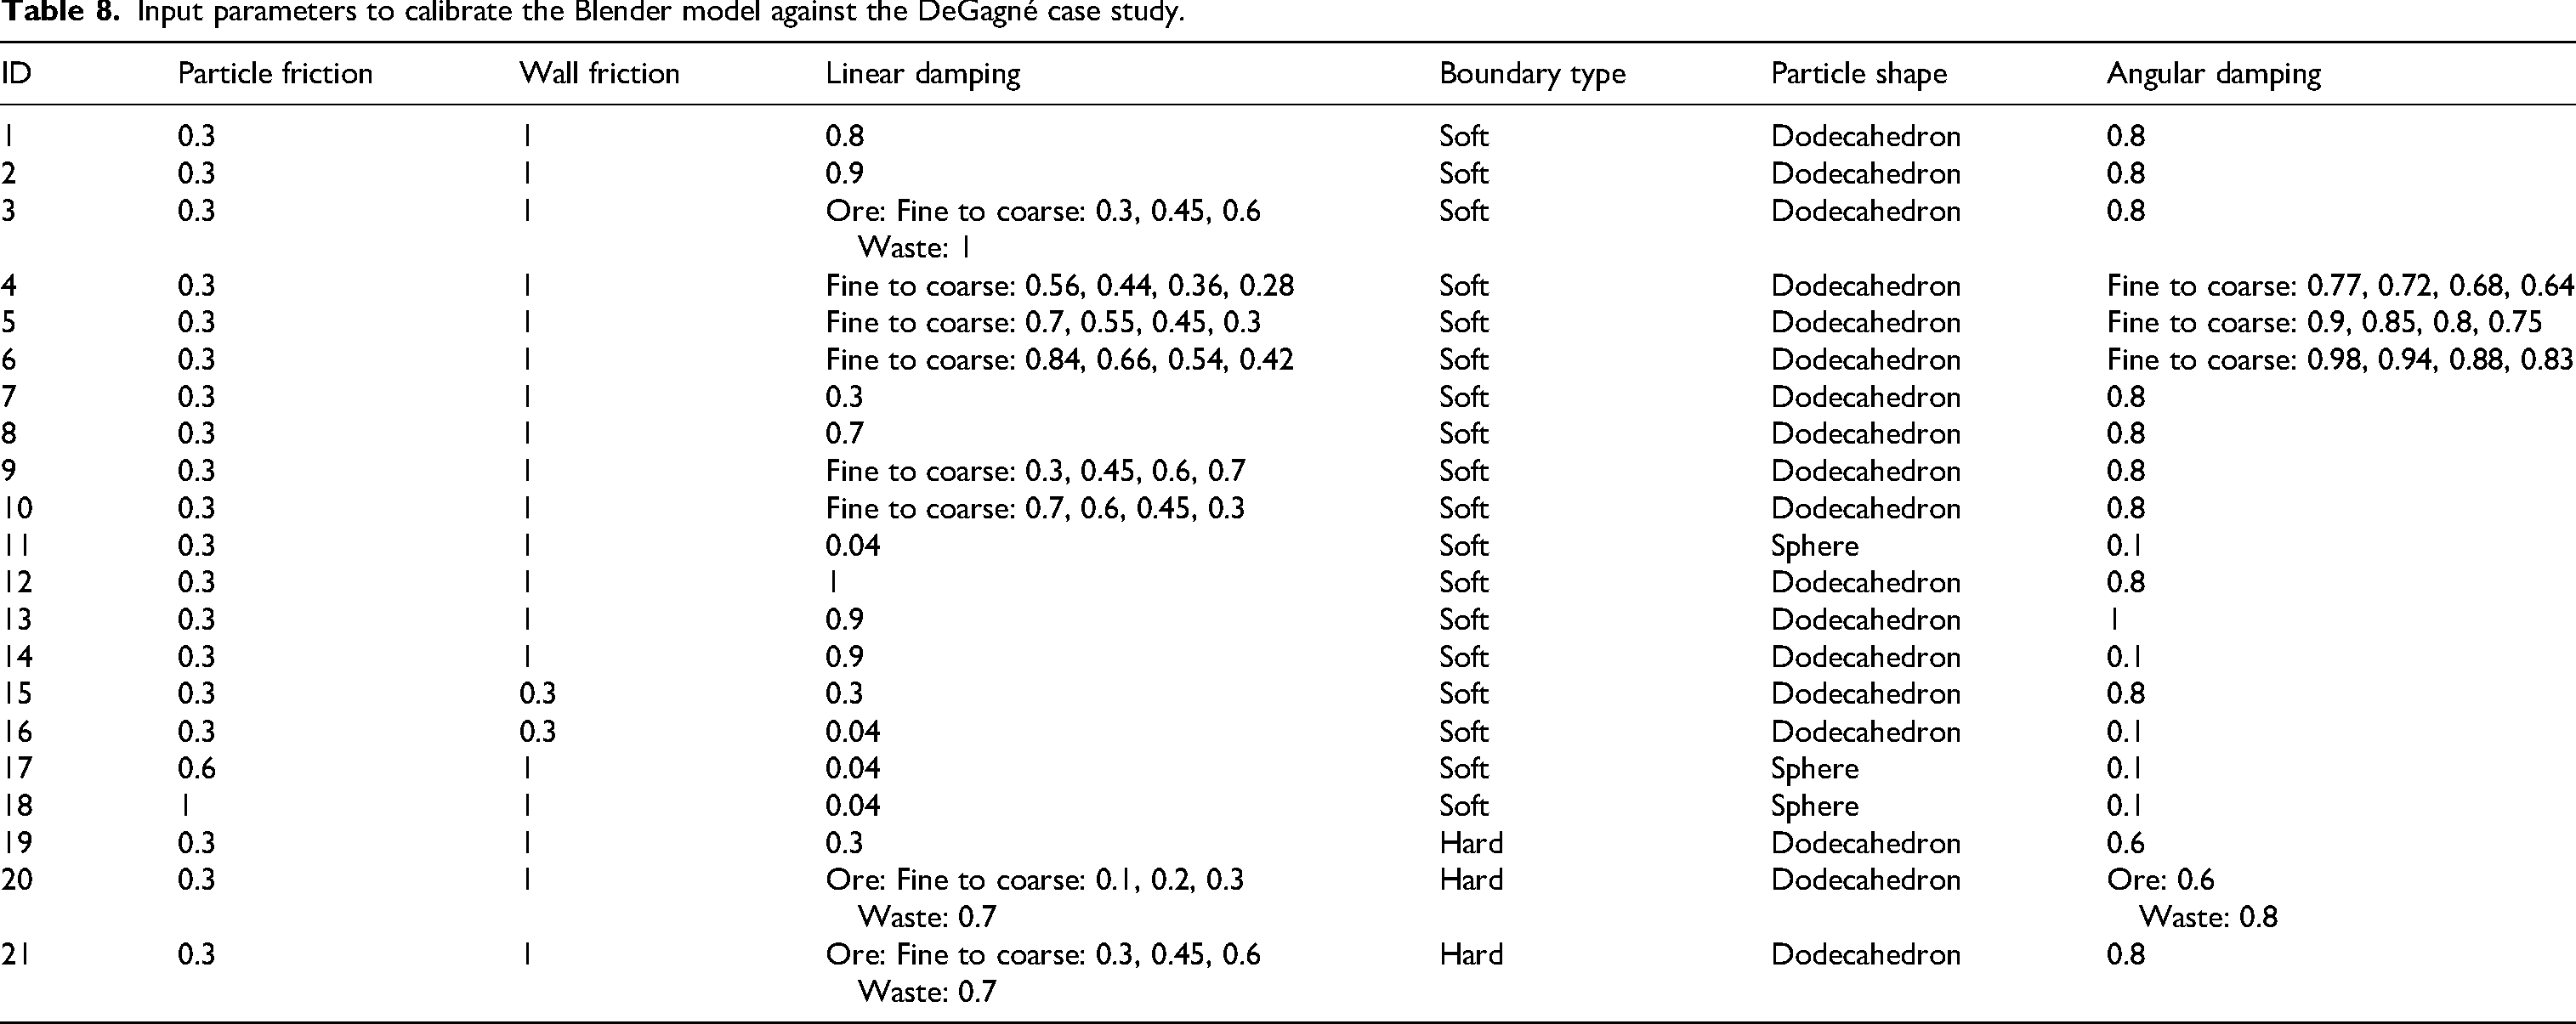
To compare the dilution results reported by DeGagné (2005) with those obtained from the Blender simulations, a total of 21 models were defined and classified into four groups based on particle shape, ore–waste boundary configuration, and parameter-variation strategy. Prior to finalising this set, preliminary calibration tests were conducted to examine a wider range of particle and wall friction values; however, these variations resulted in poorer agreement with the reference flow behaviour and dilution trends and were therefore not included in the final model set. Within the selected 21 models, linear and angular damping were varied systematically across a range of values and size-dependent assignments. Size-dependent damping scenarios were included to assess whether differential energy dissipation between fine and coarse fragments affects waste ingress and dilution behaviour. In the EHM case, applying lower damping to finer particles produced flow patterns that were more comparable to reported marker trial data. However, to test the robustness of this observation and ensure it was not site-specific, additional scenarios were included here in which higher damping was applied to finer particles. These models were intentionally retained to examine how alternative damping distributions influence the dilution curve when benchmarked against the DeGagné reference results. This grouping was introduced to reduce visual and analytical complexity and to avoid presenting an overly crowded comparison of all 21 dilution curves. The first group consists of Models 11, 17 and 18, which all use spherical particles. The second group includes Models 19 to 21, in which a different ore-waste boundary configuration was applied, and dodecahedral particles were used. The third group comprises models in which only a single parameter was varied relative to Model 7; this group includes Models 1, 2, 7, 8, 12, 13, 15 and 16, all employing dodecahedral particles. The fourth group includes Models 3–6, 9 and 10, where different damping values were applied to different particle sizes within each simulation. Figure 17 presents the comparison between the results of the four aforementioned groups and the DeGagné case study; however, only the best- and worst-performing cases, based on their difference relative to the DeGagné dilution curve, are shown to improve the clarity and readability of the figures.

Comparison of dilution results between the DeGagné case study and the simulated models: (a) models with spherical particles; (b) models with a hard ore-waste boundary; (c) models with a soft ore-waste boundary with variations in a single parameter; and (d) models with a soft ore-waste boundary with variations in multiple parameters within each model.
The discrepancies observed in Figure 18 between ∼30% and 100% extraction arise from fundamental differences between the DEM framework used by DeGagné and the rigid-body physics engine implemented in Blender. These differences affect contact resolution and energy dissipation and lead to systematic deviations in the absolute dilution values, particularly during the intermediate stage of extraction. It is important to note that DeGagné (2005) does not report alternative quantitative metrics that allow direct comparison beyond the dilution–extraction curve. In addition, the dilution curve itself was not treated in that study as a high-fidelity calibration target, as the DEM model was primarily tuned to reproduce the overall cave flow shape rather than absolute dilution magnitudes. As a result, the present comparison is necessarily limited to assessing whether the Blender simulations reproduce the general evolution of the dilution trend, rather than achieving point-by-point quantitative agreement. The observed consistency in the overall trend, despite differences in absolute values, therefore, indicates comparable large-scale flow behaviour, while highlighting the limitations of dilution curves as a standalone validation metric.

Comparison of dilution-extraction curves for the best-performing models selected from each group against the reported DeGagné results.
In the spherical-particle group (Figure 17(a)), much higher dilution values were predicted in both scenarios, but results of Model 11 with friction 0.3, linear damping 0.04 match slightly better the DeGagné results. Therefore, Model 11 was selected as the best case for spherical particles. For the hard ore-waste boundary simulations (Figure 17(b)), Model 20 shows a slightly better match compared with the DeGagné results. In the third and fourth groups (Figure 17(c) and (d)), Models 7 and 9 perform slightly better. Therefore, Models 11, 20, 7 and 9 were selected as the final representative ‘best’ cases for each group to perform subsequent simulations.
Figure 18 plots the best-performing model from each group against the reported DeGagné dilution curve. Among the selected cases, Model 20 shows the closest overall agreement, particularly at higher extraction levels. This behaviour is expected, as the hard-boundary configuration restricts lateral waste ingress from the ring wings, thereby delaying waste entry into the drawpoint and resulting in lower dilution compared with the soft-boundary cases. Therefore, it was adopted as the baseline configuration for subsequent simulations. In addition, Model 20 applies lower damping to finer particles and enforces a stronger damping contrast between ore and waste than the other scenarios. This configuration directly reflects the key findings from the EHM calibration, where Scenario S2 achieved the highest overall performance across all rings. In the EHM case, higher damping applied to the waste reduced waste mobility and limited premature waste ingress, allowing a larger proportion of ore, particularly within the central draw column, to be mobilised and recovered, resulting in improved agreement with marker-trial envelopes. Applying the same damping logic to the DeGagné case is, therefore, a direct extension of the EHM calibration rather than a separate tuning exercise. The improved agreement observed for Model 20 shows that this damping contrast remains effective when assessed using dilution-based results and supports its use in subsequent simulations. In contrast, Model 11 shows the largest overprediction over the full extraction range, while Models 7 and 9 behave similarly and converge toward the DeGagné model at higher extraction levels. This suggests that particle shape also influences the results. The spherical-particle case produces poorer agreement because spheres have highly idealised contact behaviour, leading to enhanced rolling and reduced interlocking between particles, which increases mobility and alters mixing and flow characteristics. In contrast, the 12-faced dodecahedral particles introduce angularity that promotes inter-particle interlocking and rotational resistance, compensating for the absence of explicit contact deformation in the rigid-body physics engine. Although DeGagné employed spherical particles in a DEM framework, particle angularity and rotational resistance in that model arise naturally through force–displacement contact laws. The use of faceted particles in Blender therefore provides an alternative means of approximating similar interaction behaviour, resulting in flow characteristics and dilution trends that are more comparable to those reported by DeGagné.
Figure 19(a) compares the changes in dilution at different stages of extraction between the baseline model (Case 20) and the scenarios with 10% and 20% increases in particle size. In the 10% increase scenario, the ore particle radii are 165, 275 and 385 mm, while in the 20% increase scenario, the ore particle radii are 180, 300 and 420 mm. The waste particle radii for both cases remain at 450 mm. Figure 19(b) shows the cumulative recovered ore percentage, expressed as the fraction of the total ore initially present in the model that has been recovered as extraction progresses. Table 9 lists the dilution and recovery for three stages of extraction.

The impact of changes in particle size on (a) dilution and (b) recovery for the Blender model of DeGagne's geometry.
Dilution and recovery data for the Blender model of DeGagne’s geometry run with increasing ore particle sizes.
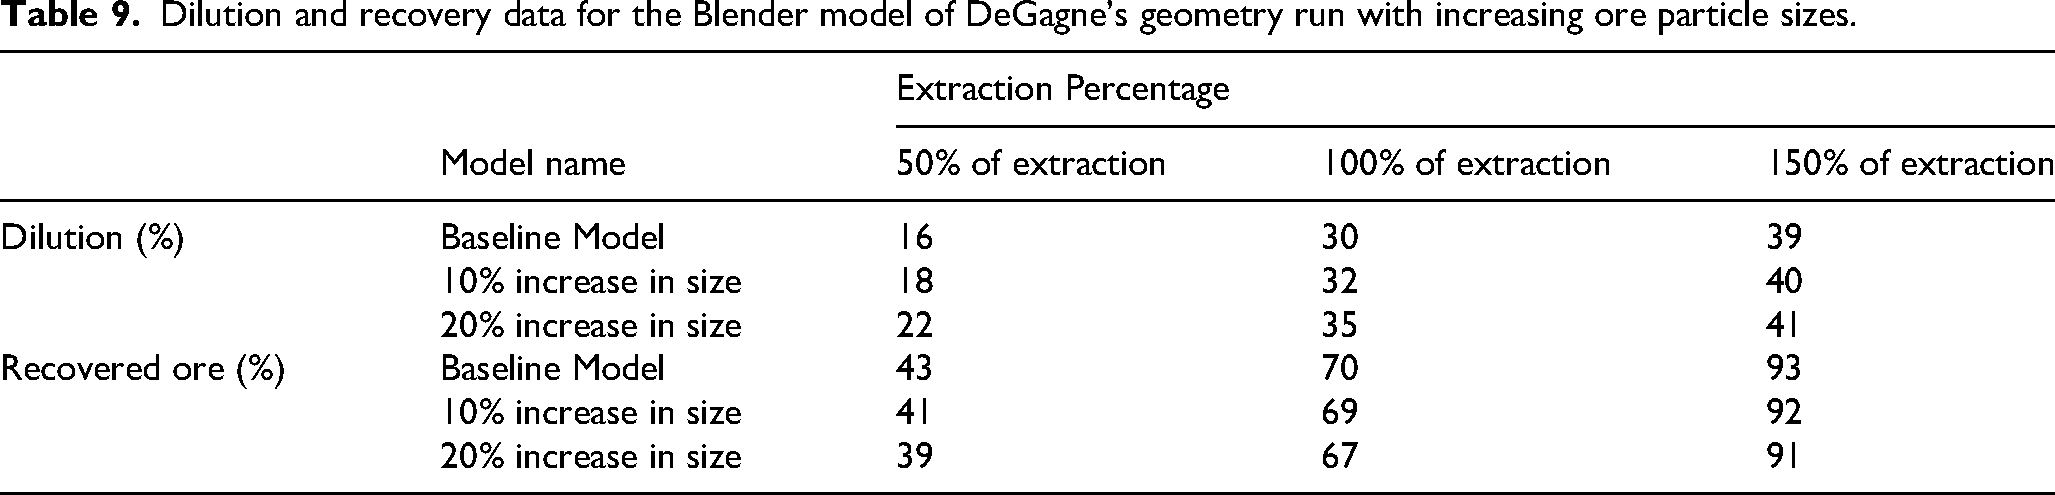
At 50% extraction, the dilution in the baseline model is 16%. For the 10% and 20% particle size increase scenarios, dilution increases to 18% and 22%, corresponding to relative increases of ∼13.5% and 42.9%, respectively, compared with the base case. This increase in dilution is accompanied by lower recovered ore percentages, which decrease from 43% in the base model to 41% for the 10% size increase and 39% for the 20% size increase scenarios.
At 100% extraction, dilution rises from 30% in the base model to 32% and 35% for the 10% and 20% size increase cases, representing relative increases of ∼7.3% and 16.6%, respectively. At the same extraction level, recovered ore decreases from 70% in the base case to 69% for the 10% size increase and 67% for the 20% size increase.
At 150% extraction, dilution increases from 39% in the base model to 40% and 41% for the 10% and 20% size increase scenarios, corresponding to relative increases of ∼1.2% and 3.6%, respectively. At this stage, ore recovery approaches completion for all scenarios but remains highest for the base model (93%), followed by the 10% size increase case (92%) and the 20% size increase case (91%).
The influence of increasing ore fragment size on dilution and recovery in the DeGagné case is qualitatively consistent with the trends observed in the EHM study; in both cases, larger ore particles result in higher dilution and lower recovered ore at the same extraction percentage, particularly during the early to intermediate stages of draw. However, the magnitude of the response and the rate at which the dilution curves diverge differ between the two case studies. These differences can be attributed in part to the distinct ring geometries used in each case. In the EHM model, the burden is smaller (2.6 m) and the ring height is ∼7 m greater than in the DeGagné case, leading to a more confined draw column and stronger sensitivity to changes in fragment size. As a result, dilution increases more sharply, and differences between size scenarios persist over a wider extraction range. In contrast, the DeGagné model employs a larger burden (4.3 m) and a shorter ring height, which promotes a more distributed flow regime and results in a more gradual evolution of dilution, with scenario differences diminishing more rapidly at higher extraction levels. The comparison therefore indicates that, while the effect of fragment size on dilution is consistent across both studies, the rate and magnitude of dilution development are strongly influenced by ring geometry, with smaller burdens and taller rings amplifying the impact of fragment size on waste ingress. The front-view and side-view plots of the extracted particles (Figures 20 and 21) show a systematic change in ore-waste mixing as particle size increases from the baseline to the 10% and 20% size-increase cases. In case a (baseline), the extracted stream is strongly ore-dominated at the early stages (0%–20% extraction; Figures 20(a) and 21(a)), and waste is not clearly expressed in the extracted material until approximately the intermediate stage (around 50% extraction). The baseline plots also show a more persistent ore-rich zone immediately above the drawpoint at later stages, indicating that ore continues to occupy the draw region for longer before being replaced by mixed or waste-bearing material (Figures 20(a) and 21(a)). In case b (10% size increase), waste becomes visible earlier and more continuously in the extracted material. Compared with the baseline, the plots at around 50% extraction show clearer waste presence in both views (Figures 20(b) and 21(b)), and by around 100% extraction, the extracted stream contains a more continuous waste component. Consistent with this behaviour, the ore-rich zone near the drawpoint appears less persistent than in the baseline, suggesting that waste material occupies the draw region at lower extraction levels in the 10% size-increase case (Figures 20(b) and 21(b)). In case c (20% size increase), the effect is the strongest: waste appears earlier and more prominently, with distinct waste extraction evident already at low to intermediate extraction levels (20%–50%; Figures 20(c) and 21(c)). By around 100% extraction, the extracted stream shows the thickest and most continuous waste component among the three cases, and the ore-rich zone near the drawpoint is reduced earlier than in the baseline and 10% cases (Figures 20(c) and 21(c)). At higher extraction levels (∼125%–150%), all cases show extensive ore-waste mixing in the extracted stream, and the differences between cases become much smaller than those observed at 20%–50% extraction. Any remaining contrast is negligible in the plots, with the 20% size-increase case showing a slight tendency toward a more waste-rich extracted stream at these late stages.

Front-view flow shape of the remaining particles inside the stope for the models with (a) baseline model, (b) 10% and (c) 20% increase in ore particle sizes.

Side-view flow shape of the remaining particles inside the stope for the models with (a) baseline model, (b) 10% and (c) 20% increase in ore particle sizes.
Practical implications for SLC blast design
To quantify how changes in blast design translate into changes in PSD and dilution, it is necessary to couple a fragmentation model with the SLC flow model. Several fragmentation models are available for this purpose; however, the Underground Ring Blast Model (URBM) is particularly well-suited here because it was developed and validated against the EHM data (Khodayari et al., 2026), ensuring internal consistency between the fragmentation predictions and the flow behaviour represented by the EHM model.
The parameters governing fragmentation in SLC blasting can be divided into two broad categories: controllable and uncontrollable. The first category includes inherent geological and geomechanical characteristics such as rock mass properties and in-situ stresses. The second category mainly includes blast design parameters such as burden, charge spacing, explosive density, and hole diameter, which represent practical levers for changing fragmentation outcomes and, consequently, dilution at the drawpoint. Within the controllable parameters, however, there is a meaningful difference in the ease with which each can be adjusted in a production environment. Explosive density and hole diameter can be modified relatively easily, while the burden and charge spacing (i.e. ring design) take a much more planning effort to apply.
Using the EHM ring design parameters described in the EHM case study section as the baseline case, the URBM was used to evaluate how changes in individual and combined blast design parameters affect the resulting PSD. P50 (50% passing size) is used as the representative fragment size throughout this analysis, as it is the most widely adopted characteristic size in established fragmentation models. Figure 22 illustrates the sensitivity of P50 to blast design parameters, highlighting the combined effects of burden and spacing across all combinations of hole diameter and explosive density. For example, at an explosive density of 1.25 g/cm3 and a hole diameter of 102 mm, a 10% reduction in P50 can be achieved with a burden of 2.4 m by setting the charge spacing to ∼2.9 m. Additionally, the results demonstrate that increasing the nominal charge spacing from 2.7 to 3.0 m causes the P50 to increase by ∼10%.

Changes in P50 particle size as a function of burden and spacing for a range of hole diameter (HD) and explosive density (ED) combinations.
The star in each subplot represents the baseline design burden and spacing. When interpreting these plots, two common practical constraints should be considered. First, it is recommended to keep the spacing-to-burden ratio within 1.0–1.2 for hard rock conditions, and second, the powder factor should remain between 0.3 and 0.6 kg/t.
The practical value of Figure 22 lies not only in predicting fragmentation but also in linking blast design decisions directly to dilution outcomes at the SLC drawpoint. As demonstrated in the EHM case study and DeGagné case study sections, increasing ore particle size consistently results in higher dilution, which is a trend observed across both the EHM baseline model and DeGagné's geometry. Consequently, any blast design adjustment that produces coarser fragmentation will increase dilution, whereas designs that achieve finer fragmentation will reduce it. For example, in the EHM case study, reducing the hole diameter from 102 to 89 mm increases the fragment size by ∼10%, which subsequently increases dilution by roughly 4% at 100% extraction. Furthermore, increasing the charge spacing to 2.9 m and decreasing the explosive density to 0.9 g/cc at the same time result in a 20% increase in fragmentation size, driving an approximate 5% increase in dilution at 100% extraction. This also indicate that the relationship between fragment size and dilution is non-linear, with diminishing sensitivity at larger fragment sizes. Figure 22 enables site engineers to identify achievable blast design modifications and directly apply their combined effect on fragmentation and dilution, supporting more informed and cost-effective blast design decisions in SLC operations.
Conclusions
In this study, extensive sets of simulations were conducted to evaluate the capability of the Blender physics engine to model gravity flow of blasted materials in sublevel caving operations. Two case studies were analysed in detail: the EHM case, based on reported marker trial data, and the DeGagné case, calibrated against the Ridgeway marker trial flow shape. For both cases, systematic calibration was performed to identify suitable modelling setups and to assess the sensitivity of key physics-engine parameters.
The results show that particle linear damping is the most sensitive parameter controlling flow behaviours. Damping governs how freely particles move and strongly influences particle presence at the draw point and, consequently, dilution. Excessively high damping values can produce unrealistic behaviours, including angles of repose approaching 90°. Particle friction and shape also play important roles. Simulations using purely spherical particles tend to underestimate effective inter-particle interactions, as the smooth geometry reduces the frequency and duration of particle–particle contacts and limits the transmission of tangential forces and rotational constraints. This promotes excessive sliding and rolling, resulting in unrealistically mobile flow patterns and biased dilution predictions. A key finding from both case studies is that applying lower damping to the ore particles compared with that applied to the waste particles produces more realistic flow behaviours. This is consistent with the physical interpretation that waste is more confined, while freshly blasted ore moves relatively more freely against the waste masses. In both case studies, the best-performing models were those with significantly lower damping applied to ore particles.
The influence of particle size increase on dilution and recovery is clearly illustrated by the dilution and ore recovery curves (Figures 14 and 19) and the corresponding summary data (Tables 7 and 9). In both the EHM and DeGagné case studies, increasing ore particle size by 10% and 20% results in higher dilution and lower ore recovery at all extraction levels. In the EHM case, the dilution at 50% extraction level increases by ∼12% and 15% for the 10% and 20% ore particle size increase scenarios, respectively, compared with the baseline model, while at 100% extraction level, the relative increase reduces to ∼6% and 7%. A similar trend is observed in the DeGagné case, where dilution at 50% extraction level increases by ∼14% for the 10% size increase case and by about 43% for the 20% size increase case relative to the base scenario, and the corresponding relative increases at 100% extraction level reduce to ∼7% and 17%, respectively. The reduction in relative differences at higher extraction levels reflects progressive depletion of the orebody: once most ore has been recovered, the material reaching the drawpoint is increasingly waste-rich. As a result, ore particle size becomes a less influential control on the extracted composition, and the mobilisation and inflow of waste dominates the draw behaviour, causing the dilution responses of the different particle-size scenarios to converge. These trends are consistent with the observed flow geometries in the DeGagné case. Finer ore particles are more mobilised and can flow more easily towards the drawpoint, allowing ore to be extracted preferentially while delaying waste entry, leading to lower dilution. In contrast, increasing ore particle size reduces ore mobility, reducing the persistence of the ore-dominated draw zone above the drawpoint, which allows waste to enter the draw region earlier and increases dilution at intermediate extraction levels. To achieve improved control over blast fragmentation and dilution, the URBM was used to assess the effects of blast design parameters on fragment size relative to the base scenario. Both single-parameter and hybrid multi-parameter changes were evaluated. The results serve as a practical guide for operators to adjust blast design to target a preferred fragmentation size distribution that balances the combined costs of blasting, hauling, and waste dilution at the drawpoint.
Although the Blender-based simulations were computationally feasible and more efficient for modelling gravity flow at a field-representative scale, further improvement based on the engine is possible. Future research may explore GPU-accelerated or multi-core simulation frameworks as a potential means of reducing computation time for large-scale granular flow simulations. Future work should further expand the sensitivity analysis of particle geometry. Building on the results already presented for spherical particles and dodecahedral particles with 12 faces, additional simulations using simplified polyhedral shapes, for example, eight and 10 faces particles, are recommended to identify an optimal balance between physical realism and computational efficiency. Finally, once GPU-accelerated workflows and efficient particle shape settings are established, simulations using the full field-scale geometry (i.e. extending beyond the half-model configuration adopted in this study) could be developed and tested. Such full-domain models would allow closer alignment with field conditions and enable more direct comparison of simulated flow shapes with cave flow envelopes derived from marker trials, providing more robust validation against operational data in sublevel caving.
Footnotes
Acknowledgements
This research was funded by the Australian Research Council Integrated Operations for Complex Resources Industrial Transformation Training Centre (project number IC190100017) and jointly supported by universities, industry and the Australian Government.
Funding
This research was funded by the Australian Research Council Integrated Operations for Complex Resources Industrial Transformation Training Centre (project number IC190100017) and jointly supported by universities, industry, and the Australian Government (grant number IC190100017).
Declaration of conflicting interests
The authors declared no potential conflicts of interest with respect to the research, authorship, and/or publication of this article.