
Abstract
Higher data density is widely assumed to improve grade estimation and reduce spatial uncertainty, but this remains insufficiently tested in structurally controlled, high-nugget gold systems with short-range variability. This study compares exploration- and grade control-scale datasets from the same deposit using consistent geological and block models. Ordinary kriging (OK), simple kriging (SK), and sequential Gaussian simulation (SGS) were applied to evaluate grade estimation, spatial continuity, and uncertainty. Increased sampling raised estimated mean Au grade (3.6-fold under kriging; 5.4-fold for SGS E-type estimates) and reduced variogram range from 111.3 to 44.0 m, indicating that exploration drilling smoothed short-range variability and overestimated continuity. SGS realizations became more spatially coherent with grade control, reflecting reduced structural uncertainty, but conditional variance remained high, indicating nugget-driven uncertainty. Deterministic uncertainty differed by method, with OK variance increasing and SK variance decreasing. Uncertainty therefore depends on variogram scale effects and estimation methodology, not sampling density alone.
Highlights
Controlled geostatistical evaluation: same deposit, same block support, only sampling density changes.
Variogram structure is scale-dependent.
Kriging variance behaves counter-intuitively.
Sequential Gaussian simulation (SGS) uncertainty does not reduce with more data in high-nugget systems.
Introduction
Mineral resource estimation relies on geochemical data collected at discrete locations, mostly following sampling patterns informed by mineral prospectivity and geological understanding of the target area (Emery and Silva, 2009; Lindi et al., 2024). These observations are used to infer grades at unsampled locations through interpolation, simulation, and learning data characteristics (Bolstad and Curran, 2016). Consequently, the reliability of mineral resource estimates is strongly controlled by the quality, density, and spatial configuration of available data, all of which can influence estimation uncertainty (Huang et al., 2022; Rossi and Deutsch, 2014; Witter et al., 2019). Sampled data supports multiple steps of the estimation process, including variography, geological modelling, and block grade estimation, meaning that uncertainty at each step may accumulate and propagate through the resource modelling workflow (Lindi et al., 2024).
In practice, mineral resource estimation evolves through several data collection stages, from early-stage, sparsely spaced exploration drilling to close-spaced grade control sampling conducted ahead of mining. Exploration drilling is designed for deposit delineation and it provides an initial dataset from which preliminary resource models are constructed. Thereafter, grade control drilling is conducted at substantially closer spacings, replacing or supplementing exploration data to support short-term production planning and ore/waste classification (Buelga Díaz et al., 2025; Prior et al., 2021). This progression from exploration to grade control represents one of the most significant transitions in the resource estimation process. However, its quantitative and qualitative effect on information gain, spatial uncertainty assessment, and grade model accuracy has received comparatively limited attention in literature, especially in gold vein systems.
Spatial uncertainty refers to the uncertainty associated with modelling continuous regionalised variables, such as grade, across unsampled locations (Goovaerts, 2001). Spatial uncertainty is pronounced at the initial stages of mineral resource estimation when data are sparse and the spatial continuity of grade is poorly constrained (Boyd et al., 2019; Delbari et al., 2009). It is influenced by sampling density, sampling design, measurement error, modelling methodology, and the spatial characteristics of the mineral system. In particular, structurally controlled gold deposits are commonly characterised by highly skewed grade distributions and strong nugget effects, where a significant proportion of variability occurs at scales smaller than typical drill spacing (Dominy and Johansen, 2004; Stanley and Smee, 2007; van der Grijp et al., 2021). Under such conditions, sparse sampling may fail to resolve short-range variability, leading to smoothed grade estimates and uncertainty in the geometry and continuity of mineralised domains. Increasing sampling density is therefore generally assumed to improve estimation accuracy and reduce spatial uncertainty by providing stronger local conditioning and better representation of grade variability and geological interpretation (Talebi et al., 2017). Specifically, high-density sampling enhances interpolation and simulation performance by increasing the number of conditioning data within each search neighbourhood (Cabral Pinto, 2016; Grunsky and Caritat, 2020; Narciso et al., 2019). This enables better resolution of local grade variability and ensures more reliable mine planning decisions (Zhang et al., 2024).
Despite this widely accepted assumption, the effect of increased data density on uncertainty behaviour is not straightforward. Deterministic uncertainty measures such as kriging variance depend primarily on data configuration and variogram structure, and may not reflect true grade variability, particularly in systems exhibiting a strong proportional effect. Stochastic approaches such as sequential Gaussian simulation (SGS) provide a more comprehensive representation of uncertainty by generating multiple equiprobable realisations, but their response to changes in sampling density is governed not only by data spacing but also by the intrinsic spatial variability of the deposit (Chiles and Delfiner, 2012). Consequently, the extent to which increased sampling density reduces uncertainty, improves grade estimation, and resolves spatial structure remains an open question, particularly in high-nugget systems.
Numerous studies have focused on methodological improvements for uncertainty modelling, including multiple-point simulation, SGS-based uncertainty analysis, singularity analysis for anomaly detection, and multiple imputation for missing data (Liu et al., 2019; Mohammadi et al., 2021; Sadeghi and Cohen, 2023; Talebi et al., 2019). However, these contributions largely emphasise algorithmic refinement rather than the effect of sampling design, data density, and sampling stage on spatial uncertainty and grade model outcomes.
A key limitation of existing studies is that comparisons of uncertainty across sampling densities are often based on datasets from different deposits or geological settings, where variability in lithology and structural controls confounds the isolated effect of sampling design (Sadeghi and Cohen, 2023). Although reduced uncertainty with increased data density is widely assumed (Haag et al., 2022; Sharififar, 2022), few studies have directly examined how datasets drawn from the same deposit at different stages of exploration campaigns influence block grade estimates, information gain, and spatial uncertainty, while maintaining consistent geological assumptions and block support. Consequently, the extent of information gain and the corresponding changes in the resource model associated with the transition from exploration- to grade control-scale data within a single geological setting remain insufficiently explored. This study addresses this gap by performing a controlled comparison of sparse exploration-scale and dense grade control-scale datasets from the same structurally controlled gold deposit. Although drill hole spacing studies have extensively evaluated the impact of sampling density on estimation performance and resource classification, fewer studies have examined how progressive increase in sampling density alter variogram structure, deterministic and stochastic uncertainty behaviour, and realisation convergence within the same deposit under operational drilling conditions. By keeping geological setting and block support constant while varying only data density and sampling configuration, the analysis isolates the effect of sampling scale and design on grade estimation and spatial uncertainty. Ordinary kriging (OK), simple kriging (SK), and SGS are applied to both datasets in a probabilistic framework to characterise changes in variogram structure, block grade estimates, and uncertainty metrics. OK and SK methods use kriging variance to model uncertainty, whereas SGS generates equiprobable realisations to characterise spatial uncertainty. This controlled design provides a direct assessment of information gain across exploration stages, mineral resource estimation accuracy, and spatial uncertainty assessment.
The objectives of this study are therefore to (1) quantify the impact of increased sampling density on grade estimation and spatial continuity, (2) evaluate how deterministic and stochastic measures of uncertainty respond to changes in data density, and (3) assess the extent to which increased sampling resolves structural uncertainty in mineralised domains. The results provide new insights into the scale-dependent nature of spatial variability and demonstrate that, in high-nugget systems, uncertainty reduction is not solely a function of data density but is strongly influenced by variogram structure and estimation methodology.
Materials and methods
Study area and data
Geological setting
Geochemical data were obtained from the New Luika Gold Mine located in the Songwe region of southwestern Tanzania (Figure 1) (Salvoldi et al., 2019). Geologically, the study area is situated along the southwestern margin of the Tanzanian Craton, adjacent to the Lupa Terrane of the Palaeoproterozoic Ubendian Belt. The Lupa Goldfield is the second-largest goldfield in Tanzania after the Lake Victoria Goldfield (Ngowi et al., 2023). The regional geology of the Lupa Goldfield is characterised by deformed, folded, sheared, and metamorphosed Palaeoproterozoic rocks, with major fold axes trending east-southeast to west-northwest. The principal lithological units in the region include the Ilunga Granite Formation, Saza Granite Formation, and Gneiss Formation. The Ilunga Granite Formation comprises gabbro, diorite, granodiorite, and potassium-rich granite (Manya, 2014). The Saza Granite Formation consists mainly of hornblende-rich granite and hornblende-biotite granodiorite. The Gneiss Formation is composed of felsitic gneiss, biotite-hornblende granitic gneiss, and leucocratic granular gneiss. This formation represents the dominant lithological unit and the principal ore-hosting rock in the Lupa Goldfield (Shanta Gold, 2024; Thomas et al., 2016).
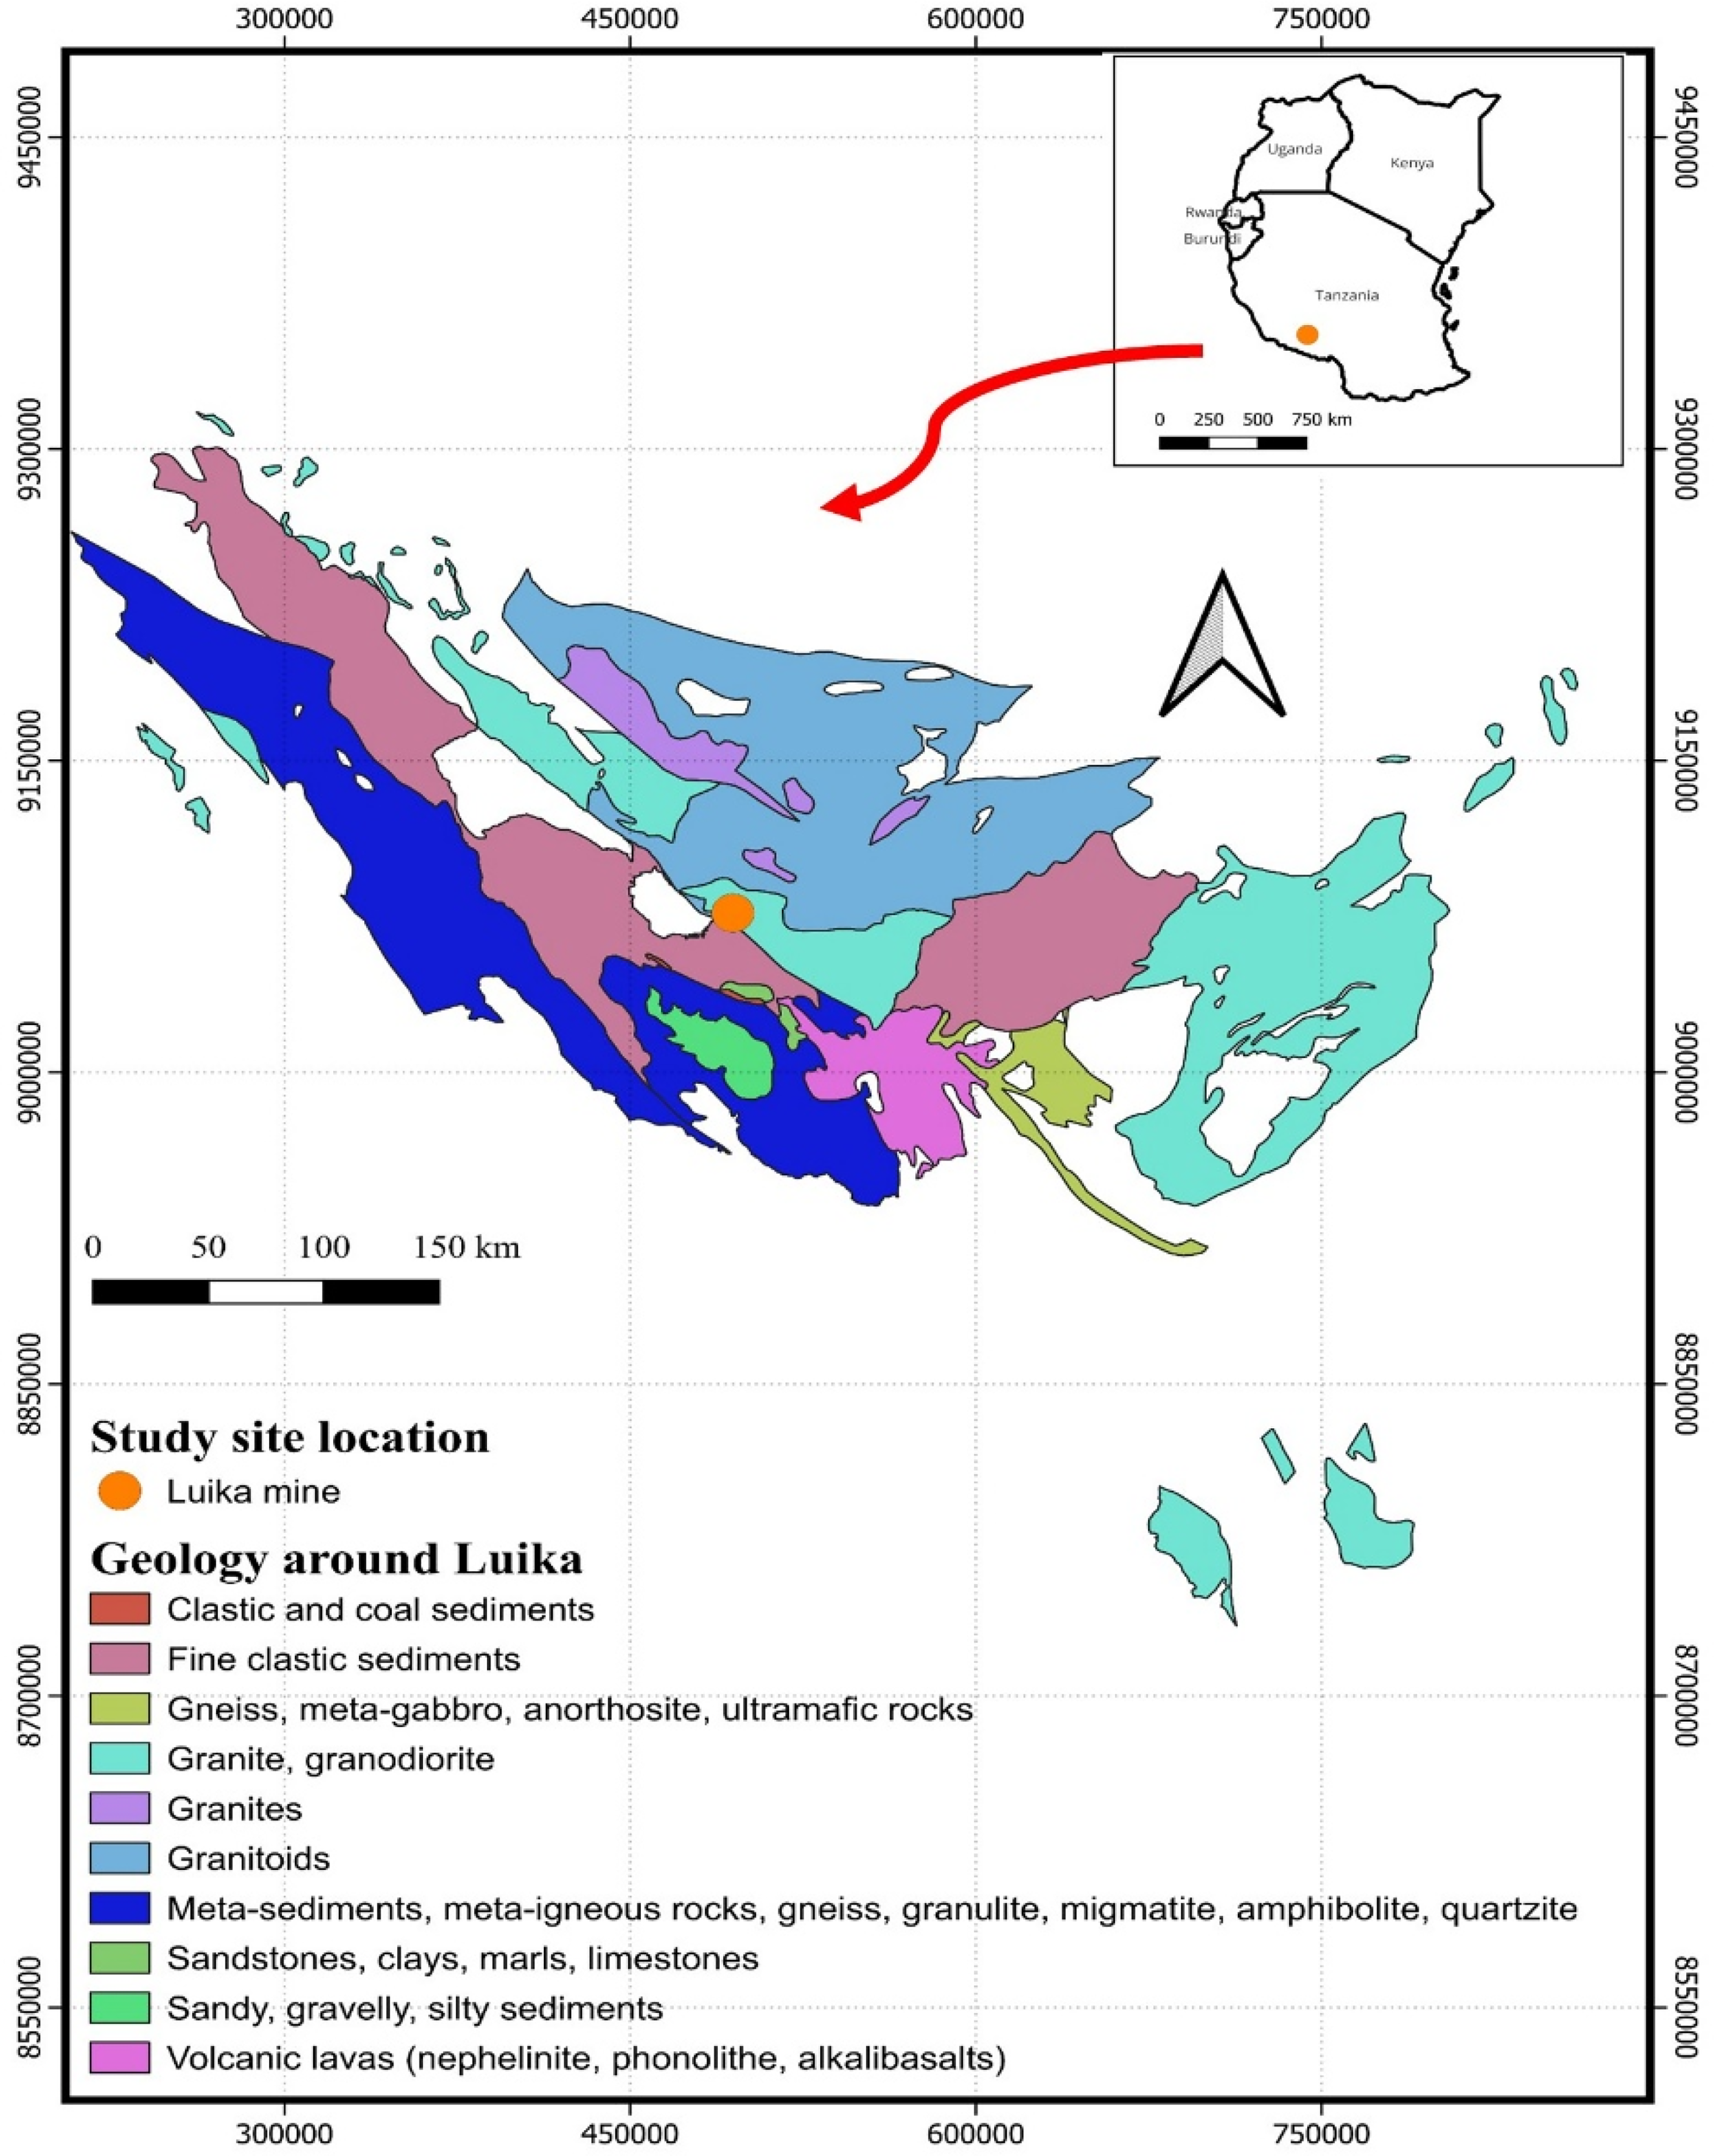
Regional geological map of the study area and deposit location (circled area).
Geochemical data
Geochemical data was collected through an exploration programme using reverse circulation drilling, consisting of two datasets: exploration and grade control data. Exploration data were obtained from 22 drill holes, spaced approximately 30 to 50 m across the study area, and grade control data were collected from 647 drill holes spaced between 5 and 10 m as shown in Figure 2. Grade control drill holes were drilled according to the exploration layout to obtain more detailed information about the deposit. Grade control data shows varying depths of drill holes. In both drilling campaigns, samples were tested for gold (Au) and silver (Ag) mineralisation. The mineralisation of interest for this study is gold (Au). Both datasets were composited to a 1 m interval across drill holes. Due to skewness, grades were capped at 98–99% cumulative probability to reduce the influence of extreme values. Hence, grade based on exploration data was capped at 10 ppm, and grade control data at 20 ppm. The bias observed in the drilling pattern results from standard practices that prioritise major drilling campaigns in regions where geological knowledge indicates a high likelihood of discovering valuable minerals.
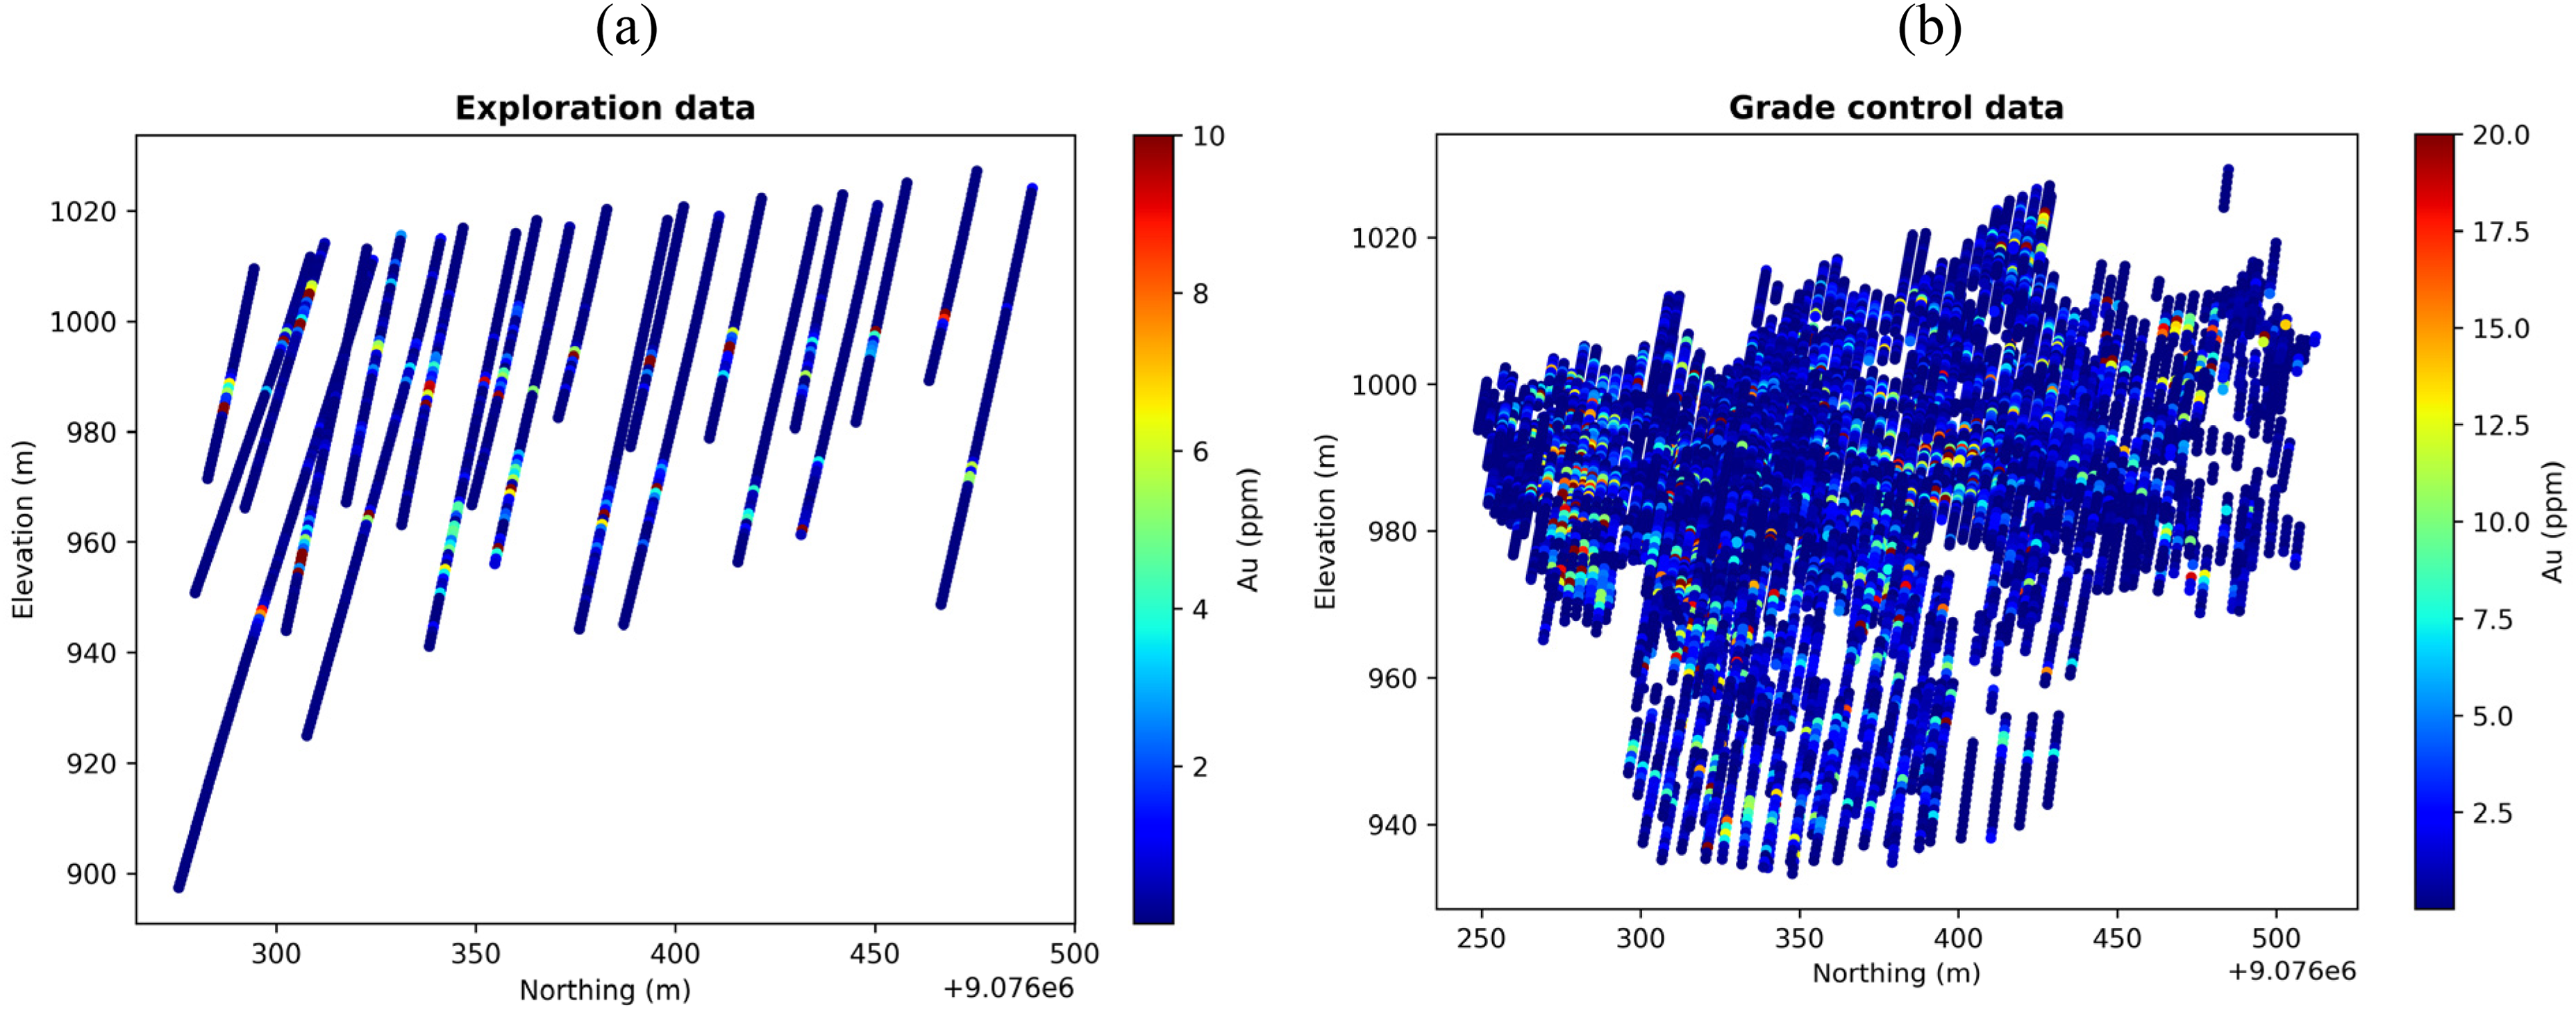
Location of drill hole samples: (a) exploration and (b) grade control.
Methodology
This study is implemented following an approach involving exploratory data analysis, spatial variability analysis by variogram and modelling using OK, SK, and SGS. Spatial uncertainty is assessed using kriging variance and equiprobable realisations from SGS. Grades of interest are defined in a single geological domain. Therefore, kriging and simulation are carried out using all the available data together, without partitioning this mineralisation zone into sub-domains. This simplifies modelling and simulation since it only requires quantitative variables and not geological domains as suggested by Mery et al. (2025). Uncertainty model validation is implemented following the procedures defined by Goovaerts (2001), Wang and Zuo (2024), and Moreno et al. (2025). The following sub-sections summarise the components of the methodology.
Variogram
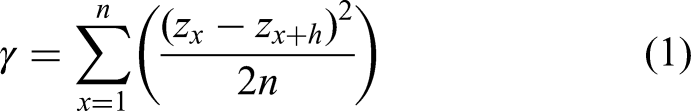
A variogram (also known as a semi-variogram) model is a numerical expression that correlates semi-variance
Kriging
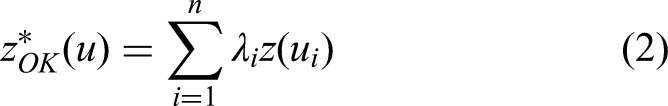
This study selected the most common linear estimators, namely simple (SK) and ordinary kriging (OK). OK is applied to estimate the unknown grade of a block by computing the weighted average of the grades of surrounding points using the fitted semi-variogram parameters obtained through spatial analysis. OK uses kriging variance to assess spatial uncertainty (Monteiro da Rocha and Yamamoto, 2000; Silva, 2021). OK can be quantified using the below equation (Abzalov, 2016; Rossi and Deutsch, 2014):
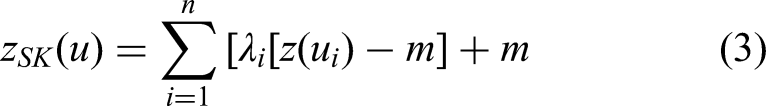
SK is used to determine a set of optimal weights that minimise the expected error variance (Erdogan Erten et al., 2022; Rossi and Deutsch, 2014). The
Sequential Gaussian simulation
SGS combines SK and sometimes OK (which determines the local distribution of uncertainty) with Monte Carlo simulation (which draws a simulated value randomly from a distribution) (Harrison et al., 2009). SGS requires a normal transformation of data before its application (Delbari et al., 2009). To determine the shape, the data are transformed into a Gaussian distribution, which has a mean of 0 and a variance of 1. Each successive local estimate uses the previously calculated results as input, ensuring that the variance across all the simulated values is reproduced (Harrison et al., 2009). SGS realisations are accepted or rejected based on their capacity to honour the data, geology, histogram, variogram, and any secondary information (Delbari et al., 2009; Ortiz, 2020; Paithankar and Chatterjee, 2018). The difference between realisations provides a quantitative measure of the spatial uncertainty of estimates. The SGS algorithm provides reasonable outcomes in small grid spacing as discussed in detail by Asghari et al. (2009) and Harrison et al. (2009). In this study, SGS were implemented using OK to estimate local conditional distribution at each simulated node and avoid the mean assumption by SK and to treat the variable independently, as discussed by Manchuk and Deutsch (2012). This approach avoids the requirement for a globally stationary mean inherent to SK-based SGS and is considered more appropriate for structurally controlled gold mineralisation exhibiting strong local variability and non-stationary grade behaviour.
Results and discussion
Exploratory data analysis
Summary statistics for gold (Au) grades from the exploration and grade control datasets are presented in Table 1, and their distributions are shown as histograms in Figure 3. Most Au grades are concentrated below 4 ppm in the exploration dataset and below 10 ppm in the grade control dataset. The grade control dataset contains substantially more samples (approximately eight times) and a higher mean grade than the exploration dataset. This contrast in data density and sampling configuration provides an empirical basis for evaluating how data density and sampling design influence information gain and spatial uncertainty modelling within the same geological setting. In particular, the analysis enables quantification of the value of additional information for uncertainty reduction, consistent with previous findings that indicated increased sampling generally improves model reliability (Cabral Pinto, 2016; Caers et al., 2022; Emery and Silva, 2009; Grunsky and Caritat, 2020; Haag et al., 2022; Narciso et al., 2019).
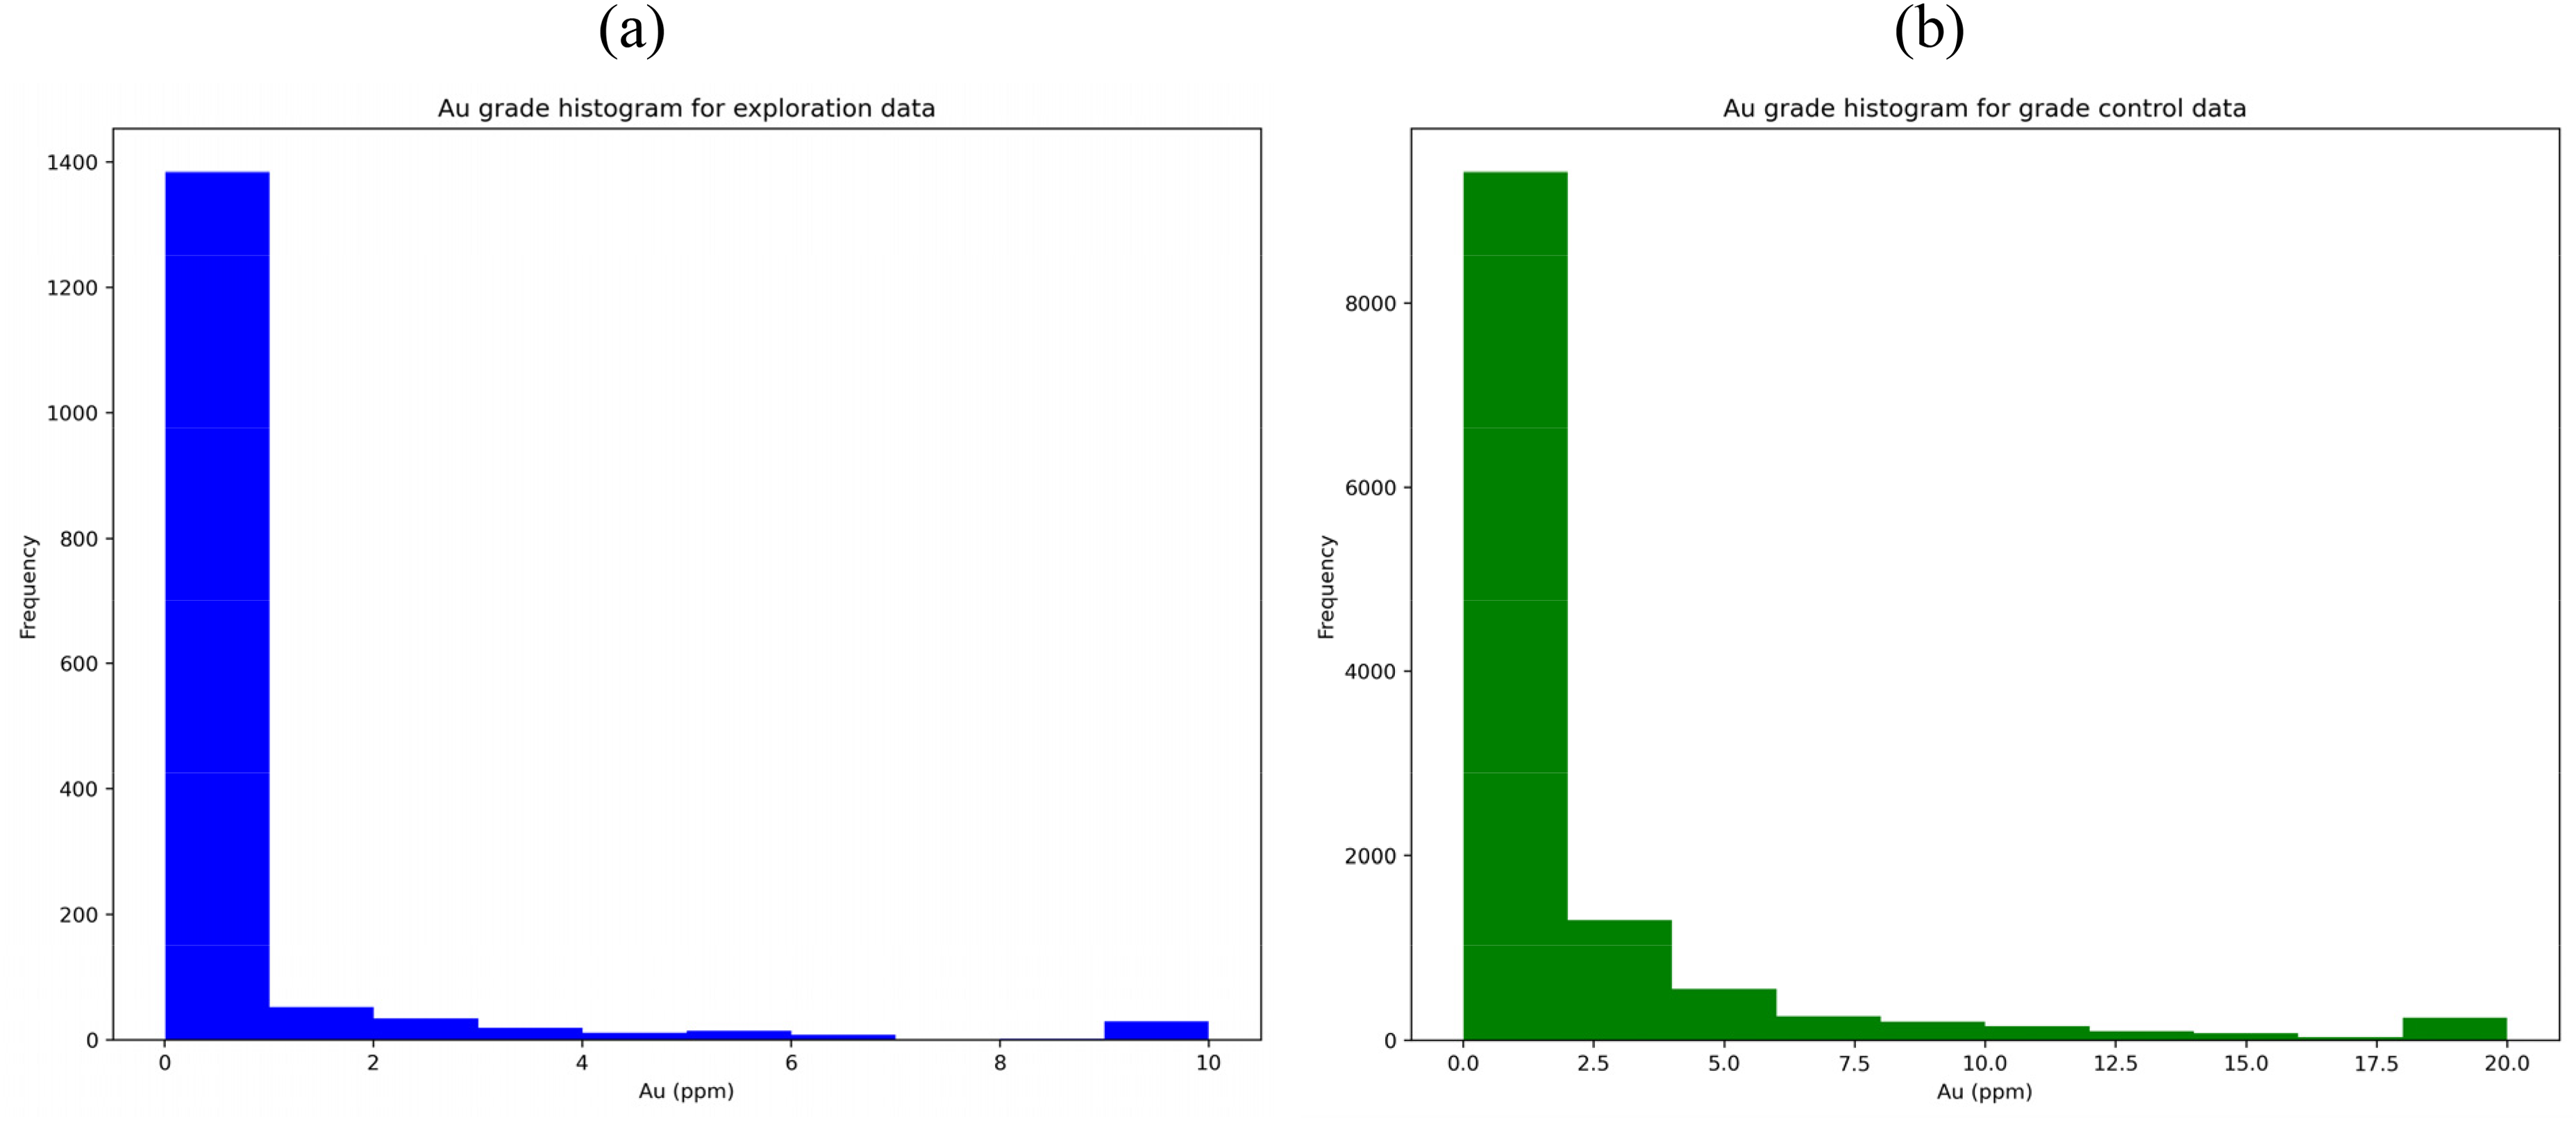
Histograms showing the distribution of gold grades from (a) exploration data (capped at 10 ppm) and (b) grade control data (capped at 20 ppm).
Summary of exploration and grade control data statistics.
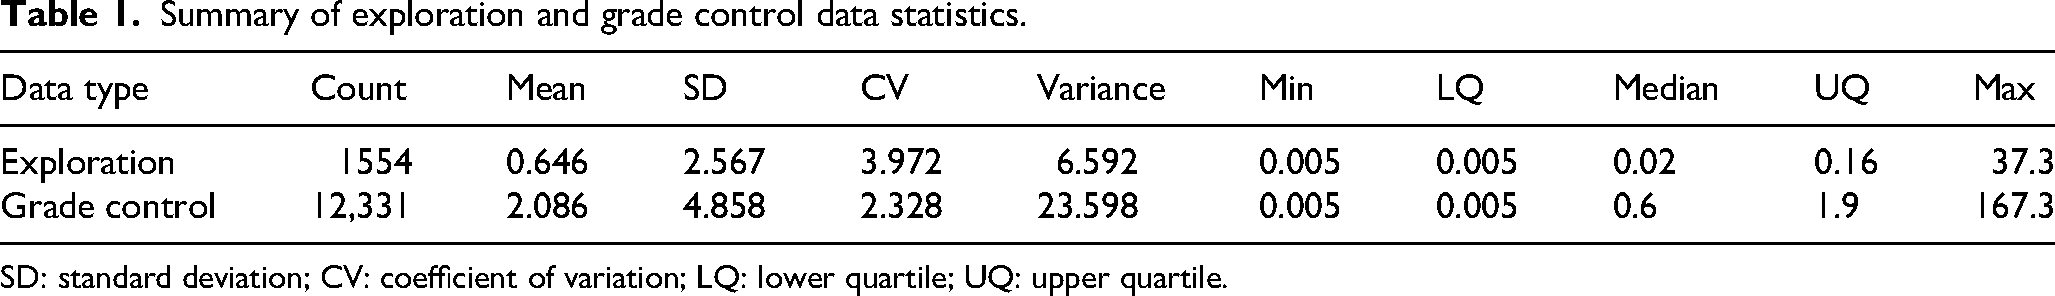
SD: standard deviation; CV: coefficient of variation; LQ: lower quartile; UQ: upper quartile.
Spatial variability by variography
In this study, spatial variability was evaluated using the directional variogram. Variograms were fitted using Leapfrog Geo through an interactive interpretation-based procedure, combining experimental variogram analysis with manual adjustment of model parameters to achieve a geologically consistent fit. Both datasets displayed distinct properties, leading to two distinct variogram models. The exploration data variogram model was determined to fit appropriately at 10 lags each with a lag distance of 20 m and an angular tolerance of 30°. The direction of maximum continuity was established at a dip of 4.15°, azimuth of 170.39°, and pitch of 129.19°. The variogram model was fitted with a spherical variogram, with a major axis range of 111.3 m, a semi-major range of 75.09 m, and a minor axis range of 59.18 m. The nugget was defined based on the downhole variogram and was found to be 0.2, which is a common property of most gold deposits (Stoch et al., 2022; van der Grijp et al., 2021). The fitted variogram model based on the major axis is illustrated in Figure 4.
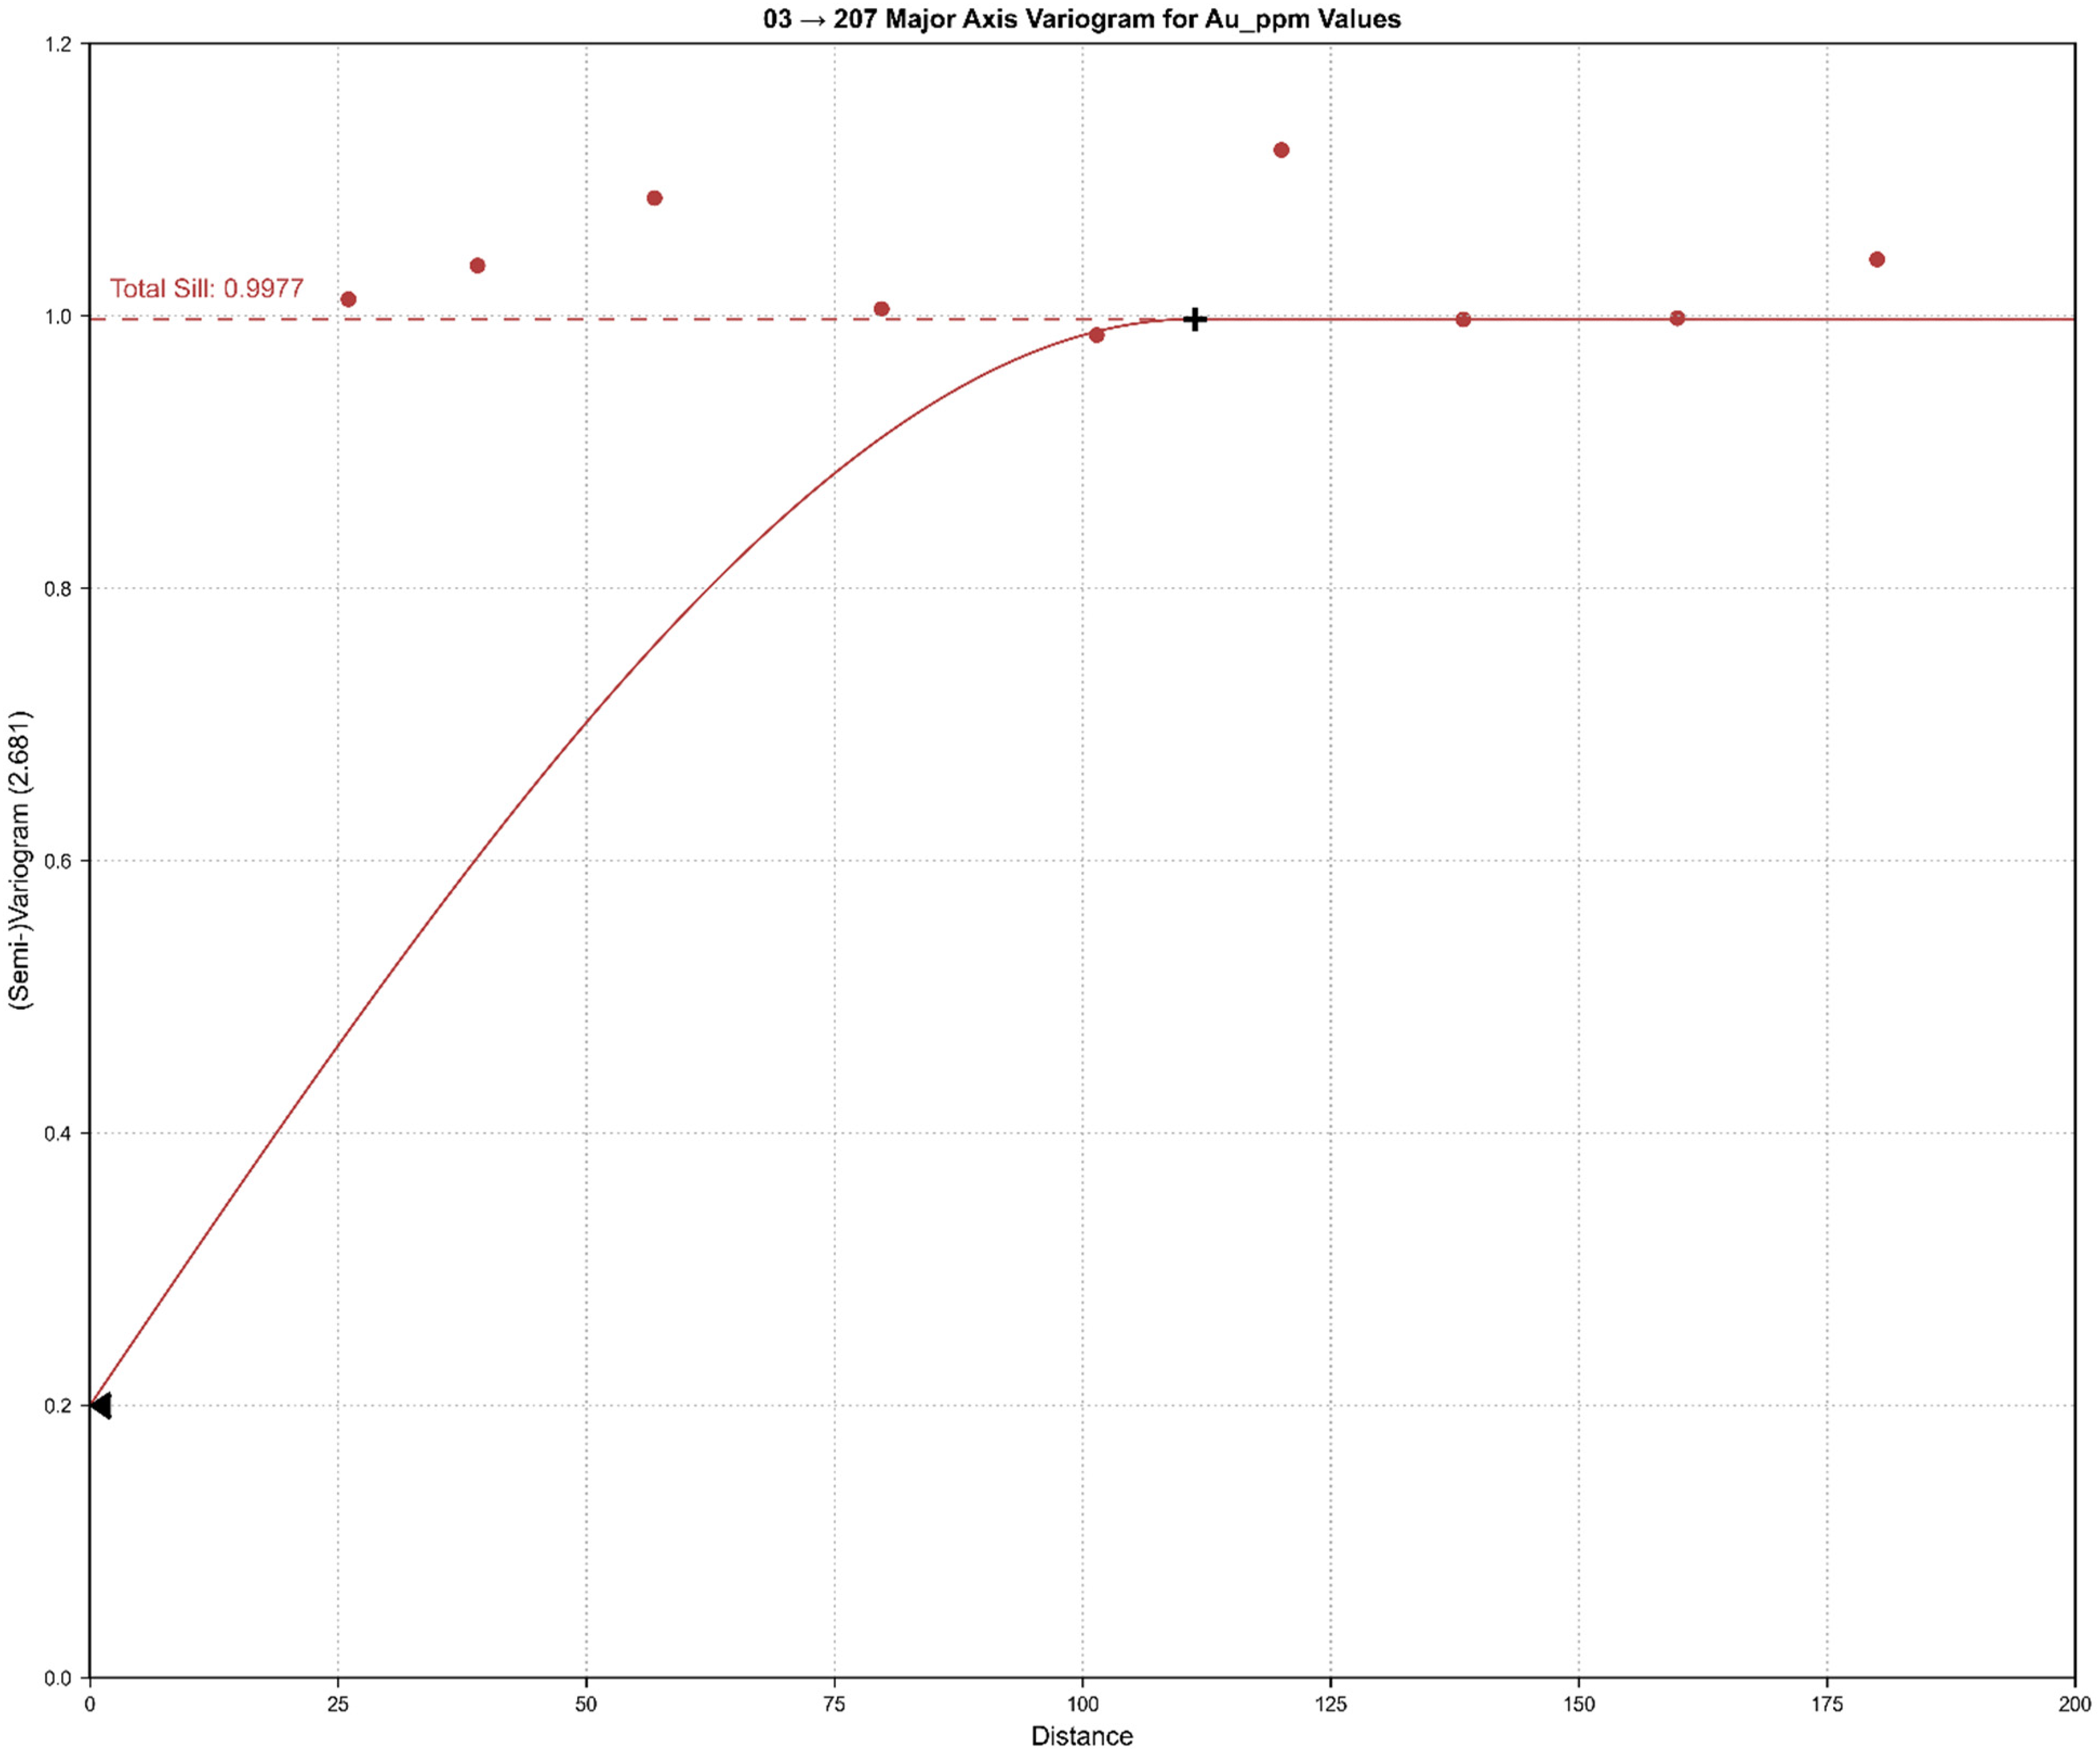
Major axis directional variogram for the exploration dataset (Au ppm), showing experimental variogram points and the fitted spherical model.
For the grade control data, the best fitting variogram model was obtained at 10 lags, lag distance of 10 m, and angular tolerance of 30°. The direction of maximum continuity was established at a dip of 2.94°, azimuth of 247.15°, and pitch of 44.04°. The variogram model was fitted with a spherical variogram, with a major axis range of 44 m, a semi-major range of 19.92 m, and a minor axis range of 2 m. The nugget was defined based on the downhole variogram and found to be 0.4. The fitted variogram model based on the major axis is illustrated in Figure 5.
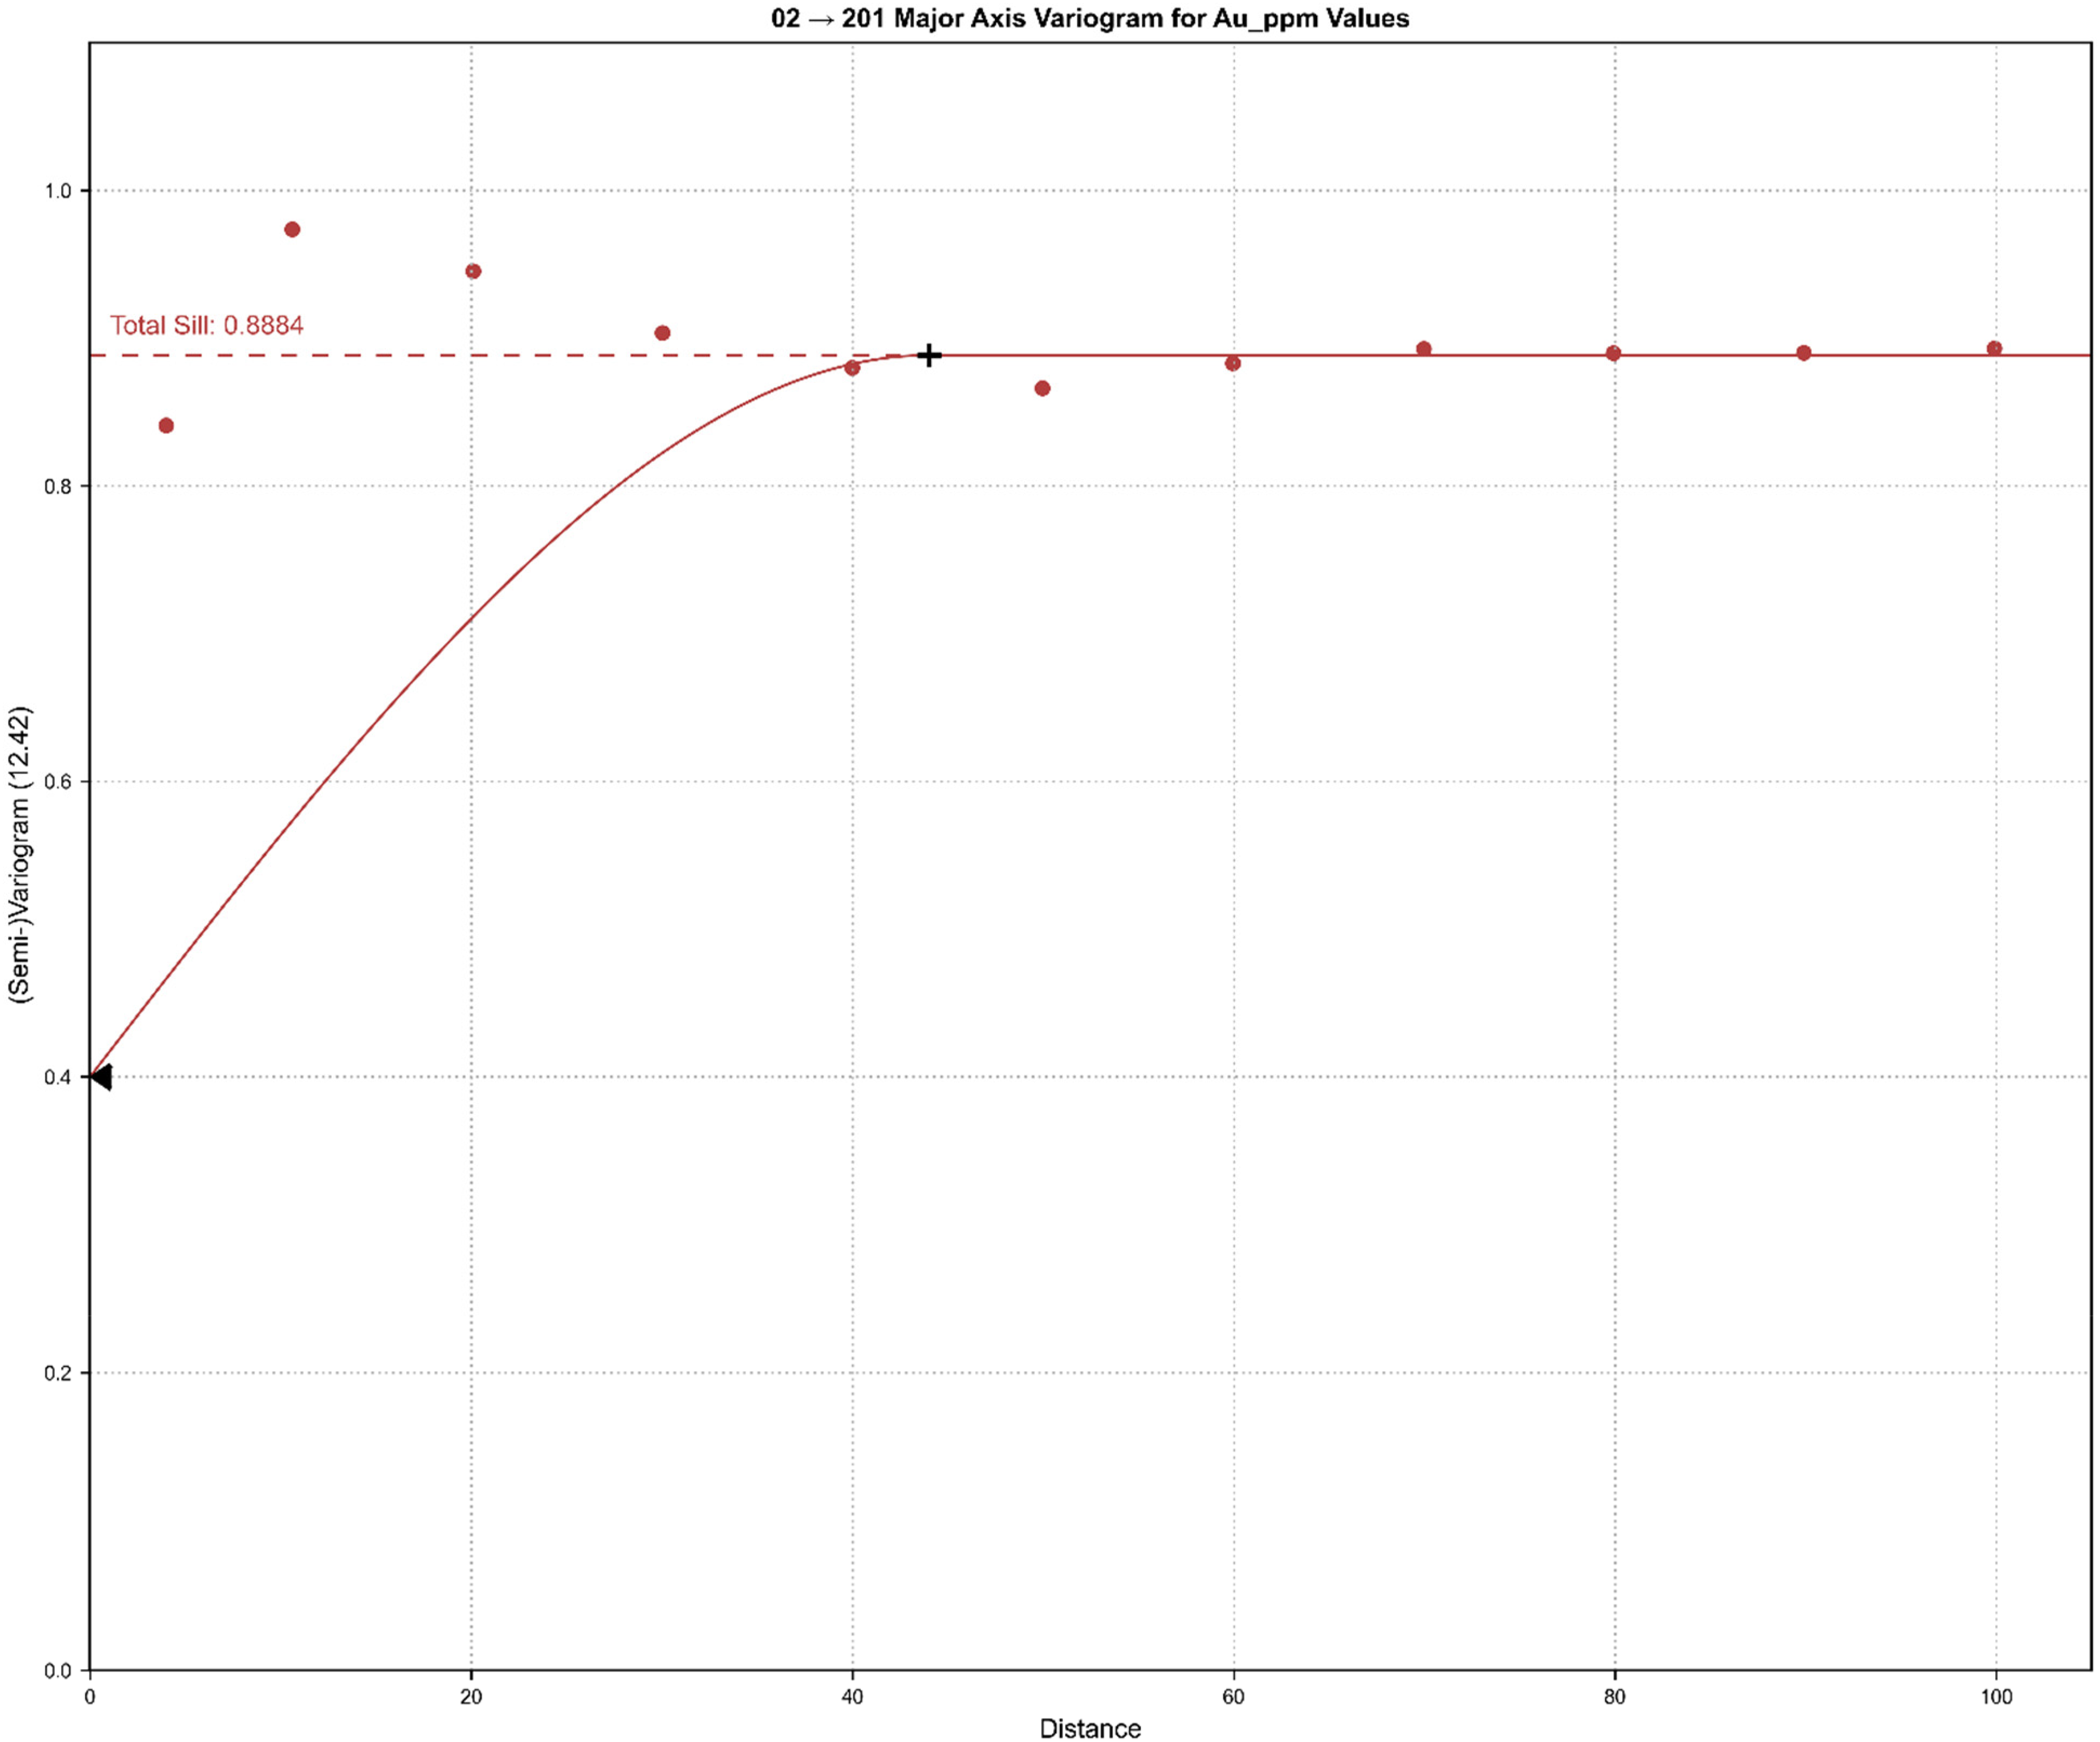
Major axis directional variogram for the grade control dataset (Au ppm), showing experimental variogram points and the fitted spherical model.
Despite using data from the same geological deposit, both the direction of maximum continuity and the level of spatial continuity differed. For instance, during exploration with wide drill spacing, the variogram averages over local heterogeneity, producing an artificially inflated range that implies smoother grade continuity than actually exists. This can lead to overly optimistic kriging estimates between drill holes and an under-estimation of local spatial uncertainty.
Block modelling by kriging
In mineral resource estimation, the desired output is mostly grade and tonnage. In this study, both OK and SK were applied to estimate Au grades at unsampled locations within blocks of size 10 m × 10 m × 5 m. A minimum of 4 and a maximum of 20 samples were used for kriging-based estimation. The grades of both datasets were de-clustered using the cell de-clustering method and new means were determined to be 0.596 for exploration data and 1.779 for grade control data to be used in resource estimation using SK. Grade block model statistics for both exploration and grade control are summarised in Tables 2 and 3, respectively. SK estimates have lower variance and higher mean grade than OK estimates, as seen in Tables 2 and 3. This difference in block grades by both methods is due to the global mean assumption by SK unlike OK (Emery, 2006, 2008; Pan et al., 1993). The block model statistics reveal a substantial information gain upon transitioning from exploration to grade control data. Mean Au grades estimated by OK and SK increased from 0.44 and 0.48 ppm under exploration data to 1.58 and 1.72 ppm under grade control data, confirming that exploration-scale drilling systematically under-represented deposit grade. This disparity amounts to 258% mean grade increase shows information gain, whereby denser drilling resolved grade variability at a finer spatial scale than was resolvable with exploration data alone. These findings reinforce the value of progressive drilling campaigns in reducing estimation bias and improving confidence in high-grade zone delineation.
Summary statistics of grade block model estimated using exploration data.
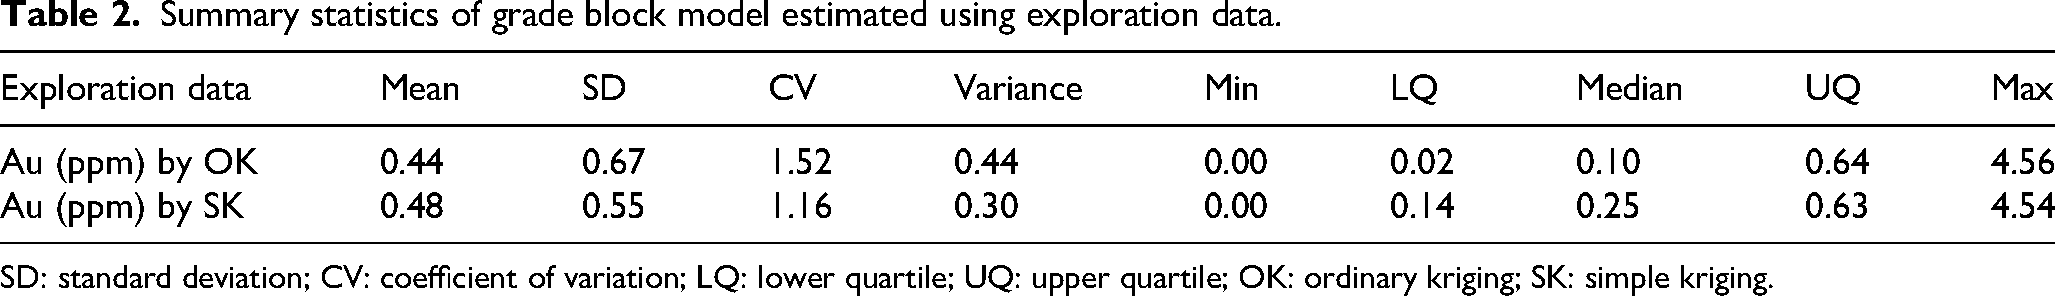
SD: standard deviation; CV: coefficient of variation; LQ: lower quartile; UQ: upper quartile; OK: ordinary kriging; SK: simple kriging.
Summary statistics of grade block model estimated using grade control data.
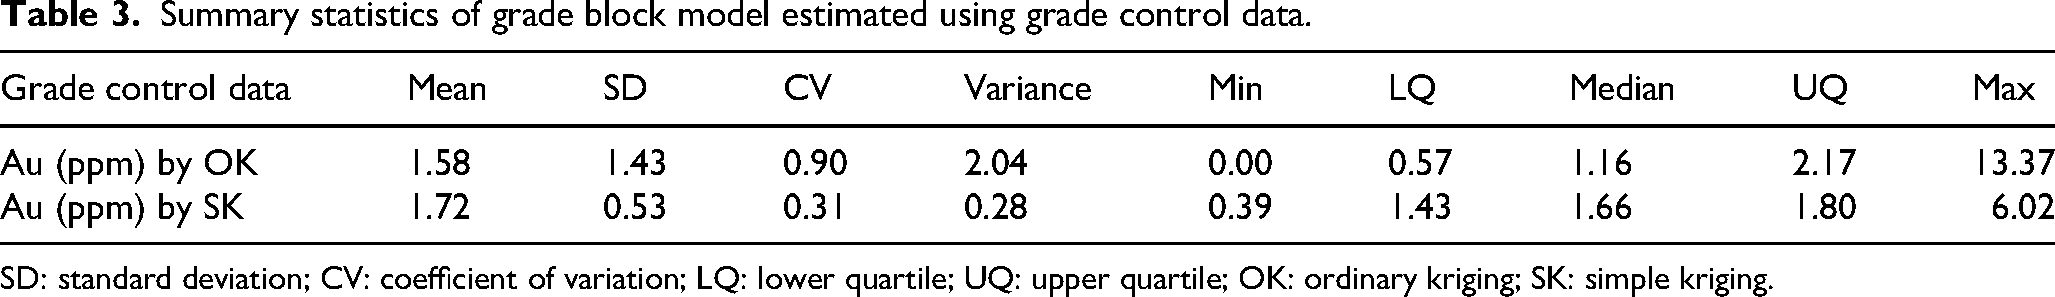
SD: standard deviation; CV: coefficient of variation; LQ: lower quartile; UQ: upper quartile; OK: ordinary kriging; SK: simple kriging.
The coefficient of variation (CV) provides a quantitative measure of estimator behaviour across data densities. Under exploration data, OK yields a CV of 1.52, indicative of high-grade dispersion driven by sparse data and sensitivity to local outliers. Grade control OK reduces this to 0.90, reflecting genuine short-scale heterogeneity resolved at closer drill spacing. Similarly, SK reduced CV from 1.16 (exploration) to 0.31 (grade control) and a narrow inter-quartile range (1.43–1.80 ppm), demonstrating strong regression towards the global mean and considerable loss of local grade variability. The maximum estimated grade also increased from 4.56 ppm (exploration OK) to 13.37 ppm (grade control OK), confirming the presence of high-grade zones undetected during exploration drilling.
Comparative analysis of OK and SK grade block models estimated from exploration data
Au values were estimated using OK and SK in three-dimensional at unsampled locations and sliced to develop vertical cross-sections that display the spatial distribution of predicted grades (refer to Figure 6). The sections cover an elevation range of approximately 890–1020 m and a horizontal distance of roughly 320 m (between locations A and B) along a plane with a dip of 90° and an azimuth of 150°. Figure 6(a) presents OK estimates and Figure 6(b) presents SK estimates using exploration data. For consistent comparison, all estimated grades were displayed using a common grade scale.
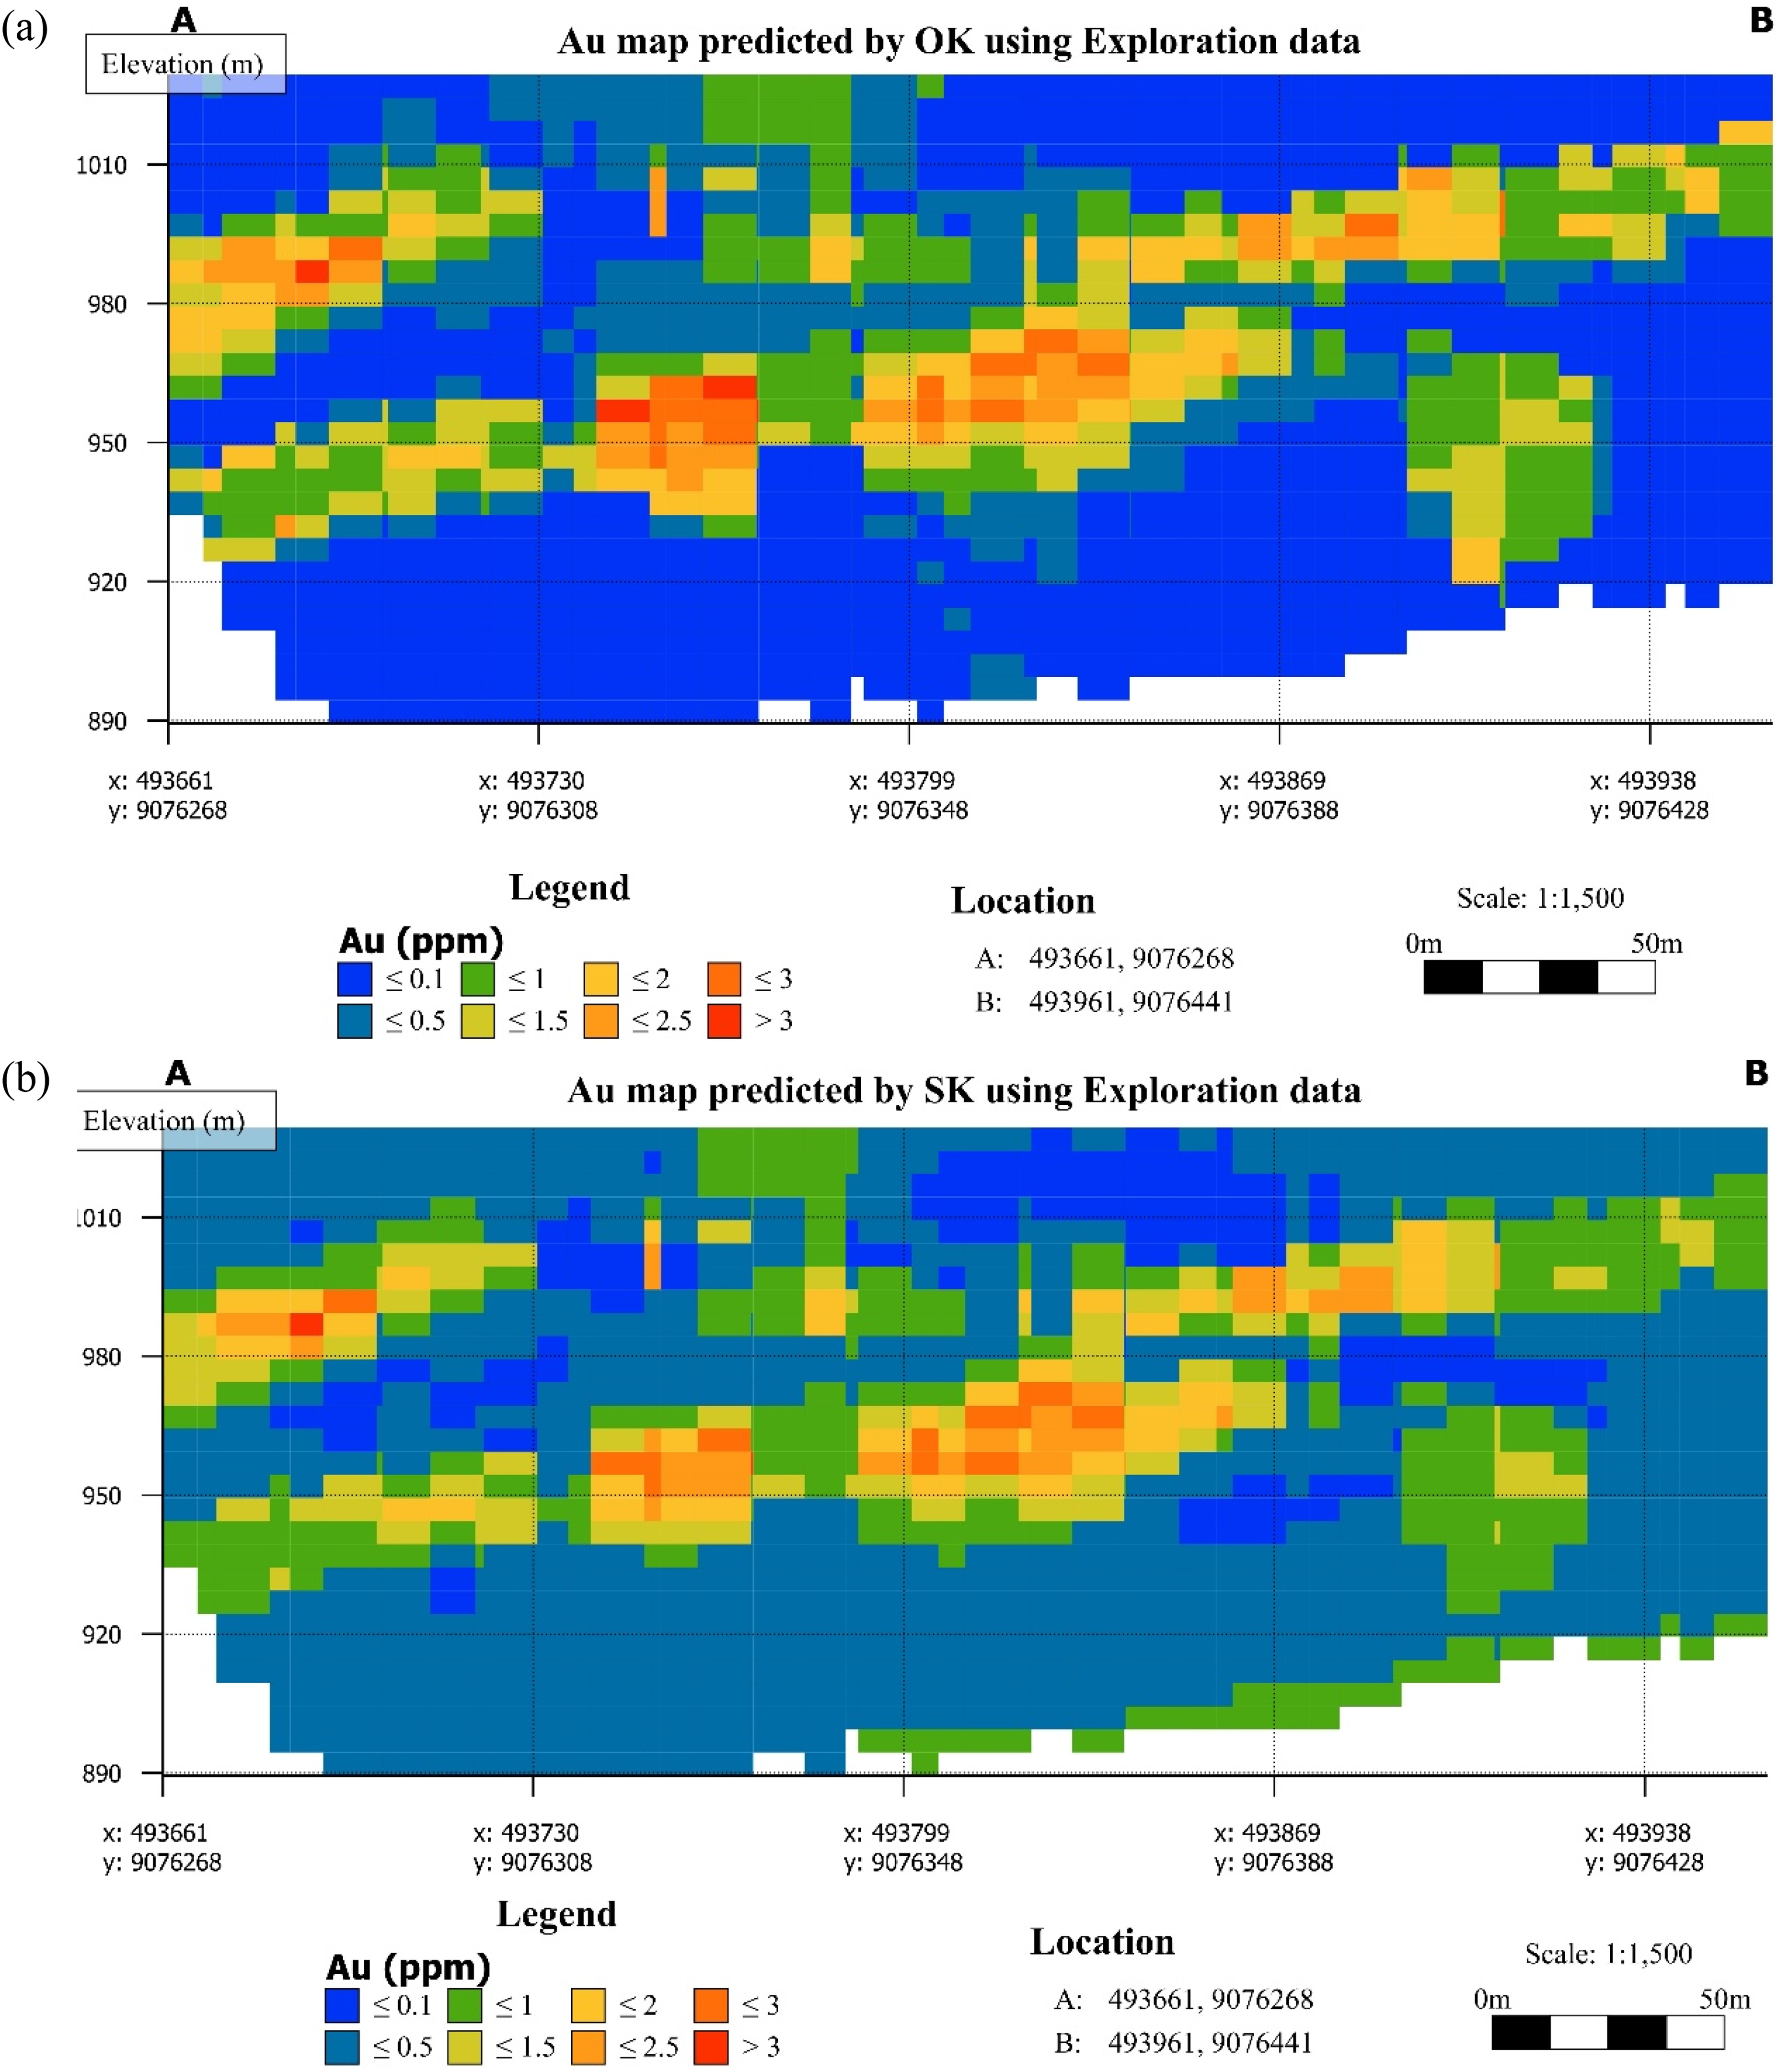
Au block grade cross-sections based on estimates using exploration data: (a) OK and (b) SK. OK: ordinary kriging; SK: simple kriging.
The spatial patterns of predicted Au grades are broadly consistent between the OK and SK models, with high-grade zones occurring in comparable locations across both sections. However, notable differences in grade smoothing and the spatial extent of high-grade zones are evident. The SK model produces a smoother grade distribution with a broader dominance of intermediate grades (1.0–2.0 ppm), as shown in Figure 6(b). In contrast, the OK model exhibits more localised, sharper contrasts between grade zones as shown in Figure 6(a), a behaviour consistent with the known theoretical differences between the two estimators with respect to their mean assumption (Emery, 2006).
Two principal zones of high Au concentration (≥2.5 ppm) are observed in both sections. The first high-grade zone is located at an elevation interval of 940–970 m, in the central to west-central part of the section. The second high-grade zone occurs at approximately 980–1010 m elevation towards the eastern portion of the section, where grades exceeding 2.5 ppm are spatially more dispersed but consistently reproduced by both OK and SK. Low-grade material (Au ≤ 0.5 ppm) dominates the boundary of the mineralised domain at elevations above 1010 m, and below 920 m, and along the lateral margins of the section, reflecting the attenuation of mineralisation away from the core of the deposit.
Spatial agreement between the OK and SK predictions using exploration data suggests a reasonable degree of estimation robustness at this data density, with differences between the two methods attributable primarily to their differing assumptions regarding stationarity of the mean.
Comparative analysis of OK and SK grade block models estimated from grade control data
Cross-sections of predicted Au grade distributions derived from OK and SK using grade control data are illustrated in Figure 7. The grade control dataset is characterised by a denser and closely spaced drilling pattern, which substantially influences the spatial detail of the resulting estimates. The grade control-based cross-sections span a narrower elevation range of approximately 930–1020 m, compared to 890–1020 m for the exploration-based estimates, reflecting the shallower vertical extent of grade control drilling.
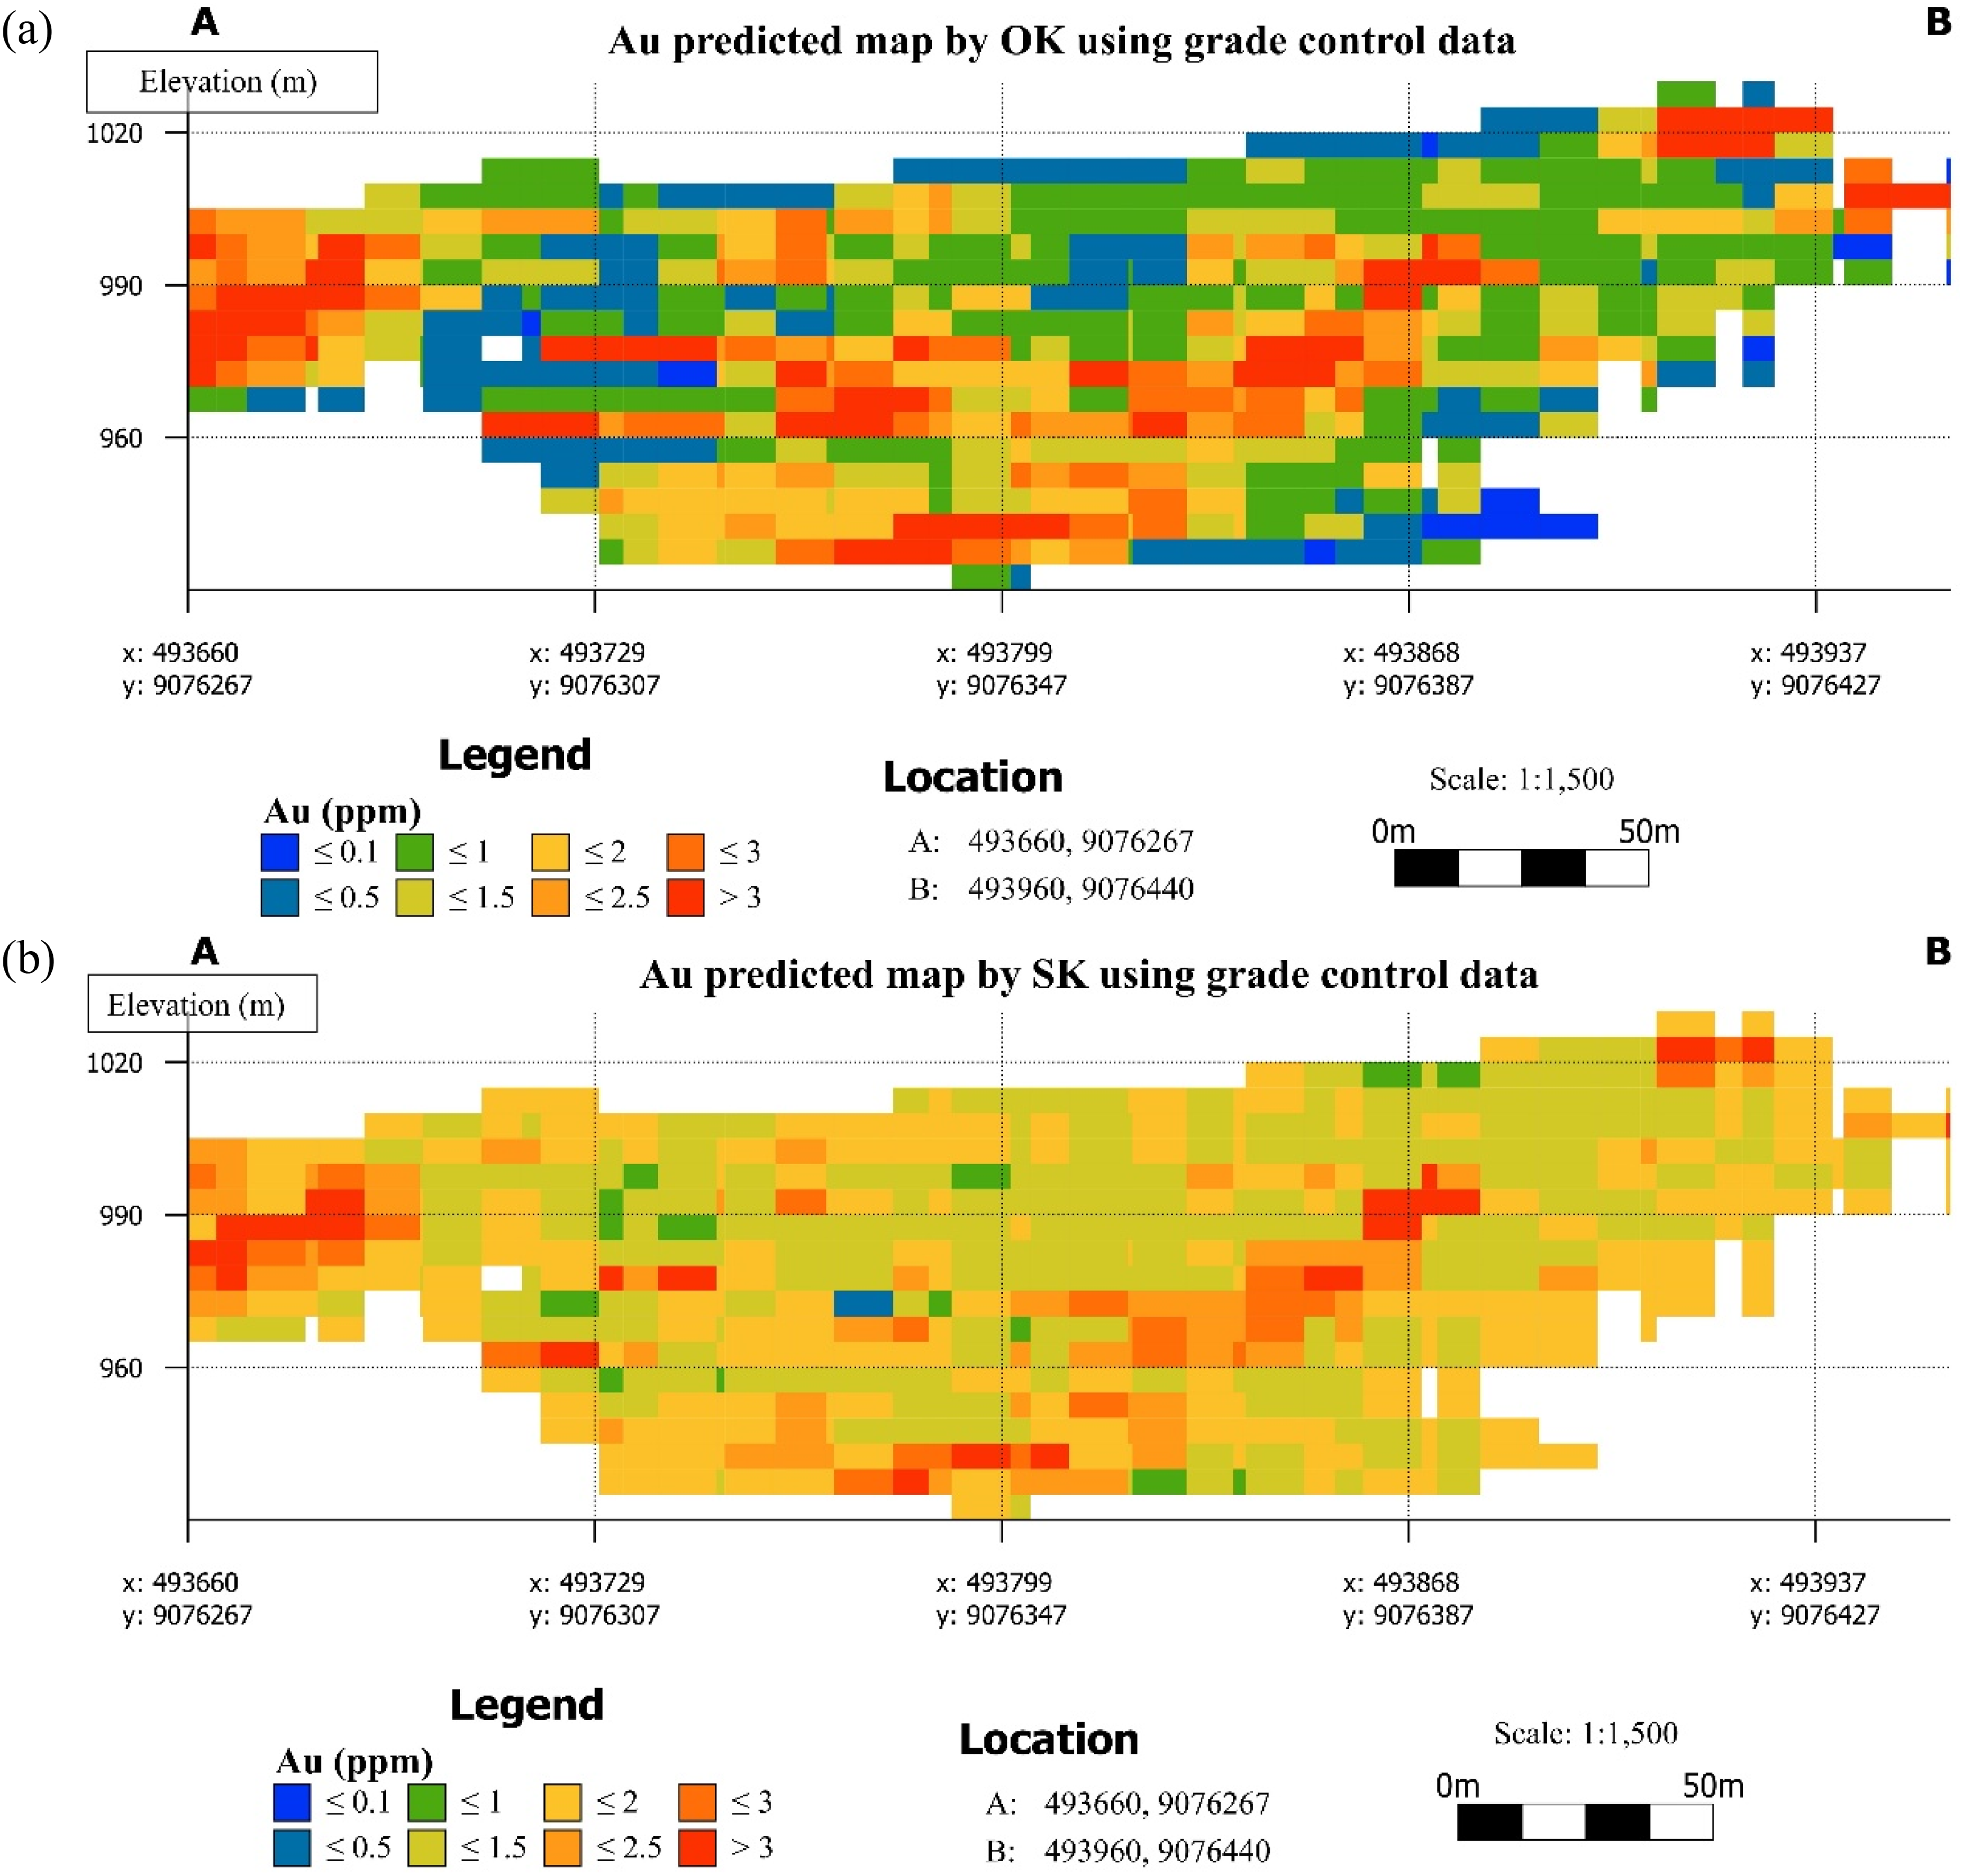
Au block grade cross-sections based on estimates using grade control data: (a) OK and (b) SK. OK: ordinary kriging; SK: simple kriging.
Both the OK and SK models derived from grade control data are dominated by moderate- to high-grade Au values (1.0–3.0 ppm), with low-grade zones (≤0.5 ppm) almost absent from the interior of the mineralised envelope. This contrasts with the exploration-based estimates, where extensive low-grade zones were prominent. A strongly mineralised interval is consistently reproduced by both estimators between approximately 940 and 1005 m elevation, confirming that the principal ore zones occupy comparable spatial positions regardless of the kriging method employed.
The OK model (Figure 7(a)) exhibits a highly heterogeneous grade distribution, with high-grade zones exceeding 3 ppm occurring throughout the section rather than being confined to discrete anomalous regions. Dense sampling allows OK to preserve short-scale grade variability and local high-grade fluctuations. The resulting pattern indicates that the deposit is substantially more heterogeneous and higher-grade than the exploration-based OK model suggested.
The SK model (Figure 7(b)) reproduces a broadly comparable grade distribution but with a notably greater degree of spatial coherence. The most visually apparent distinction is the more continuous and spatially extensive development of moderate-grade zones (approximately 1.5–2.5 ppm), which form broader transitional zones between high-grade cores and the moderately mineralised envelope margins. Isolated occurrences of very high grades (>3 ppm) are still reproduced in the SK model, particularly in the west-central and eastern portions of the section, but their spatial extent is reduced relative to the OK model.
Kriging-based deterministic uncertainty
Comparison of OK and SK kriging variances using exploration data
Kriging variance quantifies the deterministic uncertainty associated with the estimation process, being a function of data configuration and the variogram model rather than the data values themselves (Chiles and Delfiner, 2012; Monteiro da Rocha and Yamamoto, 2000; Rossi and Deutsch, 2014). The OK variance map (Figure 8(a)) displays a well-defined low-variance zone (KV ≤ 0.2) occupying a substantial portion of the section interior, predominantly between 940 and 1010 m elevation across the central to east-central region. This low-variance zone is spatially extensive and largely continuous, reflecting the relatively clustered distribution of exploration drill hole within the deposit core. Intermediate variance (KV between 0.5 and 1.5) increases progressively towards the section margins, consistent with increasing drill spacing and declining estimation confidence away from the sampled core. High-variance zones (KV > 2) are concentrated along the lower margin of the section (approximately 890–920 m elevation) and along both lateral boundaries, where data coverage becomes sparse. Additionally, scattered high-variance blocks also appear within the central elevation region due to localised gaps in drill hole coverage.
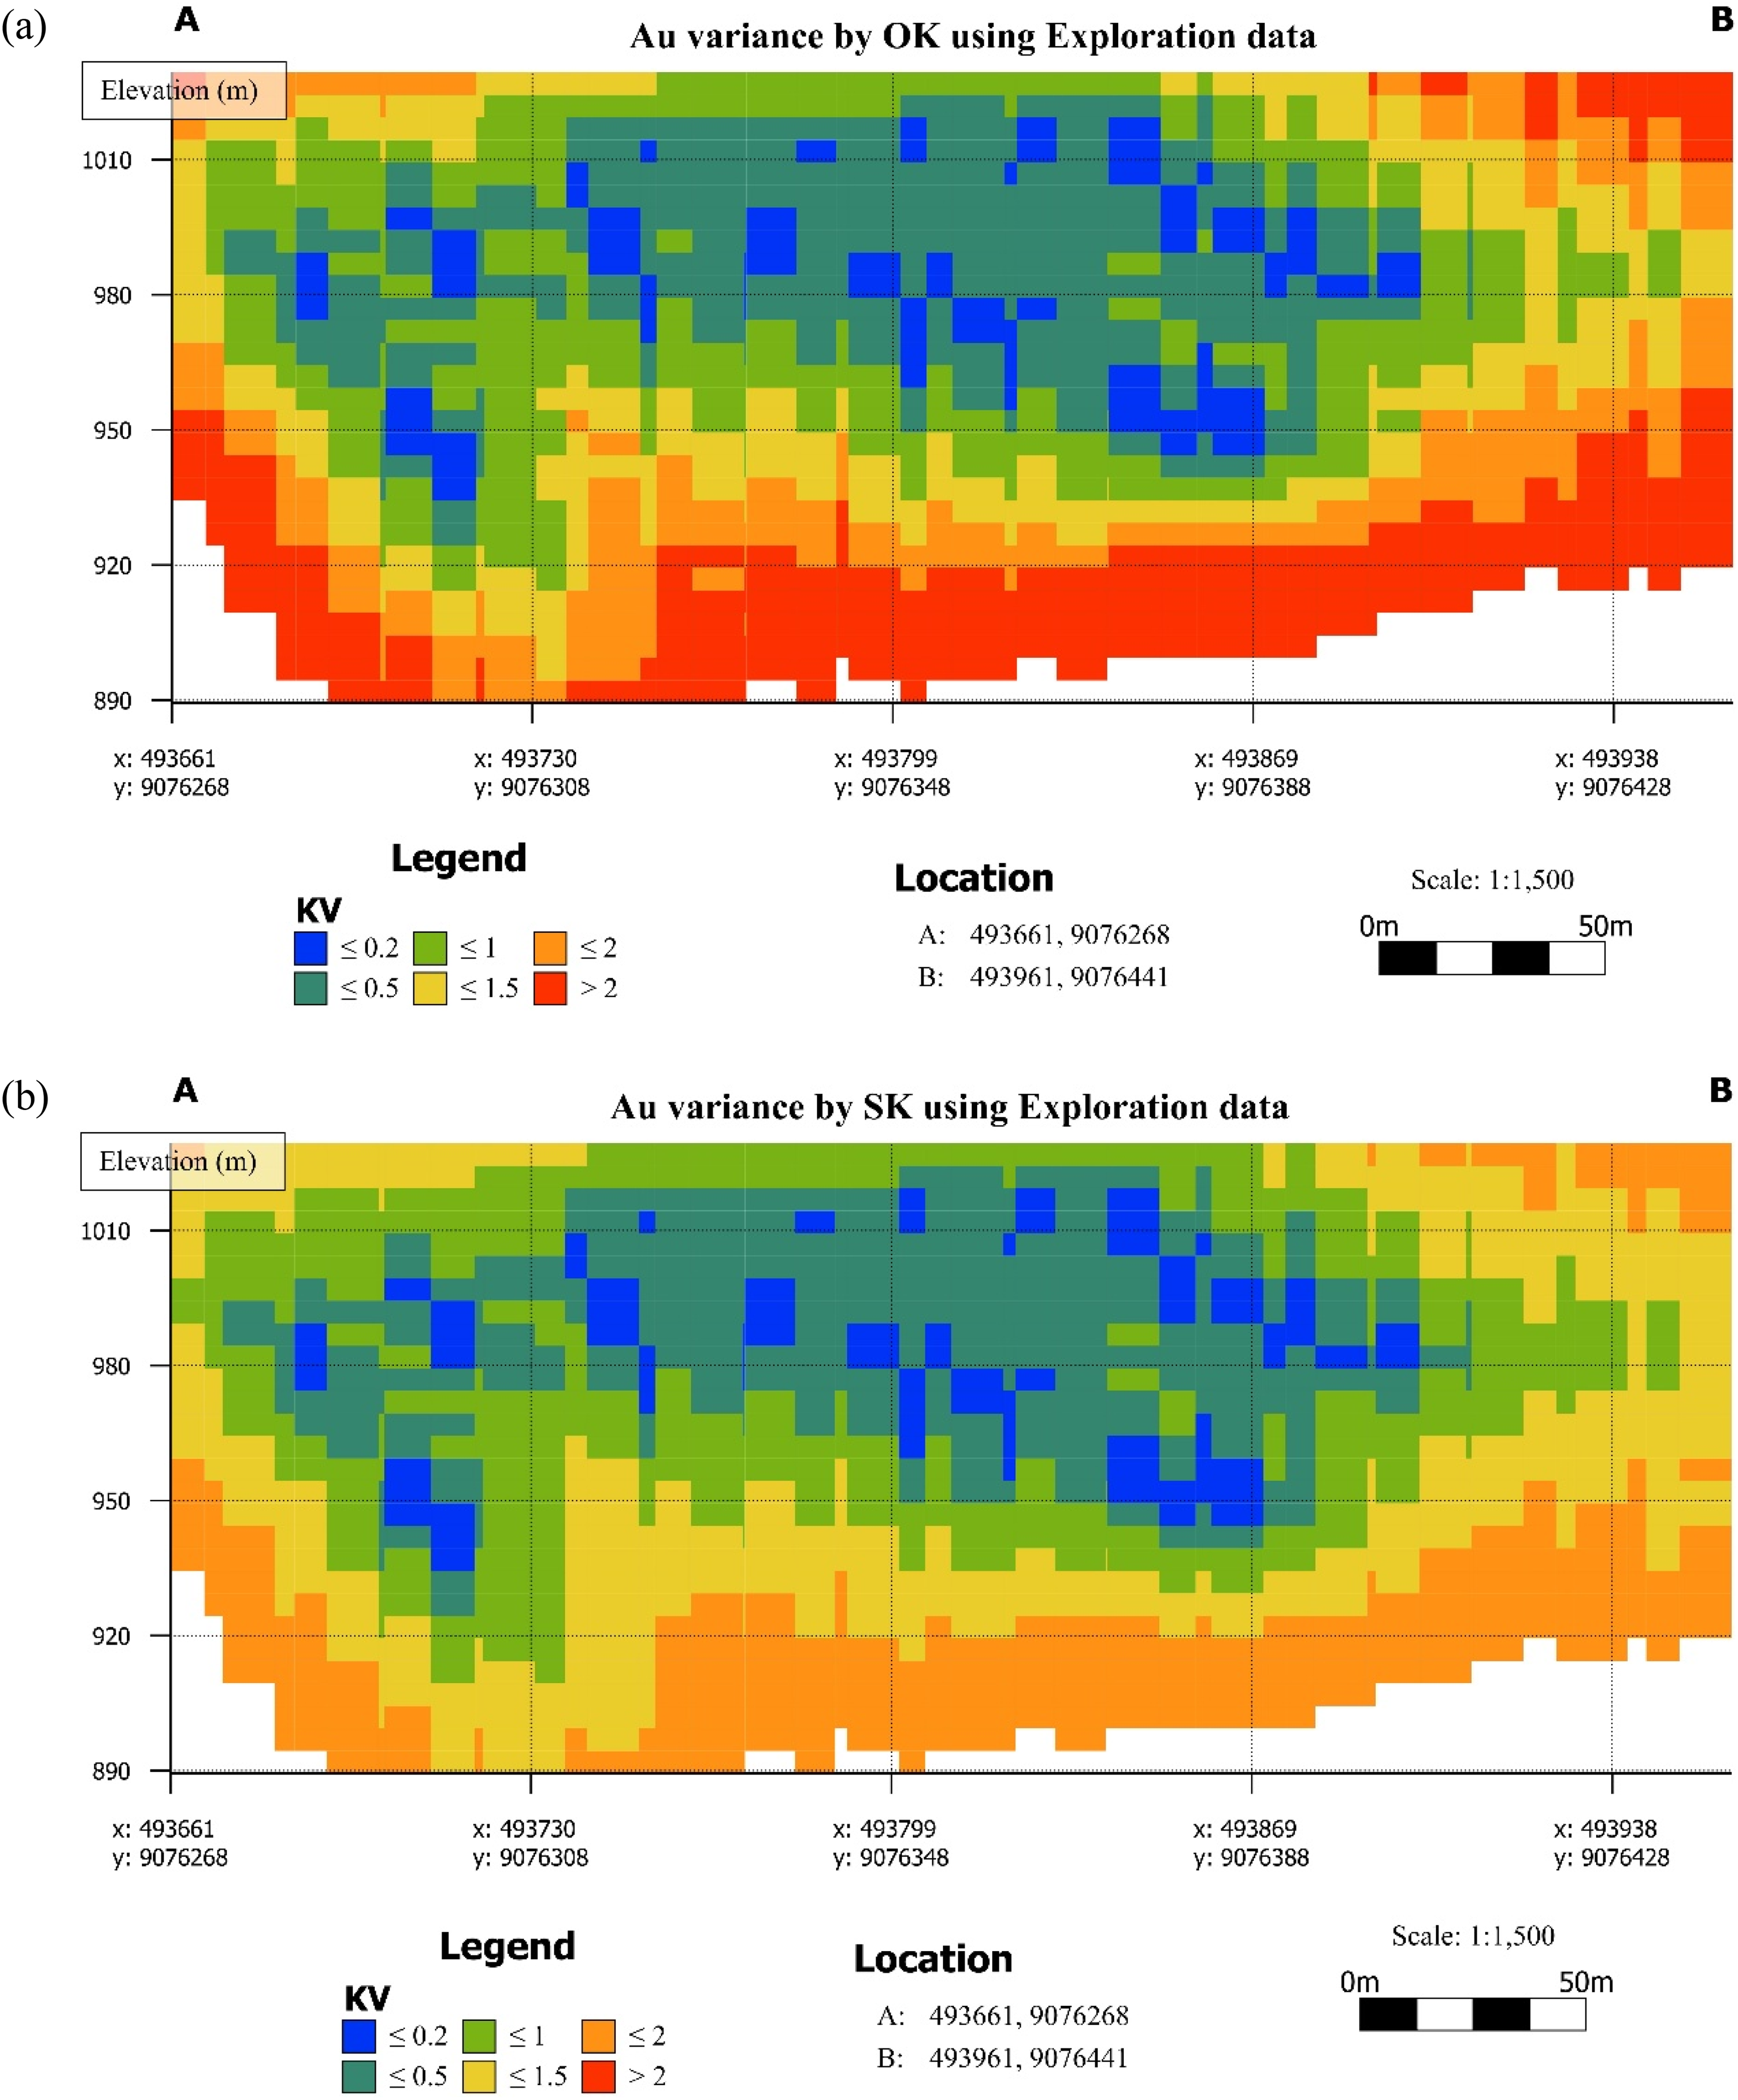
Kriging variance cross-sections based on exploration data estimated by (a) OK and (b) SK. OK: ordinary kriging; SK: simple kriging.
The SK variance map (Figure 8(b)) exhibits two distinct spatial patterns evident from the cross-section. First, the low-variance (KV ≤ 0.2) and intermediate-variance (0.5–1.5) are spatially dominant in the central part of the section. Second, the overall variance range across the section appears more compressed, with fewer extreme high-variance occurrences (KV > 2) relative to the OK map, and a more gradual, homogeneous transition from low to moderate variance across the section interior.
Although OK and SK differ in their spatial variance patterns, as demonstrated above, both share a fundamental limitation: kriging variance is a function of data geometry and the variogram model alone, and is mathematically independent of the actual grade values at sampled locations. In gold deposits, this independence is a critical weakness. Grade variability scales with Au concentration through the proportional effect, meaning that high-grade zones exhibit greater local variability than low-grade zones (Goovaerts, 1997; Szatmári and Pásztor, 2019). Kriging variance cannot capture this relationship because a block located within a high-grade zone and a block of identical geometry in a low-grade zone will receive the same kriging variance, despite genuinely different estimation uncertainty. In this deposit, where a strong nugget effect drives substantial short-range grade variability concentrated in the mineralised intervals, kriging variance therefore systematically misrepresents the spatial distribution of estimation confidence. This reinforces the need for SGS to complement deterministic uncertainty assessment, since conditional variance responds to both data geometry and the local grade variability reproduced across realisations.
Comparison of OK and SK kriging variances using grade control data
The kriging variance distributions derived from grade control data differ from those derived from exploration data, reflecting the substantially denser, more regularly spaced drilling pattern of the grade control dataset. The OK variance map (Figure 9(a)) is dominated by moderate-to-high variance values (KV about 1–2 and >2), which dominates most of the section between 940 and 1005 m elevation. Low-variance zones (KV ≤ 0.5) occur as narrow, discontinuous patches rather than a coherent central core, concentrated primarily in the west-central portion of the section around 970–1000 m elevation and in isolated clusters along the central part. High-variance blocks (KV > 2) are not confined to the section boundaries but appear extensively throughout the interior part of the cross-section. This reveals that grade control drilling produced higher OK variance (and therefore uncertainty) than in the exploration case and is attributed to the shorter variogram range. With a shorter range, blocks located even slightly beyond the immediate influence of nearby drill holes attract rapidly increasing variance, producing a highly heterogeneous uncertainty surface that closely tracks the actual drill hole spacing geometry.
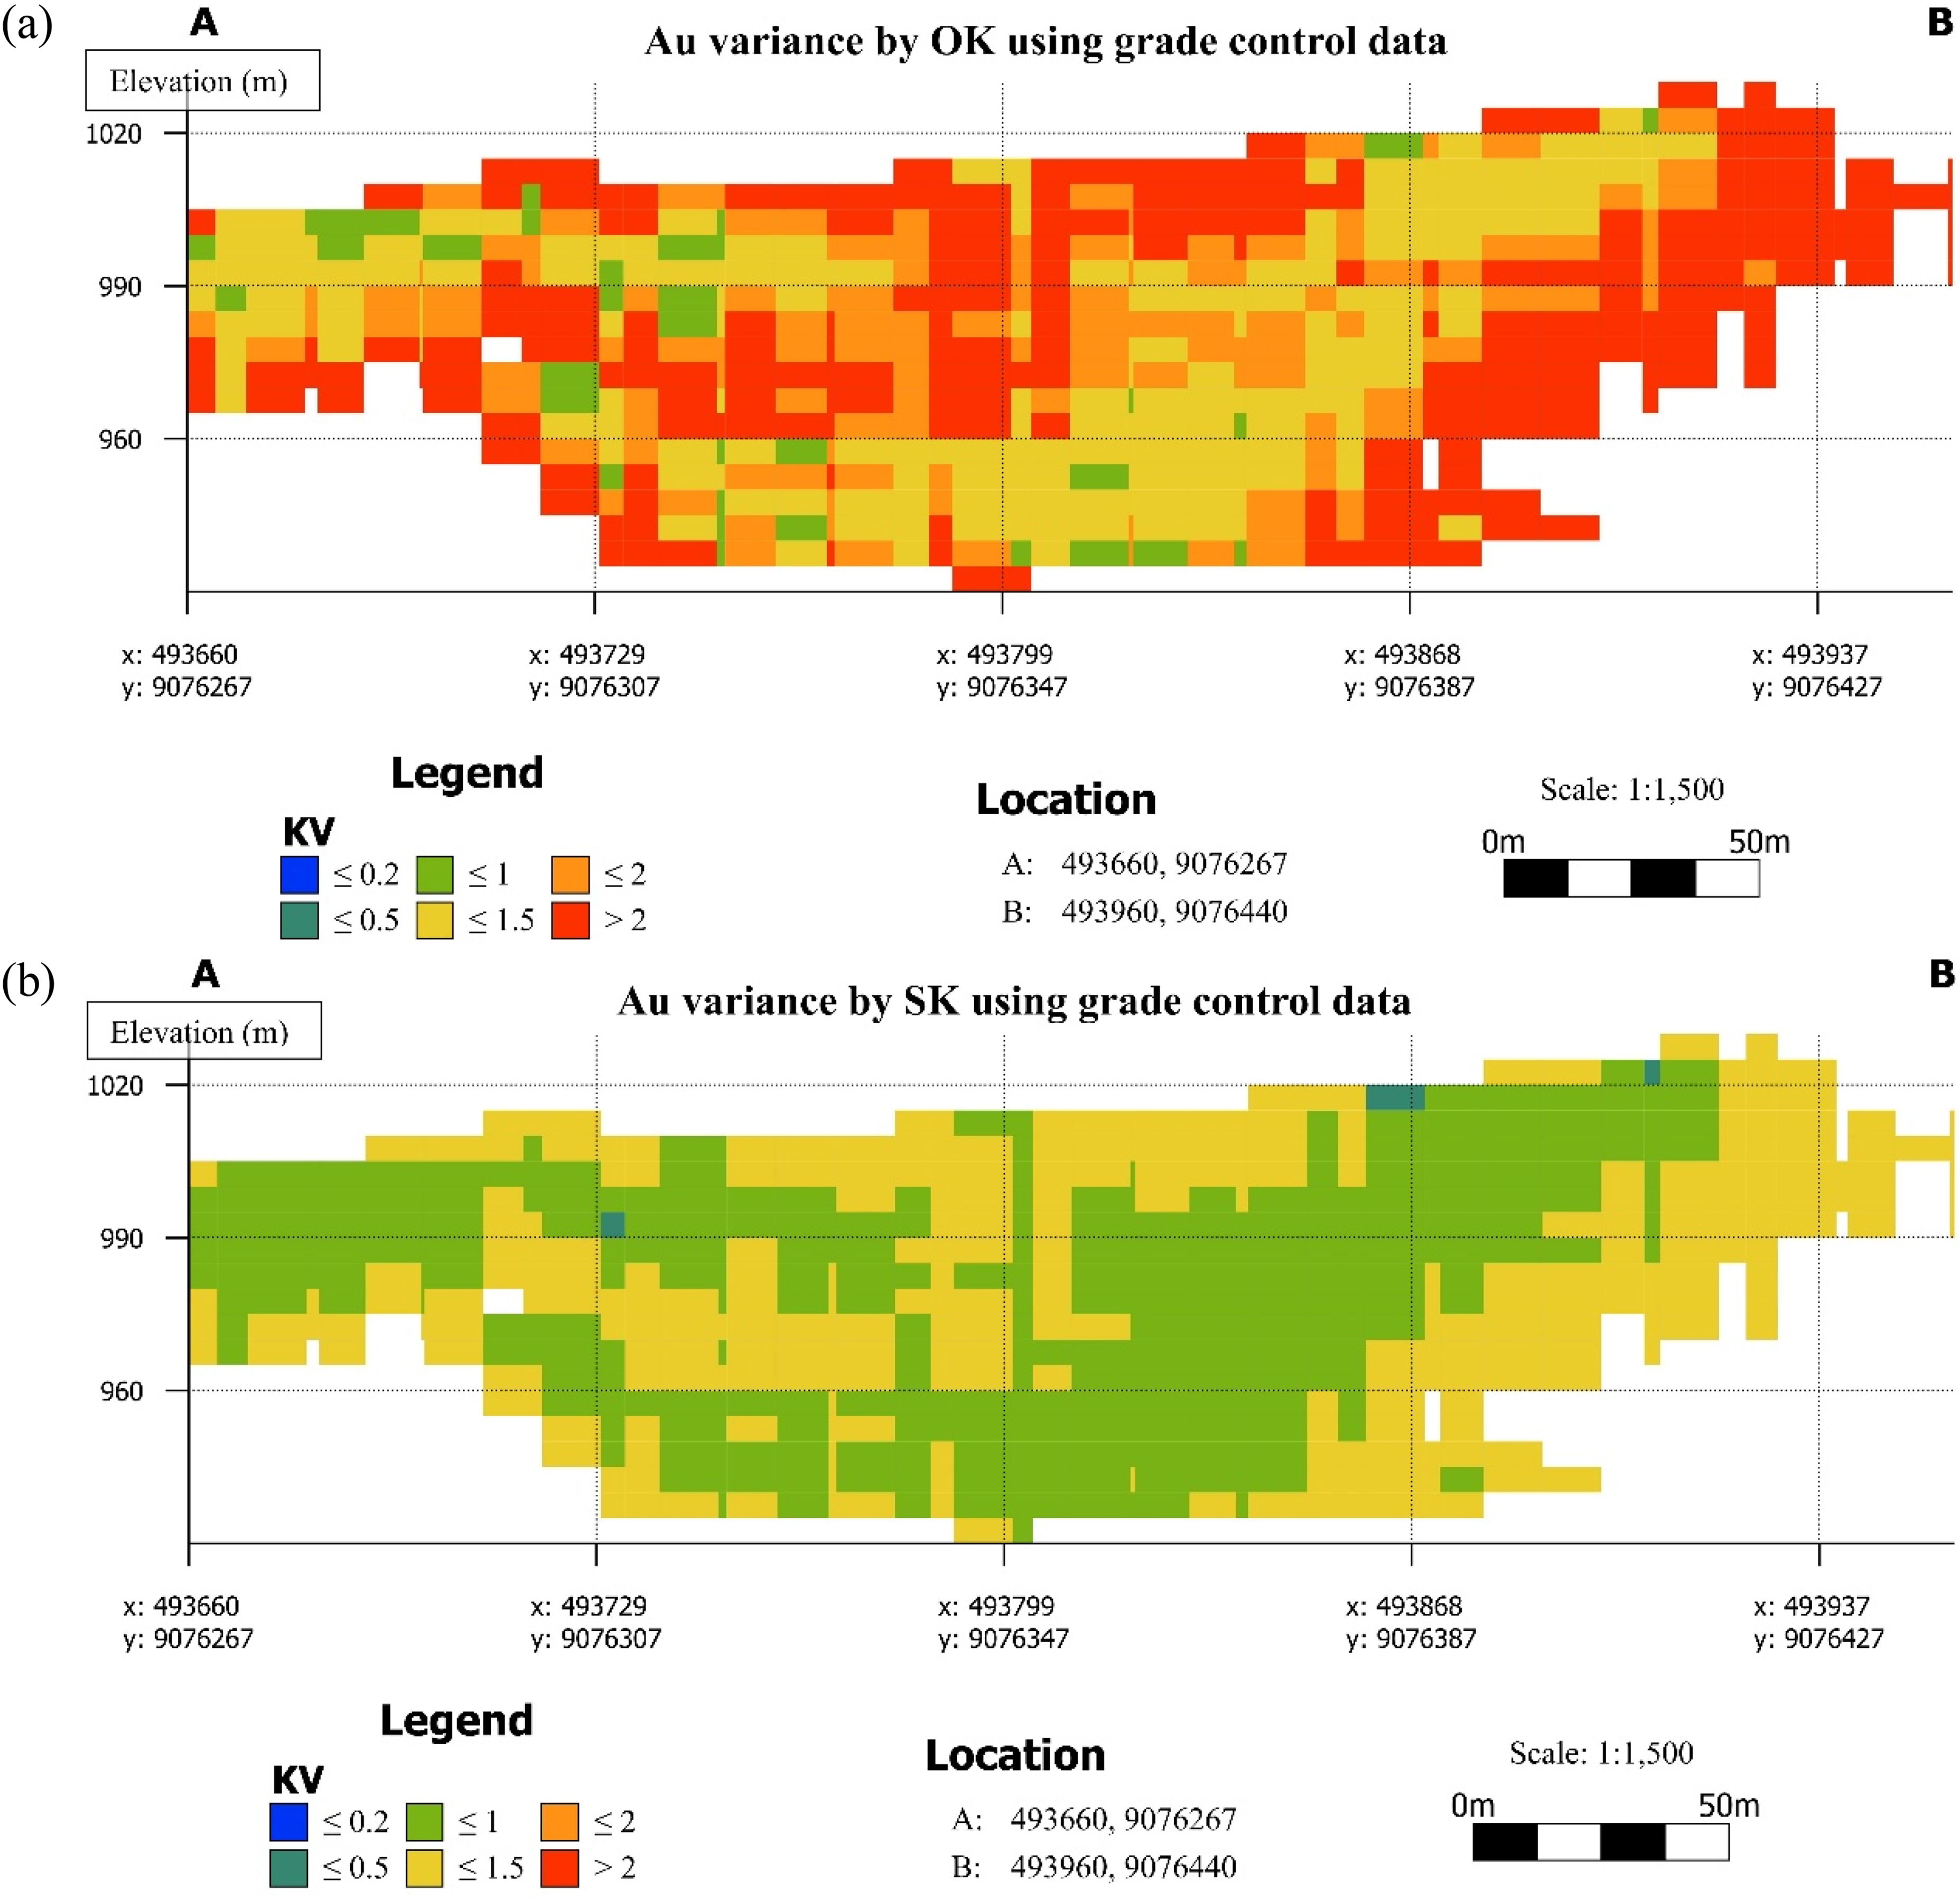
Kriging variance cross-sections based on grade control data estimated by (a) OK and (b) SK. OK: ordinary kriging; SK: simple kriging.
The SK variance map (Figure 9(b)) presents significantly contrasting results. The section is dominated by low-to-moderate variance values (KV ≤ 1), forming a spatially coherent, continuous low-uncertainty zone across the full mineralised interval between 940 and 1005 m elevation. High-variance occurrences (KV > 2) are virtually absent from the section interior of the domain. The variance distribution is noticeably smoother and more uniform than the OK result, consistent with the theoretical property that SK variance is independent of data values and depends solely on data geometry and the stationary variogram model. Under the dense grade control sampling configuration, SK variance converges towards low values across the well-sampled interior, yielding the most spatially confident uncertainty estimate.
The contrast between Figure 9(a) and (b) therefore quantifies a key distinction in uncertainty behaviour. OK variance responds sensitively to the short-range variogram structure resolved by grade control data, producing high and spatially variable uncertainty even within closely spaced drill holes. In contrast, SK variance, anchored to a stationary global mean, produces a consistently low uncertainty surface wherever data coverage is adequate.
Data density impact on deterministic uncertainty
The comparison of the kriging variance maps based on low and dense data highlights the dominant influence of data spatial configuration, density, and applied technique on estimation uncertainty. When the change in uncertainty across two kriging methods is compared during the transition, from exploration to grade control, the result demonstrates that increased sampling density reduces SK uncertainty more uniformly and predictably than OK, though OK reflects the true local estimation confidence relative to the resolved spatial correlation structure. Specifically, SK consistently showed the lowest and most spatially uniform uncertainty of all evaluated scenarios under grade control data (Figure 9(b)). OK, conversely, produces its most confident estimates under exploration data (Figure 8(a)), and its uncertainty deteriorates markedly under grade control density (Figure 9(a)). This is driven by the variogram range that renders inter-hole blocks more poorly constrained despite closer overall drill spacing. The choice of estimation method therefore has a greater practical impact on deterministic uncertainty than data density alone. This distinction carries direct implications for resource classification in structurally controlled gold deposits where variogram range contracts significantly with increasing sampling scale.
Spatial uncertainty by stochastic simulation
SGS requires the variable of interest to follow a standard Gaussian distribution with a mean of 0 and standard deviation of 1 (Moreno et al., 2025). Given the strong positive skewness commonly observed in gold grades (Dominy and Petersen, 2005; Ibrahim et al., 2022), compositing and normalisation were necessary to limit the influence of extreme values on estimation performance following established geostatistical practice (Coombes, 2008; Gringarten and Deutsch, 1999). Unlike kriging, which yields a single smoothed estimate, SGS preserves the full-grade variability and spatial connectivity of mineralisation, providing a probabilistic framework for quantifying spatial uncertainty and evaluating information gain across sampling densities. SGS realisations from both the exploration and grade control datasets were examined to evaluate the information gain and spatial uncertainty variation achieved during the transition from sparse exploration drilling to dense grade control sampling, as explained in the following sub-sections.
SGS realisation based on exploration data
Like kriging, SGS was executed using a grid with a 10 m × 10 m × 5 m spacing along the easting, northing, and elevation coordinates. The grid contains 28, 22, and 26 blocks along the east, north, and vertical directions for exploration data. In total, 200 SGS realisations for gold (Au) grades in exploration data were produced. The search neighbourhood was constrained to 4 to 20 conditioning samples together with a maximum of 12 previously simulated nodes. The mean of all realisations (SGS E-type) and two random realisations are summarised in Table 4, in which all statistical properties are almost similar.
Statistical properties of SGS realisations using exploration data.
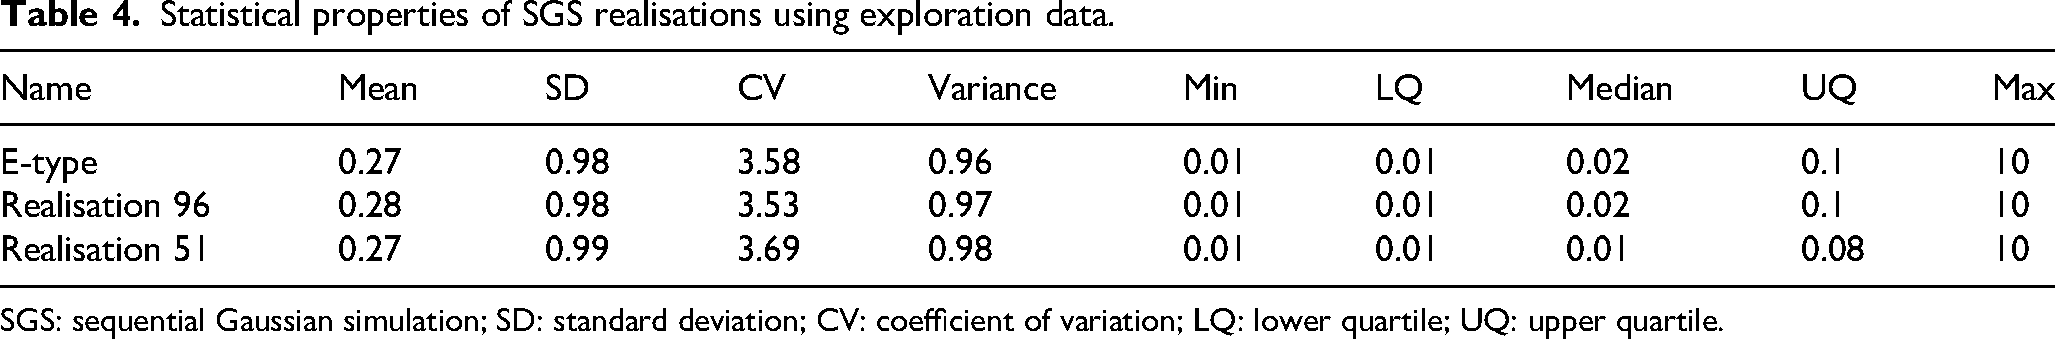
SGS: sequential Gaussian simulation; SD: standard deviation; CV: coefficient of variation; LQ: lower quartile; UQ: upper quartile.
The SGS E-type map (Figure 10(a)) illustrates the mean of 200 realisations and displays a spatially smoothed grade distribution dominated by low-to-moderate grades (Au ≤ 1 ppm) across most of the section. High grades (2–3 ppm) are confined to two loosely defined zones: one in the central to west-central portion of the section between 940 and 975 m elevation, and a secondary occurrence towards the eastern end near 990–1005 m elevation. The upper section above approximately 1010 m and the lower margin below 930 m remain consistently low grade in the E-type, reflecting the decrease of mineralisation at the deposit boundaries. In addition, the SGS E-type map matches closely with OK and SK grade predictions.
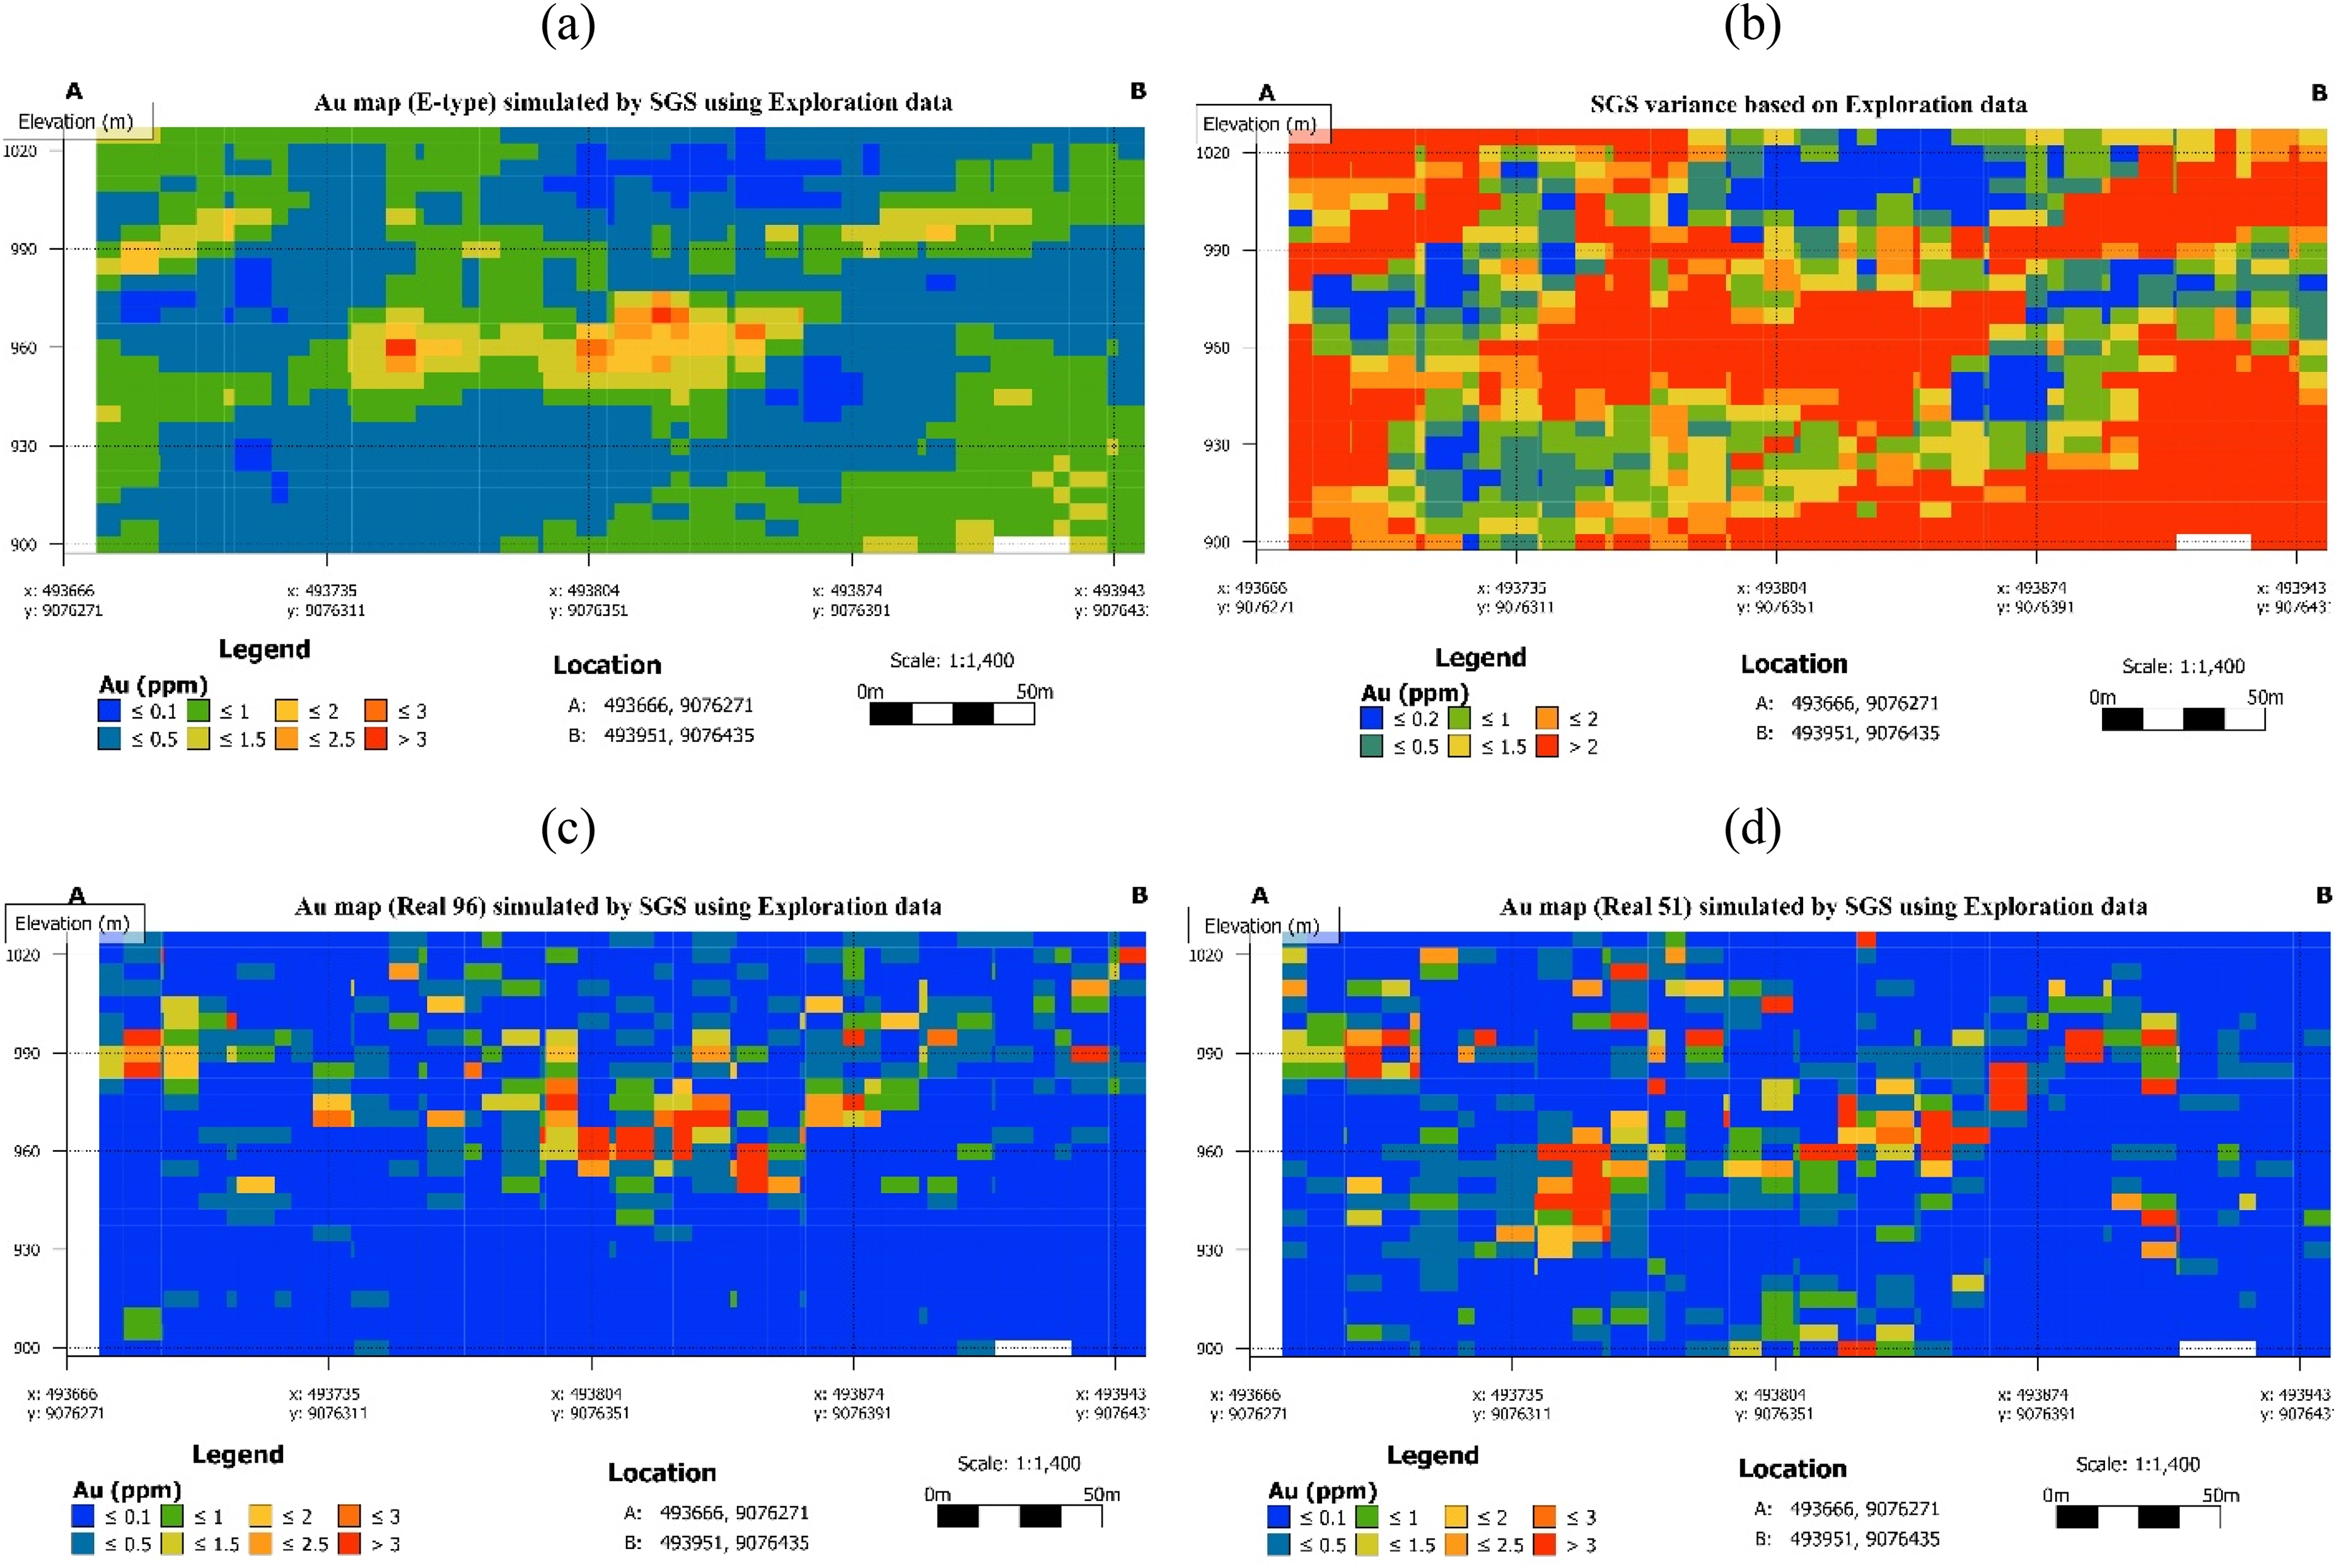
Realisation cross-sections based on exploration data: (a) SGS E-type, (b) conditional variance, (c) realisation 96. and (d) realisation 51. SGS: sequential Gaussian simulation.
The conditional variance map (Figure 10(b)) reveals a highly heterogeneous uncertainty structure. High variance (conditional variance >2) dominates most of the section interior, including the central mineralised zone, indicating that even within the primary ore interval the 200 realisations disagree substantially on local grade values. Low conditional variance zones (≤0.2) are sparse and irregularly distributed, with no coherent spatial pattern, confirming that the exploration dataset provides insufficient conditioning to resolve local grade variability across most of the deposit volume. Unlike kriging variance, which depends only on data geometry and not on simulated values, conditional variance captures local uncertainty by computing the distribution of grade values across multiple realisations, making it appropriate for assessing local estimation confidence.
Realisation 96 (Figure 10(c)) shows a section dominated by low-grade blocks (Au ≤ 0.5 ppm) with scattered, isolated high-grade zones (Au > 2.5 ppm) distributed erratically across the central and eastern portions of the section. Realisation 51 (Figure 10(d)) reproduces a broadly similar low-grade background but with a different spatial arrangement of high-grade occurrences and varying connectivity relative to realisation 96. This between-realisation instability in the geometry and connectivity of high-grade zones is the defining uncertainty signal of the exploration dataset. The variation between realisations reveals multiple geologically plausible yet mutually inconsistent interpretations of the mineralised system (Liu et al., 2019).
SGS realisation based on grade control data
Similarly, SGS was applied to grade control data using a grid with 36, 27, and 20 blocks in the east, north, and vertical directions, respectively. In total, 200 SGS realisations for gold (Au) grades in grade control data were produced. The statistical properties of SGS E-type and two random realisations are summarised in Table 5. There is similarity in all statistical properties except for the CV, which is low in SGS E-type, indicating low variability around the mean.
Statistical properties of SGS realisations using grade control data.
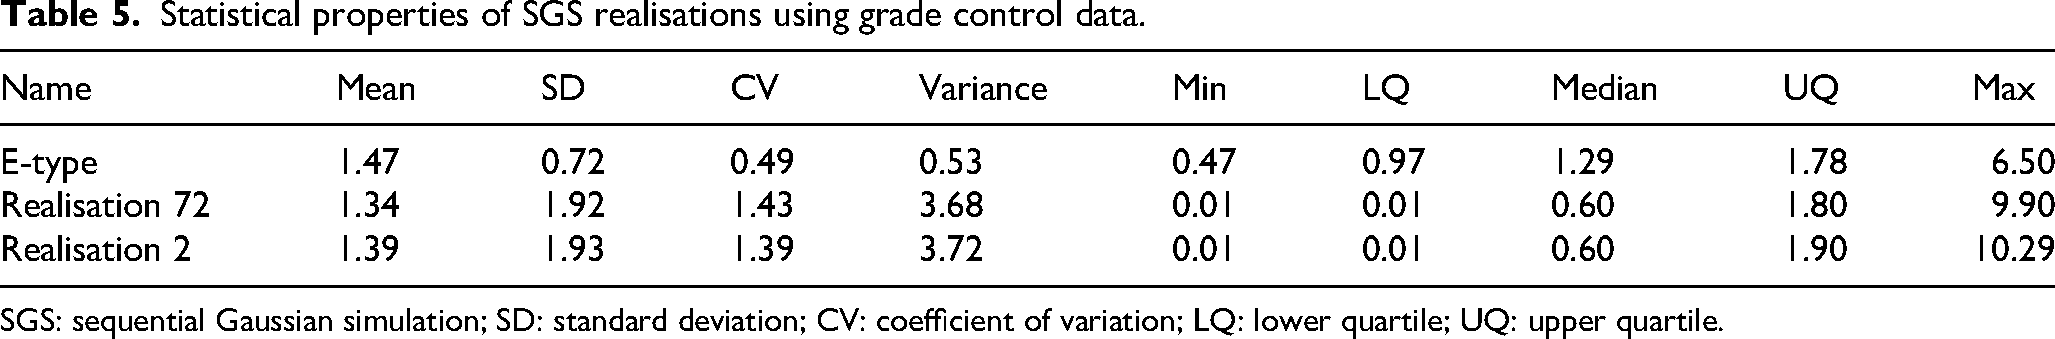
SGS: sequential Gaussian simulation; SD: standard deviation; CV: coefficient of variation; LQ: lower quartile; UQ: upper quartile.
The grade control SGS E-type map (Figure 11(a)) is characterised by a heterogeneous but spatially structured mosaic in which all grade classes are represented. The presence of blocks with no values is due to a low variogram range in the vertical direction of about 2 m. Moderate-to-high grades (1–3 ppm) are dominant across the central mineralised interval between approximately 940 and 1000 m elevation, with the highest-grade concentrations (Au > 3 ppm) consistently occurring in the west-central portion of the section around 970–1000 m elevation and in discrete pods towards the eastern end. Low-grade zones (Au ≤ 0.1 ppm) are almost not present in the grade control E-type map, slightly low grades (Au ≤ 1 ppm) are spatially distributed in the entire section, consistent with the ore envelope boundaries established by kriging.
Realisation cross-sections based on grade control data: (a) SGS E-type, (b) conditional variance, (c) realisation 2, and (d) realisation 167. SGS: sequential Gaussian simulation.
The conditional variance map (Figure 11(b)) reveals a predominantly high-uncertainty structure throughout the interior of the grade control section. High-variance zones (conditional variance >2) dominate most of the mineralised interval between approximately 940–1005 m elevation, appearing extensively throughout both the central and eastern portions of the cross-section rather than being confined to the section margins. Moderate variance (conditional variance between 1.5 and 2) occupies transitional zones, while low-variance patches (conditional variance ≤1) are sparse and irregularly distributed, with no coherent low-uncertainty domain developing across the well-sampled interior. This pattern reflects a fundamental property of SGS conditional variance: unlike kriging variance, it is sensitive to both data geometry and the local grade variability reproduced across realisations, meaning that even densely sampled zones retain high conditional variance where grade heterogeneity is large. The strong nugget effect of this deposit amplifies between-realisation grade variability at short ranges, producing persistently high conditional variance even under grade control sampling density.
The two grade control realisations (Figure 11(c) and (d)) demonstrate consistency compared to exploration-based realisations. Both realisations 2 (Figure 11(c)) and 167 (Figure 11(d)) reproduce the same principal spatial features, whereby a dominant moderate-to-high-grade interior lies between 940 and 1005 m, and high-grade pods (Au > 2.5–3 ppm) occurring in broadly consistent locations in the west-central and eastern portions of the section. In addition, they reveal multiple geologically plausible interpretations of the mineralised system.
Data density impact on spatial uncertainty
A comparison of exploration- and grade control-scale SGS results demonstrate that increases in data density affect distinct components of spatial uncertainty in a non-uniform manner. E-type estimates (Figures 10(a) vs. 11(a)) indicate systematic increases in both mean grade and spatial continuity with increasing data density, consistent with block model statistics (Tables 4 and 5). The grade control model delineates a continuous mineralised zone that is only partially resolved at the exploration scale, indicating under-estimation of both grade and its continuity in the exploration data.
At the exploration scale, structural uncertainty, defined as uncertainty in the geometry and connectivity of high-grade domains, is dominant. Conditional variance (Figures 10(b) vs. 11(b)) does not decrease proportionally with data increase. Both datasets are characterised by high variance (conditional variance >2) across the section interior, and no clearly defined low-variance core emerges under grade control sampling. This behaviour is consistent with a strong nugget effect, in which short-range variability dominates and is not substantially reduced by increased sampling density. The principal difference is observed in the spatial organisation of variance: under exploration sampling, variance is diffuse and weakly structured, whereas under grade control sampling, it is spatially coherent and aligned with the mineralised envelope. This reflects improved local conditioning without a corresponding reduction in variance magnitude. Thus, SGS conditional variance is controlled jointly by data configuration and intrinsic variability, with the latter dominating in high-nugget systems.
Different realisations (Figure 10(c) and (d)) exhibit substantial variability in the spatial positioning and continuity of high-grade zones, indicating weak conditioning to the underlying mineralisation structure. At the grade control scale, the different realisations (Figure 11(c) and (d)) show pronounced spatial convergence, with variability largely confined to short-range grade fluctuations. The geometry of mineralised zones is consistently reproduced, indicating that the sampling configuration is sufficient to constrain the principal structural features of the deposit.
These results indicate that a substantial increase in data reduces structural uncertainty and improves mean grade estimation but does not produce a proportional reduction in conditional variance. In this study, conditional variance was found to be higher in areas with high-grade mineralisation (as shown in Figures 10(a), (b) and 11(a), (b)). This contradicts the norm that an increase in data density reduces uncertainty (Moreno et al., 2025; Sharififar, 2022). Consequently, conditional variance alone is not a sufficient metric for quantifying uncertainty reduction in high-nugget systems. Interpretation requires consideration of additional diagnostics, including realisation convergence and the spatial structuring of variance.
Practical implications for resource classification and mine planning
The observed uncertainty patterns have important implications for mineral resource classification and short-term mine planning. Resource classification commonly relies on measures derived from kriging, such as kriging variance, because these metrics account for the spatial continuity of mineralisation and the redundancy among samples. However, kriging variance is independent of the grade values themselves and therefore does not incorporate the proportional effect that characterises many gold deposits. Consequently, classification schemes based solely on kriging variance may generate unrealistic artefacts, particularly around drill-hole locations where kriging variance is artificially low (Silva and Boisvert, 2014).
This study demonstrates that increased sampling density substantially reduces structural uncertainty, as evidenced by the convergence of SGS realisations at the grade-control scale. High-grade domains became more spatially consistent, indicating improved confidence in the geometry and continuity of mineralised zones. This improvement supports the upgrading of confidence categories because the principal controls on orebody architecture become better constrained. However, conditional variance remained elevated even under grade-control sampling. This reflects the strong nugget effect and the persistence of short-range grade variability within the deposit (Mery and Marcotte, 2022). Thus, while denser drilling improved confidence in orebody geometry, it did not eliminate uncertainty associated with local grade fluctuations. Relying exclusively on kriging variance could therefore exaggerate confidence in high-nugget systems by implying that denser drilling necessarily results in proportional reductions in uncertainty.
Therefore, mineral resource classification in high-nugget gold deposits should consider both deterministic and stochastic measures of uncertainty. Kriging variance remains useful for assessing the influence of sampling geometry, whereas conditional variance and realisation convergence provide complementary information regarding local grade variability and structural stability. Hence, improved structural confidence supports strategic decisions related to resource classification and medium-term planning, whereas the persistence of conditional uncertainty highlights the need for selective mining practices, cautious ore/waste boundary delineation, and continued reliance on grade-control information during short-term production planning.
Uncertainty validation
The uncertainty was validated using two complementary approaches: (i) prediction accuracy at sampled locations and (ii) spatial uncertainty accuracy, following Goovaerts (2001), Wang and Zuo (2024), and Moreno et al. (2025). Validation was implemented using 20% retained data. Prediction accuracy was quantified using the root mean square error (RMSE), which measures the closeness between the observed and predicted values of the variable of interest. Spatial uncertainty accuracy was measured using an accuracy plot and goodness statistic (G). An accuracy plot evaluates whether the predicted probability intervals correctly capture the true proportion of withheld data values. A perfectly calibrated model follows the 1:1 line in the accuracy plot, while systematic deviation above or below indicates over- or under-estimation, whereas in goodness statistic (G) values closer to 1.0 indicate better performance (Fouedjio and Klump, 2019).
Deterministic uncertainty validation
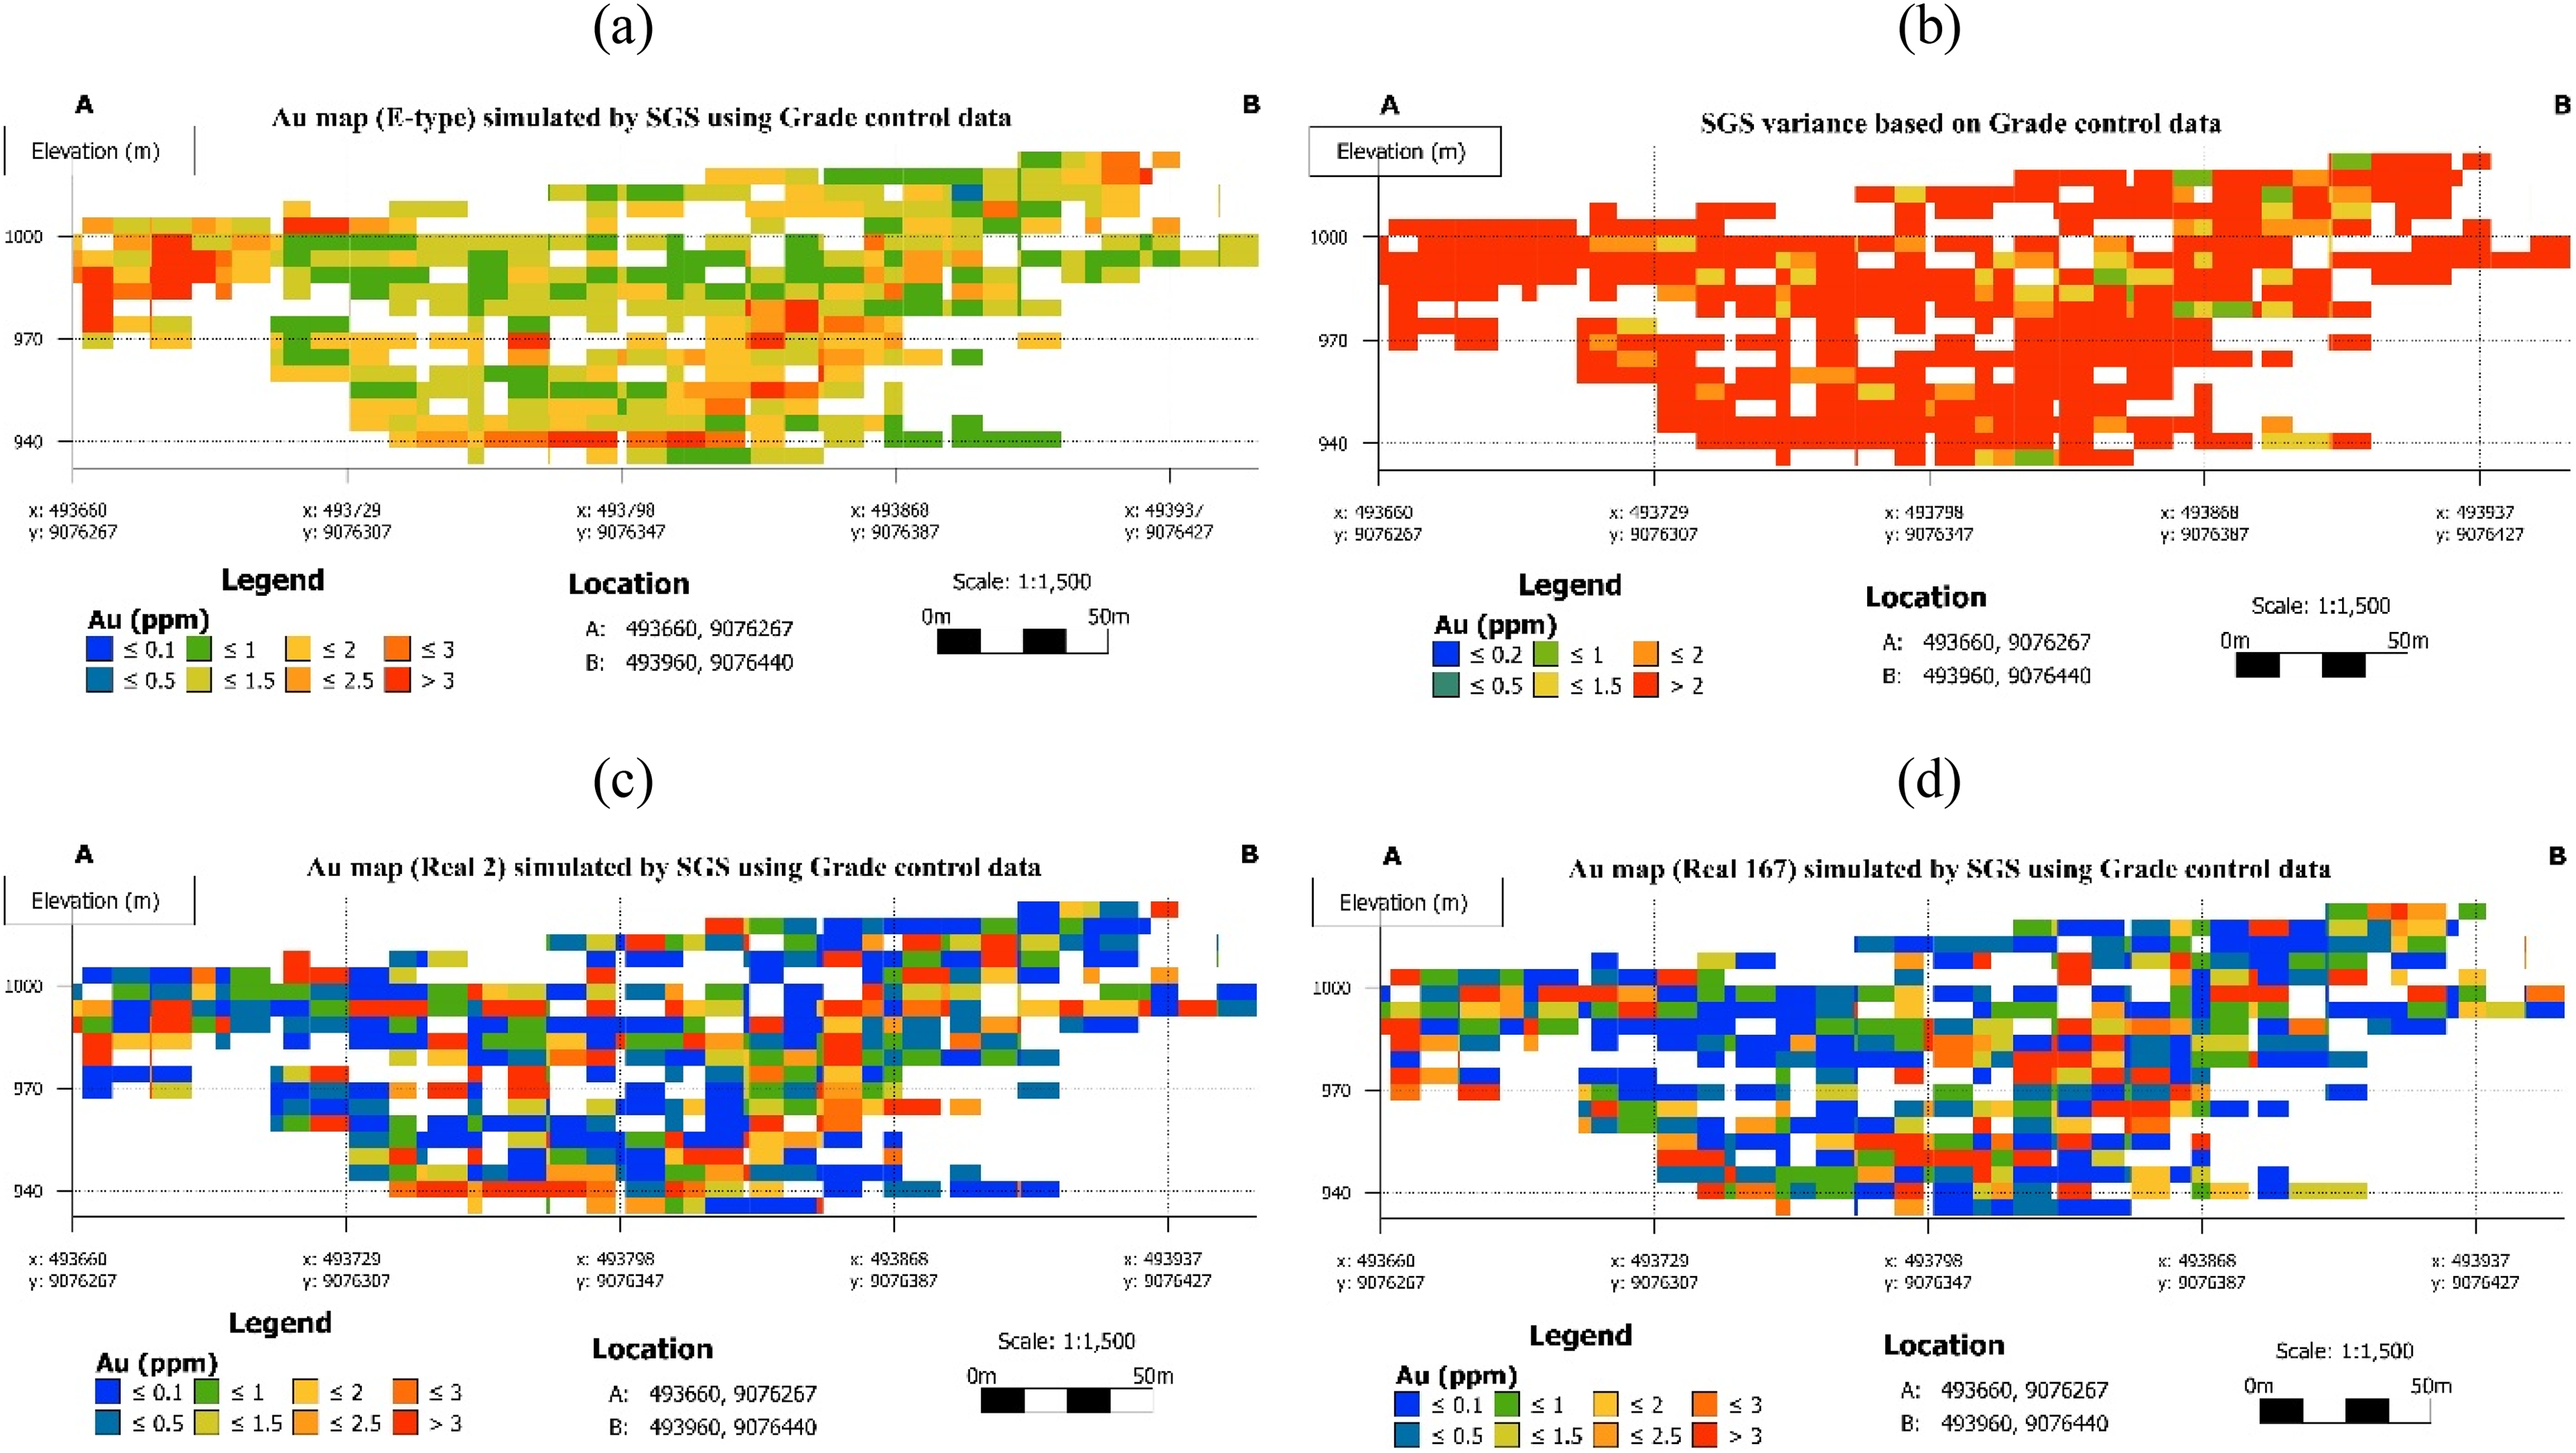
The accuracy plots for OK and SK under both datasets are presented in Figure 12. For the exploration dataset (Figure 12(a)), both OK and SK produce nearly identical accuracy curves that track closely but consistently below the 1:1 line, with the most pronounced deviation occurring between the probability intervals of approximately 0.2–0.5. This reveals a slight over-estimation of uncertainty due to sparse data configurations where kriging variance is inflated by limited local conditioning. Both OK and SK achieve strong and essentially equivalent performance metrics: OK yields RMSE = 0.089 and G = 0.923, while SK yields RMSE = 0.088 and G = 0.924. The minor difference between the two under exploration data confirms that at low sampling density, OK and SK produce statistically similar uncertainties.
OK and SK accuracy plot based on (a) exploration data and (b) grade control data. OK: ordinary kriging; SK: simple kriging.
Under grade control data (Figure 12(b)), both accuracy curves are close to perfect accuracy. This improvement is directly quantified by the metrics: OK achieves RMSE = 0.021 and G = 0.961, representing a 76% reduction in RMSE relative to the exploration case, while SK achieves RMSE = 0.031 and G = 0.941. Particularly, under grade control data, the two estimators diverge in relative performance, with OK outperforming SK in both RMSE and G, achieving near-perfect calibration. The slight tendency of SK to deviate marginally below the 1:1 line in grade control data reflects the influence of its global mean assumption, which introduces some bias in uncertainty calibration when local grade variability is well-resolved by dense sampling. The near-perfect OK calibration under grade control data confirms that when data density is sufficient to support locally estimated means, OK produces the most accurately calibrated deterministic uncertainty model (Fouedjio and Klump, 2019).
Spatial uncertainty validation
The SGS accuracy plots are presented in Figure 13. For the exploration dataset (Figure 13(a)), the SGS accuracy curve deviates consistently above the 1:1 line at theoretical probability intervals, before converging back to perfect calibration at higher probability intervals. Above-line deviation indicates that the simulated uncertainty intervals are too wide and the realisations are spreading more than necessary to capture the validation data, hence revealing over-estimation of uncertainty. With few local data to constrain each simulation path, individual realisations diverge widely across the section interior, inflating the ensemble spread beyond what the deposit's actual grade variability supports at the scale of the validation samples. This is reflected in the weakest validation metrics of all evaluated models: RMSE = 0.144 and G = 0.876.
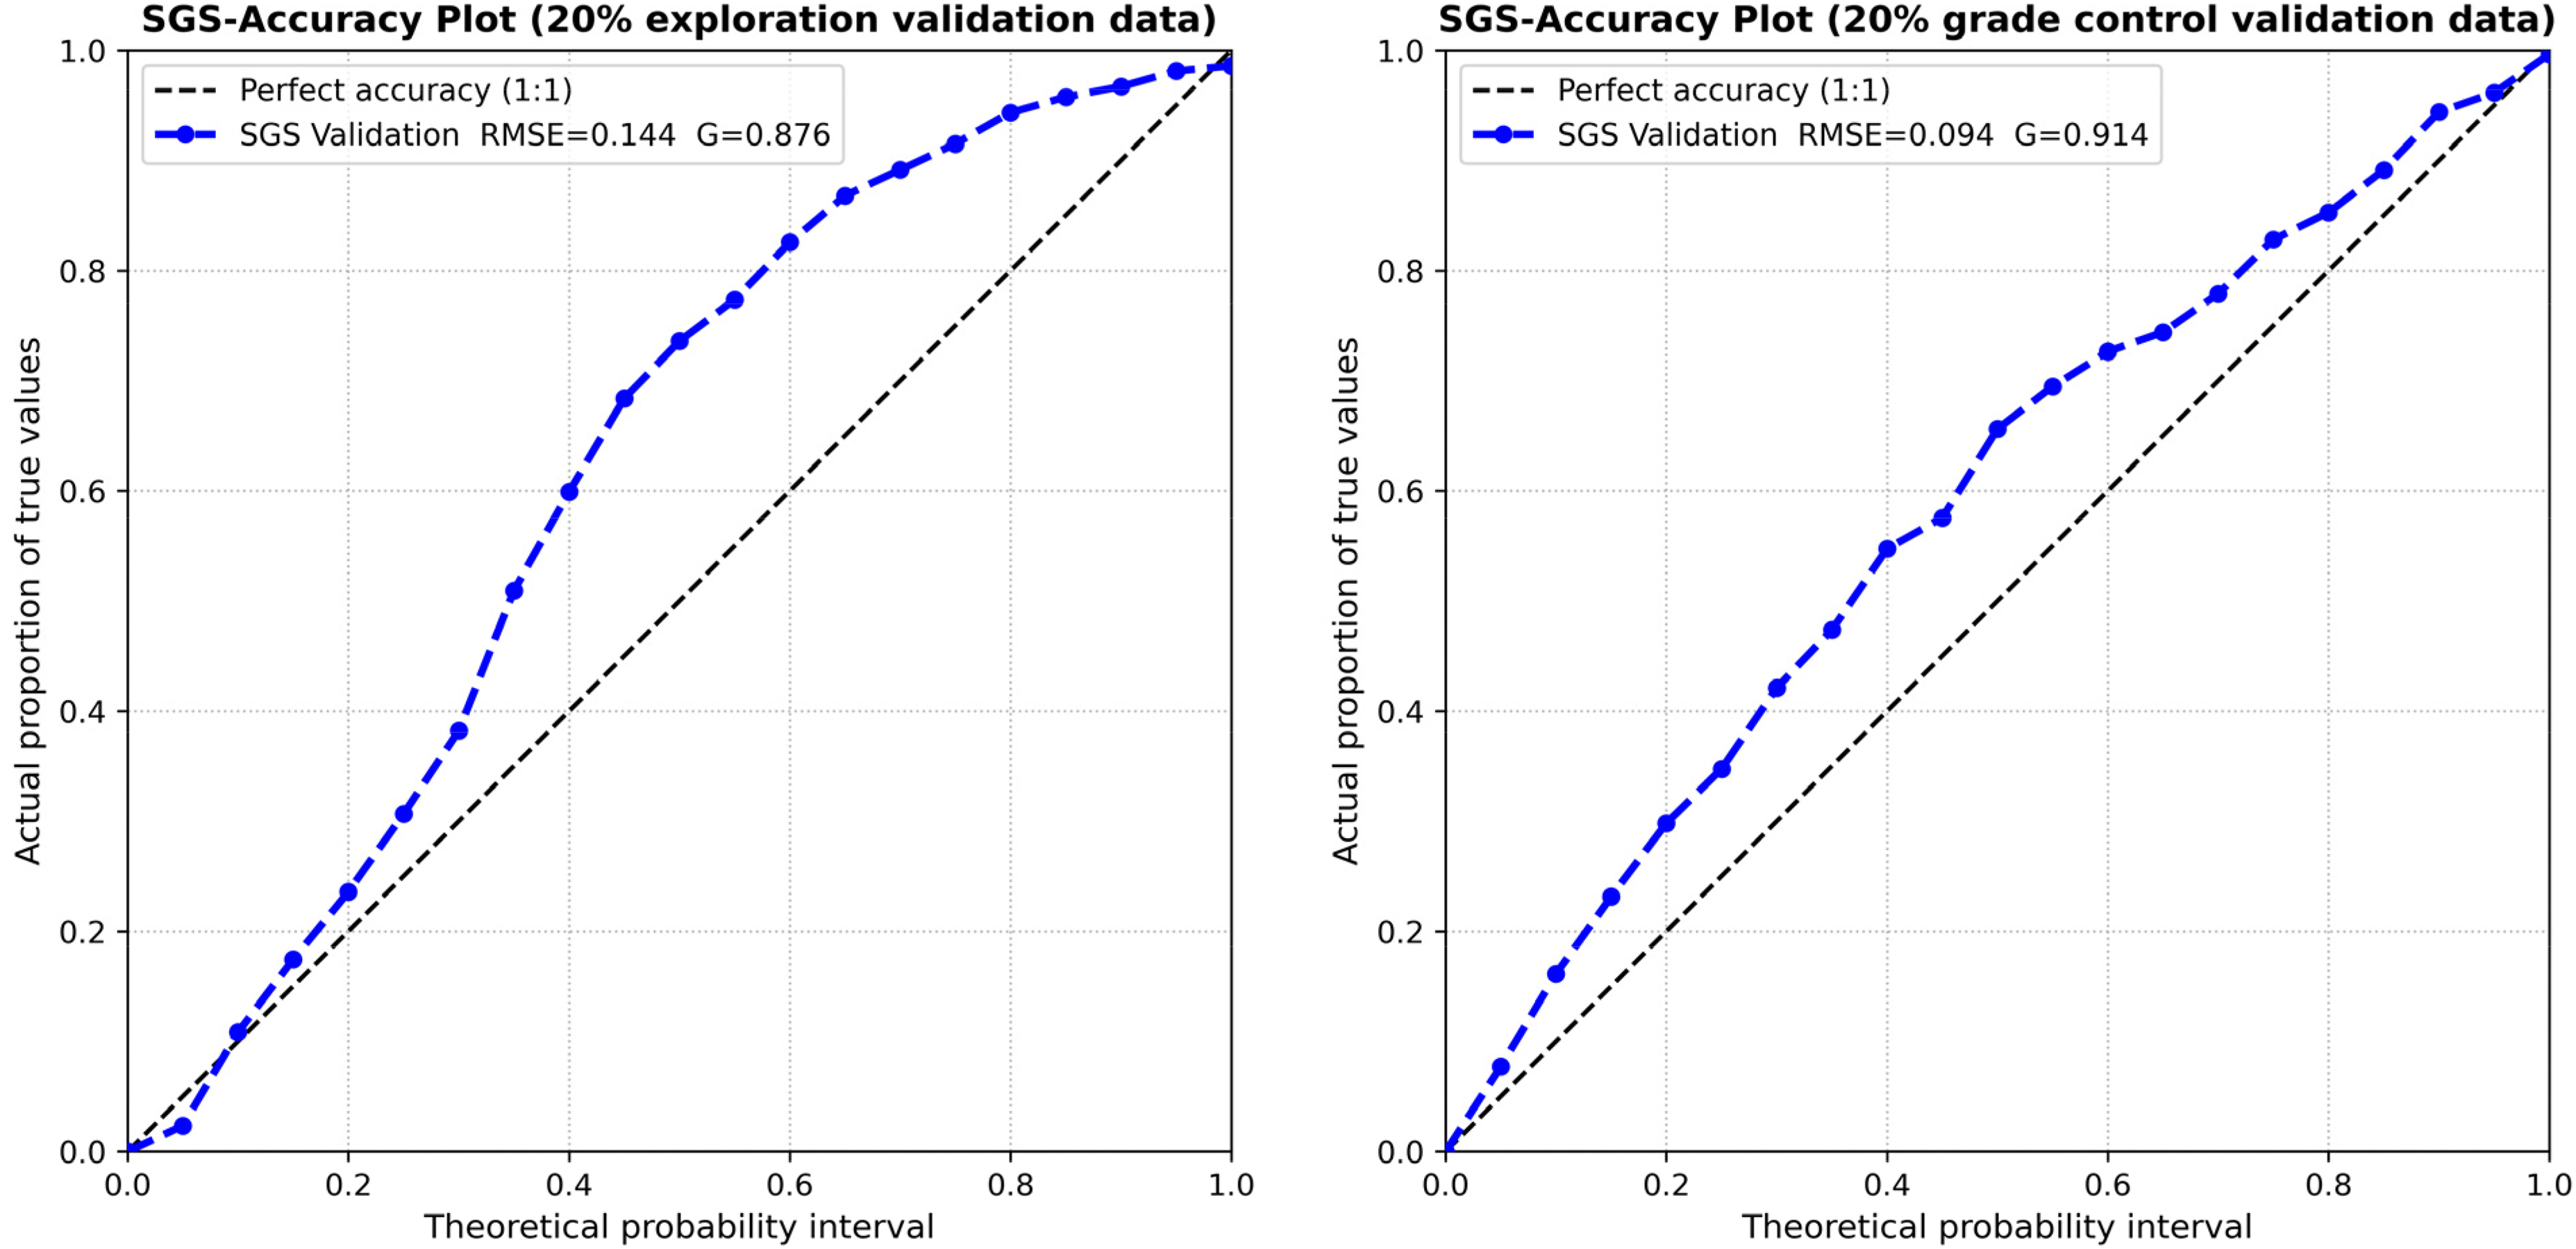
SGS accuracy plot based on (a) exploration data and (b) grade control data. SGS: sequential Gaussian simulation.
Under grade control data (Figure 13(b)), the accuracy curve also runs above the 1:1 line across most of the probability range, indicating that over-estimation of uncertainty persists, though it is substantially reduced relative to the exploration case. The improvement in validation metrics with RMSE = 0.094 and G = 0.914 shows a 35% reduction in RMSE and confirms that the increase in conditioning data narrows the realisation spread towards a more calibrated representation of grade variability (Fouedjio and Klump, 2019; Sharififar, 2022). The residual above-line deviation under grade control conditions is consistent with the deposit's strong nugget and block support effects.
Conclusion
This study evaluated the impact of increased sampling density on grade estimation and spatial uncertainty through a geostatistical comparison of exploration-to-grade-control scale datasets from the same structurally controlled gold deposit. By maintaining a consistent geological setting and block support, the analysis isolated the effect of sampling scale on the geostatistical modelling outcomes, through a controlled geostatistical comparison, keeping geological setting and block support constant. The transition produced a fundamental re-characterisation of deposit grade architecture across all estimation methods. Mean Au grade increased 3.6-fold under kriging and 5.4-fold under SGS E-type, and the variogram major-axis range contracted from 111.3 to 44.0 m, indicating that sparse exploration drilling smoothed short-range variability and over-estimated spatial continuity. Increased data density revealed a more heterogeneous mineralised system characterised by stronger local variability and more spatially coherent high-grade domains.
Deterministic and spatial uncertainty metrics respond fundamentally differently to increased sampling density in high-nugget structurally controlled gold systems. Deterministic uncertainty responded asymmetrically to increased data. OK variance increased due to a contraction of the variogram range, reducing inter-sample support, while SK variance decreased consistently. This confirms that method choice influences deterministic uncertainty behaviour more than data density alone and potentially has direct implications on kriging variance-based resource classification in high-nugget structurally controlled systems.
Stochastic uncertainty varied with changes in data density and configuration. SGS realisations transitioned from structural ambiguity at the exploration scale, with realisations diverging in ore geometry and high-grade connectivity to geometric convergence under grade control data, indicating a substantial reduction in structural uncertainty. However, SGS conditional variance remained high throughout the section interior at both sampling densities, driven by intrinsic short-range variability associated with the deposit's strong nugget effect rather than data sparsity. Accuracy plots confirmed over-estimation of uncertainty at both stages, with below-line deviation reduced but persistent under grade control data (RMSE = 0.144–0.094; G = 0.876–0.914).
Calibration improved across all methods with denser sampling: RMSE decreased by 76% for OK, 65% for SK, and 35% for SGS, with OK achieving superior calibration under grade control (G = 0.961). Residual uncertainty seems dominated by nugget-driven short-range variability that may not be substantially reduced at practical drilling densities. Robust uncertainty assessment in structurally controlled gold systems therefore requires integrated deterministic and stochastic evaluation, as neither kriging variance nor SGS conditional variance alone captures the full dimensionality of spatial uncertainty across exploration drilling campaigns.
Footnotes
Acknowledgement
This work was supported by the Nordenskiöld-samfundet Finland and University of Oulu scholarship.
Author contributions
Funding
The authors disclosed receipt of the following financial support for the research, authorship, and/or publication of this article: This work was supported by the Nordenskiöld-samfundet Finland and the University of Oulu scholarship.
Declaration of conflicting interests
The authors declared no potential conflicts of interest with respect to the research, authorship, and/or publication of this article.
Data availability
Data were provided with a confidential agreement and hence cannot be made available.