
Abstract
Background:
This project evaluates the psychometric properties of a German translation of the Revised Comprehensive Autistic Trait Inventory (CATI-R). Previous measures of autistic traits are often based on a male-referenced conceptualization of autism, which may underestimate autistic traits in other genders. In addition, these measures tend to rely on neurotypical language, which can make it difficult for autistic people to respond and may reinforce stigma. To address these shortcomings, the CATI was originally developed as an alternative to traditional measures, including subscales that capture traits particularly relevant to autistic women. Building on this, we collaborated in an earlier work with members of the autism community to revise the CATI (CATI-R), ensuring more inclusive, respectful, and accessible language and concepts across all genders. In the present study, we translated this revised measure into German and validated it in a large sample of female, male, and non-binary participants. This study explores if the German translation of the CATI-R measures autistic traits fairly across genders and identifies potential differences in trait expression.
Methods:
To validate the German CATI-R, we analyzed data from a large sample (n = 1057), comprising German native speakers with a self-reported autism diagnosis (n = 29), people who self-identified as autistic (n = 84), and non-autistic participants (n = 944).
Results:
We successfully validated a German translation of the CATI-R. A confirmatory factor analysis supported the six-subscale structure (two-factor bifactor model: chi-squared = 2402.85, p < 0.001, root mean square error of approximation = 0.045, standardized root mean square residual = 0.047, comparative fit index = 0.99, and Tucker–Lewis Index = 0.99). With Spearman’s rank correlations, we showed positive relationships between all subscales (all r s > 0.37, ps < 0.001). Moreover, we demonstrated convergent validity with significant correlations between the German versions of the CATI-R, Autism-Spectrum Quotient (AQ), and Broad Autism Phenotype Questionnaire (BAPQ): the AQ (rho = 0.69, p < 0.01) and BAPQ (rho = 0.77, p < 0.01). Finally, a measurement invariance analysis indicated that total scale scores can be compared across genders, while also capturing meaningful gender-based differences in autistic trait expression. We additionally found measurement equivalence across the English and German CATI-R.
Conclusions:
This study replicates findings for the English CATI-R. To our knowledge, this is the first validation of a measure of autistic traits in German that has been developed together with people from the community.
Community Brief
Why is this an important issue?
Most autism questionnaires were created without input from autistic people. Many were also designed around how autism shows up in men, which means they can miss important traits in women and non-binary people. On top of that, these tools often use confusing or clinical language that can feel stigmatizing or hard to relate to. There has never been a German-language autism traits questionnaire that was developed together with the autistic community and validated in a large sample, until now.
What was the purpose of this study?
We wanted to create a German translation of the Revised Comprehensive Autistic Trait Inventory (CATI-R), a tool originally developed in English with help from autistic people. Our goal was to make sure the German translation works just as well, meaning it is reliable, respectful, accessible, and nonstigmatizing. We also wanted to see if it captures autistic traits across different genders fairly.
What did the researchers do?
We worked with native German speakers from the autistic community to translate and adapt the CATI-R. Then, we tested it with over 1000 German-speaking adults, including people with an autism diagnosis, people who identify as autistic, and non-autistic people. We used statistical tools to check how well the questionnaire measured what it was supposed to, how consistent the results were, and whether scores could be fairly compared across genders.
What were the results and conclusions of the study?
The German CATI-R worked very well. It showed the same structure as the English translation and was reliable across all subscales. It matched well with other tools used to measure autistic traits. Most importantly, it worked equally well for men, women, and non-binary people. Non-binary participants reported the highest scores overall, and we saw some expected differences between women and men—for example, women reported more sensory sensitivities.
What is new or controversial about these findings?
This is the first time a German-language autistic traits questionnaire has been codeveloped with the community and tested in such a large and diverse group. Consistent with outcomes from other participatory research in autism, 1 it shows that community-led research can create better tools that reflect real experiences across gender identities. It also highlights that gender-diverse people often report more autistic traits. While prior research has already identified gender differences in autistic traits, including among non-binary people, these differences are still not consistently addressed. Future studies should both continue to investigate how gender shapes autistic experiences and ensure that gender is systematically considered in autism research and clinical practice.
What are potential weaknesses in the study?
Our study relied on self-reported autism diagnoses, not clinical confirmation. Also, while we had more non-binary participants than many past studies, that group was still relatively small. More research is needed with clinically diagnosed and gender-diverse groups to strengthen these results.
How will these findings help autistic adults now or in the future?
The German CATI-R offers a more inclusive and respectful way to explore autistic traits. It may help people who are seeking diagnosis or understanding their identity. Clinicians and researchers can use this tool to better support diverse autistic people in German-speaking communities.
Keywords
Background
Self-report measures of autistic traits are widely used as brief and inexpensive screening tools in clinical practice,2–4 to help characterize participants in research 5 or support people self-explore or initiate their own diagnosis journey. Moreover, the assumptions underlying self-report measures of autistic traits may shape how autistic people are perceived in society because these measures are usually available online (e.g., https://embrace-autism.com for a wide range of measures). This study psychometrically evaluated a German translation of the Revised Comprehensive Autistic Trait Inventory (CATI-R), a measure for autistic traits that was developed in partnership with people from the autistic and autism a community.6–8
Despite their widespread usage, self-report measures of autistic traits are often limited when it comes to identifying autistic traits in female or non-binary people.9–11 For example, a study by Belcher and colleagues 12 revealed that only two items on the most widely used measure, the Autism-Spectrum Quotient (AQ), 13 assess autistic traits similarly across males and females. Such an imbalance stems from a broader historical bias in autism research,14–18 where studies predominantly involved male participants.19–21 As a consequence, traditional measures of autistic traits may not fully capture the nuanced traits displayed by females or non-binary people. This constitutes a severe problem when both researchers and clinicians continue to use measures that are based on stereotypical or male-referenced conceptualizations of autism, as autistic females and gender-diverse people will remain more likely than males to be undiagnosed, misdiagnosed, or diagnosed late.17,18 Misdiagnosis or the lack of a diagnosis, in turn, complicates access to additional support and may deteriorate mental and physical health.22,23
There is growing recognition of gender b differences in autistic experiences.17,22,24–30 These gender differences are apparent across both domains currently used to define autism: social communication/interaction and restricted and repetitive behavior. See Wood-Downie et al. 31 for a review on differences in narrow construct inventories of social interaction and communication. Autistic females may exhibit, for instance, social behaviors more akin to non-autistic peers9,10,32–36 and often mask autistic traits by mimicking neurotypical behavior.9,15 This may lead to meltdown, exhaustion, autistic burnout, and general poor mental health outcomes.15,37,38 Female autistic people also show more hypersensitivities than males. 39 Male autistic people, on the contrary, show more externalizing behaviors, such as hyperactivity, impulsivity, and conduct problems.23,40 Growing recognition of these gender differences has led to intensifying calls for measures that better capture the experiences of autistic people who are not male.
The CATI and the CATI-R
In contrast to these more traditional measures, which are grounded in deficit-based and often male-referenced models of autism, the CATI 41 (for a nonvalidated German translation, see Ref. 42 ) was developed to capture a broader range of autistic experiences and to move beyond a solely male-referenced conceptualization of autism. The CATI aims to assess subthreshold autistic traits, which resemble core symptoms of autism but may be present even in people who do not meet the diagnostic criteria. The 42 items of the hierarchically multidimensional tool cluster into six subscales that represent different dimensions of autistic traits (“Social Interactions (SOC),” “Sensory Sensitivity (SEN),” “Repetitive Behaviors (REP),” “Communication Difficulty (COM),” “Cognitive Rigidity (RIG),” and “Social Camouflage”). The Social Camouflage and SEN subscales set the CATI apart from other widely used autistic trait measures, such as the AQ and the Broad Autism Phenotype Questionnaire (BAPQ), 43 as these scales assess traits that are particularly relevant to female autistic people. 41 English and colleagues 41 provided evidence that, compared with the AQ and BAPQ, the CATI shows stronger internal reliability for both total scale and subscale scores as well as high predictive ability for classifying autism. 41
Despite its unique advantage with respect to identifying autistic traits that do not fit the prototypical male-referenced autism model, autistic participants in our previous work who completed this measure made us aware that the CATI relies on neurotypical language and constructs. This was noted as a common limitation of most currently used measures of autistic traits, and indeed other psychometric assessments. For this reason, these measures may not fully capture autistic experiences,44,45 they may be understood differently by autistic and non-autistic people,46,47 and they may even inadvertently stigmatize autistic experiences.48,49 Examples include the use of figurative language or imprecise terms, such as “often,” which may create an obstacle for autistic people. 50 “Often” as an anchor term can be difficult for autistic people to map onto a rating scale when evaluating their general agreement with the statement and the frequency of the experience. Also, other words, such as the prefix “over” can be understood in pejorative or stigmatizing ways, with some indicating that it implies pathological behavior. Relating to this, the CATI describes certain behaviors from a neurotypical perspective (e.g., a change of plans may distress autistic people instead of simply “annoy” them) and does not capture several frequently reported autistic experiences (e.g., despite the common misconception of a lack of empathy, some people might experience empathetic overload. 51 Finally, despite the general heterogeneity of the individual autistic phenotype 52 and differences in feature profiles of, for instance, female and male autistic people, 32 CATI items are often restricted to a particular context or scenario. To address these limitations, Hechler and colleagues have recently revised the CATI together with 22 people from the autism community and conducted a validation of the study of the CATI-R. 8 The revisions included rewording items to clarify language or make it more respectful and less stigmatizing and expansion of items to capture diverse autistic experiences (detailed information can be found on the project’s Open Science Framework (OSF) page https://osf.io/vt4d2/).
The current project
Autism research and clinical practice have long been shaped by the medical model of disability, which frames neurological differences as abnormalities that should be “prevented,” “cured,” or “fixed.” 53 This model shapes the public perception of autism as something tragic or shameful. 54 By contrast, the neurodiversity paradigm, developed in the 1990s by autistic self-advocacy organizations such as Autism Network International in the United States and Aspies for Freedom in the United Kingdom, emphasizes autistic rights and acceptance, framing neurological differences as natural human variation rather than deficits.55,56 It thus provides a collective strategy to challenge stigma and social marginalization. 57
However, the neurodiversity paradigm has had limited uptake in German-language autism research and clinical practice. For example, as of September 2025, a Google Scholar search yields 15,100 results for the traditional term “Autismus-Spektrum-Störung” (autism spectrum disorder) and only 21 results for the term “Neurodiversität” (neurodiversity). This comparison does not imply that all research using diagnostic terminology adopts a medicalized or deficit-focused perspective—many studies use clinical terms while still drawing on neurodiversity-affirming or acceptance-based frameworks. Rather, the striking imbalance highlights that work explicitly framed around the concept of neurodiversity remains comparatively underrepresented and less visible in the German-speaking literature. Moreover, the number of (traditional) self-report measures of autistic traits available in German that have undergone an extensive validation process is relatively limited. The most widely used measure in German is the AQ. 58 Validation studies also exist, for instance, for the BAPQ 59 and the Social Responsiveness Scale. 60 While the original CATI—designed to move beyond a medicalized, deficit-focused framing of autism—has been translated into German, 42 neither the CATI nor the CATI-R, which further strengthened alignment with neurodiversity-affirming principles, has been validated in German yet. Validating the CATI-R in German represents a step toward embedding neuro-affirming perspectives in both research and practice. By centering autistic voices in the adaptation of this measure, the German CATI-R challenges the dominance of deficit-based models and offers a more respectful, inclusive, and accessible tool that better captures the lived experiences of autistic people across genders than previous measures. This can support fairer assessment, reduce the risk of missed or late diagnoses, particularly for women and gender-diverse people, and guide more supportive and affirming interventions. Accordingly, this project aimed to evaluate the psychometric properties of the German CATI-R (henceforth CATI-R). The translation builds on a separate, earlier project that revised the original CATI to improve gender inclusivity, accessibility, and the use of nonstigmatizing language. The current study does not introduce further revisions to the instrument. Instead, it reports the translation and validation of this already-revised English CATI-R into German, guided by 14 German native speakers from the autistic and autism community, who formed a subset of the larger participatory group from the earlier CATI-R revision project. Our validation followed the approach taken in the English CATI and CATI-R validation studies.8,41 We performed confirmatory factor analysis (CFA) on various models, including correlated factors, bifactor, and higher order factor models. Moreover, we evaluated the CATI-R’s internal consistency and convergent validity by correlating its scores with scores from two contemporary measures of autistic traits, the AQ and the BAPQ. Finally, we assessed whether participants differed across genders in their response behavior, conducting measurement invariance analysis. This protocol was preregistered on the OSF (https://osf.io/zgybv/).
Methods
Development of the German CATI-R
The present study is the validation of a German translation of the revised English language CATI-R questionnaire. 8 We translated the CATI-R into German in close collaboration with 14 native German speakers from the autistic community, all of whom had also participated in the original CATI-R revision process in English. This participatory process ensured conceptual equivalence with the revised English version while maintaining identity-affirming and accessible language in German.
Participants
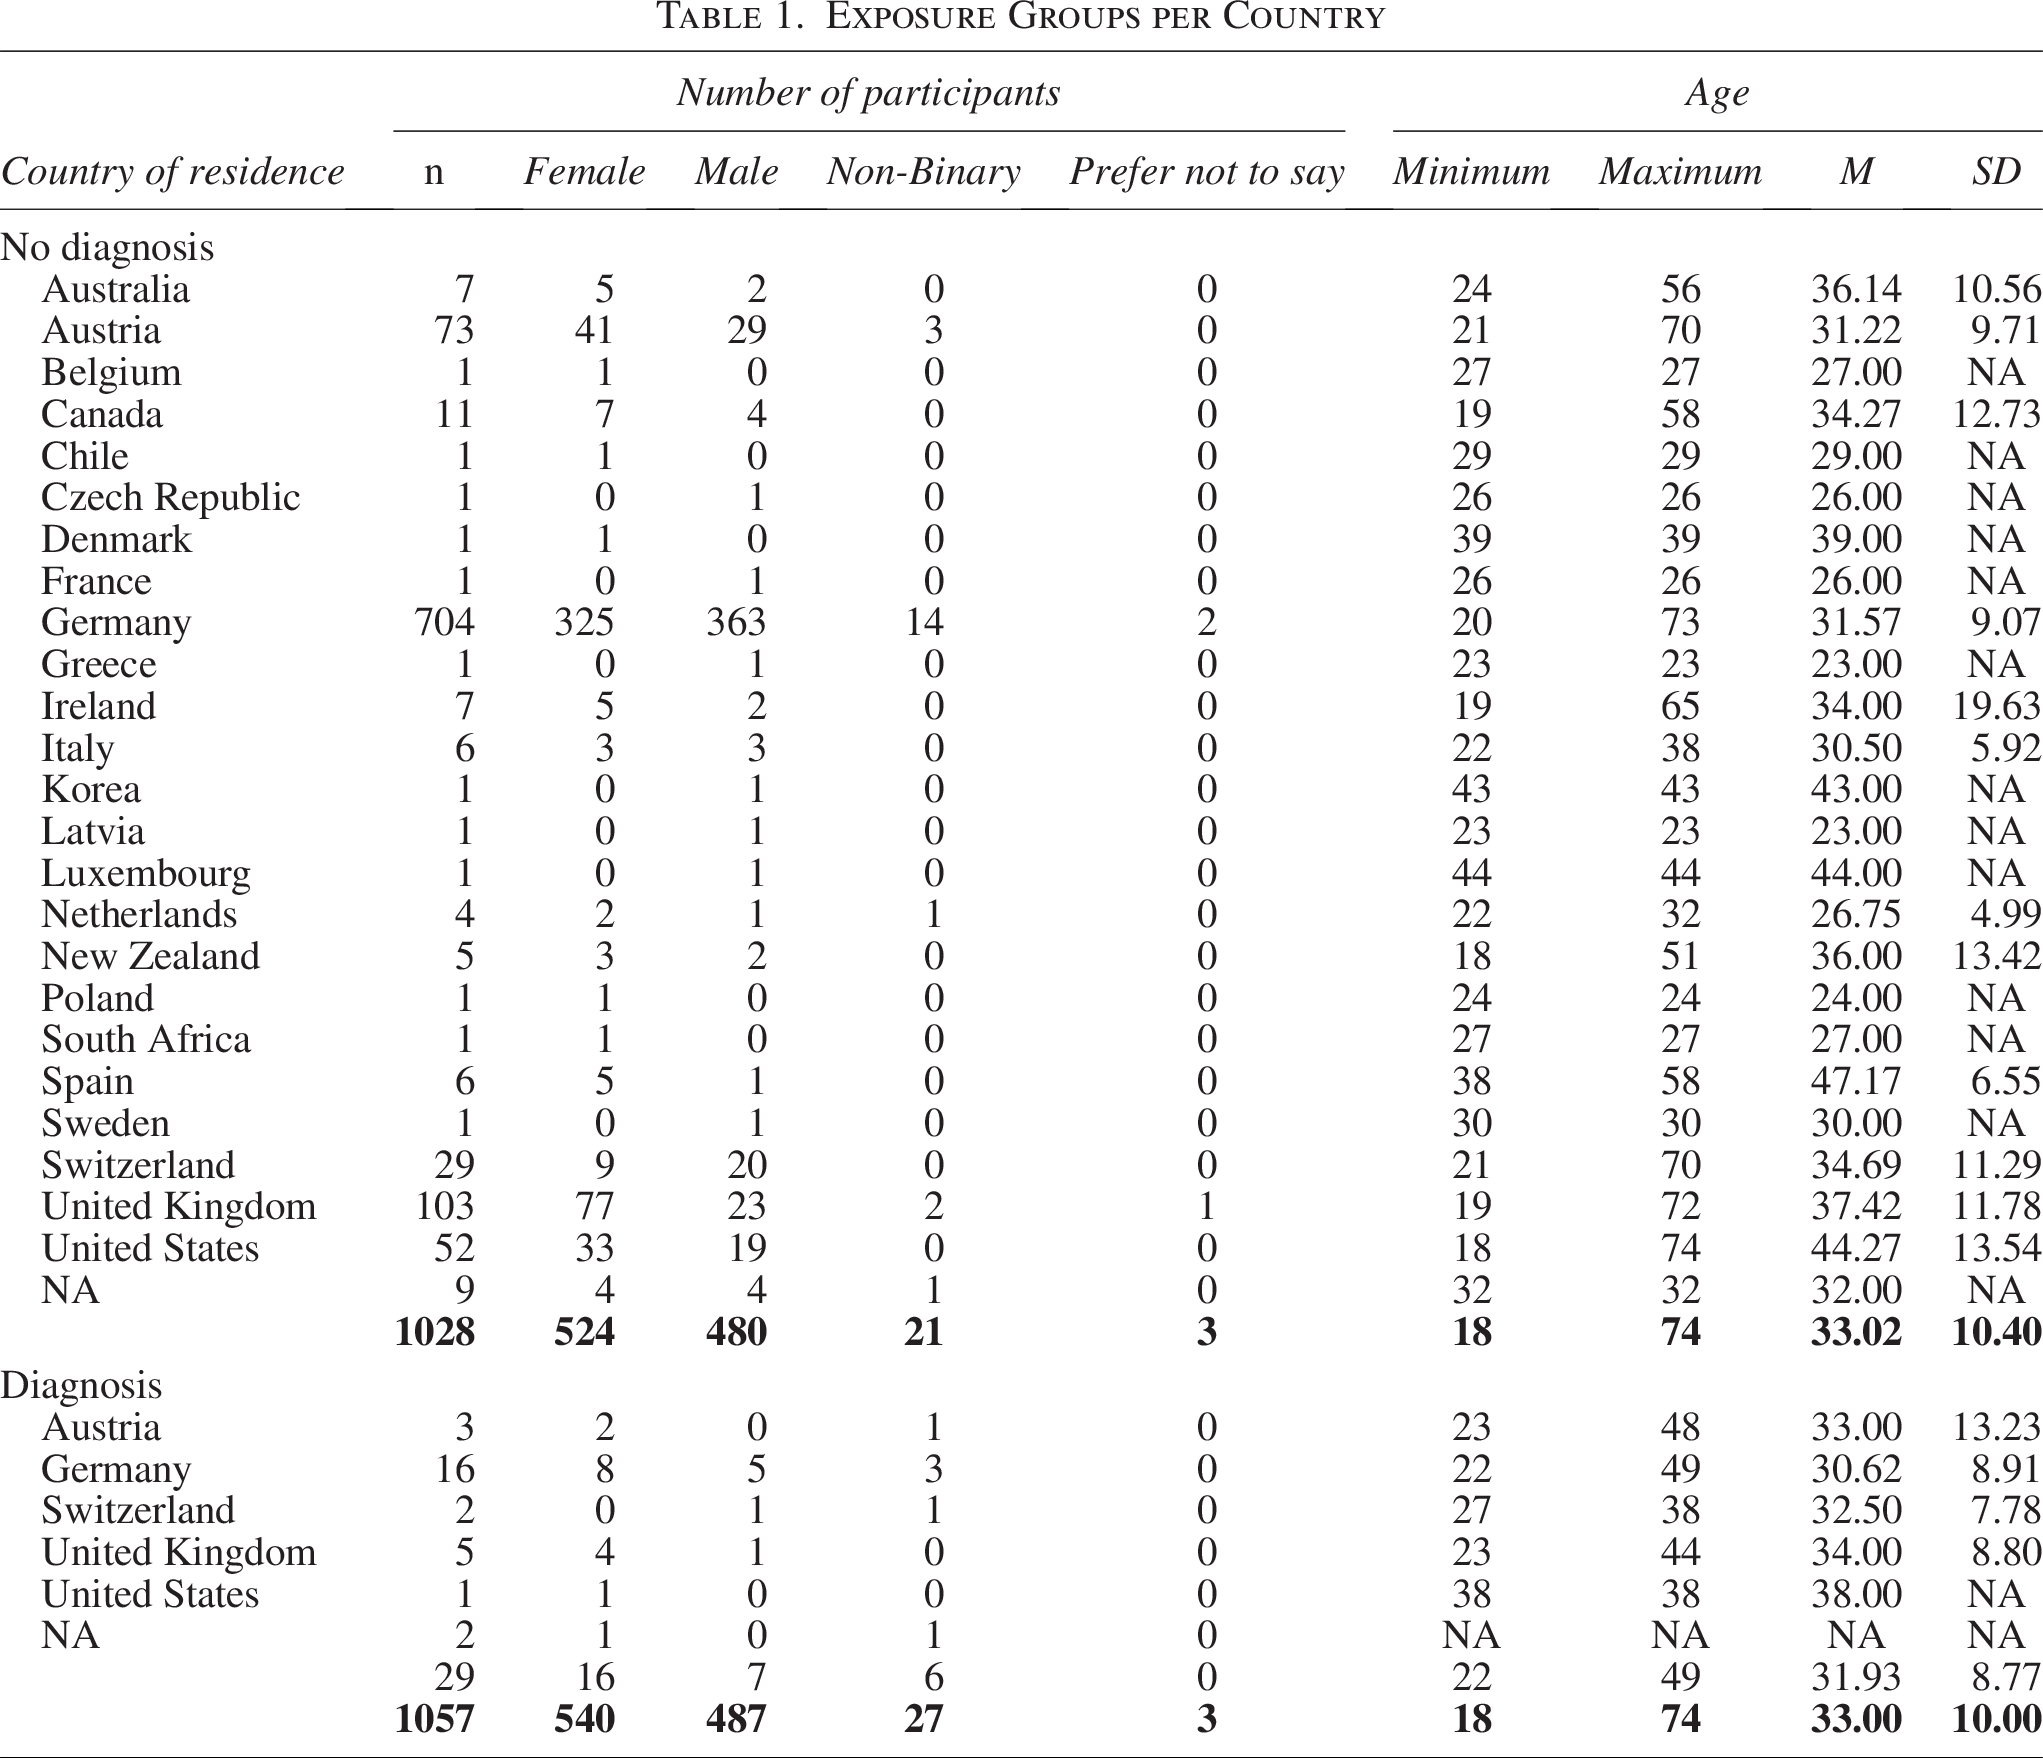
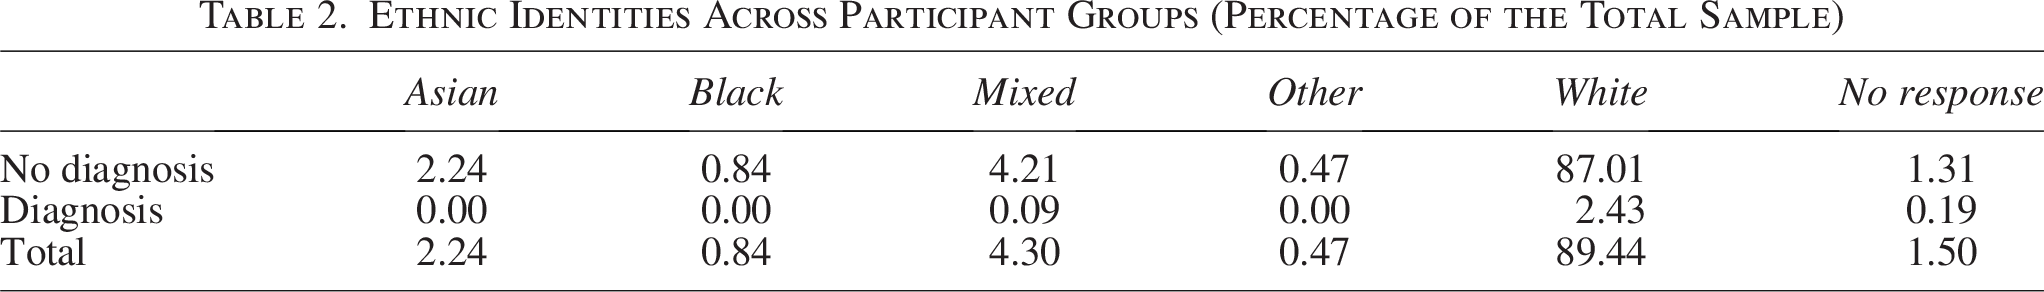
We recruited participants via Prolific, since Prolific compared with other online study platforms, such as MTurk, provides superior data quality, as evidenced by better performance on attention checks, more thoughtful responses, greater adherence to instructions, better recall of earlier content, unique IP and location data, and slower, more deliberate response times,61,62 and the platform was used also for the English validation of CATI-R. To maximize the number of autistic participants, we opened the study initially only for participants who stated in their Prolific profile to be autistic. Participants had to be at least 18 years old, report German as their native language, and have a minimum approval rate of 99 on Prolific (representing overall participant reliability across different online experiments). Following the English CATI-R validation study, 8 we removed participants from all analyses if they: (1) reported a language other than German as their native language, (2) failed two or more of the four attention checks embedded within the survey, (3) completed the questionnaires too quickly (<8 c minutes in total). This resulted in 43 exclusions (4.07%) and a final data set of 1057 participants (Mage = 33 years, SD = 10; 540 female, 487 male, 27 non-binary, 3 not reported). This dataset consisted of participants who self-reported: (1) identifying as autistic with a formal autism diagnosis (i.e., diagnosis: n = 29; 16 female, 7 male, 6 non-binary, 0 not reported); (2) identifying as autistic without a formal diagnosis (i.e., self-identify: n = 84; 53 female, 23 male, 6 non-binary, 2 not reported); and (3) not identifying as autistic and without a formal diagnosis (i.e., no diagnosis: n = 944; 471 female, 457 male, 15 non-binary, 1 not reported; see Table 1). We treated participants who reported a diagnosis or self-identified as autistic as separate groups in our analyses (see the analysis script on our OSF page: https://osf.io/zgybv/). Most participants resided in Germany (n = 720, 68.12%) and the United Kingdom (n = 108, 10.22%; see Table 1 for detailed information). Table 2 shows the ethnic identity of participants. The final data set contained no missing data, as the design of our survey required participants to respond to each item before proceeding to the next page.
Exposure Groups per Country
Ethnic Identities Across Participant Groups (Percentage of the Total Sample)
Materials
The study was hosted on the PCIbex platform, an online tool for conducting behavioral research.
Demographic questionnaire
To characterize our sample, we recorded demographic data on participants’ native language, gender identity, self-reported diagnosis status, and autism identity (rather than using information from their Prolific profile) to ensure that the information was correct at the time of data collection.
Autistic traits questionnaires
Following the procedure in the English CATI and CATI-R validation studies,8,41 participants filled in the German CATI-R as well as the German AQ 58 and BAPQ d .59,63 To ensure that participants read each item carefully, we placed an attention-check item at the midpoint of each questionnaire, directing participants to select a specific response.
The CATI-R consists of 42 items and six subscales. Each subscale, “SOC,” “SEN,” “REP,” “COM,” “RIG,” and “Masking” (MAS), contains seven items. Participants responded on a 5-point Likert response scale (1 = “strongly disagree,” 5 = “strongly agree”). Four items are reverse-coded. The complete CATI-R, along with its scoring key, is available alongside our preregistration (https://osf.io/zgybv/).
The 50-item AQ, developed for assessing autistic traits in neurotypical individuals, 13 allocates items to five distinct trait dimensions designated as “Social Skill,” “Attention Switching,” “Attention to Detail,” “Communication,” and “Imagination.” Participants used a 4-point Likert scale for their responses (1 = “definitely agree” and 4 = “definitely disagree”), with approximately half of the items using a reversed scale. We used the same scoring as in the English CATI and CATI-R validation studies,8,41 that is, 1–4, as this approach has been proposed to enhance item discriminability compared with a simple 0–1 scoring originally proposed for the AQ. 64
The BAPQ is a 36-item self-report questionnaire originally created to measure autistic traits in close relatives of autistic people 43 that is now used to measure autistic traits in the general population. The items are distributed among the three subscales: “Pragmatic Language,” “Aloof Personality,” and “Rigid Personality.” Participants responded on a 6-point Likert scale (1 = “very rarely” and 6 = “almost always”), with approximately half of the items being reverse-coded. Responses were scored from 1 to 6, with higher scores indicating greater endorsement of autistic traits.
Procedure
The study was carried out in accordance with the protocol reviewed and approved by the University of Potsdam’s Human Ethics Committee (protocol number: 84/2021), which is compliant with the Declaration of Helsinki and its later amendments. Participants provided consent before completing the demographic questionnaire. Subsequently, they responded to the three questionnaires on autistic traits in a randomized order. The ATTARI-12 was administered at the very end. We introduced each questionnaire with separate task instructions. Participants were reimbursed with £3 for an average duration of 18 minutes.
Analysis
We followed the analyses to validate the CATI-R as a measure of individual differences in subclinical autistic traits within the general population reported in the English CATI-R validation study, 8 as well as some further tests on the questionnaire’s predictive abilities. We report here only the former. Preliminary analyses exploring the potential predictive ability of the CATI-R as a screening tool are reported as Supplementary Material within the OSF project page (https://osf.io/zgybv/). We performed all statistical analyses using R Statistical Software (v 4.5.1; R Core Team 2025). We assessed necessary assumptions, including normality and homogeneity of variance and took appropriate steps, including the use of nonparametric tests and data transformations. However, given the large sample size, violations of normality were deemed to have minimal impact on the results. 65
Confirmatory factor analyses
To serve as a valid measure of autistic traits, the CATI-R should exhibit item groupings that align with theoretical factors representing the core components of the autism construct. We evaluated how well the proposed theoretical model fits the actual data by analyzing the relationships among CATI-R item responses using CFA. This analysis was guided by the factor structure originally proposed for the CATI
41
and replicated for the English CATI-R.
8
A single, general factor for “autistic traits.” Two dimensions informed by the core diagnostic criteria for autism (social communication/interaction domain and restricted and repetitive behavior domain) labeled as “social traits” (based on the subscales SOC, COM, and MAS) and “nonsocial traits” (based on the subscales SEN, REP, and RIG). Six dimensions currently associated with autism, featured in the six questionnaire subscales of SOC, SEN, REP, COM, RIG, and MAS.
These factors were entered in the same statistical models tested in the English CATI and CATI-R validation studies8,41:
One-Factor Model. A model comprising a single general factor. Correlated Two-Factor Model. A model comprising a social (SOC, COM, and MAS) and a nonsocial (REP, RIG, and SEN) factor. Single Hierarchical Factor Model. A model comprising six factors (SOC, COM, MAS, REP, RIG, and SEN) as part of a higher order factor. Correlated Social and Nonsocial Hierarchical Factor Model. A model separately grouping the social (SOC, COM, and MAS) and nonsocial (REP, RIG, and SEN) factors at the second-order level. Six-Factor Bifactor Model. A model in which six factors exist in tandem with a bifactor. Two-Factor Bifactor Model. A model in which the social and nonsocial factors exist in tandem with two bifactors. Correlated Six-Factor Model. A model comprising six correlated factors.
We derived first-order factors from the covariation among the observed variables. To explain the correlations among the various first-order factors, we specified second-order factors. CFA was carried out using the lavaan package in R (v 0.6.20), 66 treating the 5-point Likert items as ordinals and using polychoric correlations with a robust diagonally weighted least squares estimator (WLSMV). We assessed model fit using robust close-fit indices, including the root mean square error of approximation (RMSEA) and the standardized root mean square residual (SRMR). Following conventional thresholds, RMSEA and SRMR values below 0.08 were interpreted as indicating an acceptable model fit, while values under 0.06 suggested a good fit. We also evaluated fit using the comparative fit index (CFI) and Tucker–Lewis Index (TLI), both ranging from 0 to 1, with values above 0.90 indicating adequate fit and values exceeding 0.95 indicating strong fit. 67 Since conventional cutoffs for CFI and TLI have been criticized as overly rigid and sample-size dependent, 68 we additionally conducted dynamic equivalence testing using the dynamic 69 package, which provides sample-size adjusted dynamic fit indices (DFIs), offering a more realistic benchmark for determining whether model fit is close, fair, mediocre, or poor. Because the Akaike Information Criterion (AIC) is not defined for WLSMV estimation, we did not use it for the primary model comparisons. However, as a sensitivity analysis, we additionally fitted models with robust maximum likelihood, where AIC could be reported and used for relative model comparisons. Consistent with prior validations of the English CATI and CATI-R,8,41 we anticipated support for a bifactor structure, in which the six subscales were organized under two higher order dimensions representing social and nonsocial domains of autistic traits.
In addition to evaluating overall model fit, we examined the magnitude of item loadings on their respective latent factors. Higher factor loadings reflect stronger associations between individual items and the underlying construct they are intended to measure. 70 Item loadings were interpreted based on published guidelines, 71 where values of 0.71 or higher (indicating 50% shared variance) are considered excellent, 0.63 (40% shared variance) very good, 0.55 (30%) good, 0.45 (20%) fair, and 0.32 (10%) poor.
To further evaluate whether the German CATI-R supports the use of both general and subscale scores, we computed bifactor indices for the best-fitting model, using the R package BifactorIndicesCalculator. 72 These indices allow an assessment of the proportion of variance attributable to a general factor compared with specific subfactors, and thus inform the appropriateness of reporting total versus subscale scores. 73 Specifically, we examined the following: explained common variance (ECV), the proportion of common variance accounted for by the factors; ω, the reliability of factor scores, including both general and specific variance (values ≥0.70 indicate acceptable, ≥0.80 good, and ≥0.90 excellent reliability); ω hierarchical, the reliability attributable to the general factor alone, after controlling for subfactors (values ≥0.80 suggest that a total score can be interpreted as essentially unidimensional); construct replicability (H), the likelihood that factors can be replicated across studies (values ≥0.70 indicate that the latent factor is well-defined by its indicators); and factor determinacy (FD), the correlation between estimated and true factor scores (values ≥0.90 indicate that factor scores are reliable estimates of the latent factors).
Correlations between CATI-R subscales
To account for potential violations of normality, we examined associations between CATI-R subscale scores using Spearman’s rank-order correlation. In line with findings from the English CATI and CATI-R validation studies,8,41 we anticipated strong intercorrelations among all subscales.
Internal consistency
To evaluate the internal reliability of the CATI-R subscales, we first computed Cronbach’s α, with values of 0.80 or above considered indicative of sufficient internal consistency. Alongside this, we also assessed the average interitem correlation. This parameter defines Cronbach’s α together with the scale length and is thus a more adequate index of internal consistency for scales with more than 40 items, 74 such as the CATI-R. Based on prior recommendations, 75 we regarded average interitem correlations between 0.15 and 0.50 as desirable.
For the total CATI-R score, we calculated McDonald’s ω hierarchical, which estimates reliability based on intersubscale relationships rather than individual item correlations, 76 and we also computed stratified Cronbach’s α across subscales. 77 These additional indices help address the risk of inflating reliability estimates in multidimensional measures such as the CATI-R when relying solely on Cronbach’s α. 78 In line with the English CATI and CATI-R validations,8,41 we anticipated high internal consistency, with previous benchmarks, including Cronbach’s α values between 0.81 and 0.94, ω hierarchical at 0.81, and stratified α at 0.95.
Convergent validity evidence
To assess the convergent validity of the CATI-R, we examined the relationship between the total CATI-R score and total scores on the AQ and BAPQ using Spearman’s rank-order correlation. This nonparametric method was again chosen due to its robustness against non-normal distributions. We anticipated strong positive correlations between CATI-R scores and both AQ and BAPQ scores, consistent with the convergent validity findings reported in the English CATI and CATI-R validation studies.8,41
Examination of gender differences
Total Scale and Subscale Scores
The CATI and CATI-R were designed to be particularly sensitive to traits that do not conform to traditional, male-centric models of autism. We performed analyses on gender using two separate subsamples: one limited to male and female participants and another that included male, female, and non-binary participants. To examine gender-based differences in CATI-R total and subscale scores, we applied separate Mann–Whitney U tests for comparisons between female and male participants, using the stats R package (v 4.5.1). For analyses including female, male, and non-binary participants, we conducted Kruskal–Wallis tests, followed by post hoc Wilcoxon rank-sum tests for pairwise comparisons, using the rstatix package (v0.7.3). 79 To explore the effects of gender, subscale (SOC, COM, MAS, RIG, REP, SEN), and their interaction on individual item responses, we fitted linear mixed-effects models for both sample subsets (binary and gender-diverse). These models were estimated via restricted maximum likelihood. Significance testing was performed using the lmerTest R package (v 3.1.3), 80 with an α threshold of 0.05. Based on findings from the English CATI-R validation study, 8 we expected males to score higher than females on the COM subscale, while females would show higher scores on the SEN subscale.
Measurement Invariance Analysis (Female vs. Male)
To interpret observed score differences as reflecting actual group differences rather than measurement bias, we aimed to confirm that items function equivalently across groups (measurement invariance).
81
Based on the best-fitting CFA model, we tested for measurement invariance through a series of increasingly constrained models:
Configural Invariance assessed whether the same factor structure (i.e., number and configuration of factors) held across groups. Metric/Weak Invariance tested whether factor loadings were equivalent, indicating that items related similarly to the latent constructs in all groups. Scalar/Strong Invariance examined whether item thresholds or intercepts were consistent across groups, ensuring that group differences in observed scores reflected differences in the latent traits. Residual/Strict Invariance added constraints on residual variances, testing whether items had the same amount of unique and error variance across groups. With ordered indicators, residual variances are often not freely estimated, and strict invariance may therefore be less informative in this context. Mean Invariance further constrained the factor means, loadings, and thresholds to equality, allowing for comparisons of latent mean levels. Variance–Invariance constrained the latent variances to equality across groups, testing whether the degree of heterogeneity (dispersion) of autistic traits was similar between genders. Variance–Covariance–Invariance additionally constrained latent covariances to equality, testing whether the relations among latent dimensions of autistic traits were comparable across genders.
At each step, we evaluated model fit using changes in chi-square, CFI, and RMSEA. We considered a decrease in CFI greater than 0.01 or an increase in RMSEA above 0.015 as indicators of noninvariance.82,83 In line with findings from the English CATI and CATI-R validation studies,8,41 we anticipated support for measurement invariance across gender groups.
Criterion validity
While the CATI and CATI-R were not designed for diagnostic purposes, we conducted the same analyses as 8 to assess the CATI-R’s potential to distinguish between people with a formal autism diagnosis and those without. These analyses included linear mixed-effects models, logistic regression, hierarchical logistic regression, and evaluations using Youden’s index. Full results are publicly available via the project’s OSF page (https://osf.io/zgybv/). Preliminary findings indicate that, similar to the English CATI-R, the German CATI-R may hold promise as a screening instrument. We calculated preliminary cutoff scores using Youden’s index. These cutoffs differed by gender, with non-binary people showing the highest and males showing the lowest cutoff scores. However, further validation is needed—ideally involving comparisons with gold standard diagnostic tools such as the Autism Diagnostic Observation Schedule, Second Edition (ADOS-2) 84 to confirm the diagnosis of those who exceed these thresholds and a larger non-binary sample—to support its application in clinical or screening contexts and across genders.
Cross-language measurement equivalence
We tested measurement invariance of the CATI-R across English and German using multigroup CFA with ordered indicators and WLSMV estimation. Following the standard sequence, we fit configural, metric (equal loadings) and scalar invariance models; for ordinal data, scalar invariance was implemented by constraining thresholds. Because residual variances are not freely estimated under WLSMV with ordered indicators, strict invariance was not applicable. We also evaluated structural invariance by constraining latent variances and then latent covariances across groups. Model comparisons used ΔCFI ≤0.010 and ΔRMSEA ≤0.015 as primary decision rules. To avoid nonidentifiability from empty response categories, rare/empty categories were collapsed to adjacent levels symmetrically in both groups before modeling. This measurement invariance analysis was not preregistered and was conducted post hoc in response to peer review. We therefore treat this analysis as exploratory.
Results
Confirmatory factor analysis
To evaluate the alignment of the CATI-R with prevailing theoretical models of autism, we performed CFA, which identified the same two models as best-fitting as the English CATI and CATI-R validation studies.8,41 Model selection was based on fit indices (CFI, TLI, RMSEA, SRMR), as AIC is not defined for WLSMV estimation. As shown in Table 3, the Two-Factor Bifactors Model demonstrated the best overall fit, with CFI and TLI values in the acceptable range and RMSEA and SRMR within recommended thresholds. 85 Moreover, the TLI difference between the two best-fitting models was only 0.01, which falls below the 0.01 threshold for practical significance. 67 The DFI-adjusted thresholds indicated that our empirical values fall within the close-to-excellent range. Specifically, the RMSEA was below the cutoff for close fit (0.058), and the CFI met the cutoff for excellent fit (≥0.986). These results suggest that, once sample size and model complexity are considered, the model provides a good representation of the data (see OSF: https://osf.io/zgybv/ for detailed equivalence testing results). Parallel analyses using Maximum Likelihood Estimation with Robust Standard Errors (MLR; see OSF) yielded the same pattern of results; for those models, AIC values also favored the Six-Factor Bifactor Model over competing structures.
Robust Fit Indices for the Seven Models Tested in the Confirmatory Factor Analysis
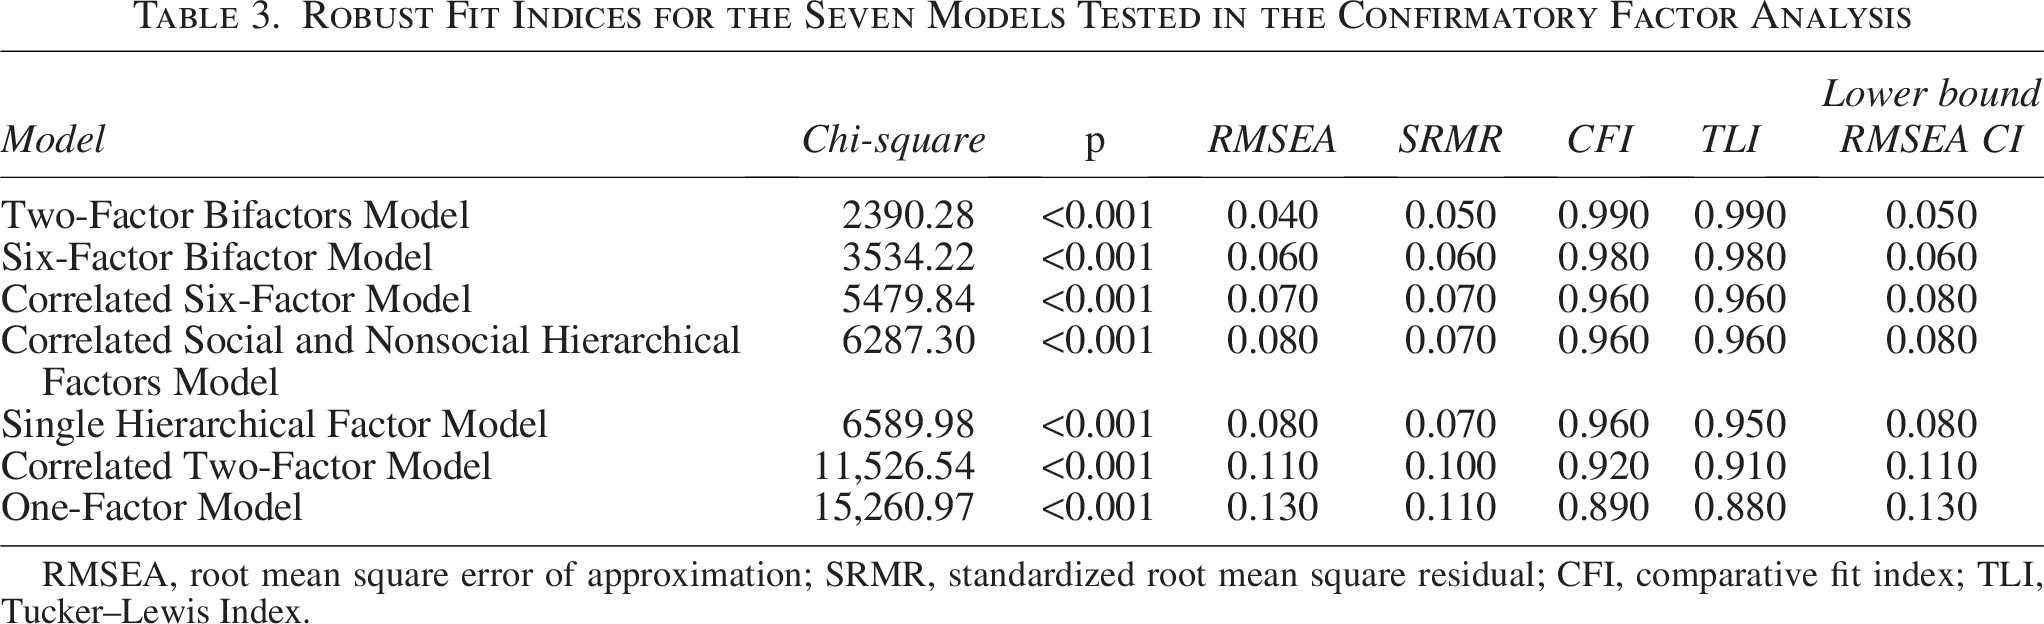
RMSEA, root mean square error of approximation; SRMR, standardized root mean square residual; CFI, comparative fit index; TLI, Tucker–Lewis Index.
A multivariate normality assessment revealed that the data met the assumption of skewness but violated the assumption of kurtosis (Mardia’s test of kurtosis, p < 0.01). This outcome was anticipated given the CATI-R’s hierarchically multidimensional structure—unidimensional at the higher order level with interrelated subfactors at the lower order level—and results reported in the English CATI-R validation study. 8 Despite this non-normality, robust WLSMV fit indices remained valid, and the parallel MLR analyses confirmed the robustness of our findings.
We conducted a further evaluation of individual item performance by examining whether factor loadings were sufficiently high to indicate that each item was meaningfully associated with its intended latent factor in the Two-Factor Bifactors Model. 71 According to established guidelines, factor loadings of 0.60 or higher are considered strong indicators of construct validity. 86 For the social traits factor, standardized loadings (λ) ranged from 0.25 to 0.75, with 19 out of 21 items demonstrating at least a “fair” level of association. For the nonsocial traits factor, λ values ranged from 0.29 to 0.71, with 21 of 21 items loading at a “fair” level or higher. Table 4 presents the range of λ values for each subscale. A subset of items (18, 22, 24, 26, 32, 33, 34, 39, 43, 44, 47) showed “poor” loadings (i.e., λ < 0.32) on their assigned subscale factor (see the OSF project page https://osf.io/zgybv/ for detailed loadings for all items). 71 However, these items exhibited moderate-to-strong loadings on the broader social or nonsocial traits factor, suggesting that those items do meaningfully contribute to a dimension, but that dimension may not be the only originally theorized one (e.g., an item thought to be about SOC may share variance across multiple facets such as SOC + MAS).
Range of Factor Loadings Across Subscales for the Two-Factor Bifactor Model
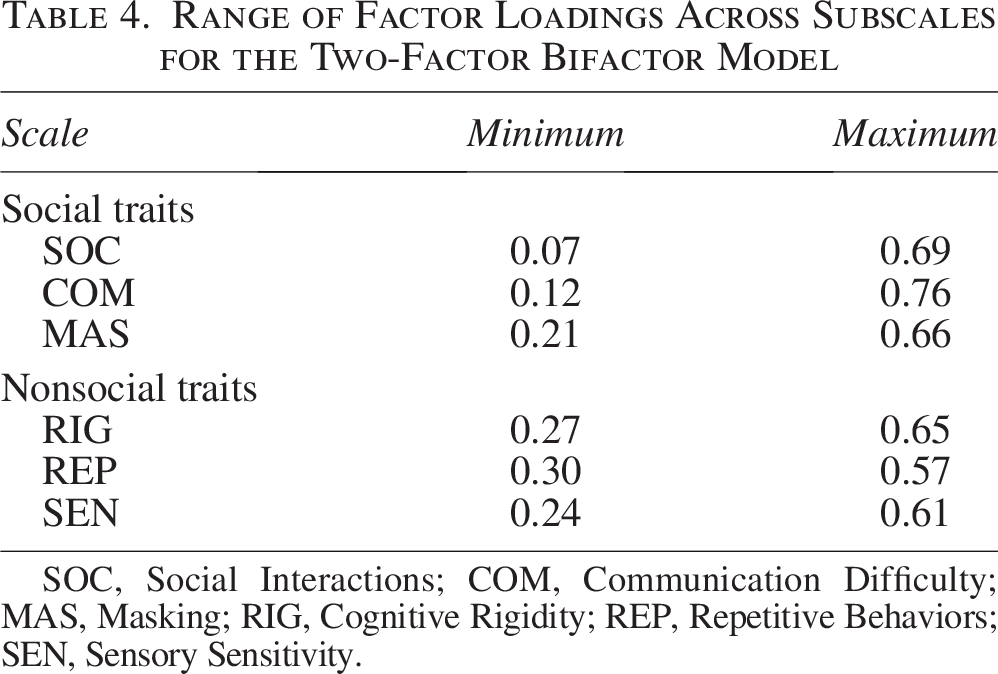
SOC, Social Interactions; COM, Communication Difficulty; MAS, Masking; RIG, Cognitive Rigidity; REP, Repetitive Behaviors; SEN, Sensory Sensitivity.
Further support for this more nuanced picture came from an exploratory factor analysis, which demonstrated that these items nonetheless loaded moderately to strongly onto emergent factors, suggesting that their contribution to the broader construct of autistic traits remains meaningful. The full exploratory factor analysis is available on the OSF project page: https://osf.io/zgybv/.
Finally, bifactor indices (see Table 5) indicated that the general CATI-R factor explained a substantial proportion of common variance, with ECV values of 0.59 for the social domain and 0.56 for the nonsocial domain. In contrast, specific subscales each accounted for less than half of their common variance uniquely (ECV range = 0.33–0.49). Reliability estimates were excellent overall: all factors had ω ≥0.80, with social (0.93) and nonsocial (0.92) domains exceeding 0.90. However, ω hierarchical values showed that most of this reliability was attributable to the general factor (0.77 for social; 0.73 for nonsocial). Subscale ω hierarchical values were substantially lower (0.23–.41), indicating that subscales capture relatively little unique reliable variance once the general factor is controlled. Construct replicability was high for all factors (≥0.66), and FD values (all ≥0.83; general factors around 0.95) confirmed that estimated factor scores closely reflected the underlying latent constructs.
Bifactor Indices for the Two-Factor Bifactor Model
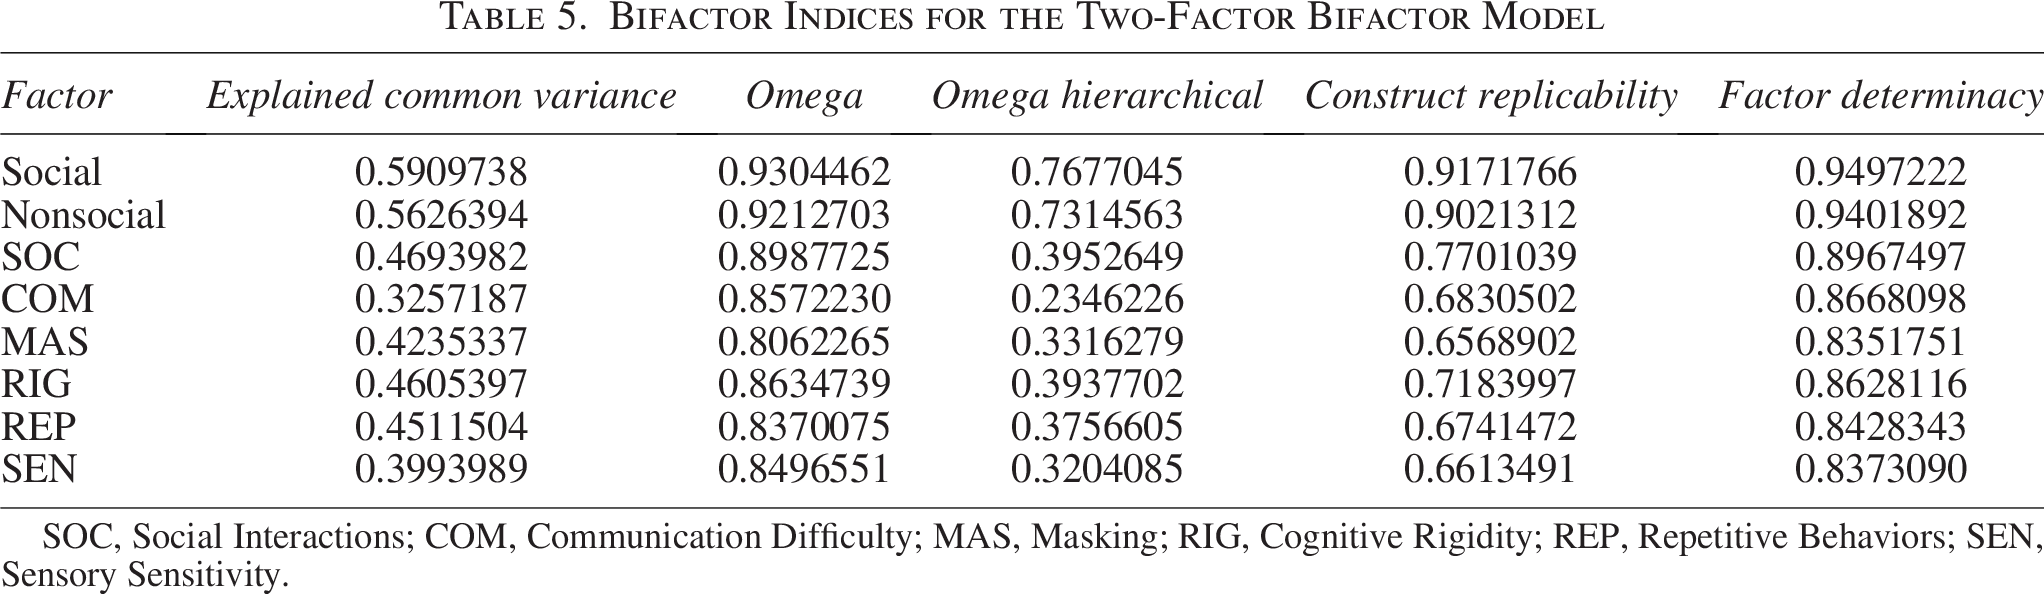
SOC, Social Interactions; COM, Communication Difficulty; MAS, Masking; RIG, Cognitive Rigidity; REP, Repetitive Behaviors; SEN, Sensory Sensitivity.
Correlations between CATI-R subscales
Consistent with findings from the English CATI and CATI-R validation studies,8,41 all CATI-R subscales were significantly and positively correlated (see Table 6). After applying a Bonferroni correction to account for multiple comparisons (α = 0.05/64 = 0.001), all correlations remained statistically significant (all adjusted ps < 0.001).
Spearman’s Rank Correlations Between the Revised Comprehensive Autistic Trait Inventory Subscales
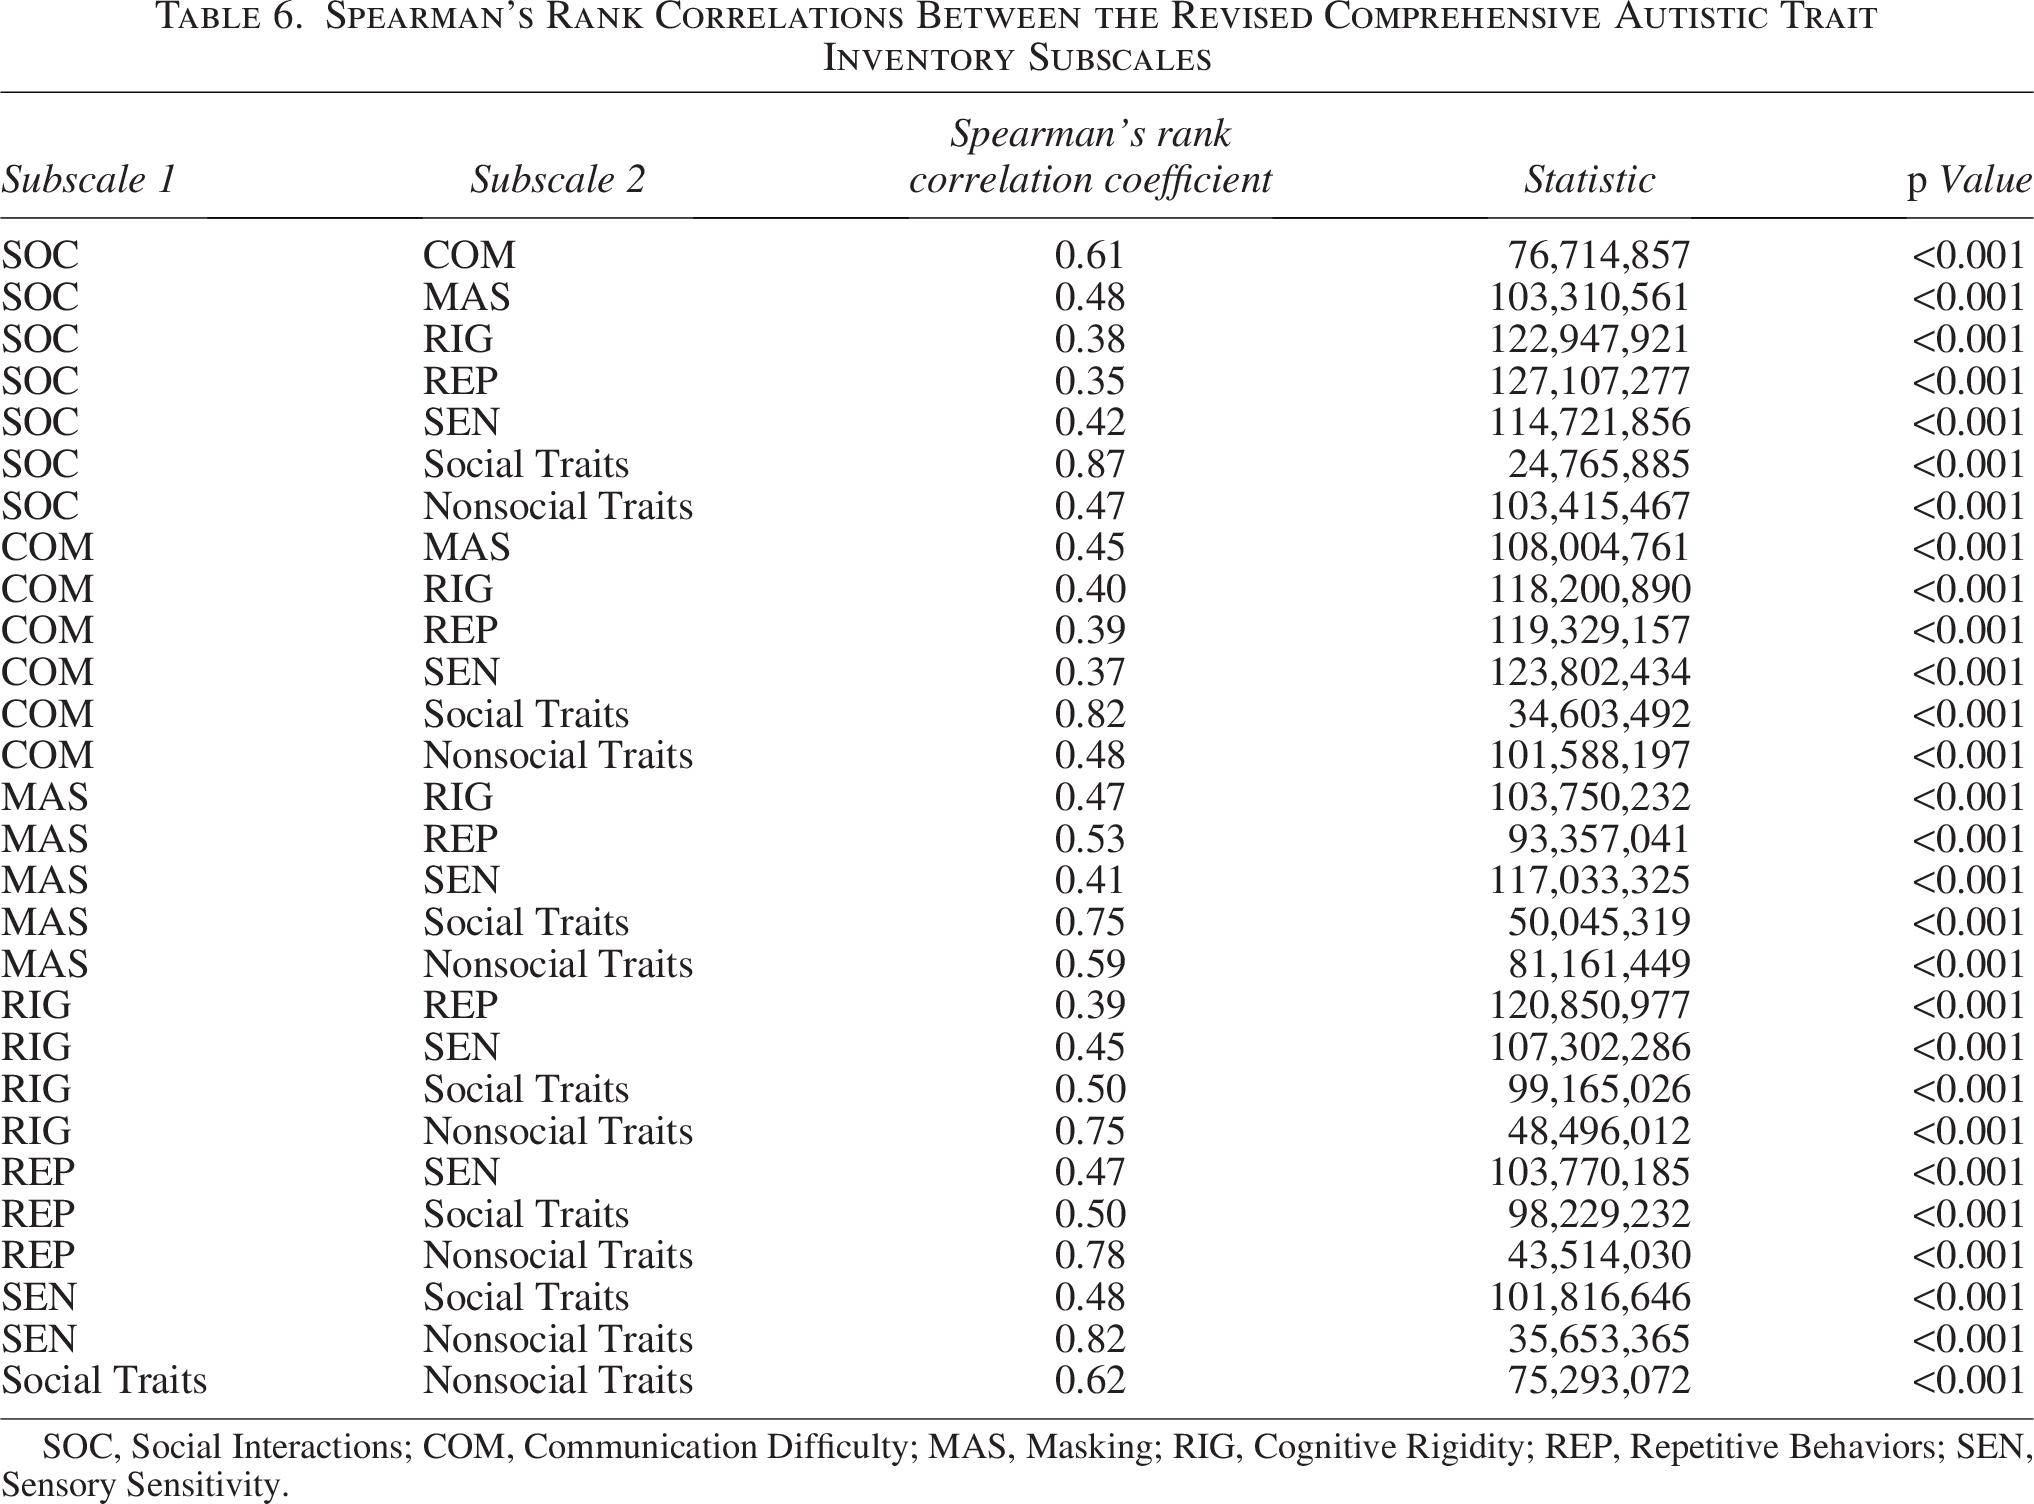
SOC, Social Interactions; COM, Communication Difficulty; MAS, Masking; RIG, Cognitive Rigidity; REP, Repetitive Behaviors; SEN, Sensory Sensitivity.
In line with previous findings with the English CATI-R, a significant correlation was also observed between the overarching social and nonsocial bifactors (r = 0.62), and notably, this correlation was stronger than that reported in the English CATI (r = 0.58), further indicating a close association between these two higher order dimensions in the translated German measure.
Internal consistency
To evaluate the internal consistency of the CATI-R subscales, we calculated Cronbach’s α for each. Almost all subscales demonstrated high reliability, with α values exceeding the threshold of 0.80 (see Table 7). An exception was the REP scale with a Cronbach’s α 0.78. These internal consistency estimates were generally higher than those obtained for the AQ within our sample. When considering all 42 items as part of a single overarching construct, internal consistency remained robust, as indicated by McDonald’s ω hierarchical and stratified Cronbach’s α (see Table 8). These estimates surpassed those for the AQ and BAPQ.
Cronbach’s Alpha Across Questionnaires
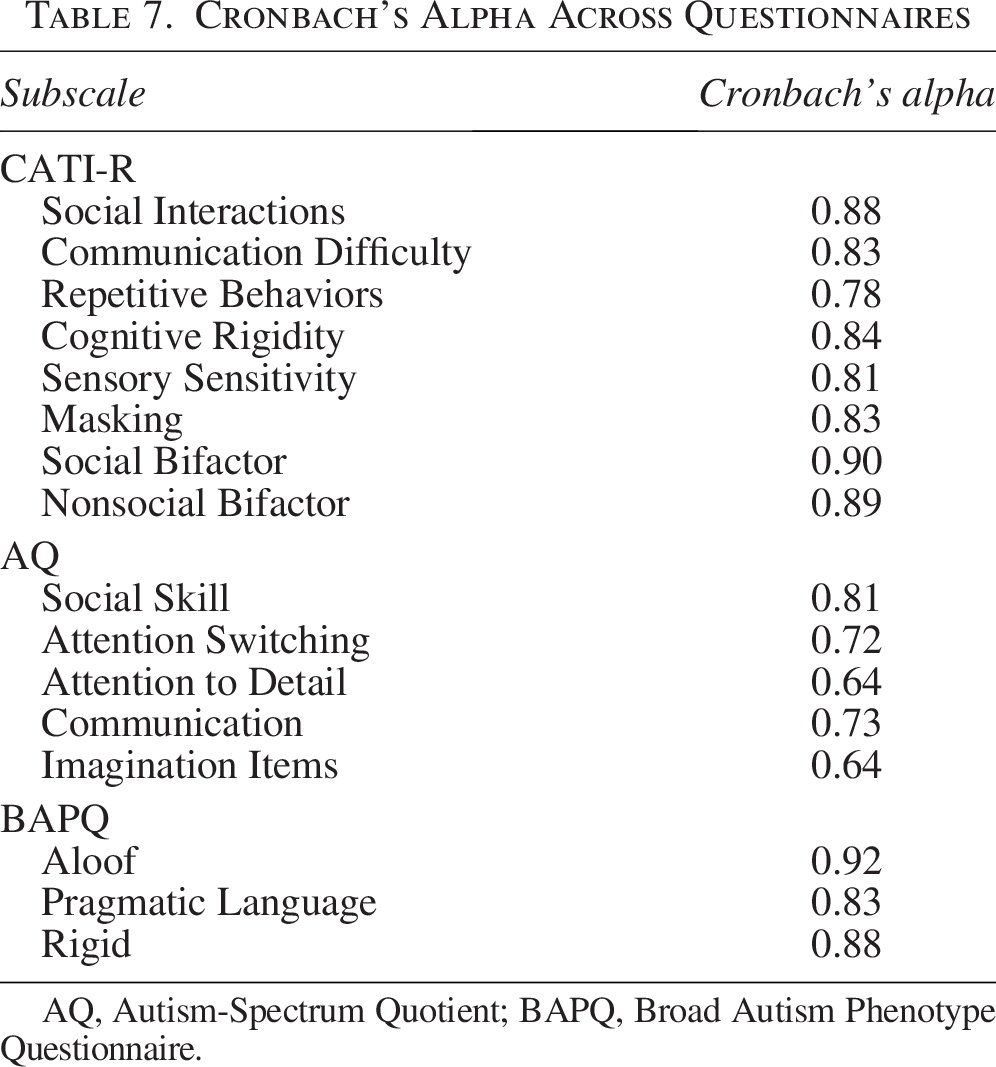
AQ, Autism-Spectrum Quotient; BAPQ, Broad Autism Phenotype Questionnaire.
McDonald’s Omega Hierarchical and Stratified Cronbach’s Alpha Across Questionnaires
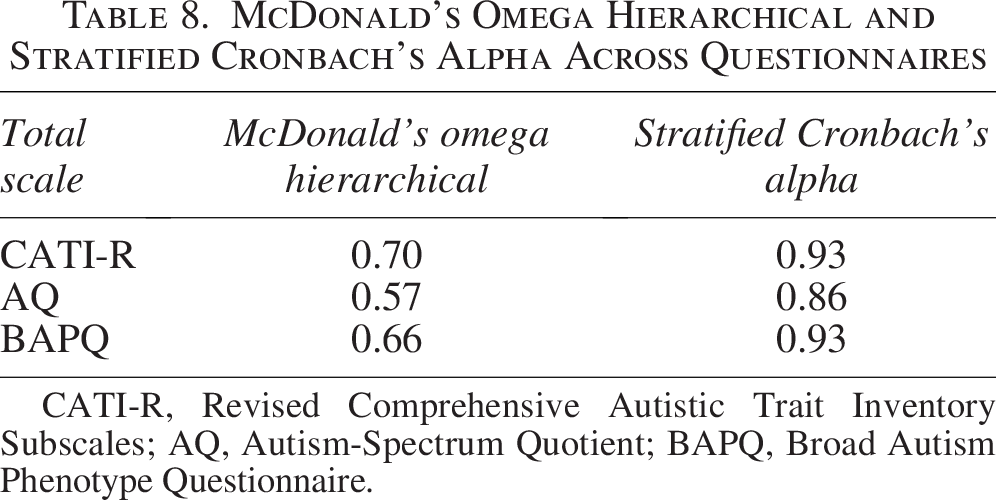
CATI-R, Revised Comprehensive Autistic Trait Inventory Subscales; AQ, Autism-Spectrum Quotient; BAPQ, Broad Autism Phenotype Questionnaire.
To assess potential item redundancy, we also examined the degree to which individual item scores were correlated with scores on all other items. As presented in Table 9, the average interitem correlations for the CATI-R and BAPQ fell within the recommended range of 0.15–0.50, indicating an appropriate balance between internal coherence and item distinctiveness. 75 The correlation for the AQ fell below this range. To explore reliability across diagnostic groups, we also examined internal consistency for the CATI-R, AQ, and BAPQ separately within autistic and non-autistic participants. The CATI-R showed consistently strong internal reliability across both groups, with similar Cronbach’s alpha scores as for the full dataset (see OSF: https://osf.io/zgybv/).
Average Interitem Correlation for the Revised Comprehensive Autistic Trait Inventory, the Autism-Spectrum Quotient, and the Broad Autism Phenotype Questionnaire
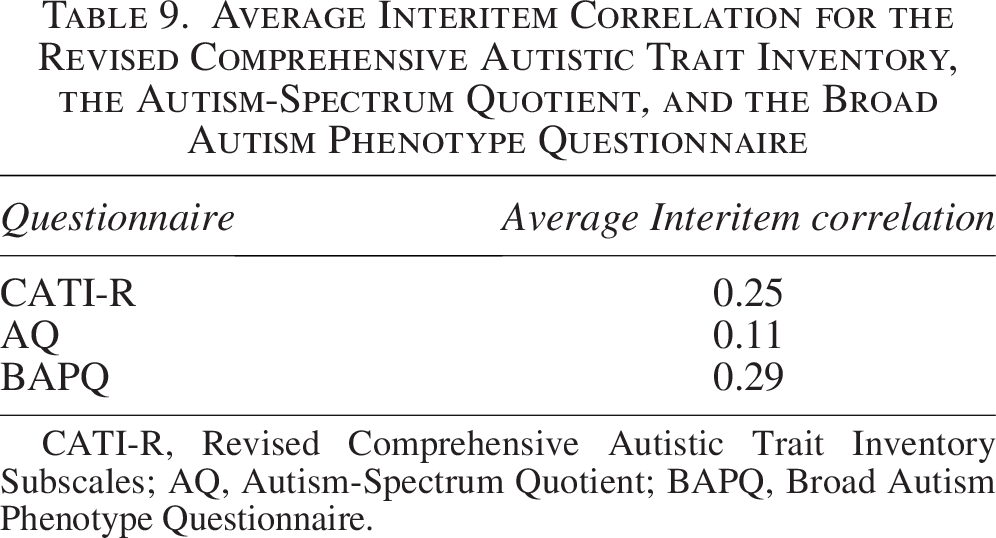
CATI-R, Revised Comprehensive Autistic Trait Inventory Subscales; AQ, Autism-Spectrum Quotient; BAPQ, Broad Autism Phenotype Questionnaire.
Convergent validity evidence
To provide further evidence for convergent validity, we examined the associations between CATI-R total scores and those of the AQ and BAPQ—two instruments designed to assess similar constructs. As was the case with the original CATI, 41 CATI-R total scores showed strong positive correlations with both the AQ (ρ = 0.69, S = 61730619, p < 0.01) and the BAPQ (ρ = 0.77, S = 45211670, p < 0.01).
Examination of gender differences
Total scale and subscale scores by gender
Male Versus Female
To examine gender-related differences in scores, we compared total scale results across male and female participants. Male participants had significantly lower total scores (MMale = 124.29) than female participants (MFemale = 128.25; W = 39685129, p < 0.01), although the observed effect size was small to moderate (r = −0.26). To further explore the role of gender, subscale type (SOC, COM, MAS, RIG, REP, and SEN), and their interaction in shaping individual item responses, we used a linear mixed-effects model using transformed scores. A random intercept was included for each participant to account for repeated measures across subscales. The main effect of gender was not statistically significant (β = 0.05, SE = 0.04, p = 0.202), indicating no consistent differences in response patterns between female and male participants across subscales.
However, there was a significant interaction between gender and subscale, driven by higher endorsement of items on the SEN subscale by female participants (β = 0.26, SE = 0.05, p < 0.01) and higher endorsement on the COM scale by male participants (β = −0.13, SE = 0.05, p < 0.01). This interaction effect, however, accounted for only a small proportion of variance (R2 = 0.004).
We also examined differences in subscale scores between male and female participants, which are detailed in Table 10. Results from the individual Mann–Whitney U tests for each subscale are presented in Table 11. Specifically, male participants scored significantly higher than females on the COM subscale, with a small effect size (r = −0.10), whereas female participants had significantly higher scores on the SEN subscale, with a medium effect size (r = −0.31).
Mean Score per Gender Group Across Subscales
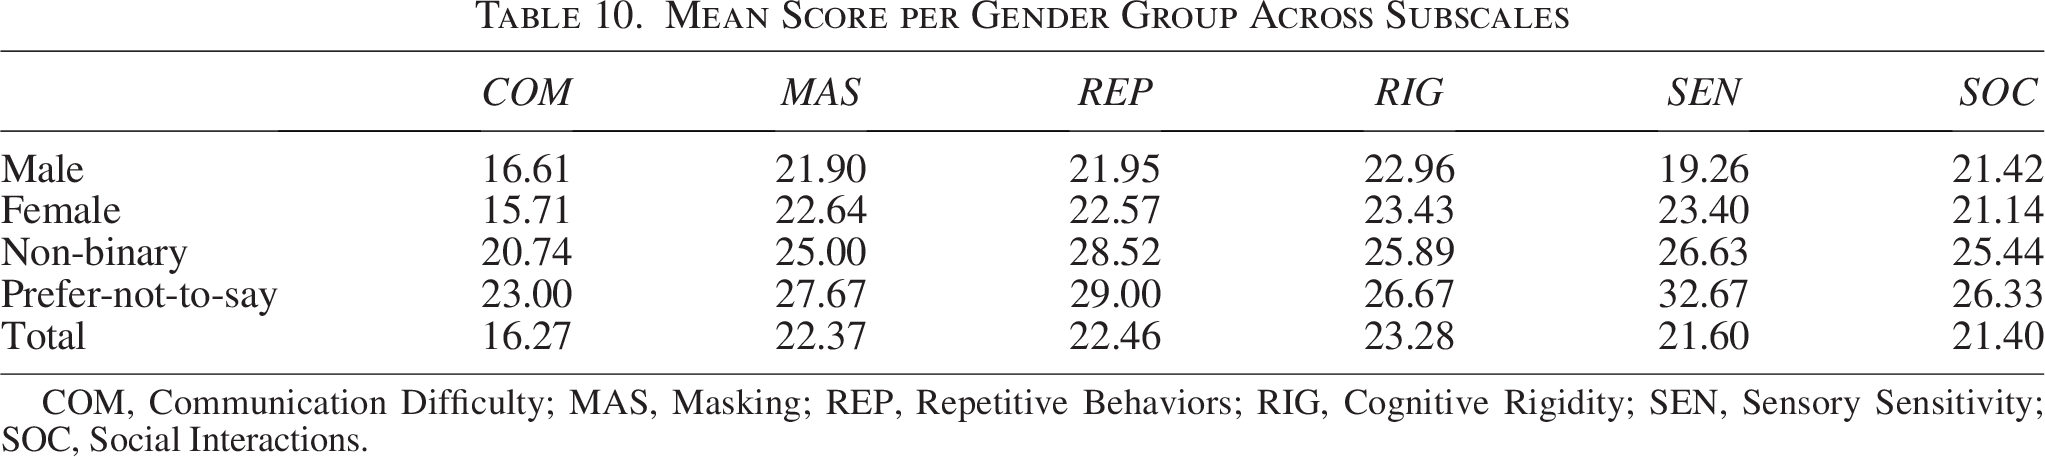
COM, Communication Difficulty; MAS, Masking; REP, Repetitive Behaviors; RIG, Cognitive Rigidity; SEN, Sensory Sensitivity; SOC, Social Interactions.
Mann–Whitney U Test: Subscale Score by Gender (Male, Female)

SOC, Social Interactions; COM, Communication Difficulty; MAS, Masking; RIG, Cognitive Rigidity; REP, Repetitive Behaviors; SEN, Sensory Sensitivity.
Male Versus Female Versus Non-Binary
Nonbinary participants exhibited the highest mean total score across all three gender groups (MNon-binary = 149.74). A Kruskal–Wallis test indicated a significant difference in total scores among female, male, and non-binary participants (χ2(2) = 391.28, p < 0.001), with a large effect size (η2 = 0.37). Post hoc Wilcoxon rank-sum tests revealed that non-binary participants scored significantly higher than both female (p < 0.001, r = −0.49) and male participants (p < 0.001, r = −0.49), although the effect size was likely inflated due to the relatively small non-binary sample. A significant difference also emerged between male and female participants (p < 0.01), but the associated effect size was small (r = −0.25).
We further examined whether gender (female, male, non-binary), subscale (SOC, COM, MAS, RIG, REP, and SEN), and their interaction influenced individual item responses using a linear mixed-effects model applied to transformed data. A random intercept accounted for repeated measures. Non-binary participants scored significantly higher than both male (β = −0.31, SE = 0.13, p = 0.018) and female participants (β = −0.39, SE = 0.13, p < 0.008), although both effects were small (R2 = 0.001).
Finally, we examined differences in subscale scores between male, female, and non-binary participants. Results of separate Kruskal–Wallis tests for each subscale, with Wilcoxon rank-sum post hoc comparisons, are presented in Table 12. Across most subscales, non-binary participants scored significantly higher than both female and male participants, although most effect sizes remained small (r < 0.3).
Kruskal–Wallis and Pairwise Wilcoxon Rank-Sum Tests: Subscale Score by Gender (Female, Male, Non-Binary
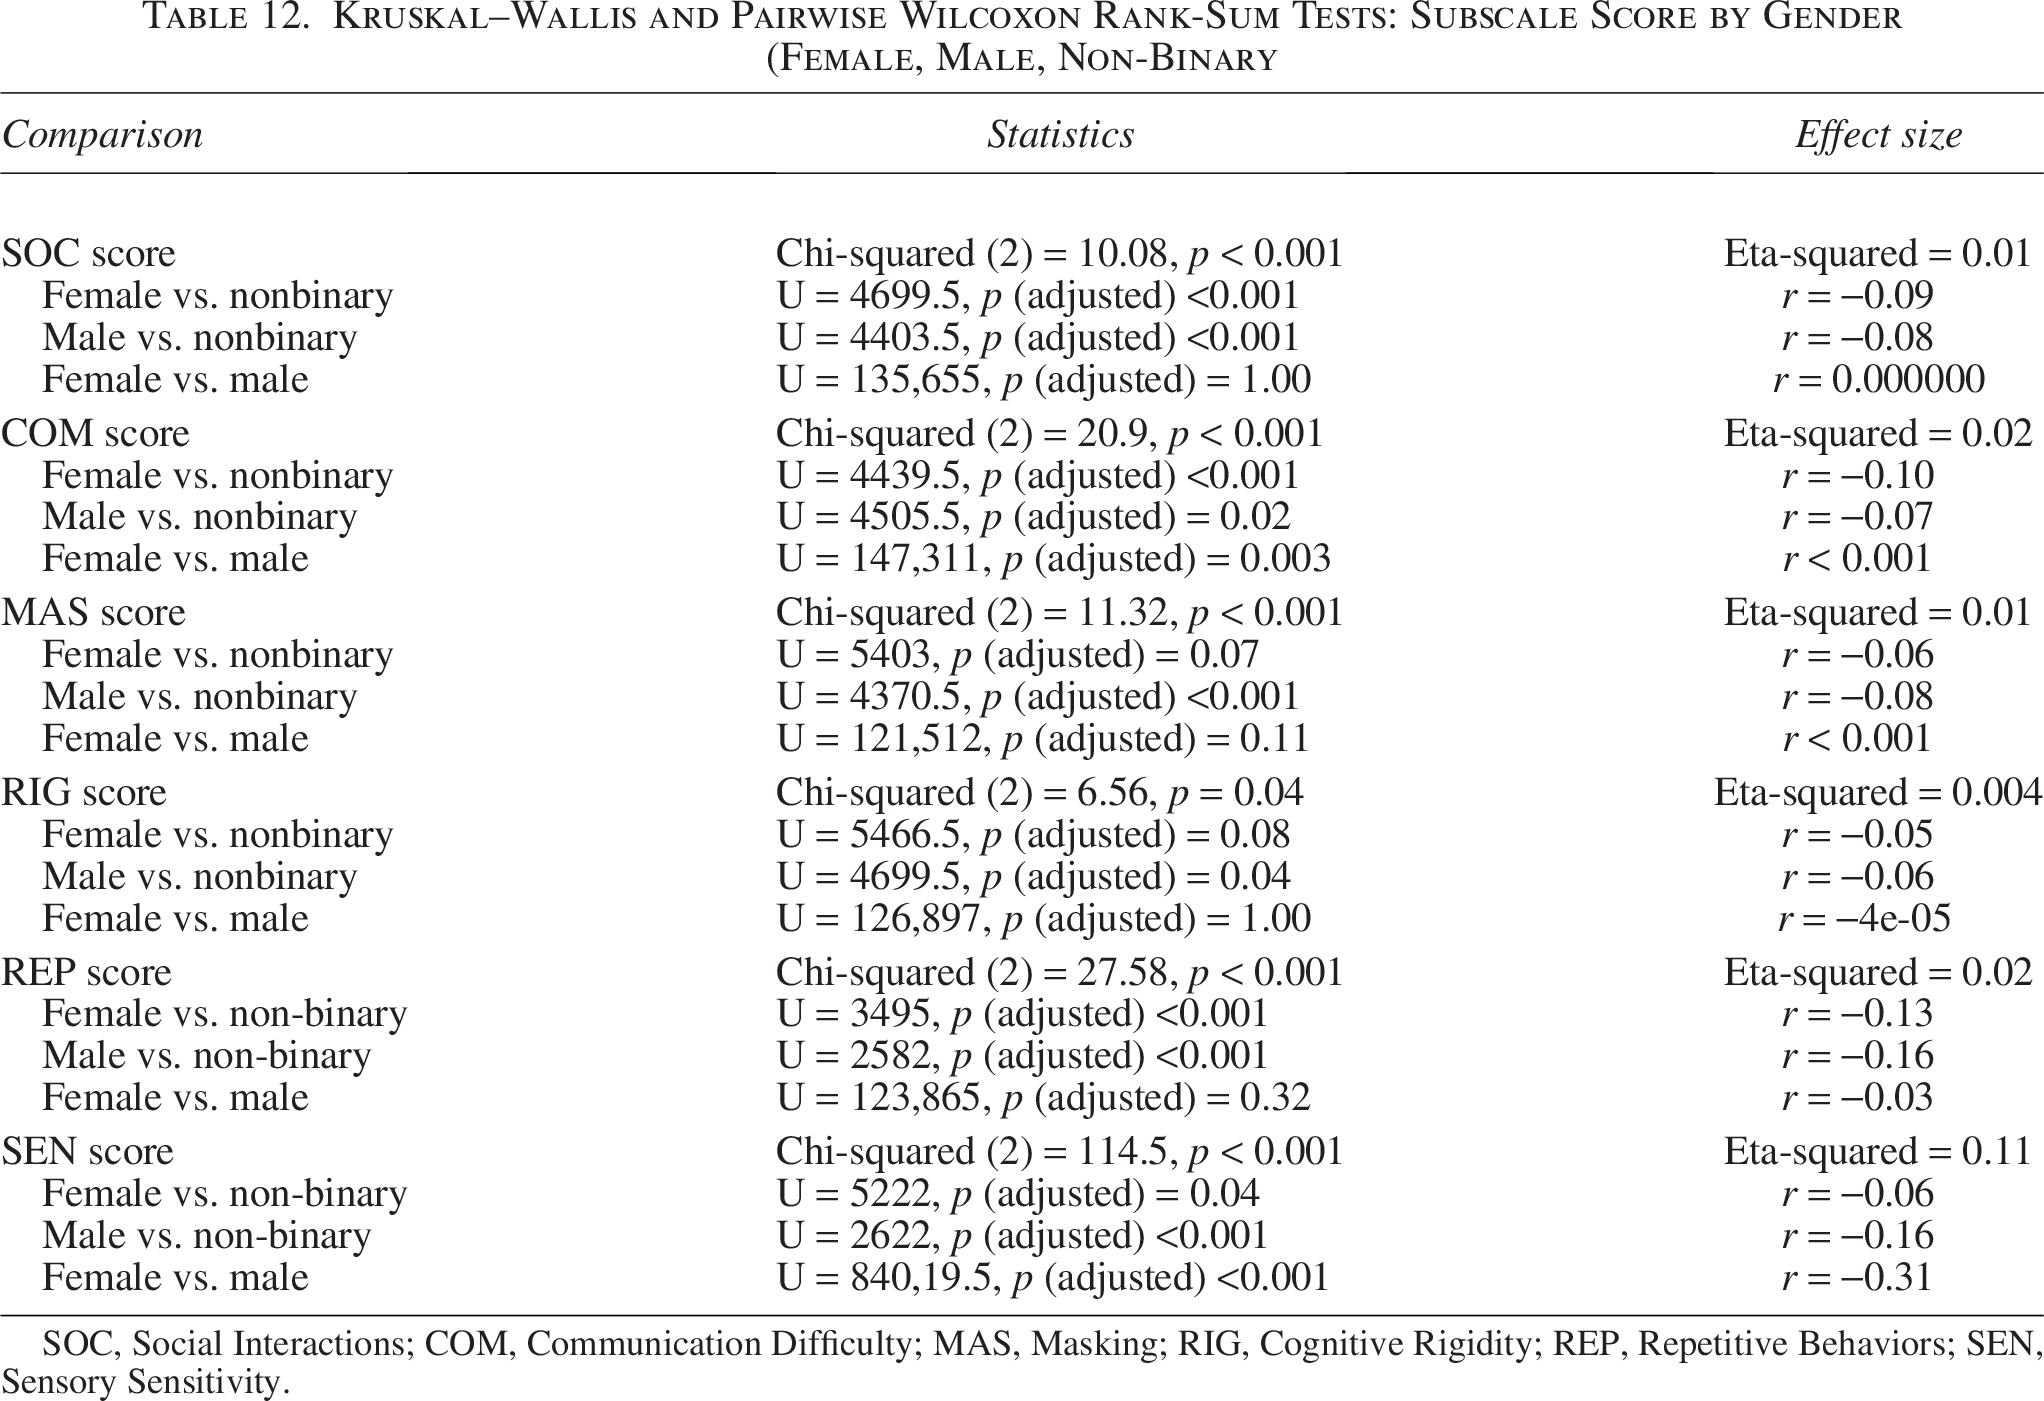
SOC, Social Interactions; COM, Communication Difficulty; MAS, Masking; RIG, Cognitive Rigidity; REP, Repetitive Behaviors; SEN, Sensory Sensitivity.
Measurement invariance analysis (female vs. male)
We conducted a measurement invariance analysis to examine whether the CATI-R functions similarly for males and females or whether the differences between male and female participants reported above are attributable to measurement bias. We used the best-fitting model from our CFA (Two-Factor Bifactors Model) to test whether the CATI-R functioned equivalently across genders. Our initial focus was on participants identifying as female or male, comprising a total of 1027 individuals. Among them, 23 were autistic (16 identified as female), and 1004 were non-autistic (524 identified as female). We then expanded this analysis to include non-binary participants. The full results of this broader analysis are accessible via the OSF: https://osf.io/zgybv/.
In sum, our results supported configural invariance, as the fit indices from the configural model (see Table 13) met the established criteria for acceptable model fit. 85 This indicates that the general factor structure of autistic traits—defined by the same arrangement of fixed and free loadings—was consistent across gender groups. When we imposed equality constraints on the factor loadings to test metric invariance, the model fit did not worsen (ΔCFI = −0.003, ΔRMSEA = 0.004, suggesting that factor loadings are equivalent for female and male participants. We proceeded to examine scalar invariance, which assesses whether item thresholds are equivalent across groups. The comparison between the scalar and metric models showed no meaningful decline in fit, supporting scalar invariance. Subsequent testing of residual (strict) invariance, where residual variances were constrained alongside loadings and thresholds, could not be meaningfully evaluated because residuals are not estimated under DWLS with ordinal indicators. When latent means were constrained to equality, model fit worsened (ΔCFI = −0.008, ΔRMSEA = 0.014), indicating mean differences between females and males. Finally, we extended the analysis to structural invariance. The Variance–Invariance model, which constrained latent variances to be equal across genders, demonstrated no meaningful worsening of fit compared with the Mean–Invariance model, indicating comparable variability of autistic traits. Adding constraints on both latent variances and covariances (variance–covariance–invariance) likewise produced negligible changes in fit, suggesting that the associations among latent trait dimensions were similar across genders. Together, these results provide evidence for measurement invariance of the CATI-R across gender groups.
Multigroup Factorial Analysis Assessing Measurement Invariance of the Revised Comprehensive Autistic Trait Inventory as a Function of Participant Gender (Female Vs. Male)
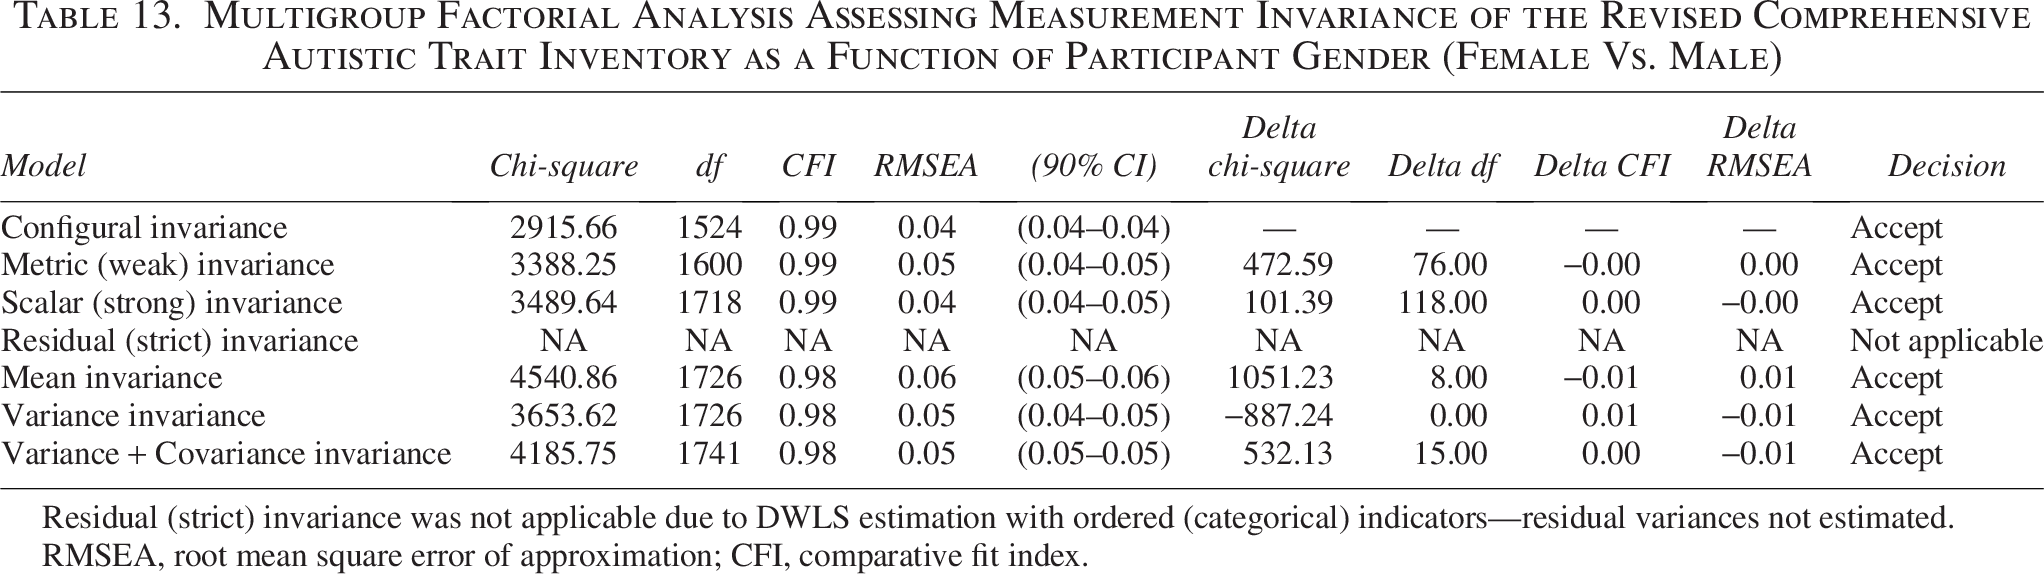
Residual (strict) invariance was not applicable due to DWLS estimation with ordered (categorical) indicators—residual variances not estimated.
RMSEA, root mean square error of approximation; CFI, comparative fit index.
Cross-language measurement equivalence
We conducted multigroup CFA, comparing English versus German CATI-R, using the best-fitting model from our CFA (Two-Factor Bifactors Model). As Table 14 shows, the configural model fits well, indicating the same factor structure across languages. Imposing metric (weak) invariance further supported equal factor loadings. Imposing scalar (threshold) invariance supported equivalence of item thresholds. Constraining latent means to equality significantly worsened fit by robust χ2, despite small Δ indices; accordingly, we did not assume mean equality and instead estimated latent mean differences under the accepted scalar model. Constraining latent variances (vs. scalar) and latent covariances (vs. variances) also met fit criteria, supporting structural invariance across languages. Taken together, the English and German CATI-R versions demonstrate configural, metric, scalar, and structural invariance, indicating that both versions assess the same constructs with comparable measurement properties, and that latent means can be legitimately compared across languages.
Multigroup Factorial Analysis Assessing Measurement Invariance of the Revised Comprehensive Autistic Trait Inventory as a Function of Language (English, German)

Residual (strict) invariance was not applicable due to DWLS estimation with ordered (categorical) indicators—residual variances not estimated.
RMSEA, root mean square error of approximation; CFI, comparative fit index.
Discussion
Confirmatory factor analysis
The present study aimed to validate the German translation of the CATI-R. We found a similar pattern of statistical significance, in the same direction as the previous English CATI and CATI-R validation studies.8,41 CFA supported the Two-Factor Bifactor Model—previously identified as the best-fitting model in the English CATI and CATI-R validation—demonstrating good model fit. These findings replicate the structural properties of the original measure. The DFI approach, with cutoffs adjusted to the specific sample and model, showed that fit indices corresponded to close-to-excellent fit. This suggests that the German CATI-R retains the theoretically expected bifactor structure once evaluated with more robust criteria.
Although the overall model fit for the Two-Factor Bifactor Model was good, a subset of items exhibited low loadings on their assigned subscale factor. These items may require further scrutiny, as low loadings suggest that they may not strongly represent the latent subscale constructs they are intended to measure. However, these items still showed moderate-to-strong loadings on the broader social or nonsocial bifactor, which implies that while their subscale specificity may be weaker, they still capture variance related to overarching autistic traits. This pattern may indicate that some items cut across subdomains. Exploratory Factor Analysis further supported the interpretation that, rather than indicating measurement flaws, the lower CFA subscale loadings likely reflect the complex, overlapping nature of autistic trait dimensions, where certain behaviors or sensitivities are not strictly confined to a single subdomain. Our findings support the multifaceted and interconnected structure of the CATI-R as intended by its theoretical framework.
Future item-level analyses and community feedback could help determine whether certain items would benefit from revision or reassignment to improve the internal structure of the measure in the German context. Bifactor indices provided further support for the structural validity of the German CATI-R. The high ω hierarchical values for the general factor, combined with ECV estimates above 0.50, suggest that the CATI-R total score should be considered the most reliable and informative representation of autistic traits. While subscale scores demonstrated adequate reliability (ω > 0.80), their lower ω hierarchical values (0.23–0.41) indicate that much of their variance is shared with the general factor rather than being unique. Thus, subscales may offer additional descriptive nuance but should be interpreted with caution and not treated as fully independent constructs. These findings are consistent with recent recommendations for bifactor evaluation 73 and underscore the value of the CATI-R as a broad measure of autistic traits, with strongest support for its use as a total score, with social and nonsocial domain scores providing additional but secondary information, and individual subscales contributing primarily to the breadth rather than the precision of measurement.
Correlations between CATI-R subscales
Correlation analyses supported construct validity. All subscales were significantly interrelated after Bonferroni correction. Compared with the original CATI, we observed less variability in the strength of these associations. Specifically, the range of correlation coefficients in the current sample spanned from r = 0.35 to r = 0.61, whereas the original study reported a broader range of r = 0.26–0.55. 41 However, the variability in our study was still larger than the one in the English CATI-R validation study, 8 where it ranged only from r = 0.56 to 0.68.
Internal consistency
Global indices—McDonald’s ω hierarchical and stratified Cronbach’s α—indicate that the measure captures a well-defined construct without excessive redundancy. Internal reliability was consistently superior to that of the AQ and comparable with the BAPQ, highlighting the CATI-R’s robustness as a psychometric tool. While all internal consistency indexes were slightly lower than those reported in the English CATI and CATI-R validation studies,8,41 the same was the case for the AQ and BAPQ. This finding may be attributable to several factors, including differences in sample size and demographics. For instance, studies with larger or more homogeneous samples tend to report more stable reliability estimates. 78 In contrast, smaller, more heterogeneous samples, such as the ones in this study, often exhibit slightly lower internal consistency due to increased variability in responses. In addition, demographic differences—such as gender—may affect how participants interpret and respond to the items, potentially influencing reliability estimates. Despite these minor differences, our findings highlight the CATI-R’s robustness as a psychometric tool for assessing autistic traits.
Convergent validity evidence
Total CATI-R score showed strong convergence with both the AQ and the BAPQ. Although the convergent correlations were slightly lower than those reported in the English CATI-R validation study, 8 the differences are unlikely to be of practical significance. All observed associations remained strong, indicating that the German CATI-R aligns well with established measures. Differences in convergent validity coefficients across studies may reflect sample variation, cultural or linguistic nuances in item interpretation, or differences in translation quality of the AQ and BAPQ, rather than limitations in the CATI-R itself. Some of the inclusive and stigma-reducing revisions in the CATI-R may make it more conceptually distinct from tools such as the AQ and the BAPQ, especially when adapted cross-linguistically. Further analysis could explore which subscales diverge most in convergence. Taken together, our results confirm the CATI-R’s conceptual alignment with established measures while also capturing unique variance likely associated with its broader, more inclusive subscale structure.
Examination of gender differences
Total scale and subscale scores by gender
Male Versus Female
The CATI-R effectively differentiated trait expression across gender identities. Male and female participants differed significantly in total scores, although with a small effect size. In contrast to the English CATI-R validation, where males scored slightly higher than females, males scored slightly lower than females. Subscale analyses revealed that male participants scored higher on COM, while female participants endorsed significantly more SEN traits. These findings align with prior evidence suggesting gendered patterns of autistic trait expression, particularly in sensory and social domains. 8 Nevertheless, compared with the English CATI-R validation, the gender-related effect for the SEN subscale in the German sample was more pronounced. It is possible that the reversed effect on total scores and the stronger effect on the Sensitivity subscale are partially attributable to differences in sample composition, as our sample was smaller and less heterogeneous than that of the English CATI-R validation study.
Male Versus Female Versus Non-Binary
In analyses that included non-binary participants, gender differences became more pronounced. Non-binary participants scored higher than both male and female participants across all subscales, with small effect sizes. While the small sample size of non-binary participants warrants interpretive caution, the consistently elevated scores across all CATI-R subscales in this group deserve further attention. These findings align with emerging research suggesting that gender-diverse individuals may report higher levels of autistic traits.87–90 Potential reasons may be reduced masking of neurodivergent traits or increased exposure to minority stressors that amplify trait expression. In our sample, differences were particularly pronounced for sensory sensitivity and repetitive behaviors, which may reflect heightened vulnerability to sensory overload and structured coping strategies in contexts where both gender identity and neurodivergence intersect. Future studies with larger and more representative gender-diverse samples are needed to validate these patterns and explore how experiences of gender marginalization may shape the reporting and manifestation of autistic traits. Nevertheless, our findings underscore the CATI-R’s utility in capturing the full spectrum of autistic trait diversity beyond the binary gender framework.
Measurement invariance analysis (female vs. male)
To meaningfully interpret the differences in observed scores across different genders requires measurement invariance 91 in that the probability of endorsing an item is not influenced by gender. In fact, the German CATI-R showed configural, metric, and scalar invariance across binary gender groups. Residual invariance could not be meaningfully assessed because residual variances are not freely estimated under DWLS estimation with ordinal indicators. When latent means were constrained to equality, model fit worsened, indicating that females and males differ in their average levels of autistic traits; importantly, this reflects true structural mean differences, not measurement bias. We also found evidence for variance invariance, suggesting that the variability of autistic traits was comparable between female and male participants, and for variance–covariance–invariance, indicating that the relationships among latent dimensions of autistic traits were similar across genders. Taken together, these results show that the CATI-R functions equivalently across genders (psychometric invariance), while also capturing meaningful latent mean differences (structural differences). This distinction is important for both research and clinical applications: the CATI-R can be used confidently to compare scores across genders, and observed group differences can be interpreted as genuine differences in autistic trait levels rather than artifacts of measurement.
Cross-language measurement equivalence
We additionally evaluated whether the English and German CATI-R forms operate equivalently. Multigroup CFA with ordered indicators supported configural, metric, and scalar invariance across languages. Structural constraints on latent variances and covariances were also acceptable. These results indicate that the two versions measure the same constructs with comparable loadings and thresholds, permitting valid latent-mean comparisons and cross-language inferences about relations with other variables. This cross-language invariance analysis was not preregistered and was conducted post hoc in response to peer review, and we therefore treat it as exploratory. Future work should confirm these findings in an independent sample.
Limitations and future research
While this study provides a robust validation of the German CATI-R, future research may further enrich the evidence. In particular, autism status was based on self-report, limiting the ability to validate scores against gold standard diagnostic assessments such as the ADOS-2. Future work should examine the measure’s accuracy in distinguishing between autistic and non-autistic people using clinical samples and consider longitudinal applications of the CATI-R to explore trait stability over time. Second, due to the limited sample of German native speakers on Prolific, the number of people who reported an autism diagnosis remained small (n = 29). Only 118 German participants were registered as “autistic” at the time of data collection, of which 72 participated in our study. Only 14 of these participants confirmed having an autism diagnosis in our demographic questionnaire. Likewise, although the non-binary sample was larger than in many previous studies, it remains small (n = 27), warranting caution in generalizing subgroup differences and a replication on other platforms.
Although the current study focused on validating the German translation of the CATI-R, it is important to highlight that the measure was developed through a participatory process with partners from diverse backgrounds. These partners played an integral role in shaping the content and language of the measure, ensuring that it aligned with community values and was respectful, accessible, and nonstigmatizing. Including this context is crucial, as the CATI-R’s sensitivity to diverse lived experiences—specially those of females and gender-diverse people—is directly rooted in this collaborative design. Future CATI-R adaptations or other psychometric developments may similarly benefit from direct engagement with the autistic community. In particular, the original CATI-R article proposed a set of practical guidelines for the development of self-report measures targeting neurodivergent traits. These include community engagement, avoiding metaphoric or ambiguous language, and using identity-affirming language rooted in the neurodiversity paradigm. These principles may guide future work, even if some linguistic nuances and cultural assumptions may differ across demographic groups.
Conclusion
The current study provides initial evidence for the validity, reliability, and inclusiveness of the German CATI-R. It replicates the factor structure of the original measure, demonstrates strong internal consistency, and confirms convergent validity with established autism trait inventories. Importantly, it shows that the CATI-R performs equivalently across gender groups, while also capturing meaningful gender-based differences in autistic trait expression, and across German and English versions, while remaining sensitive to meaningful gender-based differences in autistic trait expression. These findings underscore the CATI-R’s potential as a culturally adaptable and gender-sensitive tool for both research and applied settings in the German-speaking world. The validation of the CATI-R in German is therefore more than a psychometric contribution: it fosters research and clinical practice that acknowledge and take into account neurodivergent identities, thereby promoting better mental health and social outcomes.
Footnotes
Author Disclosure Statement
The authors declare that they have no known competing financial interests or personal relationships that could have appeared to influence the work reported in this article.
Funding Information
Data collection was funded by Kooperationsförderung, Universität Potsdam.
Authorship Confirmation Statement
F.C.H.: Conceptualization, methodology, software, validation, formal analysis, investigation, resources, data curation, writing—original draft, writing—review and editing, visualization, supervision, project administration, and funding acquisition. N.C.: Conceptualization, methodology, validation, formal analysis, resources, data curation, writing—original draft, writing—review and editing, visualization, supervision, and project administration. N.W.: Methodology, validation, formal analysis, and writing—review and editing. F.F.: Conceptualization and investigation. B.K.: Conceptualization and investigation. Ma.Ma.: Conceptualization and investigation. Me.Mi.: Conceptualization and investigation. O.T.: Conceptualization, methodology, validation, formal analysis, resources, data curation, writing—original draft, writing—review and editing, visualization, supervision, project administration, and funding acquisition. This article has been given solely to this journal and is not published, in press, or submitted elsewhere.