
Abstract
Background:
All cells, including bacteria, maintain an ion gradient across the plasma membrane. The resulting membrane potential is important for cell growth, division, and health. Our current research shows that a subset of Bacillus subtilis (B. subtilis) cells exhibit spontaneous, rapid (∼2 min) “spikes” in the membrane potential. The subset of cells that spike increases, and the spikes become more frequent, when cells are exposed to ethanol, an environmental stressor. Our goal is to highlight the association between membrane potential and cell elongation.
Methods:
To achieve this, membrane potential was measured using tetramethyl rhodamine methyl ester, a voltage-sensing fluorescent dye. Cell fluorescence and elongation were measured simultaneously over a 30-min period using fluorescence and bright field microscopy. Images were analyzed using a combination of ImageJ and custom MATLAB software.
Results:
We find that the population of cells that spike have slower elongation rates than those with no spikes in both the untreated and ethanol-treated cells over the 30 min of observation.
Keywords
Introduction
Bacterial electrophysiology is an emerging field that gives insight into the role of dynamic membrane potential in cell health and signaling. The membrane potential of a cell is created by the difference in charge between the inside and outside of the cell and changes with fluctuations of ions across the cell membrane. 1 When the membrane potential of a cell becomes more negative, the cell has hyperpolarized. These changes in membrane potential have been shown to impact cell health, growth, and proliferation.1–7 It has been shown that several external stimuli have the ability to hyperpolarize bacterial cells, such as blue light,8,9 gold ions, 10 and electric fields. 4 Within biofilms, changes in cellular membrane potential have been linked to changed growth rates.7,8,11,12 Individual cells expressing rapid changes in membrane potential within a biofilm have been linked to cellular communication and increased biofilm fitness. 13
Understanding how changes in membrane potential impact cellular behavior on a single cell level will give greater insight into the mechanics of bacterial health. Short fluctuations of the membrane potential, or spikes, of individual bacterial cells have been observed previously in Escherichia coli (E. coli.)14,15 Depolarization of E. coli has been linked to calcium flux and mechanosensation. 16 In Bacillus subtilis (B. subtilis), work on membrane potential changes has shown a connection to spore formation, 17 as well as antibiotic resistance,14,18 and rapid fluctuations in membrane potential result from changes in the ratios of sodium and potassium in the cell media. 14
We use fluorescence microscopy and a voltage-sensing dye, tetramethyl rhodamine methyl ester (TMRM), to measure changes in the membrane potential of B. subtilis cells on a single cell level. In this work, we show that rapid, temporary hyperpolarization of the membrane potential is correlated with slowed elongation. We also show that ethanol can be used to modulate the percentage of cells that exhibit this temporary hyperpolarization and the degree of hyperpolarization. This work provides another tool for the electrophysiology community to understand the role of the bacterial membrane potential.
Materials and Methods
Cell culture and immobilization for imaging
Methods for culturing and immobilizing cells have been described previously. 10 In brief, B. subtilis (168; Bacillus Genetic Stock Center, Columbus, OH) cells were cultured in Luria-Bertani (LB) broth (LB; 12795027, Thermo Fisher, Waltham, MA) overnight at 30°C in a shaking incubator (H1001-M, Sayreville, NJ) at 243 rpm. The cell growth phase was determined by measurement of optical density at 600 nm (OD600). Stationary phase cells used in experiments had an OD600 value above 0.9, and exponential phase cells had an OD600 value of ∼0.6.
For imaging experiments, cells were diluted 1:4 in fresh LB and stained with tetramethyl rhodamine methyl ester (TMRM; T668; Thermo Fisher) at a concentration of 20 nM for 1 h. After staining, 2 uL of cells were pipetted onto an agarose pad and allowed to absorb into the agarose (5–10 min) before the agarose pad was inverted onto a glass cover slip (48393-081; VWR, Radnor, PA) for imaging. Each coverslip was used to image one field of view containing 20–100 cells, described as a set in our analysis.
A control experiment was performed comparing the elongation of cells stained with TMRM to cells without dye to test for impacts on cell elongation by the dye itself. Exponential phase cells were imaged in brightfield at the start and end of 30 min, and no change in elongation was measured due to TMRM staining (Supplementary Fig. S4).
The agarose pad was made in a minimal salts glutamate glycerol media (MSgg)-agarose solution, described previously, 10 by dissolving 1.5% (wt/vol) agarose (A9539; Sigma-Aldrich, St. Louis, MO) into MSgg media by heating at 150°C for 15 min, then cooling to ∼50°C. TMRM (20 nM) was added to the agarose solution after removal from heat. The MSgg-agarose solution (2 mL) was cooled between two cover slips for 1 h at room temperature to generate a flat agarose pad for bacteria immobilization. The agarose pads were shielded from light prior to use to reduce exposure of TMRM to light.
Addition of ethanol to bacteria
To assess changes in membrane potential in response to ethanol (140 proof pure ethanol, V1401; Decon Labs, Inc., Prussia, PA), final concentrations of 1.08 M, 1.74 M, and 3.80 M ethanol were added to the bacterial suspension diluted in LB immediately before being pipetted onto an agarose pad for imaging. The volume of LB used to dilute the bacteria was adjusted to accommodate the addition of ethanol to keep the concentration of bacteria matched across experimental conditions.
Brightfield and fluorescence microscopy
Brightfield and fluorescence images were collected using an epifluorescence microscope (Olympus IX71; 40X objective, 1.30 NA, oil immersion; Olympus Corporation, Tokyo, Japan) in an inverted configuration with an electron-multiplying charge-coupled device camera (iXon; Andor, Belfast, Ireland). Brightfield imaging (10 ms exposure) was used to capture start and end images of each set of bacteria for elongation measurements. Fluorescence microscopy (40X TRITC filter, 70 ms exposure, 1 frame/min, 30 min) was used to image TMRM fluorescence intensity. To account for fluctuations in brightness between images, the mean gray values were normalized to the average mean gray value of three regions of background randomly selected, as described below.
Image processing and analysis
Microscopy images were processed with ImageJ. 19 Cells were selected randomly using a grid overlay on the images. Mean gray values were measured from 20 to 80 cells on each image. Mean gray values were normalized to the average value of three regions of background taken from randomly selected locations in the image.
The normalized mean gray values for each cell were processed in MATLAB (MathWorks Inc, v. R2023a, MATLAB Software, Natick, MA) to measure changes in fluorescence intensity, a marker for membrane potential, across the 30 min of imaging. A spike in membrane potential was defined by the findpeaks function in MATLAB with a threshold value of 0.05. The number of spikes was measured for each cell, as well as the magnitude of the spikes (amplitude of the peak), duration of the spike (width of peak at half height), and the number of spikes for each cell. Averages were also calculated in MATLAB. Statistical analysis was carried out using Prism (v. 9.5.1, GraphPad Software, San Diego, CA).
Cell viability
To confirm cell viability at the end of the 30 min of imaging and ethanol treatment, a propidium iodide (PI) stain was used. Cells were incubated with PI (0.5 µM, 1 h) prior to ethanol treatment. Cells were then moved to an agarose pad and glass cover slip to mimic experimental conditions. After 30 min, the cells were imaged on the microscope to measure viability. As a positive control, cells were heated (10 min, 95°C) before staining with PI and imaging.
Growth curves
B. subtilis cells were cultured overnight in LB at 30°C. These cells were diluted 1:4 in LB and ethanol (2–10% ethanol). Bacterial cells in these solutions were then cultured in 24-well plates at 30°C. OD600 was measured using a plate reader (SpectraMax iD3, San Jose, CA). Measurements were made every 10 min for 20 h. Experiments were carried out in triplicate. Mean and standard deviations are reported.
Results and Discussion
B. subtilis cells show rapid hyperpolarization “spikes”
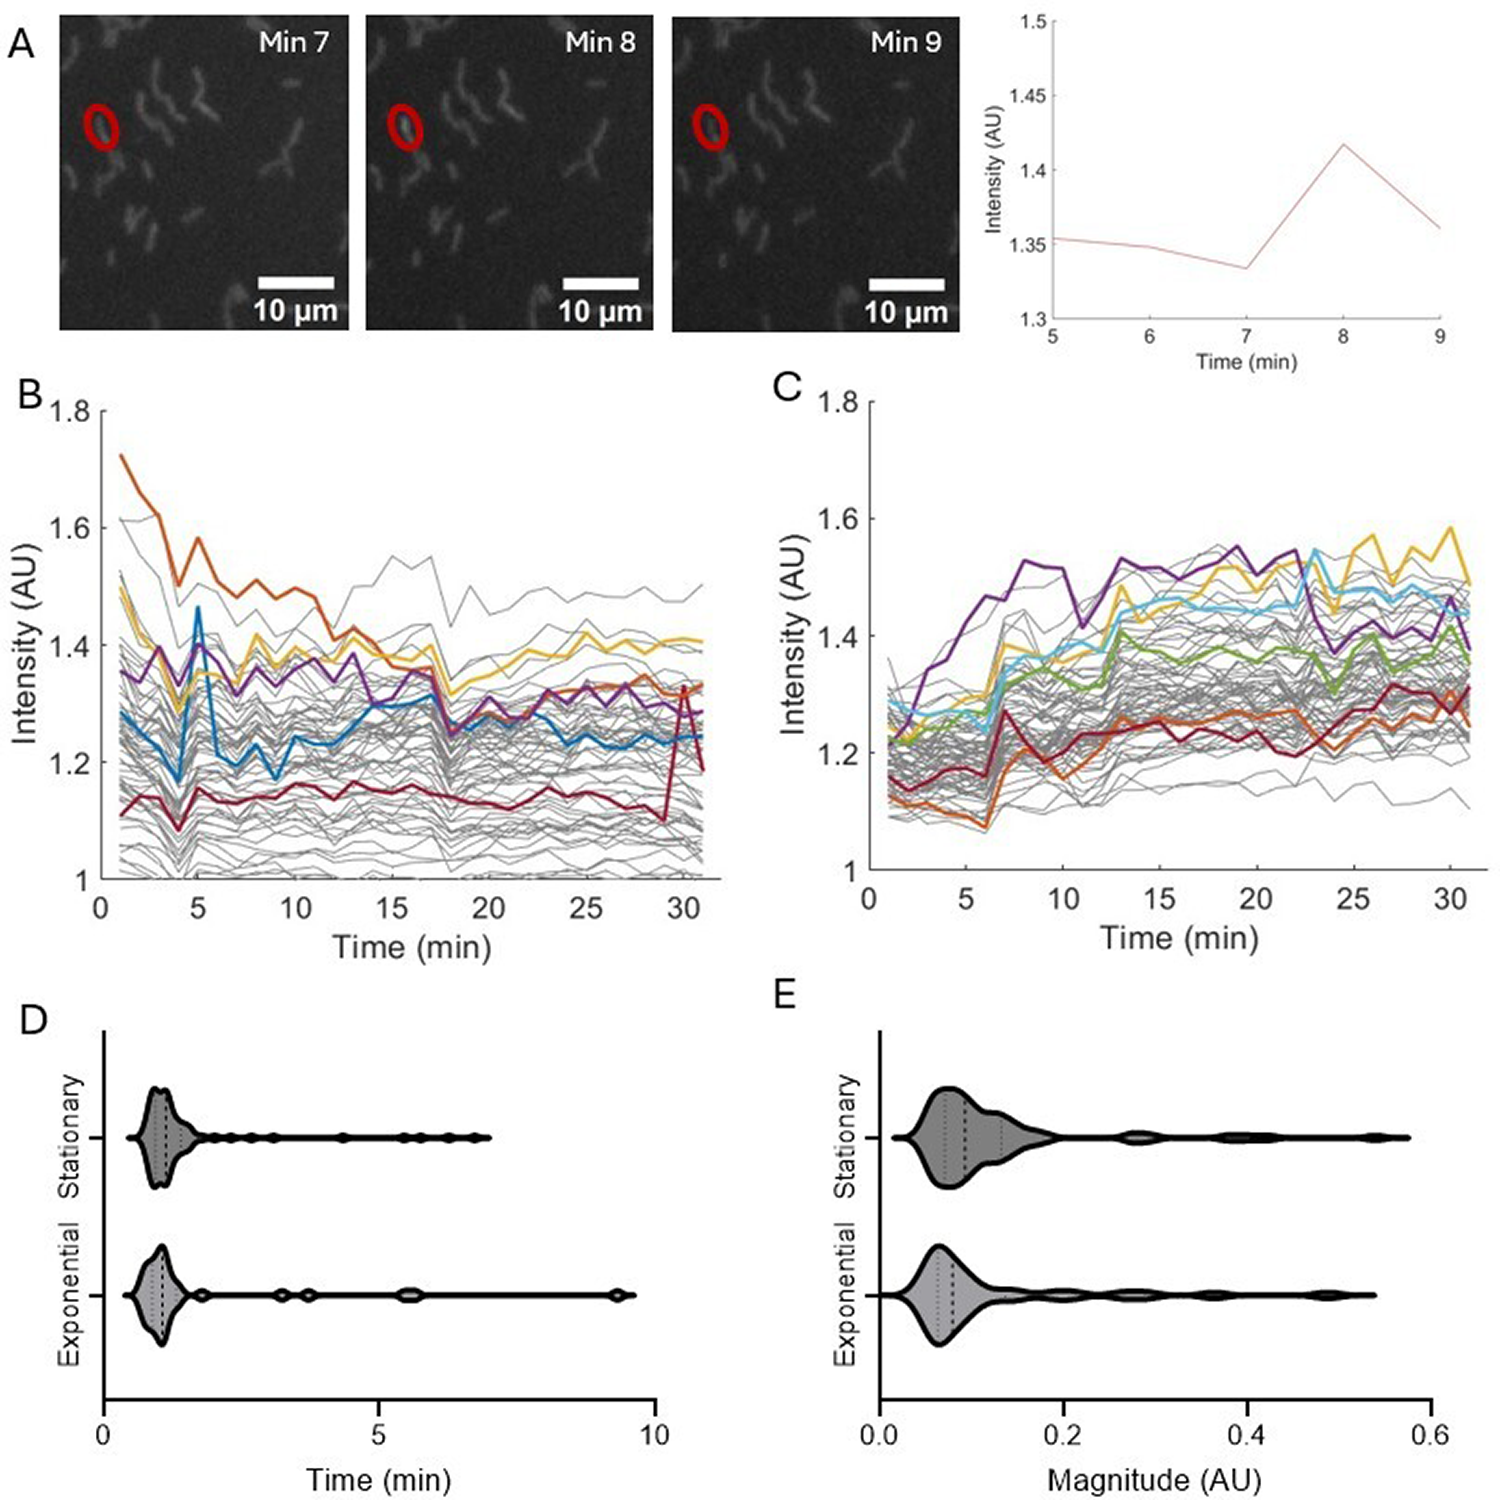
Changes in the membrane potential of cells can be observed by changes in intensity of TMRM, a voltage-sensing Nernstian dye. 9 TMRM is a positively charged, membrane-permeable dye that accumulates within negatively charged cells. The more negative the membrane potential becomes, the more dye accumulates inside the cell, leading to an increase in fluorescence intensity that provides a measure of cellular hyperpolarization.
We find that B. subtilis cells exhibit transient increases of TMRM intensity, which we refer to as “spiking” (Fig. 1A,B, C). These spikes last from 1 to 10 min with most spikes lasting less than 2 min (Fig. 1D). The magnitude of the spikes ranges from 0.05 to 0.55 AU (Fig. 1E). These spikes in membrane potential are observed in both the stationary and exponential phase cells (Fig. 1). Transient hyperpolarization events have also been observed in E. coli with durations of 5.1 ± 3.5 s. 14 These events were measured with protein sensors within the bacterial membrane, instead of with voltage-sensing dyes, which may account for some of the differences in time scale, in addition to differences between gram-negative and gram-positive species. 14
Cells exhibit spikes in membrane potential in both stationary and exponential phase.
The exponential phase of B. subtilis consists of rapid logarithmic growth; cells then transition to the stationary phase due to nutrient deficiency and undergo a shift in metabolic activity. 20 Differences between stationary and exponential growth phases also include remodeling of the peptidoglycan layer of the cell membrane.20–22 Disrupting the peptidoglycan layer may lead to mechanical defects, including changes in ion flow and the growth of the cell 21 To address differences associated with growth phases, experiments were carried out in both stationary and exponential phases.
Spiking of membrane potential is inversely correlated with cell elongation
Prior studies have shown hyperpolarization correlates with a slowed growth rate in bacterial cells.1,4,8,18,23 This may be due to the role membrane potential plays in generating ATP.1,23 For this reason, we examined the relationship between cell elongation and these hyperpolarization spikes. Cell elongation was measured as the change in length of the individual cells at the start and end of the 30 min of observation recorded from brightfield images, as described in Materials and Methods. Exponential phase cells that spike at least once in the 30 min of observation show less elongation than non-spiking cells (Fig. 2). Stationary cells were not analyzed due to lack of elongation over the 30 min of observation.
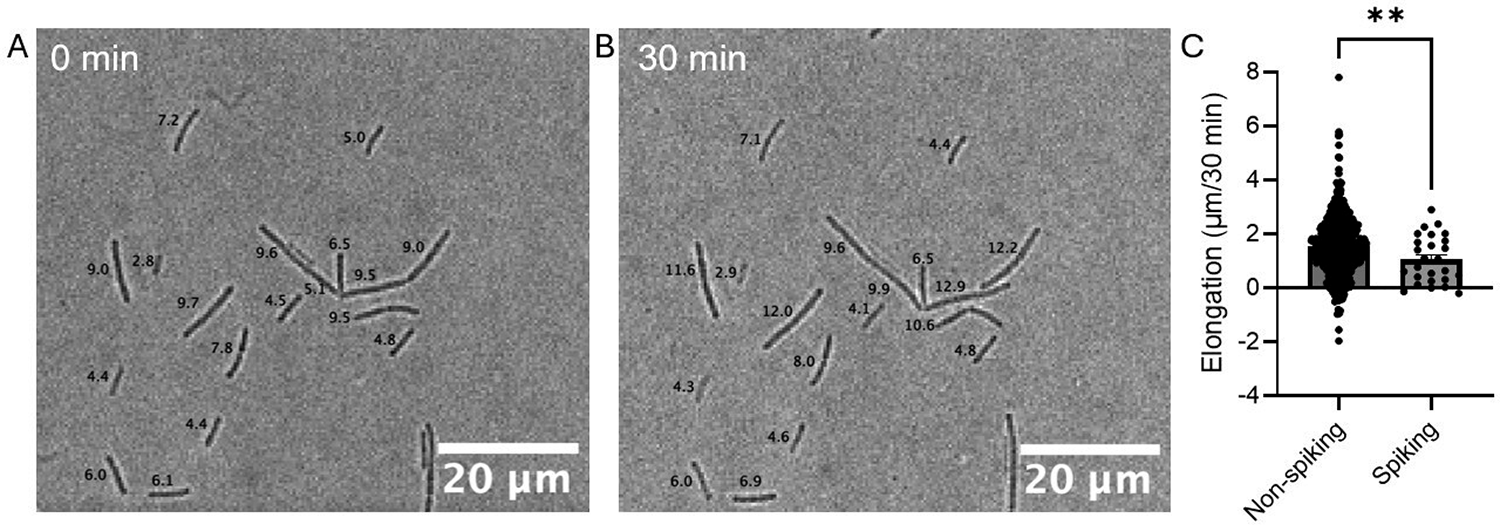
Elongation of spiking and non-spiking cells in the exponential phase over a 30-min period.
Ethanol increases spikes in the membrane potential
Ethanol is a common and readily available antibacterial agent. While much work has been done to explore how it impacts cell health,24–29 there has not been work examining the impact of ethanol on membrane potential. A growth curve was created to determine the minimum concentration that impacts cell growth over an 18-h incubation period (Supplementary Fig. S1). A concentration below this limit (1.08 M) was selected to compare to the minimum concentration that limits cell growth (1.74 M), as well as a higher concentration to see a more extreme response from the cells (3.80 M). Cells treated with 3.80 M ethanol were still viable after 30 min of exposure but had significantly reduced elongation (Supplementary Fig. S2, S3).
The addition of ethanol (3.80 M) to bacteria alters spiking behavior, with a trend toward larger magnitudes of spikes (Figs. 3A,B). The duration of the spikes is longer on average in the stationary phase (1.53 ± 1.29 min to 1.82 ± 1.93 min), but not exponential (1.74 ± 1.89 to 1.66 ± 1.60 min) (Fig. 1C, 3C). The magnitude of the spikes in the stationary phase increased from a mean of 0.12 ± 0.10 to 0.23 ± 0.30 AU, and the largest magnitude increased from 0.20 to 0.43 AU when ethanol (3.80 M) was added (Fig. 1D, 3D). In the exponential phase, the average magnitude of spikes changed from 0.12 ± 0.10 AU to 0.18 ± 0.16 AU, and the largest magnitude went from 0.19 AU to 0.29 AU (Fig. 1D, 3D).
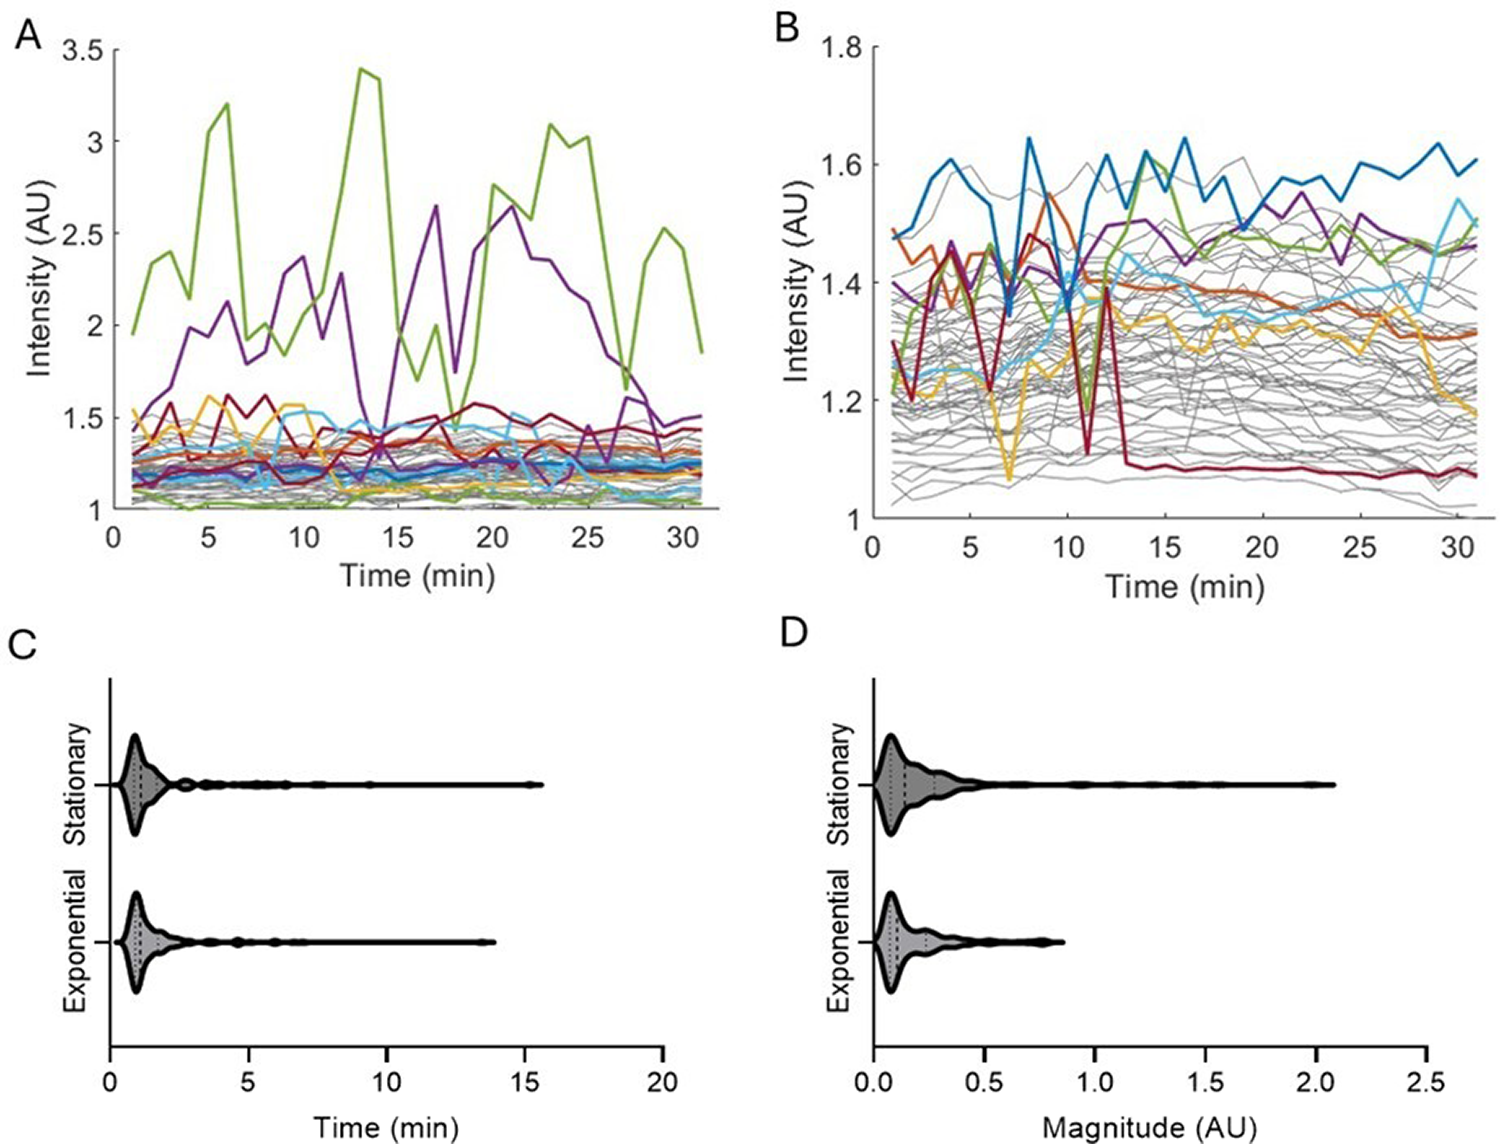
Increased spikes in membrane potential in response to treatment of cells with ethanol (3.80 M) in both stationary phase and exponential phase where intensity has been normalized to the background.
The percentage of cells in the stationary phase that have at least one spike in membrane potential over the 30 min of observation trends upward with increasing ethanol exposure (1.08–3.80 M) with a statistically significantly higher percentage of cells spiking after exposure to 3.80 M ethanol compared to controls (9.01 to 31.5%) (Fig. 4A). Of the cells that spiked at least once, the average number of spikes observed follows the same upward trend with a significant increase in the spikes per cell at 3.80 M ethanol compared to untreated control (1.17–2.01 spikes per cell) (Fig. 4B). The average magnitude and average duration of spikes in membrane potential showed a general increase from control cells (0.12 ± 0.10 to 0.23 ± 0.30 AU and 1.53 ± 1.29 to 1.82 ± 1.93 min), but not a clear trend with increasing ethanol exposure (Fig. 4C,D).
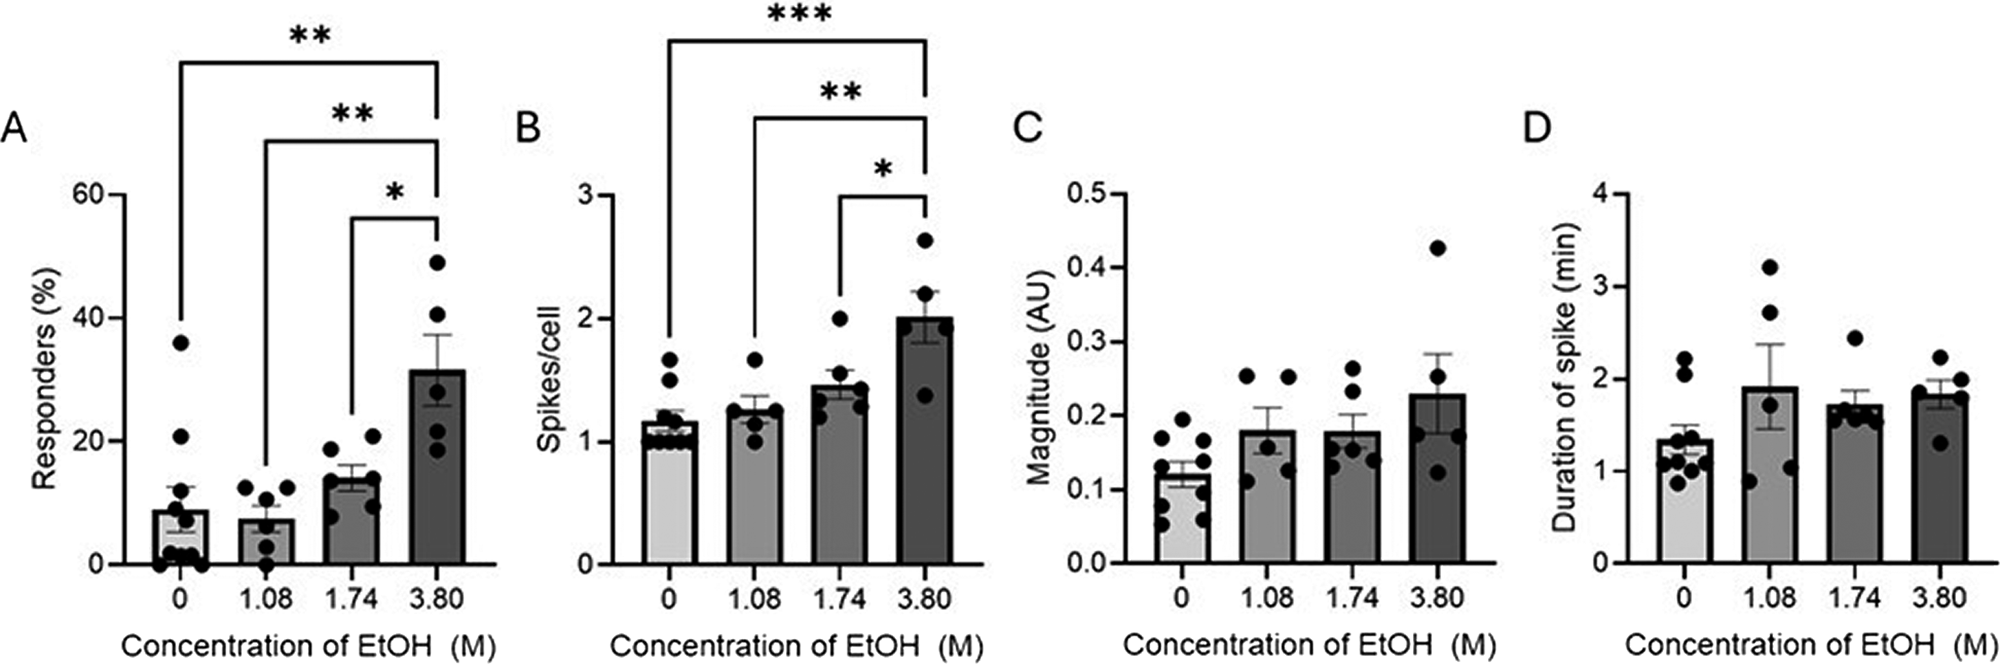
Spikes in membrane potential in response to increasing concentrations of ethanol (1.08–3.80 M) for cells in the stationary phase over 30 min.
Exponential phase cells show a similar response to stationary phase cells in percentage of cells responding to increasing ethanol exposure (4.38–20.53%) (Fig. 5A). The average number of spikes per cell also has the same significant increase between control and 3.80 M ethanol-treated cells (1.14–2.07 spikes per cell) but does not show the same upward trend as the stationary phase does (Fig. 5B). The average magnitude of observed spikes in membrane potential does show a clearer upward trend than the stationary-phased cells but similarly does not have a significant change in response to ethanol treatment (0.12 ± 0.10 to 0.18 ± 0.16 AU) (Fig. 5C).
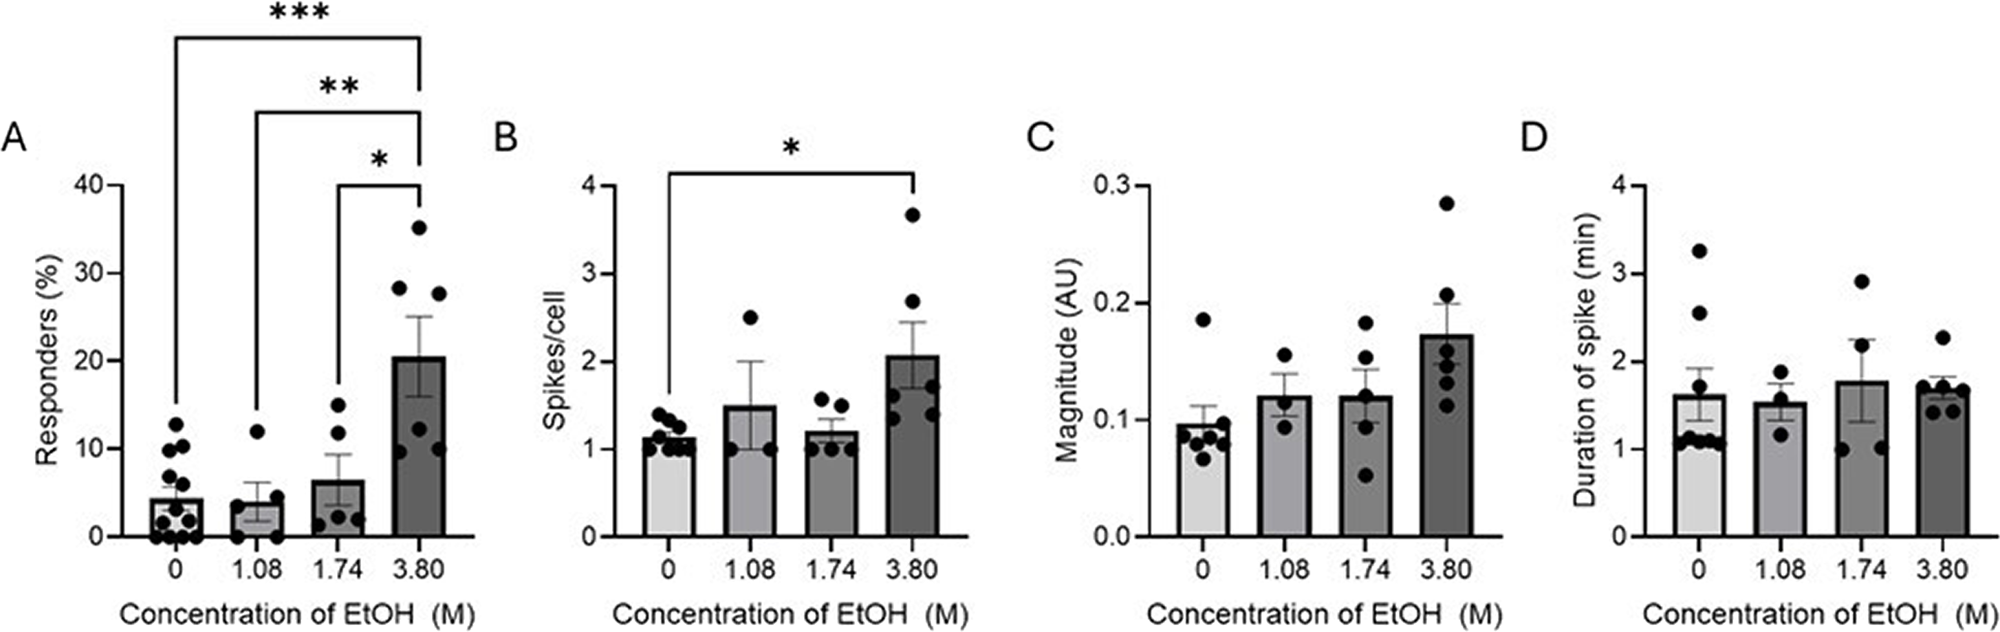
Spikes in membrane potential in response to increasing concentrations of ethanol (1.08–3.80 M) for cells in the exponential phase over 30 min.
Spikes in membrane potential are correlated with decreased cell elongation in ethanol-treated cells
Cells in the exponential phase that were treated with ethanol (1.08–3.80 M) showed the same pattern as the non-treated cells (Fig. 2). In all three treatment categories, cells that had at least one spike in membrane potential grew less than non-spiking cells over the 30 min of observation (Fig. 6).
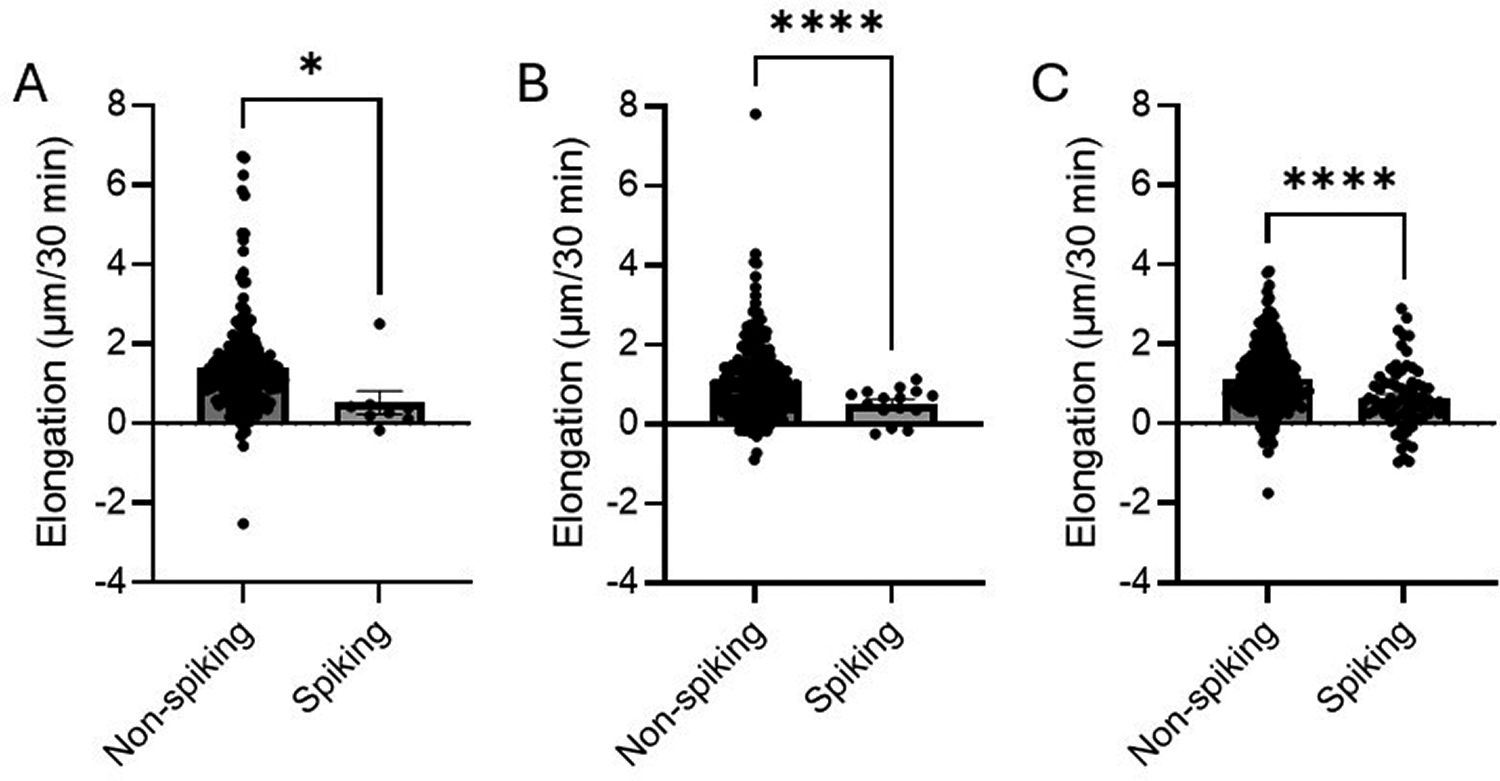
The impact on elongation of spikes in membrane potential for cells in the exponential phase treated with increasing concentrations of ethanol (1.08–3.80 M).
Conclusions
B. subtilis cells exhibit spikes in membrane potential (Fig. 1), which is correlated with decreased cell elongation in the exponential phase (Fig. 2). This decrease in elongation may be due to the change in free energy created by the spike in the membrane potential, as it has been shown that the membrane potential plays a key role in cell health and ATP production.1,3,4,6,23
We observed that the frequency of spikes within responding cells and the number of responding cells increase significantly, with a trend toward larger magnitudes and no significant change in duration by exposure of the cells to ethanol (Figs. 3–5). Ethanol is known to impact cell growth,24,30–32 and this decrease in cell elongation is not exclusive to cells that show spikes in membrane potential (Supplementary Fig. S3). However, this impact on the membrane potential shows another way in which ethanol impacts cell elongation.
Understanding the impact of fluctuations in the membrane potential of bacterial cells provides insights into the role of membrane potential in cellular health. The implications of this could be utilized for antimicrobial uses. While ethanol is a well-studied antimicrobial, this increase of fluctuations in the membrane potential shows an additional effect of ethanol on bacterial cells. We hope that this work will be useful for other researchers exploring bacterial electrophysiology, elongation, and response to environmental stressors.
Footnotes
Supplemental Material
Supplemental Material
Supplemental Material
Supplemental Material
Supplemental Material
References
Supplementary Material
Please find the following supplemental material available below.
For Open Access articles published under a Creative Commons License, all supplemental material carries the same license as the article it is associated with.
For non-Open Access articles published, all supplemental material carries a non-exclusive license, and permission requests for re-use of supplemental material or any part of supplemental material shall be sent directly to the copyright owner as specified in the copyright notice associated with the article.