
Abstract
Low-energy micro- and millisecond electric pulses (EPs) charge and depolarize the cellular plasma membrane (PM) below the electroporation threshold. Conversely, individual nanosecond EPs (NSEPs) are too brief to initiate PM depolarization by charging the cells. It is hypothesized that a single NSEP induces cell depolarization via PM electroporation upon application of high-power EPs. However, low-energy NSEP bursts with a very high pulse repetition frequency may prevent electroporation. This method, a temporal summation of NSEPs, results in subsequent PM charging and depolarization. To visualize PM voltage changes during low-energy EPs, we employed optical measurements using FluoVolt™ (an organic fluorescent reporter of membrane potential [MP]) and a custom-made streak imaging system. Ultra-fast streak kymographs depicting MP changes were obtained after exposure to a ∼0.2 kV/cm single 200 µs EP and 5 MHz trains of 1000 and 2000 NSEPs with 100 ns duration. Immediately following exposure, a small FluoVolt™ response (up to ∼7% fluorescence change) was observed in the PM areas facing electrodes. The response duration directly correlated with the pulse width (PW) or duration of the NSEPs burst interval. The single 200 µs EP was more effective at charging the PM than an equivalent-energy 5 MHz burst of 2000 NSEPs of 100 ns duration. Furthermore, similar amplitudes of PM fluorescence changes between ∼0.2 kV/cm bursts of 1000 and 2000 NSEPs suggest that increasing either PW or applied voltage is necessary to enhance the extent of PM depolarization. Nonetheless, the modest depolarization effect reported herein was sufficient to open voltage-gated Ca2+ channels in neurons. These findings indicate that a 5 MHz burst of low-energy NSEPs and single µs EPs effectively induce PM depolarization and Ca2+ responses without causing any cellular damage.
Introduction
Micro- and millisecond electric pulses (EPs) stimulate excitable cells at low voltages below an electroporation threshold. Moderately long low-energy micro- and millisecond EPs effectively charge and depolarize the cellular plasma membrane (PM) to induce physiological excitation without PM damage. 1 An ultra-short nanosecond electric pulse (NSEP) operates at a time scale significantly faster than the physiologically relevant opening and closure of cellular PM ion channels, thereby preventing charging and depolarization of the cellular PM below an electroporation threshold. Moreover, recent studies demonstrated that NSEP-induced nanoporation occurs below the cellular excitation threshold. 1 Cellular PM permeability to Na+ and Ca2+ increases post-NSEP, which is believed to be related to nanoporation rather than ion channel activation. 2 Therefore, high-energy NSEP-induced nanoporation may be responsible for loss of resting membrane potential (MP), long-lasting PM depolarization, inactivation of voltage-gated (VG) ion channels, and a putative long refractory period after stimulation. 1
In general, NSEP stimulation mechanisms differ from conventional microsecond EP stimulation and require very high electric fields (EFs) to achieve desirable bioeffects. However, depending on the tissue type and experimental conditions, excitation can be achieved with or without alteration of cellular PM.3,4 One study showed that 4 ns (10–80 kV/cm) EPs excite cardiomyocytes and induce nanoporation, 2 and another study demonstrates continuous stimulation of the isolated frog sciatic nerve by 3.3–8.8 kV/cm 12 ns pulses without any signs of tissue damage. 3 Burke et al. reported that 34 kV/cm NSEP of 10 ns duration safely depolarized the PM of U87 glioblastoma cells. 4
Pakhomov et al. 5 demonstrated that NSEP bursts at MHz pulse repetition frequency (PRF) caused temporal summation, which could safely stimulate cells at very low EFs. MHz compressed NSEPs bursts (100–1000 pulses) were able to stimulate cells at only 0.01–0.15 kV/cm without notable PM damage. 6 PM nanoporation was induced by these bursts at much higher EFs (0.4–0.6 kV/cm). Additionally, excitation by 1000 NSEPs of 200 ns duration at MHz PRF was achieved with 10–20 times lower EF magnitude in comparison to a single 200 ns pulse. 5 To better understand these effects, further studies are necessary. In this study, we sought to determine mechanisms underlying this stimulation paradigm.
Recently, we conducted a pilot study to investigate neurological bioeffects after a burst of low-energy NSEP. Intracellular Ca2+ rises after exposure to 0.01–0.2 kV/cm 5 MHz trains of NSEPs of 100 ns duration were compared with a single 0.01–0.2 kV/cm µs and ms EP whose duration matched the duration of the NSEP trains. In addition, putative acute PM damage was assessed by monitoring the uptake of a small-molecular-weight dye (Yo-Pro-1). The results indicated that a 5 MHz burst of low-energy EPs (100 ns NSEP trains) at 0.01–0.2 kV/cm effectively induced Ca2+ responses in rat primary hippocampal neurons (PHNs) without any cellular damage. 7 Depolarization of the neuronal PM may play a crucial role in the fast component observed in both exposure paradigms, as Ca2+ influx through VG calcium channels (VGCCs) could be the primary reason for the observed phenomena.
Additionally, to directly measure the extent of PHN membrane depolarization after exposure to ∼0.2 kV/cm 5 MHz trains of NSEPs of 100 ns duration and a single ∼0.2 kV/cm µs and ms EP, we conducted a series of electrophysiological patch-clamp experiments. However, the patch-clamp technique appears unsuitable to assess PM charging kinetics directly during exposure due to the rapid time scale of NSEPs, and robust electrical stimulation artifact. 8
In the current study, we employed optical measurements of membrane depolarization using an organic fluorescent reporter of MP (FluoVolt™; Thermo Fisher Scientific, Waltham, MA) and an in-house custom-made streak imaging system. 9
FluoVolt™ is a fast-response potentiometric dye that incorporates into the plasma membrane’s lipid bilayer, where it orients its chromophore to directly sense the transmembrane EF. Voltage-sensitive dyes of this class operate through an electrochromic mechanism, in which changes in MP alter the local EF experienced by the dye, producing immediate shifts in its absorption and emission spectra. This results in rapid, nearly linear fluorescence changes proportional to the voltage. Depolarization reduces the membrane EF and increases fluorescence, whereas hyperpolarization produces the opposite spectral shift and decreases the signal. Because FluoVolt responds directly to the EF rather than relying on ion redistribution or binding kinetics, its temporal resolution is effectively instantaneous and capable of tracking sub-millisecond electrical events.10,11
Using a streak imaging system, ultra-fast (1 ms long) streak kymographs were obtained of the MP changes after exposure to a single 200 µs EP and 5 MHz trains of 1000 and 2000 NSEPs of 100 ns duration. The EF was kept constant between all exposures (∼0.2 kV/cm). As a functional test of the physiological effects of PM depolarization after exposure to ∼0.2 kV/cm 5 MHz trains of NSEPs of 100 ns duration and a single ∼0.2 kV/cm µs EP, we performed fast Ca2+ imaging of excitable PHNs and nonexcitable CHO-K1 cells in the presence of VGCC blockers. The results of these studies are presented in this report.
Materials and Methods
Cell cultures and fluorescent dye-loading procedures
The CHO-K1 cells and PHNs were cultured at 37°C, 5% CO2, and 95% humidity. The CHO-K1 cells were stored in the F-12K medium containing 10% fetal bovine serum, 1 I.U./mL penicillin, and 0.1 µg/mL streptomycin. PHNs were stored in NbActiv1™ medium (BrainBits®) for 14 days before experimentation. Half media exchange was performed twice per week. Imaging and exposures of CHO-K1 cells and PHNs were performed in a standard physiological solution containing (mM): 135 NaCl, 5 KCl, 2 MgCl2, 10 HEPES, 10 glucose, and 2 CaCl2, formulated at pH 7.4, and 290–310 mOsm.
For MP imaging experiments, the CHO-K1 cells had their growth media removed; cells were rinsed with standard physiological solution and loaded using the Fluovolt™ Membrane Potential Kit (F10488, Invitrogen, Thermo Fisher Scientific). As per the manufacturer’s protocol, 2 µL of the Fluovolt™ dye and 20 µL of the 100× PowerLoad™ concentrate were added to 2 mL of standard physiological solution to formulate the loading solution. After adding the loading solution to the cell dish, the cells were placed in the incubator for 30 min during the dye-loading procedure. Following incubation, the dish was rinsed with 2 mL of standard physiological solution and brought to the Streak system for experiments.
To monitor intracellular Ca2+ dynamics after bursts of low-energy NSEPs or single µs EP exposure, we used Fluo-4 AM, a cell-permeant Ca2+ indicator (Thermo-Fisher Scientific). CHO-K1 cells or PHNs were incubated with Fluo-4 dye in a Ca2+-free solution containing 2–5 µM Fluo-4 and 0.05% Pluronic™ F-127 (Thermo-Fisher Scientific) in the dark at room temperature (∼20°C). After 30 min, the cells were washed in Ca2+-free solution for 30 min, and coverslips with cells were transferred to the recording chamber for exposures and data collection.
Optical and exposure set-up
For Ca2+ imaging experiments, we used a system comprising a Hamamatsu Orca Flash 4.0 digital camera mounted on an Olympus BX51WI fixed-stage microscope. The camera features a 4-megapixel scientific complementary metal-oxide-semiconductor (sCMOS) sensor and can capture 100 frames per second (FPS). The microscope is equipped with an Olympus TH4-100 light source for bright-field infrared differential interference contrast microscopy and a Sutter Instruments DG-4 illumination source for fluorescent microscopy. An Olympus Real-Time Controller was used to ensure that all components of the system are driven at or near stated speeds and to trigger the Stanford Research Systems DG645 Digital Delay Generator for accurate bursts of NSEPs or a single 200 µs EP delivery. For exposures, we used a parallel platinum-iridium bipolar electrode consisting of two cylindrical platinum–iridium poles (125 µm diameter) arranged in parallel with an inter-electrode spacing of approximately 170 µm. (FHC, 30210). For stimulation, the distal tips of the electrodes were positioned ∼20 µm above the surface of the glass coverslip with cells. Stimulation characteristics were achieved using an AVTECH AV-1015-B Pulse Generator and monitored by a Tektronix DPO 5054B Digital Phosphor Oscilloscope. Temperature during exposures was monitored and maintained at 37°C using a Warner TC-334C dual automatic temperature controller within the imaging chamber.
MP streak microscopy was performed using a second low-voltage stimulator (AVTECH AV-1015-B). Imaging was conducted using a custom-built optical streaking imaging system coupled to a commercial Olympus IX73 inverted widefield microscope. 12 Cells were illuminated with a 488 nm continuous-wave laser (Genesis CX488-3000 STM, Coherent) at ∼7 kW/cm2. A mechanical slit was placed at the microscope’s intermediate image plane, located just beyond the microscope’s side port, to select a narrow cross-section of the cell. The long axis of the slit was aligned parallel to an imaginary line running from the tip of the cathode to the tip of the anode. The intermediate image plane was then relayed to a sCMOS camera (Dhyana 95 v1, Tucsen) via two 2” achromatic lenses with 100 mm focal lengths (AC508-100-A-ML, Thorlabs). A galvo-scanner (GVS002, Thorlabs) mirror was positioned at the telescope’s Fourier plane to produce a streak image by translating the image of the cell bounded by the mechanical slit across the camera sensor. The slit width resulted in an 8.6 µs temporal resolution. A function generator (DG1022Z, Rigol) was used to apply sinusoidal motion to the galvo-scanner, 13 and a delay generator (DG645, Stanford Research Systems) was used to trigger laser exposure and image acquisition from the sCMOS. Images were captured during the linear portion of the sinusoidal signal. 13
Dosimetry
Before experimentation, a finite element analysis (FEA) was conducted in COMSOL Multiphysics (COMSOL, Stockholm, Sweden) to determine the magnitude of the EFs at locations of interest. This method has been previously documented in detail by Beier et al. 2019 and Steelman et al. 2021.14,15 Briefly, a finite element model of parallel bipolar electrodes (electrically approximated as perfect conductors) was constructed. The electrodes were angled at 45° and placed 20 µm above the bottom of a finite element model of a chamber filled with a 1 mL physiological saline. COMSOL’s AC/DC module was used to drive a stationary study at 1 V input and the resulting EFs inside the solution were scaled to the experimental input voltage (6 V and 30 V). We found that the mean field strengths at the areas of interest were approximately 0.2 kV/cm and 1 kV/cm, respectively.
Data analysis
Cell fluorescence was measured for each image (frame) using the Fiji distribution of ImageJ software (NIH). For the Fluo-4 AM-positive cells, regions of interest (ROIs) were carefully drawn using the first image in the image stack to demarcate the cell’s cytoplasm. Mean fluorescence was measured for each region for all images. These values were transferred to GraphPad Prism 7 (www.graphpad.com) software for statistical analysis and plotting. The responses were calculated for each cell as a percentage difference (ΔF, %) from the mean of the four frames prior to exposure (Baseline) to the frames taken after exposure (Value) using the formula: 100 × (Value – Baseline)/Baseline.
Like Fluo-4 AM fluorescence analysis, the streak camera kymographs were opened as a stack in the Fiji imaging software, and the two ROIs along the edges of the fluorescence image were manually determined. The width of each ROI was 20% of the width of the cell, as previously described by Beier et al. 14 This analysis created the temporal response for both the cathode- and anode-facing side of the cell. The background signal was subtracted from the response and baseline fluorescence intensity was determined by averaging several data points prior to exposure. The ΔF(%) change was calculated using the formula presented above. The individual time responses for each exposure parameter (n 10–30) were then averaged using GraphPad Prism 7 software. Data are presented in this report as a mean ± standard error of the mean (SEM).
Results and Discussion
Streak and optical streak recording of MP changes during exposure to a low-energy 5 MHz burst of NSEPs and a single 200 µs EP
To better understand the depolarization effect after applying 5 MHz burst of NSEPs or single 200 µs EP, we performed resistor–capacitor (RC) modeling of membrane charging using exposure parameters from our experiments (Fig. 1). The model consisted of a resistance in series with a capacitance with a time-constant of 200 ns. The parameter values chosen are representative, since the overall conclusions drawn from Figure 1 are insensitive to them. The RC circuit was solved in the time domain using a SPICE simulator (LTspice version 24, Analog Devices, Inc.). The model explains the dependence of the “saturation” capacitor voltage with the time-averaged EP amplitude. If the voltage is held constant, the burst of NSEPs at a 50% duty cycle will induce half of the depolarization effect in comparison with the single EP (100% duty cycle). This can be observed in Figure 1, red trace vs. blue line. Thus, increasing the number of NSEPs at a fixed applied voltage and MHz PRF will not improve the PM charging effect, due to capacitor saturation. To increase the extent of membrane depolarization, either the applied voltage or the NSEP burst duty cycle should be increased (Fig. 1, green and purple traces).

RC modeling of PM charging.
To validate these modeling results we recorded CHO-K1 MP changes using an organic fluorescent reporter of MP (FluoVolt™; Thermo Fisher Scientific, Waltham, MA) and an in-house custom-made streak and optical streak imaging system. 9 FluoVolt™ responds to changes in MP within a couple of µs with great sensitivity (25% changes in fluorescence per 100 mV fluorescent signal change [FluoVolt™ Membrane Potential Kit]). Ultra-fast (1 ms long) streak kymographs of the MP changes were obtained after exposure to a single ∼0.2 kV/cm 200 µs EP or 5 MHz trains of 1000 and 2000 NSEPs of 100 ns duration at similar ∼0.2 kV/cm EF. Immediately after exposure, a FluoVolt™ response (% fluorescence change) was observed in the areas of the membrane facing the electrodes, as previously reported. 14 Fluorescence intensity proximal to the cathode increased while the intensity proximal to the anode decreased. A representative kymograph from our experiments is shown in Figure 2.
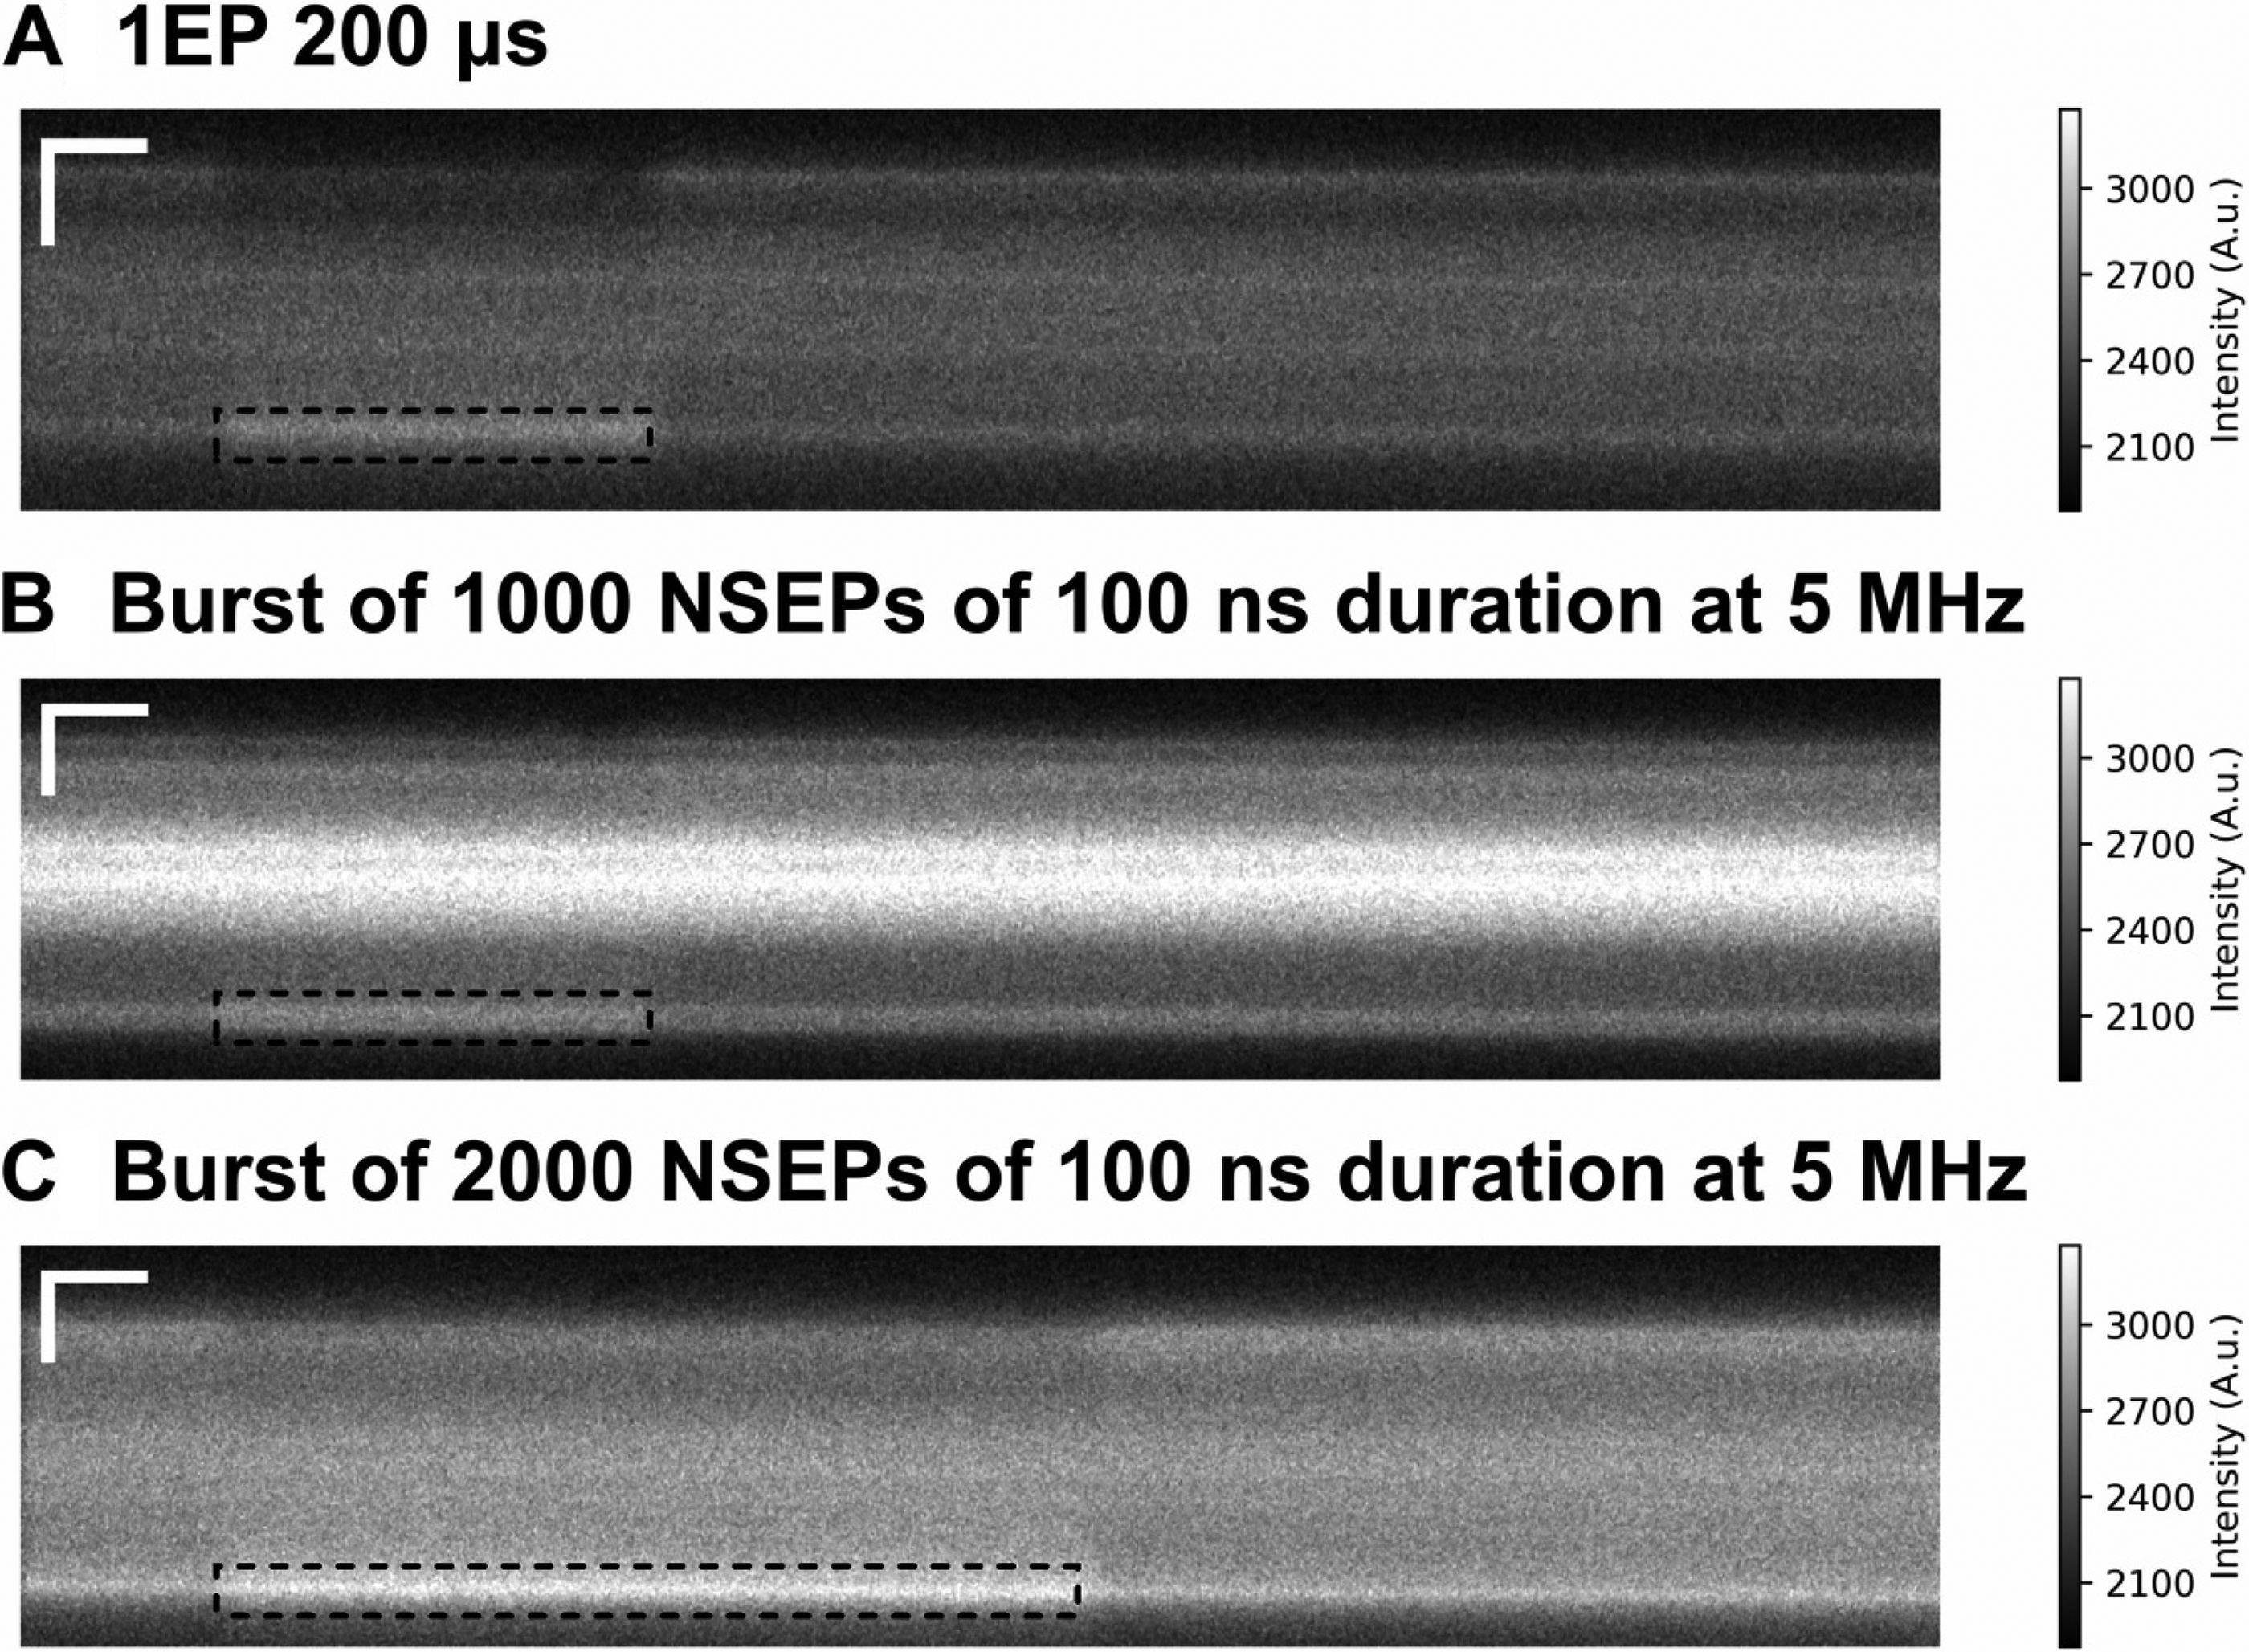
The duration of the response is directly correlated with the pulse width or duration of the NSEPs burst (Fig. 2 increase [outlined by dashed rectangle] and decrease of fluorescence intensity signal along the edges). During exposure, the membrane near the anode electrode experienced hyperpolarization, while the membrane near the cathode electrode became depolarized. Figure 2A shows a representative kymograph acquired from a cell during a single 200 µs pulse. Figure 2B and C show representative kymographs during a train of NSEPs with 100 ns duration at 5 MHz for bursts of 1000 pulses and 2000 pulses, respectively. The upper edge of the kymograph correlates to the portion of the cell membrane near the anode while the lower edge is near the cathode. Lower fluorescence intensity implies hyperpolarization, while increased intensity implies depolarization. The depolarizing effect after exposures at cathode side of the cells is shown in Figure 3 (mean traces, n = 8–30 cells).
(
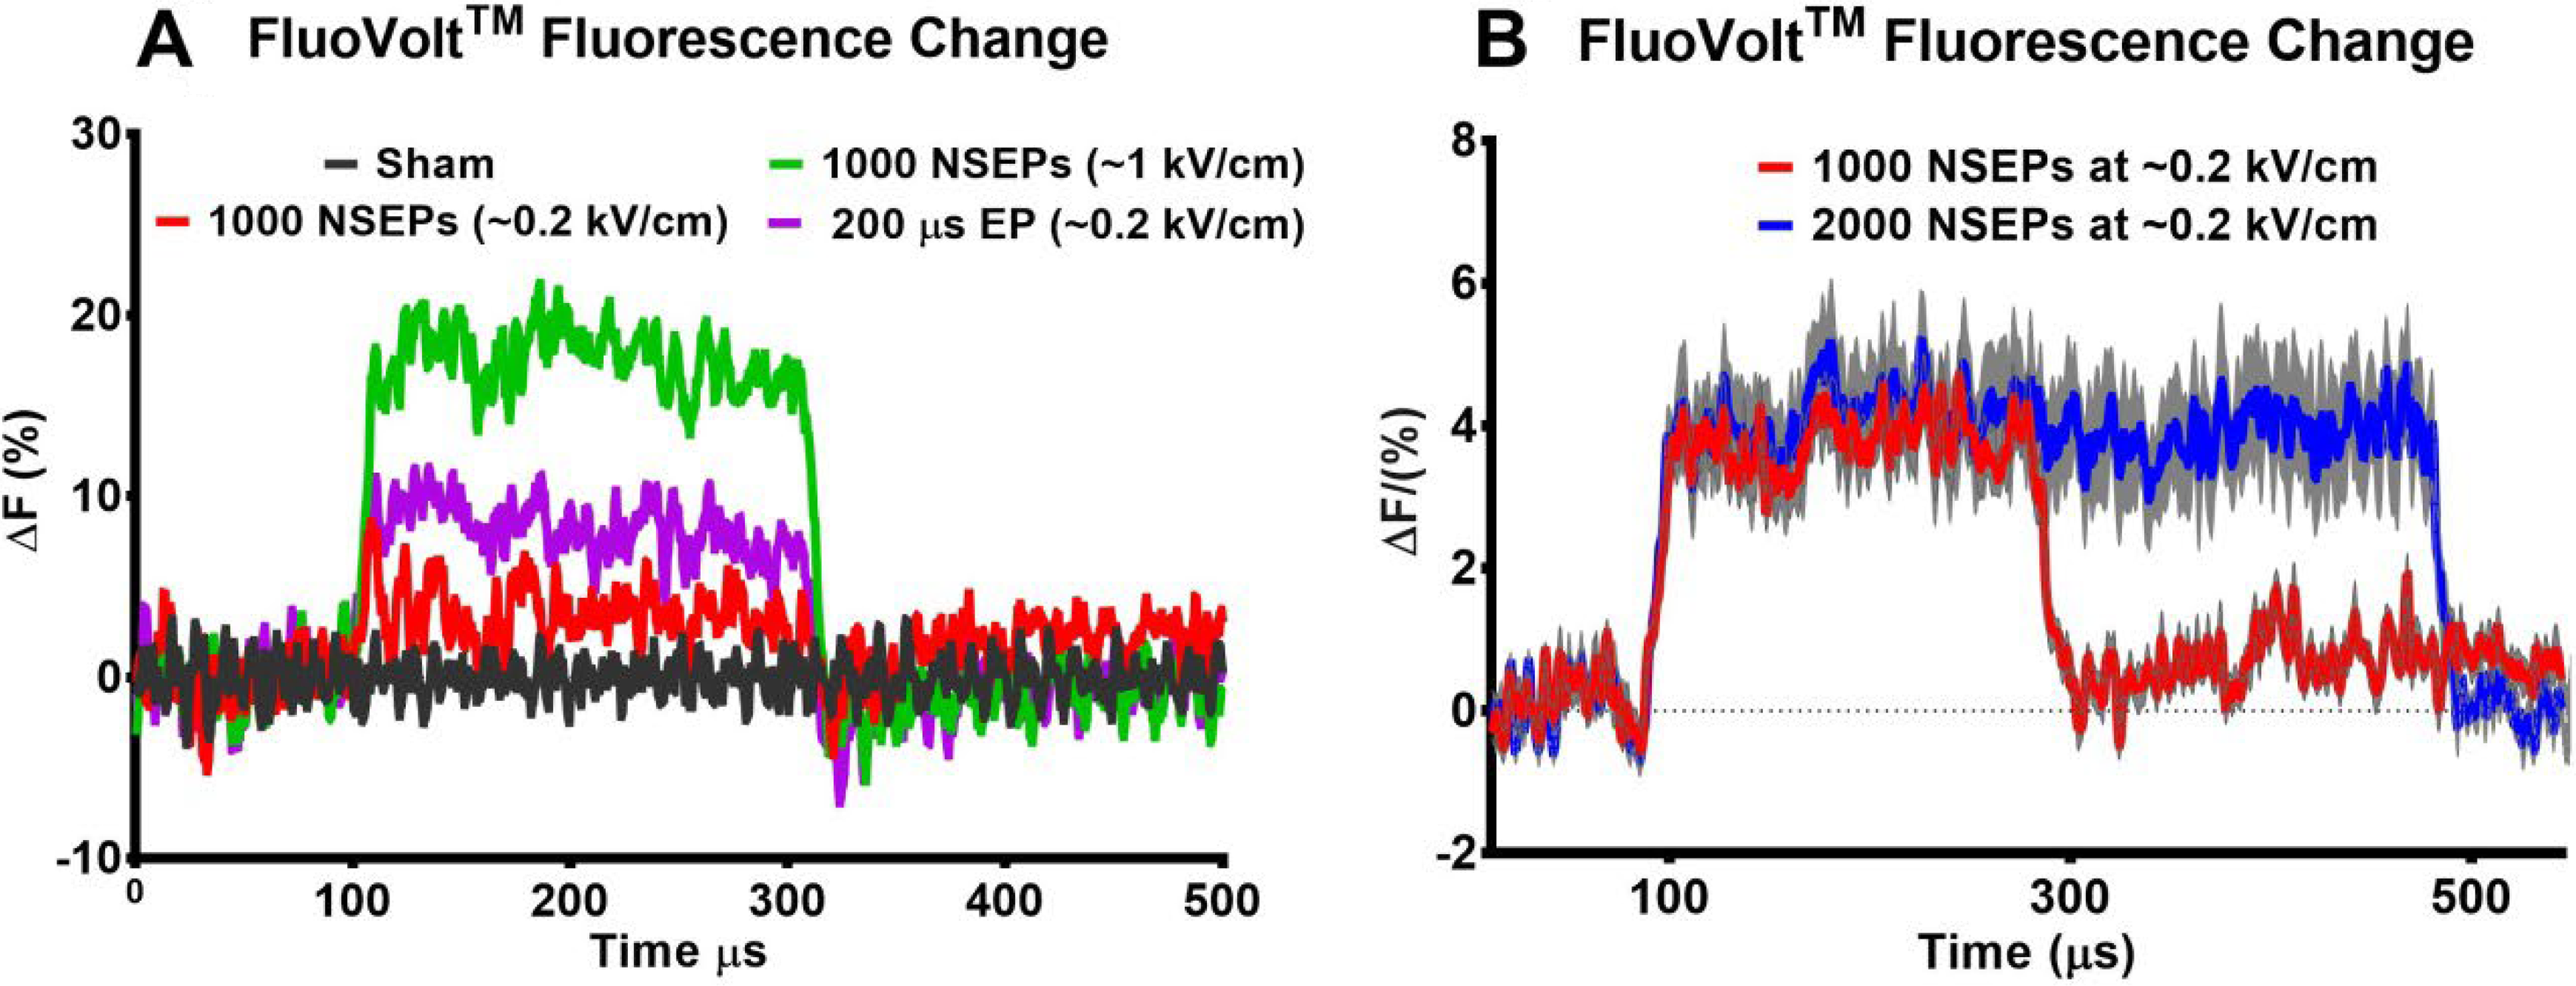
Figure 3B shows the cellular fluorescence response during EPs. The responses in Figure 3A were acquired with a commercial Hamamatsu streak camera previously described, 14 while those in Figure 3B were collected using our new optical streak camera system. 9 The responses to ∼0.2 kV/cm burst of NSEPs and single 200 µs EP look similar between these experimental set-ups (e.g., there are no differences between red traces in Fig. 3A vs. B).
The higher applied voltage (increased from 6 V to 30 V) during the burst induced much greater MP change (Fig. 3A, red vs. green trace). Since the EF was kept constant during all exposures (∼0.2 kV/cm as found from FEA using COMSOL Multiphysics) and the duration of the 1000 and 2000 NSEPs bursts were 200 and 400 µs, respectively, it is safe to conclude that these bursts delivered 50% and 100% energy of the single 200 µs EP. However, the extent of PM depolarization appears to be the same between bursts of NSEPs (Fig. 3B) and ∼ 50% less than after exposure to a single 200 µs EP (purple trace in Fig. 3A vs. traces in Fig. 3B). The detected MP changes after exposure to ∼0.2 kV/cm bursts of NSEPs and a single 200 µs EP were as follows: 6.7 ± 0.04% and −3.4 ± 0.03% (n = 8) after 200 µs EP; 3.7 ± 0.0 4% and −1.4 ± 0.04% (n = 9) after 5 MHz train of 1000 NSEPs of 100 ns duration; 4.1 ± 0.05% and −1.6 ± 0.05% (n = 9) after 5 MHz train of 2000 NSEPs of 100 ns duration. Taken together, these findings validate the modeling results shown in Figure 1.
Thus, the combination of modeling and the comparable amplitudes of PM fluorescence changes between ∼0.2 kV/cm 5 MHz bursts of 1000 or 2000 NSEPs seen experimentally (Fig. 3B) suggests that the extent of neuronal membrane depolarization after different bursts of NSEPs of identical EF and PRF should be the same. This explains the similarity between the neuronal Ca2+ rise amplitude and kinetics in neurons after 5 MHz 1000–10000 bursts of ∼0.2 kV/cm NSEPs in our previous experiments.7,8 It is highly likely that VGCC played the main role in these responses, because the same level of membrane depolarization would open the same quantity of VGCCs. However, the VGCCs close during prolonged depolarization induced by a longer burst of NSEPs through inactivation. There are several different mechanisms of VGCC inactivation, one of which is Ca2+-dependent inactivation. This specific mechanism prevents neurons from overloading with toxic levels of Ca2+ during sustained depolarization. 16
Intracellular Ca2+ responses after a 5 MHz burst of 1000 NSEPs of 100 ns duration and a single 200 µs EP
Despite the obvious advantage of the optical MP measurement approach reported herein, several questions remain to be elucidated. Previously, we calibrated the FluoVolt™ fluorescence change relative to CHO-K1 cells MP using the whole-cell voltage-clamp technique. We found that in the range from −100 to 80 mV this change is nearly linear. 14 According to factory specifications (FluoVolt™ Membrane Potential Kit), the FluoVolt™ probe could detect changes in cell MP as small as 10 mV with range 25% increase in probe fluorescence per 100 mV. Thus, a 5% increase in FluoVolt™ fluorescence would correspond to ∼20 mV of MP change. It is not clear if FluoVolt™ fluorescence changes after a single ∼0.2 kV/cm 200 µs EP and 5 MHz bursts of 1000 or 2000 NSEPs demonstrate a sufficient level of PM depolarization for inducing cellular Ca2+ response. This question is especially important because cellular PM near the anode electrode hyperpolarized, whereas that near the cathode electrode depolarized (Fig. 2).
Previously, we demonstrated that within 3.5 ms, the single 16.2 kV/cm 600 ns EP initiated Ca2+ influx from the cathodic PM side in NG 108 cells. 17 In addition to the expected whole-cell nanoporation, the depolarization of the PM on the cathodic side might play a dominant role in the overall Ca2+ response. Depolarization-induced activation of VGCC has a cumulative effect on intracellular Ca2+ increases. To verify whether depolarization after low-energy single 200 µs EP and 5 MHz bursts of NSEPs initiates Ca2+ influx, we performed fast Ca2+ imaging experiments (1 s recording at 27 FPS) using CHO-K1 cells and PHNs (Fig. 4). While PHNs abundantly possess VGCCs in the PM, 18 the CHO-K1 cells do not express any VG channels. 19 Ca2+ influx in CHO-K1 cells represents nanoporation, but not depolarization-induced Ca2+ response. Despite the PM charging and depolarization (Figs. 2 and 3) of CHO-K1 shown in this report, the CHO-K1 cells do not demonstrate Ca2+ response (Fig. 4C and D). Neurons are much more sensitive to electrical stimulation than CHO-K1 cells 20 and respond to depolarization via VGCC. Therefore, we observed Ca2+ response immediately after exposure (Fig. 4A and B). However, as shown in Figure 4A and B, the kinetics of Ca2+ responses differ from PHN groups exposed to 5 MHz bursts of NSEPs when compared to a single 200 µs EP. Further investigation will be required to explain this difference.

Fast Ca2+ imaging after exposure to ∼0.2 kV/cm 5 MHz burst of 1000 NSEPs of 100 ns duration and ∼0.2 kV/cm single 200 µs EP using PHNs
Lastly, to confirm involvement of VGCC in depolarization-induced PHNs Ca2+ response, we applied a ∼0.2 kV/cm 200 µs single EP or 5 MHz bursts of NSEPs in the presence of VGCC pharmaceutical blockers21,22 (Fig. 5). The cocktail of Verapamil (100 µM) and Mibefradil (30 µM) completely blocked Ca2+ responses in all groups of PHNs (Fig. 5B, 5 MHz NSEP burst experiment shown).

Neuronal Ca2+ responses after low-energy 5 MHz burst of 1000 NSEPs of 100 ns duration without
Conclusions
The burst of low-energy NSEPs at MHz PRF stimulates neurons at very low EF magnitude without any PM damage. 6 By using streak microscopy and RC modeling, we demonstrated that a single low-energy EP is more effective in charging the PM than 5 MHz bursts of NSEPs with equivalent energy (Figs. 1 and 3). RC modeling predicted close amplitudes of PM voltage changes between low-energy bursts of 1000 and 2000 NSEPs (Fig. 3B). According to the model, increasing the duty cycle or the applied voltage of the train of NSEPs is required to increase the extent of membrane depolarization. Indeed, increasing the EF from ∼0.2 to 1 kV/cm during 5 MHz bursts of 1000 NSEPs of 100 ns duration resulted in membrane depolarization significantly higher than after 0.2 kV/cm single 200 µs EP (Fig. 3A).
In this study, we also investigated the potential of low-energy bursts of NSEPs and single µs EP to initiate Ca2+ influx via PM depolarization. In addition to CHO-K1 cells, we used PHNs for this set of experiments. The 5 MHz bursts of NSEPs and single 200 µs EP induced significant Ca2+ rises (Fig. 4A and B) in PHNs, but not in CHO-K1 cells (Fig. 4C and D). These responses were successfully blocked by VGCC blockers (Fig. 5B). Thus, the immediate intracellular Ca2+ spike and recovery after bursts of low-energy EPs in neurons is a result of Ca2+ influx through VGCCs during depolarization of the neuronal PM. Since CHO-K1 cells do not express VGCC in the PM, the absence of Ca2+ influx after similar exposures in CHO-K1 cells reinforces this conclusion. The knowledge gained from this study demonstrates the potential to develop novel devices for damage-free modulation of neuromuscular functions using a very low-energy burst of NSEPs. This is a promising stimulation modality for prolonged, repetitive, and reliable induction of biological effects.
Authors’ Contributions
G.P.T.: Conceptualization (supporting), methodology (supporting), investigation, and writing original draft. M.A.K.: Methodology (lead), investigation, and review and editing (equal). R.A.R.: Software and Modeling (lead), review and editing (equal). S.P.O.: Investigation and review and editing (equal). J.N.B.: Methodology (supporting), investigation, review and editing (equal). B.L.I.: Methodology (supporting), investigation, formal analysis, and review and editing (equal). K.D.R.: Investigation. B.M.K.: Conceptualization (lead), supervision, project administration, and review and editing (equal).
Footnotes
Author Disclosure Statement
No competing financial interests exist.
Funding Information
No funding was received for this article.