
Abstract
Introduction:
Reliable case definitions (CDs) for cannabis use disorder (CUD) are essential for epidemiologic surveillance, health services research, and policy evaluation. As reliance on health administrative data increases, variation in diagnostic coding practices and limited validation of CDs may undermine the comparability and accuracy of CUD estimates. This systematic review aimed to identify, describe, and critically appraise how CUD has been operationalized within administrative health data sources, with particular attention to coding strategies and validation practices.
Methods:
Following the Preferred Reporting Items for Systematic Reviews and Meta-Analyses guidelines, we systematically searched PubMed, EMBASE, and related databases for studies using International Classification of Diseases (ICD) codes to define CUD in administrative health data. Two reviewers independently screened studies, extracted data on CD components and validation methods, and assessed methodological quality using the Newcastle–Ottawa Scale.
Results:
A total of 56 studies met the inclusion criteria. Most relied on ICD-9 or ICD-10 diagnostic codes to identify CUD, typically using a one-or-more-code rule, although operational details varied by jurisdiction, coding framework, and observation window. No included study explicitly reported internal or external validation of its CD. Reported prevalence estimates ranged widely, from 0.06% in large administrative cohorts to 76.9% in highly selected clinical populations, reflecting differences in CD construction and study populations.
Conclusions:
CDs for CUD in administrative data vary substantially and lack empirical validation, limiting their reliability for surveillance and comparative research. The development and validation of standardized, transparent CDs are needed to strengthen cannabis epidemiology and to support reproducible research, health-system planning, and policy decision-making.
Keywords
Introduction
Accurate surveillance of cannabis use disorder (CUD) is increasingly important in the postlegalization era, yet the tools used to identify cases vary considerably across health systems. Traditional epidemiologic data—such as national surveys and chart reviews—have advanced understanding of cannabis use patterns and associated harms, but they are resource-intensive, cross-sectional, and vulnerable to recall and reporting biases.1–3 In contrast, health administrative data offer a cost-efficient and population-wide means of monitoring trends in substance use and related disorders. 4 These data are routinely collected across hospitals, emergency departments, and outpatient programs for administrative purposes such as billing, performance monitoring, and service planning. 5 When used for research and surveillance, they provide an opportunity to identify individuals with specific conditions at scale, using diagnostic and procedural codes. 6
In administrative data research, it is important to distinguish between diagnostic codes, case definitions (CDs), and validated CDs. Diagnostic codes (e.g., International Classification of Diseases [ICD] codes) represent administrative translations of clinician-documented diagnoses and therefore carry some degree of face validity. However, the presence of a diagnostic code alone does not constitute a CD. A CD refers to an operational algorithm that specifies how diagnostic codes are combined with criteria such as care setting, frequency of encounters, and observation windows to classify individuals as having a given condition. 7 For example, a CD for CUD might require at least one inpatient ICD-10 F12.x code or alternatively two outpatient F12.x codes within a 12-month period. Different operational choices can substantially affect who is identified as a case.
A validated CD goes a step further by empirically evaluating the performance of a CD against an external or internal reference standard, such as structured diagnostic interviews, chart review, registry linkage, or cross-database comparisons. 8 Validation quantifies measurement properties such as sensitivity, specificity, and positive predictive value, allowing researchers to assess trade-offs between under- and overidentification. Importantly, increasing the number of diagnostic codes required for a CD may improve specificity but reduce sensitivity, whereas more permissive definitions may inflate prevalence through misclassification. 9 Without validation, these trade-offs remain unknown, limiting confidence in epidemiologic estimates derived from administrative data.
Validated CDs have been developed for several psychiatric and neurologic conditions, including depression, anxiety disorders, autism spectrum disorder, and dementia, enabling reliable surveillance and cross-jurisdictional comparisons.6,10,11 By contrast, comparable standards for CUD are lacking. Most studies relying on administrative data continue to use unvalidated or ad hoc combinations of ICD codes to identify CUD, often without justification for coding thresholds or time windows. This lack of standardization introduces substantial uncertainty and undermines comparability across studies.
Measurement challenges are further compounded by variability in clinical documentation and coding practices. Diagnostic assignment may differ by provider type (e.g., psychiatrist vs emergency physician), clinical context (e.g., acute intoxication vs chronic use), and health-system incentives, contributing to both under- and overidentification of CUD.12–14 As a result, administrative data may systematically undercount milder or unrecognized cases while disproportionately capturing individuals with more severe presentations or comorbidities. These sources of misclassification bias can distort prevalence estimates and obscure associations with outcomes of interest. 9
Despite the growing use of administrative data in cannabis research, the field lacks a comprehensive synthesis of how CUD has been operationalized and whether existing CDs have been validated. 15 Without transparent and empirically evaluated definitions, estimates of CUD prevalence, comorbidity, and outcomes remain difficult to interpret, compare, or aggregate across jurisdictions. Establishing a clear understanding of current practices is therefore a necessary step toward improving surveillance, informing health-system planning, and strengthening the evidence base for cannabis policy. 16
The objective of this systematic review was to identify, describe, and critically appraise CDs for CUD used in health administrative data. Specifically, we examined the diagnostic coding systems used, the operational criteria used to construct CDs, and whether internal or external validation methods were reported.
Methods
Study design
This systematic review was conducted in accordance with the Preferred Reporting Items for Systematic Reviews and Meta-Analyses guidelines (PRISMA; see checklist in Appendix Table A2). 17 The objective was to identify and evaluate CDs for CUD used in health administrative data. The review protocol was prospectively registered with the International Prospective Register of Systematic Reviews (CRD42023485042).
Eligibility criteria
Studies were eligible for inclusion if they met the following criteria:
Population: Individuals identified as having CUD or an equivalent diagnostic construct using health administrative data. Equivalent constructs included legacy diagnostic categories such as cannabis abuse or cannabis dependence (e.g., ICD-9 codes 305.2 or 304.3), which map onto the Diagnostic and Statistical Manual of Mental Disorders (DSM)-5 diagnosis of CUD. Design: Observational or epidemiologic studies utilizing health administrative databases, including hospital discharge abstracts, insurance claims, electronic health records, or national registries. CD criteria: Studies that described or applied diagnostic criteria for CUD using ICD codes or equivalent administrative classification systems. Studies were included regardless of whether the CD was validated. Because health administrative databases primarily rely on ICD coding systems for billing and surveillance, studies that identified CUD exclusively using DSM-based diagnostic criteria without an explicit ICD crosswalk were excluded. This exclusion was applied to ensure methodological consistency and relevance to administrative-data research, acknowledging that some DSM-based studies may have evaluated diagnostic validity outside the scope of this review. Language: English. Time frame: No publication date restrictions were applied; all records were considered from database inception to the date of the final search.
Data sources and search strategy
A comprehensive literature search was conducted on November 3, 2023, across PubMed, MEDLINE, EMBASE, PsycINFO, CINAHL, Web of Science, Scopus, and Google Scholar. Search terms combined keywords and medical subject headings related to CUD, CDs, administrative health data, and ICD coding systems. Reference lists of included studies were manually screened to identify additional relevant publications. Only peer-reviewed studies published in English were included. The search was updated on October 16, 2025, to capture newly indexed records; no additional eligible studies were identified (Appendix Table A1).
Study selection
All retrieved records were imported into Covidence (Veritas Health Innovation, Melbourne, Australia) for deduplication and screening. 18 Two reviewers independently screened titles and abstracts, followed by a full-text review of potentially eligible studies. Discrepancies were resolved through discussion and consensus. Inter-rater agreement was moderate at both screening stages (κ ≈ 0.45), reflecting the heterogeneity of study designs and reporting practices.
Data extraction
A standardized data extraction form was developed and implemented in Covidence. Extracted variables included the following:
Study characteristics: Authors, publication year, country, study design, and data source. Population details: Sample size, demographic characteristics, and clinical or administrative setting. CD components: ICD codes or other administrative classification systems used, inclusion and exclusion criteria, number of diagnostic codes required, and specified observation or look-back periods. Validation methods: Internal validation approaches (e.g., chart review, cross-database comparison) or external validation approaches (e.g., linkage to registries or structured diagnostic assessments), if reported. Outcomes: Reported prevalence estimates, diagnostic performance metrics (e.g., sensitivity or specificity, where available), and methodological limitations noted by the study authors.
Quality assessment
Methodological quality of included studies was assessed using the Newcastle–Ottawa Scale (NOS) for nonrandomized studies.19–21 The NOS evaluates three domains: (1) selection of study groups, including representativeness and exposure ascertainment; (2) comparability of cohorts based on control of key confounders (e.g., age, sex, socioeconomic status); and (3) outcome assessment and adequacy of follow-up. Each study could receive up to nine stars, with higher scores indicating lower risk of bias. Two reviewers independently conducted quality assessments, with discrepancies resolved by consensus. The NOS was selected to evaluate the overall study design and internal validity; however, it does not assess the validity or performance of administrative-data CDs themselves. As such, NOS scores were interpreted separately from assessments of CD construction and validation.
Data synthesis
Given the substantial heterogeneity in study populations, designs, and CD structures, a narrative synthesis approach was used. Findings were summarized according to the following:
Coding system (e.g., ICD-9 vs. ICD-10). Operational criteria (e.g., number and combination of diagnostic codes, care settings, and observation windows). Validation approach (internal validation, external validation, or none reported).
Where available, reported prevalence estimates and diagnostic performance metrics were summarized descriptively.
Use of artificial intelligence tools
Artificial intelligence (AI)-assisted software was used solely to support the administrative aspects of the review process. Covidence’s machine learning (ML) prioritization feature was used to assist with abstract screening. ChatGPT (OpenAI, San Francisco, USA) was used for grammar and clarity review during article preparation; no text generation, data extraction, or analytic decisions relied on AI tools. All methodological and interpretive decisions were made by the authors.
Results
Study selection
The database search identified 518 unique records. After title and abstract screening, 233 records were excluded as irrelevant. Following full-text review, 194 additional studies were excluded, resulting in 56 studies meeting the inclusion criteria (Fig. 1).
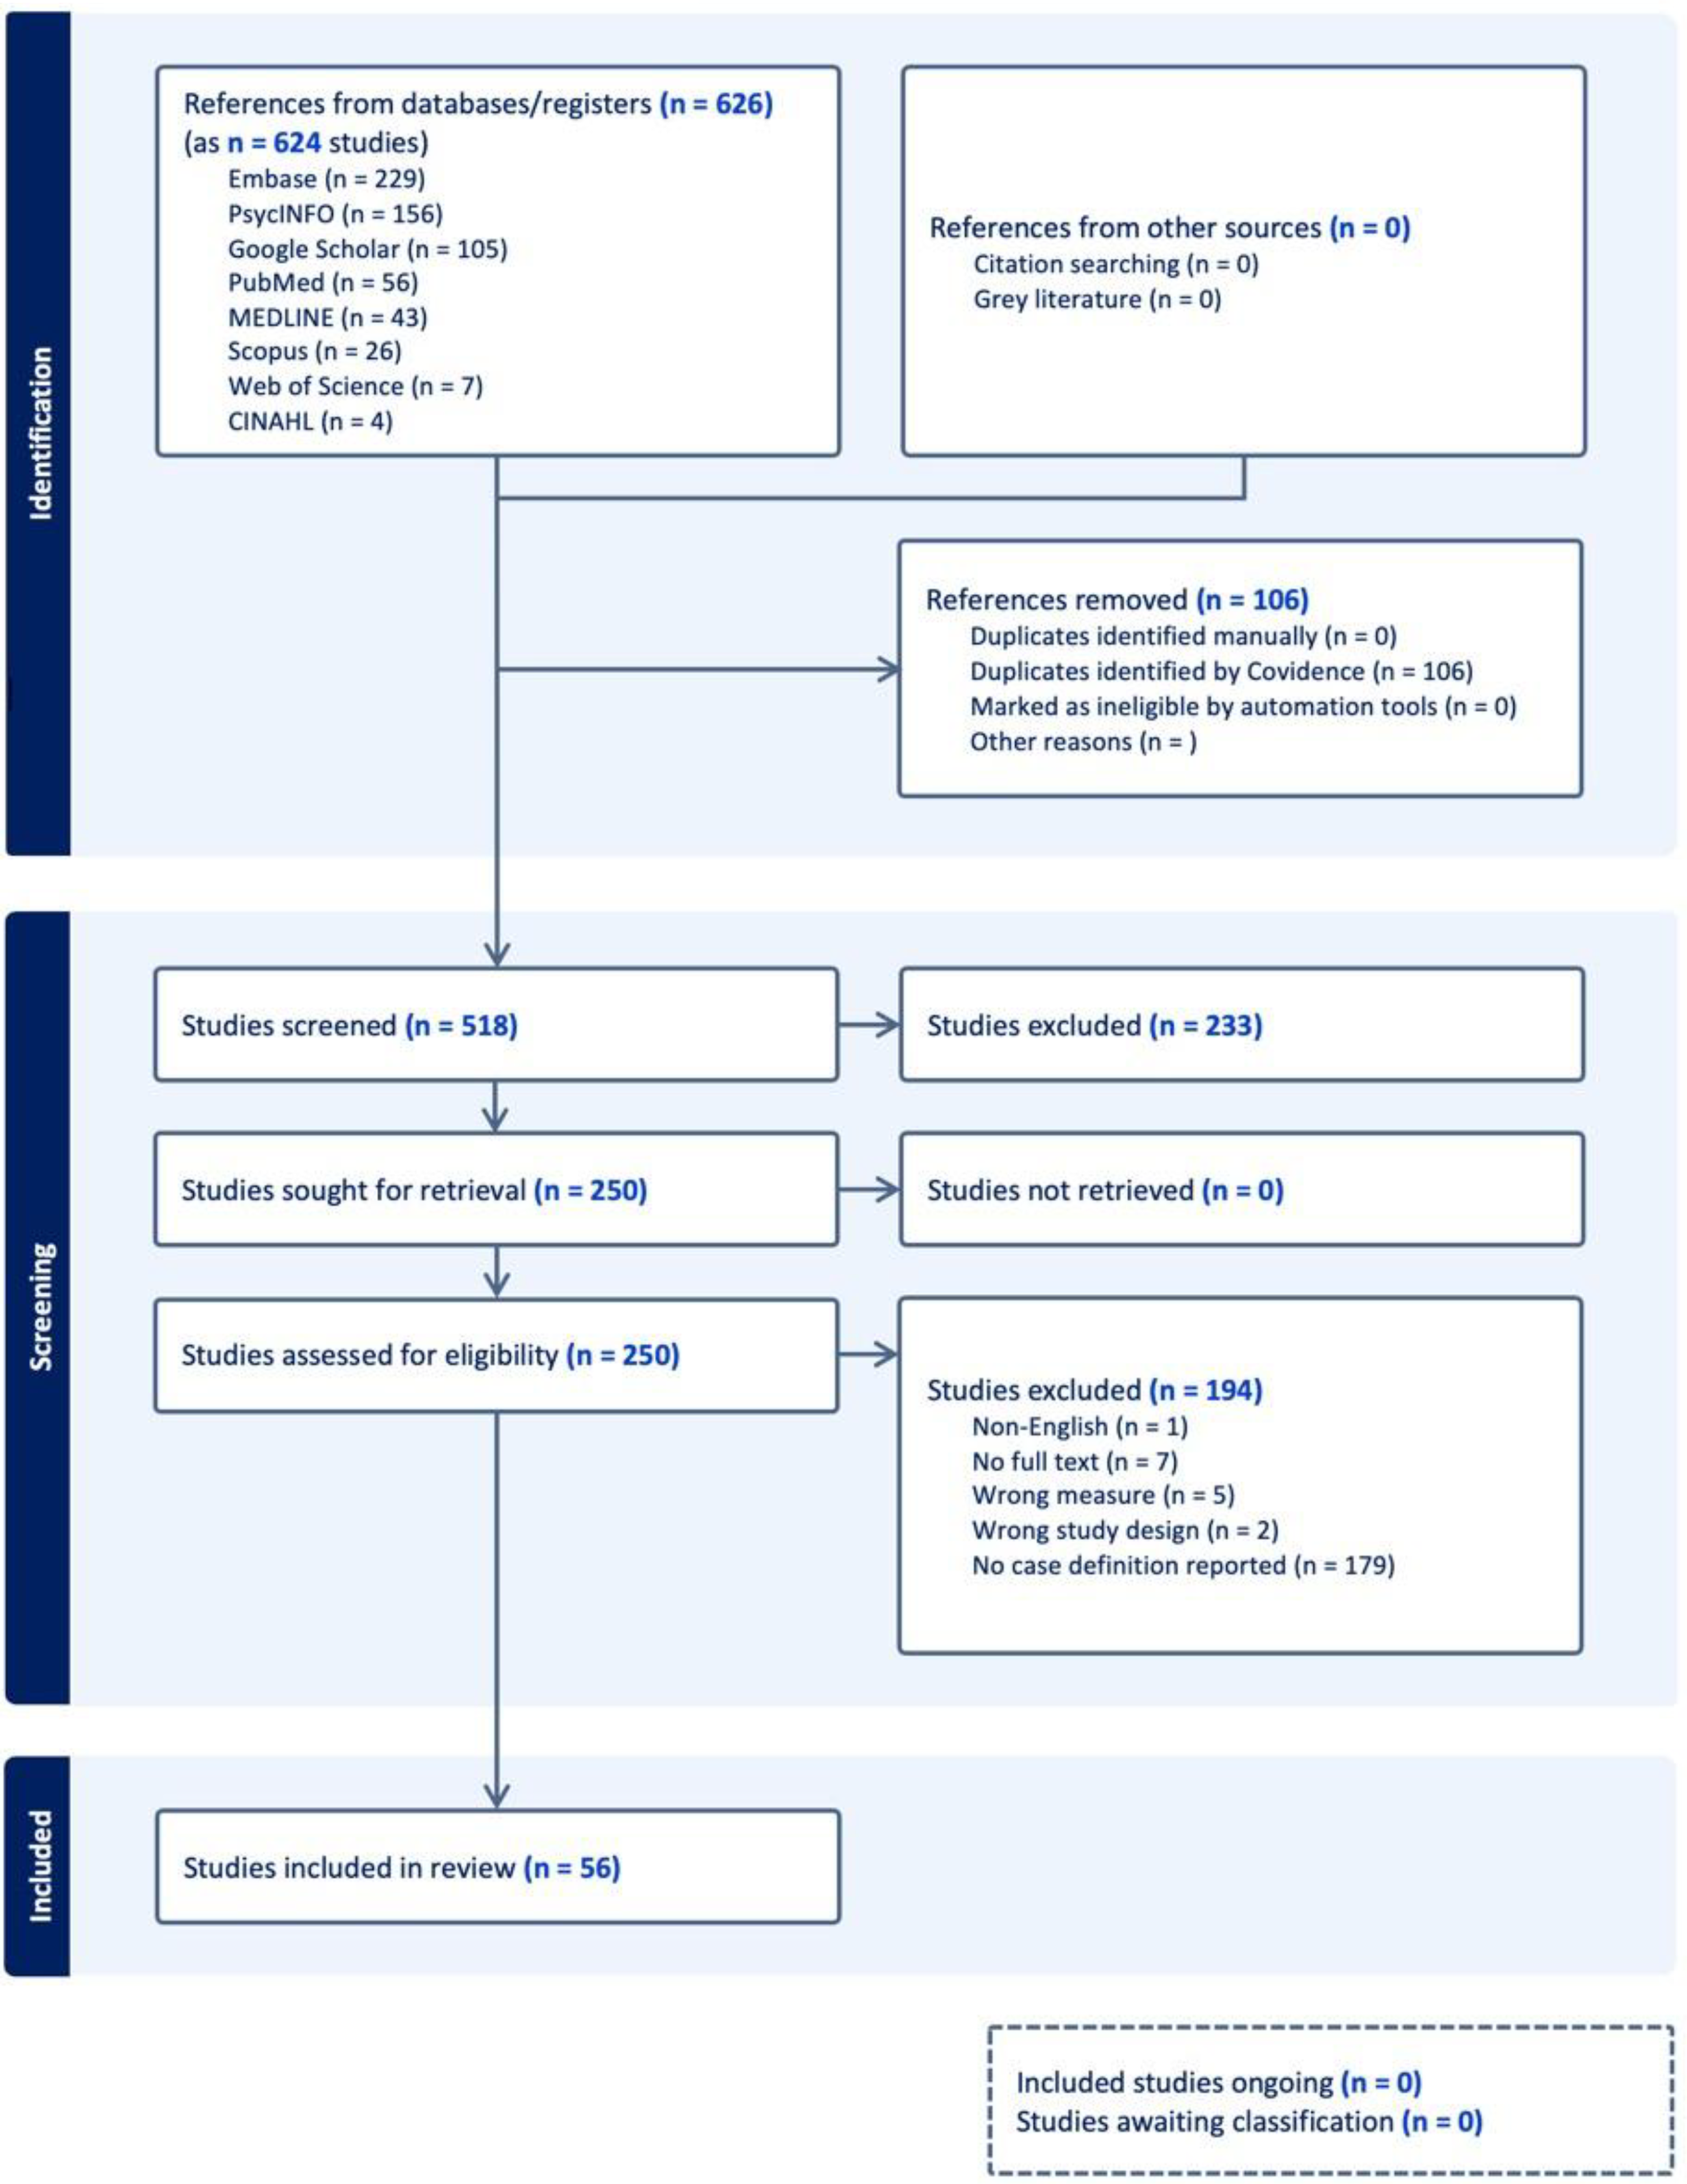
Preferred Reporting Items for Systematic Reviews and Meta-Analyses (PRISMA) flow diagram.
Study Characteristics

Denotes that case definitions were based on the presence of ≥1 qualifying ICD code unless otherwise specified.
SUD, substance use disorder; case definition, unless otherwise stated, was any one of these codes.
Study characteristics
Study characteristics are summarized in Table 1. The included studies spanned multiple countries, predominantly the United States (n = 47, 84%), followed by Canada (n = 4), Italy (n = 3), and one joint study from Finland and Sweden. Most studies used retrospective cohort designs using health administrative data sources, including billing claims, hospital discharge abstracts, or electronic health records (EHRs).
Study populations were heterogeneous, ranging from narrowly defined clinical samples (e.g., veterans, pregnant women, or individuals with chronic medical conditions such as diabetes or hypertension) to large population-based datasets encompassing millions of individuals. Sample sizes ranged from fewer than 1,000 participants in smaller cohort or case–control studies to more than 5 million in national or system-wide analyses.
Participant demographics varied across cohorts. Mean ages generally fell between the mid-30s and early 50s, although some studies focused on older adults (≥65 years) or young adults (18–29 years). Across most studies, male participants predominated, often exceeding 50% and reaching over 90% in veteran-based cohorts.
Study periods ranged from the early 2000s through 2019. Data sources included inpatient and outpatient hospital settings, primary care, emergency departments, and community health systems. Several studies linked administrative records to registry, laboratory, or genomic data to enhance analytic scope.
CDs and diagnostic codes
All included studies defined CUD using ICD-9 or ICD-10 diagnostic codes. The most commonly used ICD-9 codes were 304.3 (cannabis dependence) and 305.2 (cannabis abuse), while ICD-10-based definitions primarily relied on the F12 category for cannabis-related disorders (e.g., F12.1 for abuse and F12.2 for dependence). Some studies additionally incorporated T40.7 codes related to cannabis poisoning or adverse effects. No studies used ICD-11 diagnostic codes.
Terminology across studies reflected legacy diagnostic frameworks, with cannabis abuse and cannabis dependence frequently used as distinct categories corresponding to severity levels now unified under the DSM-5 diagnosis of CUD. Inclusion of both categories was therefore necessary to capture the full spectrum of clinically documented cannabis-related disorders in administrative data.
Most studies used a permissive “one-or-more-code” rule, identifying CUD if any qualifying diagnostic code was recorded within a specified observation window. Fewer studies required multiple diagnostic codes or applied additional confirmatory criteria, such as repeated positive urine drug screens, EHR text mentions of cannabis use, or exclusion of remission codes. Some studies supplemented ICD coding with Current Procedural Terminology codes or SNOMED-CT mappings, while others incorporated text-mining approaches to identify cannabis-related terms within clinical notes.
A gradual transition from ICD-9 to ICD-10 coding was observed over time, with ICD-10 offering greater granularity through expanded subcodes (e.g., uncomplicated vs. psychotic-related cannabis disorders). Despite these differences, no study reported the use of ICD-11 codes, which may reflect the relatively recent adoption of ICD-11 and its limited implementation in administrative health databases during the study periods examined.
Validation of CDs
None of the 56 included studies explicitly reported internal or external validation of their CDs. All relied on administrative diagnostic coding alone to identify CUD, without verification against clinical records, structured diagnostic assessments, or linked registry data. The absence of reported validation limits assessment of both specificity and sensitivity and constrains confidence in epidemiological estimates derived from these definitions.
Quality assessment
Using the NOS, the overall methodological quality of included studies was high. In the selection domain, all studies received full scores for representativeness and exposure ascertainment. In the comparability domain, 50 studies adjusted for major confounders such as age, sex, and socioeconomic status, while 6 did not. In the outcome domain, 52 studies relied on validated administrative data sources or independent outcome assessments, whereas 4 relied on self-reported measures or had limited follow-up.
Most studies achieved scores of 8–9 out of 9, indicating strong internal validity and sound cohort design. However, high NOS scores primarily reflected study design and data source quality rather than the rigor of CD construction. Consequently, even methodologically strong studies frequently relied on unvalidated and inconsistently operationalized definitions of CUD.
Prevalence and epidemiological findings
Reported prevalence estimates of CUD varied widely, ranging from 0.06% in large administrative cohorts to 76.9% in highly selected cannabis-using clinical populations. This variation corresponded to differences in coding practices, study populations, and data sources.
Across multiple datasets, temporal analyses indicated increasing rates of recorded CUD diagnoses over time, such as a rise from 1.3 to 10.3 per 1,000 admissions in one U.S. cohort, coinciding with broader cannabis availability and heightened diagnostic recognition.
Comorbidity patterns were broadly consistent across studies. Individuals identified with CUD exhibited higher rates of psychiatric disorders (including depression, post-traumatic stress disorder, and bipolar disorder), chronic medical conditions (such as chronic obstructive pulmonary disease, cardiovascular disease, and chronic pain), and other substance use disorders. In specialized clinical populations, including transplant recipients, CUD diagnoses were associated with poorer clinical outcomes and increased psychosocial burden.
Methodological challenges identified
Several methodological challenges were consistently reported across studies:
Coding variability: Diagnostic practices differed across providers, care settings, and health systems, increasing the risk of misclassification. Incomplete capture: Mild or unrecognized cases of CUD were likely underrepresented due to underdiagnosis in administrative data. Coding transitions: Shifts from ICD-9 to ICD-10 introduced discontinuities affecting temporal comparability of prevalence estimates. Limited generalizability: Many studies focused on narrowly defined or institutional populations, limiting applicability to broader cannabis-using groups. Data constraints: Administrative databases generally lacked detailed information on cannabis exposure characteristics (e.g., frequency, potency, route of administration) and contextual factors (medical vs. nonmedical use).
Despite generally strong methodological quality, these findings indicate that CD validity, rather than study design, represents the principal limitation in the existing literature. Without standardized and validated algorithms, results from administrative-data studies of CUD remain difficult to interpret, compare, and synthesize.
Discussion
Summary of findings
This systematic review identified substantial heterogeneity in how CUD has been operationalized within health administrative data. Across 56 studies, diagnostic codes and operational criteria varied considerably, and no study explicitly reported internal or external validation of its CD. Reported prevalence estimates ranged widely, from 0.06% in large administrative cohorts to 76.9% in highly selected cannabis-using clinical populations. This variability likely reflects a combination of methodological heterogeneity in CD construction and meaningful differences in underlying study populations. Collectively, these findings indicate that current approaches to identifying CUD in administrative datasets lack standardization and empirical validation, limiting the reliability and comparability of existing evidence.
Methodological considerations and risk of bias
Most included studies relied on retrospective cohort designs using EHRs or claims data, which are inherently vulnerable to misclassification and under-ascertainment. Variation in clinical documentation practices, provider coding behavior, and health-system incentives likely contributed to both false-positive and false-negative identification of CUD. Although the overall methodological quality, as assessed by the NOS, was high, this primarily reflected study design and data source quality rather than the rigor of CD construction. The absence of validated CDs therefore represents a critical methodological weakness that is largely independent of conventional risk-of-bias assessments.
In addition, observational designs limit causal inference, and generalizability was often constrained by the use of institutionally specific datasets, such as those derived from the U.S. Veterans Health Administration. 22 These limitations underscore the need to distinguish between internal study validity and the validity of the measurement tools used to define CUD in administrative research.
Implications for research
The absence of validated CDs for CUD in administrative data has important implications for epidemiological research, surveillance, and cross-study synthesis. Without validation, it is difficult to determine whether observed differences in prevalence, comorbidity, or outcomes reflect true variation or artifacts of measurement. Developing standardized, empirically validated CDs would improve comparability across studies, enable meaningful meta-analytic synthesis, and support linkage of administrative data with survey-based or clinical datasets.
Future research should prioritize formal validation studies that compare administrative-data CDs against reference standards such as structured diagnostic interviews, clinician-confirmed diagnoses via chart review, or registry-based ascertainment. Validation should explicitly report diagnostic performance metrics, including sensitivity, specificity, and predictive values, to allow transparent evaluation of trade-offs inherent in different operational choices.
Observed demographic and clinical disparities across studies—including higher recorded rates of CUD among men, younger adults, and certain racialized groups—warrant further investigation. Prior work has documented the rising CUD diagnoses among younger Black veterans 23 and women, 24 but the extent to which these patterns reflect true epidemiologic trends versus differential diagnosis, documentation, or access to care remains unclear. Research incorporating more granular measures of cannabis exposure (e.g., frequency, potency, route of administration, and medical vs. nonmedical use) will be essential to contextualize administrative-data findings.
Emerging analytic approaches, including ML, may offer additional tools for refining CDs, although these were not evaluated in the studies included in this review. Interpretable ML models, such as decision trees or rule-based classifiers, may help identify systematic patterns in coding behavior across providers and settings, potentially improving consistency and reproducibility. However, such approaches should complement—rather than replace—transparent, rule-based definitions and should themselves be subject to rigorous validation. 16
Implications for practice and policy
Reliable surveillance of CUD depends on the use of standardized and validated CDs. In the absence of such definitions, administrative data may under- or overestimate disease burden, potentially distorting resource allocation, program evaluation, and policy decisions. Harmonized CD algorithms applied consistently across jurisdictions would improve the accuracy of monitoring trends in CUD prevalence, treatment engagement, comorbidity patterns, and health outcomes.
From a clinical and health-system perspective, integrating consistent approaches to identifying CUD within administrative datasets may also facilitate earlier recognition and intervention, particularly when aligned with screening and referral pathways in primary care and specialty settings. Attention to social determinants of health—including socioeconomic status, structural inequities, and access to care—is essential, as these factors influence both diagnosis and outcomes and may contribute to observed disparities in administrative-data studies.
Limitations of the review
Several limitations should be considered when interpreting these findings. The included studies were heterogeneous in population, setting, and design, and most relied on retrospective administrative data subject to incomplete capture and misclassification. The exclusion of studies relying solely on DSM-based diagnoses without ICD crosswalks may have omitted validation studies conducted outside administrative-data contexts, although this decision was necessary to maintain methodological relevance. Publication bias may also have favored studies reporting higher prevalence estimates or stronger associations.
Future directions
Future work should focus on the development, validation, and dissemination of standardized CD algorithms for CUD in administrative data. Prospective studies integrating administrative records with clinical assessments and self-reported data would enable robust calibration of these algorithms. As ICD-11 becomes more widely implemented, opportunities may arise to align administrative definitions more closely with contemporary diagnostic frameworks. Establishing consensus CDs—analogous to those developed for depression and other psychiatric conditions—would provide a foundation for reproducible epidemiology, health services research, and surveillance in cannabis science.
Conclusion
This systematic review demonstrates that, despite the growing use of health administrative data to study CUD, the absence of standardized and validated CDs substantially undermines the reliability of the current evidence base. Reported prevalence estimates varied by orders of magnitude, reflecting differences in CD construction and study populations rather than clear epidemiological patterns. Advancing the field will require transparent, validated, and interoperable definitions of CUD that can be applied consistently across health systems. Accurate case identification is essential to quantify disease burden, evaluate interventions, and inform evidence-based public health and policy responses to CUD.
Footnotes
Author Disclosure Statement
A.B. is supported by the Canadian Institutes of Health Research (CIHR) and Alberta Innovates through doctoral awards. S.P. holds the Cuthbertson & Fischer Chair in Pediatric Mental Health at the University of Calgary. G.M. and M.I.A. declare no competing interests.
Funding Information
The authors confirm that this work did not receive any specific funding.
Abbreviations Used
Appendix
Preferred Reporting Items for Systematic Reviews and Meta-Analyses Checklist

| Section and topic | Item # | Checklist item | Location where item is reported |
|---|---|---|---|
| TITLE | |||
| Title | 1 | Identify the report as a systematic review. | 1 |
| ABSTRACT | |||
| Abstract | 2 | See the PRISMA 2020 for Abstract checklist. | |
| INTRODUCTION | |||
| Rationale | 3 | Describe the rationale for the review in the context of existing knowledge. | |
| Objectives | 4 | Provide an explicit statement of the objective(s) or question(s) the review addresses. | |
| METHODS | |||
| Eligibility criteria | 5 | Specify the inclusion and exclusion criteria for the review and how studies were grouped for the syntheses. | |
| Information sources | 6 | Specify all databases, registers, websites, organizations, reference lists, and other sources searched or consulted to identify studies. Specify the date when each source was last searched or consulted. | |
| Search strategy | 7 | Present the full search strategies for all databases, registers, and websites, including any filters and limits used. | |
| Selection process | 8 | Specify the methods used to decide whether a study met the inclusion criteria of the review, including how many reviewers screened each record and each report retrieved, whether they worked independently, and if applicable, details of automation tools used in the process. | |
| Data collection process | 9 | Specify the methods used to collect data from reports, including how many reviewers collected data from each report, whether they worked independently, any processes for obtaining or confirming data from study investigators, and if applicable, details of automation tools used in the process. | |
| Data items | 10a | List and define all outcomes for which data were sought. Specify whether all results that were compatible with each outcome domain in each study were sought (e.g., for all measures, time points, analyses), and if not, the methods used to decide which results to collect. | |
| 10b | List and define all other variables for which data were sought (e.g., participant and intervention characteristics, funding sources). Describe any assumptions made about any missing or unclear information. | ||
| Study risk-of-bias assessment | 11 | Specify the methods used to assess risk of bias in the included studies, including details of the tool(s) used, how many reviewers assessed each study, and whether they worked independently, and if applicable, details of automation tools used in the process. | |
| Effect measures | 12 | Specify for each outcome the effect measure(s) (e.g., risk ratio, mean difference) used in the synthesis or presentation of results. | |
| Synthesis methods | 13a | Describe the processes used to decide which studies were eligible for each synthesis (e.g., tabulating the study intervention characteristics and comparing against the planned groups for each synthesis (item #5)). | |
| 13b | Describe any methods required to prepare the data for presentation or synthesis, such as handling of missing summary statistics, or data conversions. | ||
| 13c | Describe any methods used to tabulate or visually display results of individual studies and syntheses. | ||
| 13d | Describe any methods used to synthesize results and provide a rationale for the choice(s). If meta-analysis was performed, describe the model(s), method(s) to identify the presence and extent of statistical heterogeneity, and software package(s) used. | ||
| 13e | Describe any methods used to explore possible causes of heterogeneity among study results (e.g., subgroup analysis, meta-regression). | ||
| 13f | Describe any sensitivity analyses conducted to assess robustness of the synthesized results. | ||
| Reporting bias assessment | 14 | Describe any methods used to assess risk of bias due to missing results in a synthesis (arising from reporting biases). | |
| Certainty assessment | 15 | Describe any methods used to assess certainty (or confidence) in the body of evidence for an outcome. | |
| RESULTS | |||
| Study selection | 16a | Describe the results of the search and selection process, from the number of records identified in the search to the number of studies included in the review, ideally using a flow diagram. | |
| 16b | Cite studies that might appear to meet the inclusion criteria, but which were excluded, and explain why they were excluded. | ||
| Study characteristics | 17 | Cite each included study and present its characteristics. | |
| Risk of bias in studies | 18 | Present assessments of risk of bias for each included study. | |
| Results of individual studies | 19 | For all outcomes, present, for each study: (a) summary statistics for each group (where appropriate) and (b) an effect estimate and its precision (e.g., confidence/credible interval), ideally using structured tables or plots. | |
| Results of syntheses | 20a | For each synthesis, briefly summarize the characteristics and risk of bias among contributing studies. | |
| 20b | Present results of all statistical syntheses conducted. If meta-analysis was done, present for each the summary estimate and its precision (e.g., confidence/credible interval) and measures of statistical heterogeneity. If comparing groups, describe the direction of the effect. | ||
| 20c | Present results of all investigations of possible causes of heterogeneity among study results. | ||
| 20d | Present results of all sensitivity analyses conducted to assess the robustness of the synthesized results. | ||
| Reporting biases | 21 | Present assessments of risk of bias due to missing results (arising from reporting biases) for each synthesis assessed. | |
| Certainty of evidence | 22 | Present assessments of certainty (or confidence) in the body of evidence for each outcome assessed. | |
| DISCUSSION | |||
| Discussion | 23a | Provide a general interpretation of the results in the context of other evidence. | |
| 23b | Discuss any limitations of the evidence included in the review. | ||
| 23c | Discuss any limitations of the review processes used. | ||
| 23d | Discuss implications of the results for practice, policy, and future research. | ||
| OTHER INFORMATION | |||
| Registration and protocol | 24a | Provide registration information for the review, including register name and registration number, or state that the review was not registered. | |
| 24b | Indicate where the review protocol can be accessed, or state that a protocol was not prepared. | ||
| 24c | Describe and explain any amendments to information provided at registration or in the protocol. | ||
| Support | 25 | Describe sources of financial or nonfinancial support for the review, and the role of the funders or sponsors in the review. | |
| Competing interests | 26 | Declare any competing interests of review authors. | |
| Availability of data, code, and other materials | 27 | Report which of the following are publicly available and where they can be found: template data collection forms; data extracted from included studies; data used for all analyses; analytic code; any other materials used in the review. | |
From: Page et al. 2021. 17
PRISMA, Preferred Reporting Items for Systematic Reviews and Meta-Analyses.