
Abstract
Background
The objective of this study was to identify independent prognostic factors in neuroblastoma patients and to estimate their postoperative survival (POS) at 3-, 5-, and 10-year intervals.
Methods
Data of patients with neuroblastoma who underwent surgical treatment were extracted from the Surveillance, Epidemiology, and End Results (SEER) database. These cases were randomly split into a training cohort and a validation cohort. Multivariate Cox proportional hazards regression was performed to determine significant prognostic indicators. A predictive nomogram for 3-, 5-, and 10-year POS was constructed using R software. The model’s predictive accuracy was assessed through the concordance index (C-index), receiver operating characteristic (ROC) curves with corresponding area under the curve (AUC) values, calibration plots, and decision curve analysis (DCA).
Results
A total of 1,094 postoperative neuroblastoma patients were included, with 765 assigned to the training cohort (70%) and 329 to the validation cohort (30%). The multivariate analysis revealed that age at diagnosis, race, tumor dimension, primary tumor site, radiotherapy, and chemotherapy were all significant independent prognostic variables. Based on these, a nomogram was generated. The C-index values for POS prediction were 0.748 in the training cohort and 0.705 in the validation cohort. The AUC and calibration curves indicated favorable predictive performance, while the DCA confirmed that the model offered a net clinical benefit.
Conclusions
We developed and validated an effective nomogram for predicting POS in patients with neuroblastoma, which could be used as a reference for clinical decisions.
Background
Neuroblastoma is a malignant embryonic tumor derived from neural crest cells of the sympathetic nervous system. It may arise in any part of this system, though it most frequently originates in the adrenal medulla.1, 2 Data from the National Cancer Institute’s Surveillance, Epidemiology, and End Results (SEER) program and the North American Association of Central Cancer Registries (NAACCR) show that in 2014, more than 700 new cases were reported among children younger than 15 years. This tumor ranks as the third most prevalent pediatric cancer and is the leading malignancy diagnosed during the first year of life, representing about 7% of all childhood cancers and accounting for roughly 15% of cancer-related deaths in children.2, 3
The clinical manifestations of neuroblastoma are closely related to the location of the tumor.1, 4 For example, it may be asymptomatic when it is located in the retroperitoneal cavity; it may compress the bladder and rectum when it is located in the pelvis, causing urinary retention and constipation; and it may cause Horner syndrome due to damage to the sympathetic nerves when it is located in the neck. Early clinical manifestations of neuroblastoma may be atypical and may only show a deterioration of the body states, such as unexplained fever and weight loss. Later, tumor metastasis will cause pain, ecchymosis, and even neurological dysfunction and paraplegia.
The prognosis of neuroblastoma is related to clinical characteristics and genetic phenotypes. Clinical variables include age at diagnosis and the International Neuroblastoma Risk Group (INRG) Stage System 5 ; genetic factors include histopathological category, level of tumor differentiation, amplification of the MYCN oncogene, the tumor cell DNA index, and DNA-based or RNA-based aberrations.6-11 According to these prognostic factors, neuroblastoma patients can be stratified into very low-, low-, intermediate-, and high-risk groups, with corresponding 5-year survival probabilities of over 85%, 75%-85%, 50%-75%, and below 50%. 1 Ward and colleagues² reported that the overall 5-year survival rate for pediatric neuroblastoma improved from 54% during 1975-1979 to 79% in the period 2003-2009. 2 Compared with conventional prognostic models, nomograms provide more precise predictions of clinical outcomes.12, 13 Nonetheless, to our knowledge, no nomogram has yet been established to estimate postoperative survival (POS) rates in neuroblastoma patients. The present study, therefore, set out to develop a nomogram capable of predicting 3-, 5-, and 10-year POS in this patient population.
Methods
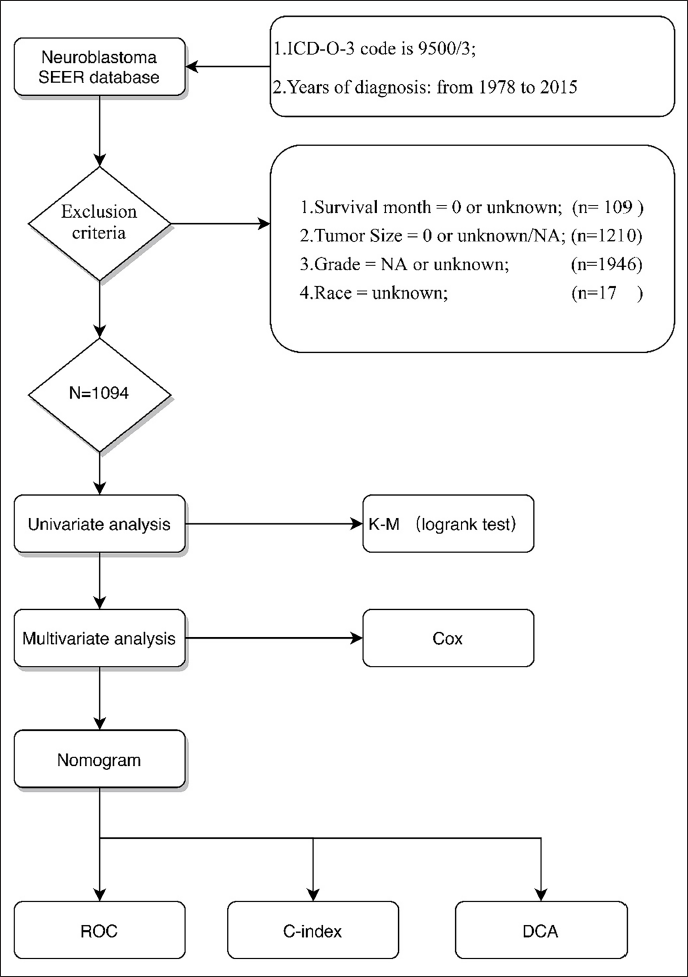
Patient Selection and Data Processing
The SEER database was queried for neuroblastoma cases via SEER*Stat (v8.3.5;
Nomogram Development and Statistical Analyses
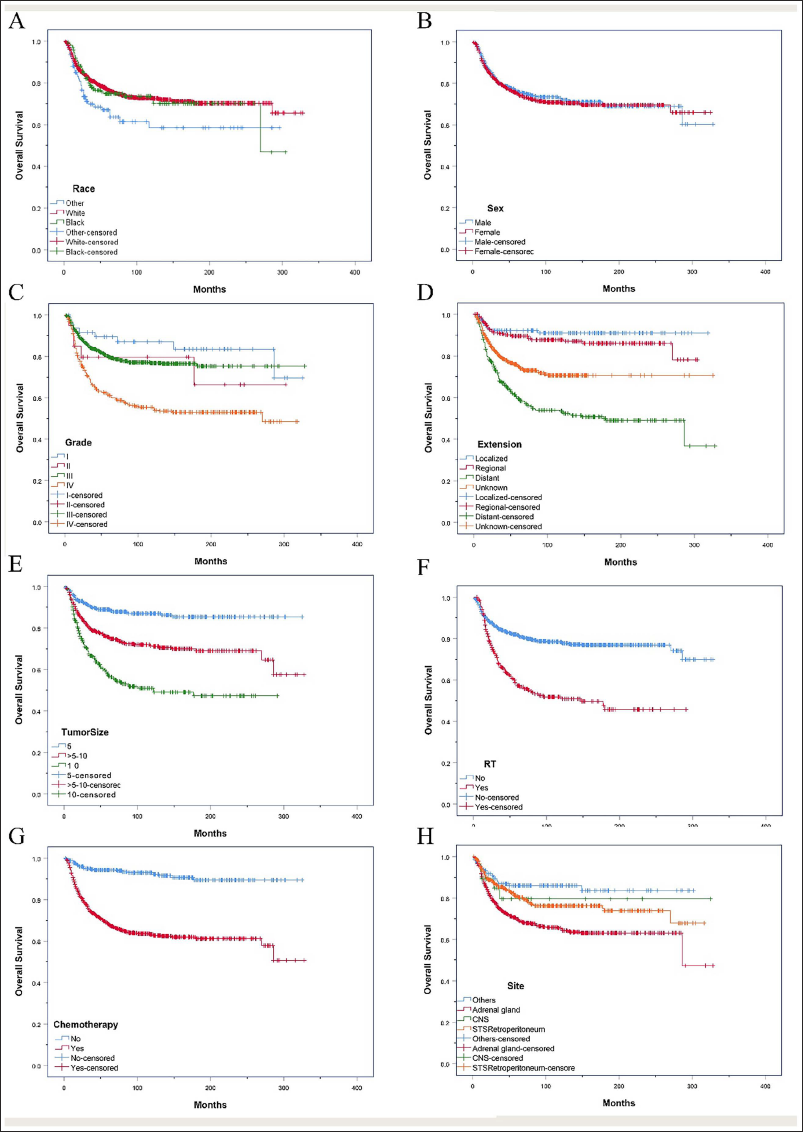
Patients were randomly assigned to a training cohort (n = 765) and a validation cohort (n = 329) in a 7:3 ratio. To assess comparability between the two groups, the survdiff function was employed. Univariate survival analysis using the log-rank test (Figure 2) identified variables with a significant influence on POS at a threshold of P < .05. Subsequently, a multivariate Cox proportional hazards regression was performed within the training cohort to determine independent prognostic factors. Based on these variables, a nomogram was developed to estimate 3-, 5-, and 10-year survival probabilities for patients with neuroblastoma following surgery. In this study, POS was defined as the time from initial surgical intervention to either the last follow-up or death.
Kaplan–Meier (K–M) Curves Analysis of OS in Neuroblastoma Patients. (A) Race, (B) Sex, (C) Grade, (D) Extension, (E) Tumor Size, (F) Radiotherapy Strategy, (G) Chemotherapy, (H) Site.
The nomogram was validated in both the training and validation cohorts. The discriminative performance of the nomogram was evaluated by using the concordance index (C-index) and the area under the receiver operating characteristic (ROC) curve (AUC). 14 A value of C-index greater than 0.7 is considered to be an excellent discriminative performance. 15 A calibration plot was generated to compare the consistency between actual results and predicted outcomes. 16 The performance of discrimination and calibration was assessed using bootstrapping with 500 resamples. In addition, decision curve analysis (DCA) was utilized to evaluate the clinical applicability and net benefit of the prediction model. Statistical analyses were conducted with SPSS software version 25.0 (SPSS Inc., Chicago, IL, USA) and R software version 3.6.2. A P value less than .05 was considered to indicate statistical significance.
Results
NB Patient Characteristics
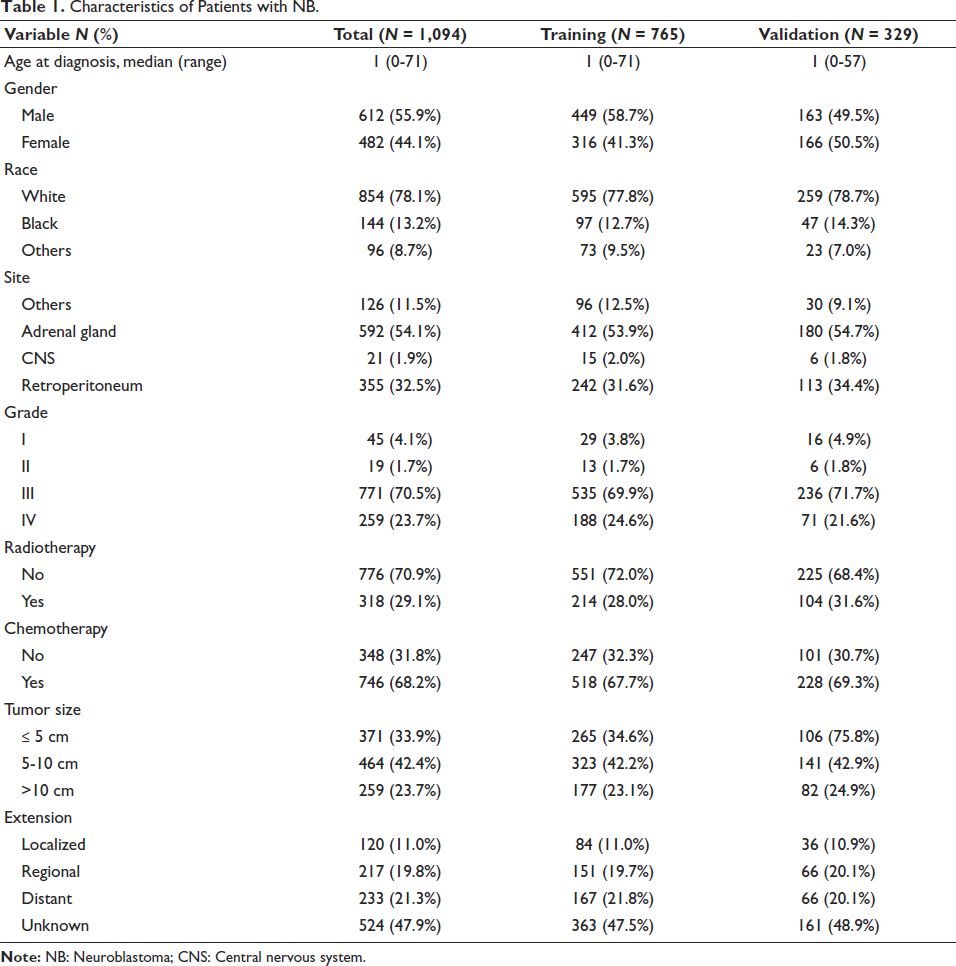
The patients had a median age of 1.0 years and a mean age of 2.59 years, ranging from 0 to 71 years. The average duration of postoperative follow-up was 86.74 months, with a range spanning from 1 to 325 months. In the training and validation cohort, 854 (78.1%) patients were white, 144 (13.2%) patients were black, 96 (8.8%) were of other races and consisted of 482 (44.1%) females and 612 (55.9%) males. The tumor differentiation degree of Grade III comprised 771 (70.5%) patients, and the adrenal gland and retroperitoneum accounted for 54.1% and 32.4%, respectively, of all the tumor growth sites. Surgical intervention was performed in all patients; among them, 318 individuals (29.1%) received radiotherapy, while the majority (n = 746, 68.2%) underwent chemotherapy treatment. Table 1 summarizes the detailed patients’ characteristics for the training and validation groups.
Characteristics of Patients with NB.
Prognostic Factors for POS
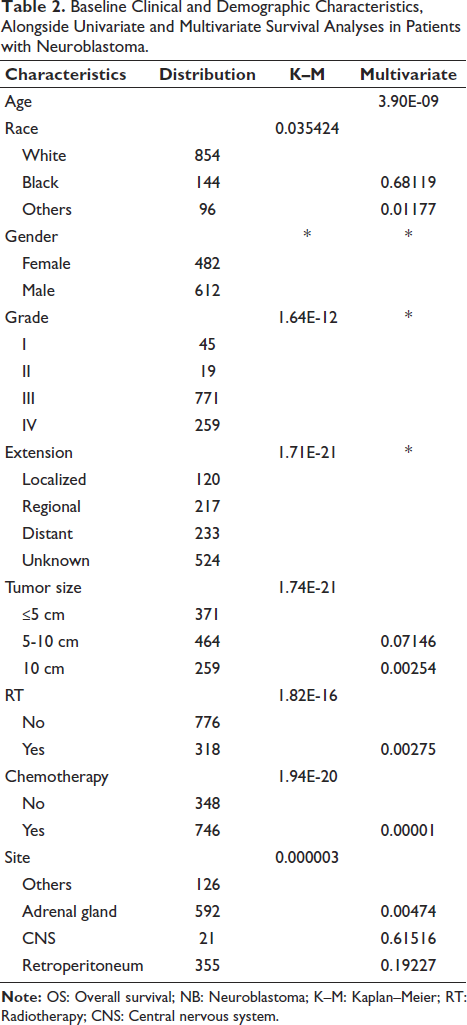
Factors in Table 1 were evaluated in the univariate and multivariate analysis, which identified age at diagnosing (HR 1.061; 95%CI: 1.040-1.082; P < .01), race (others, HR 1.760; 95%CI: 1.641-2.731, P = .012), tumor size (>10 cm, HR 1.979; 95%CI 1.270-3.082; P < .01), receiving radiotherapy (HR 1.623; 95%CI: 1.182-2.228; P < .01), receiving chemotherapy (HR 3.294; 95%CI: 1.938-5.600; P < .01), and tumor growth sites (adrenal gland, HR 2.902; 95%CI: 1.385-6.078; P < .01) as independent prognostic factors of POS in patients with neuroblastoma. The results are presented in Table 2.
Baseline Clinical and Demographic Characteristics, Alongside Univariate and Multivariate Survival Analyses in Patients with Neuroblastoma.
Development and Validation of the Nomogram for POS
A nomogram integrating the independent prognostic variables was constructed to estimate the probabilities of 3-, 5-, and 10-year POS in patients with neuroblastoma (Figure 3). Each variable’s category was assigned a corresponding point value on the vertical scoring scale. The cumulative score, calculated by summing points across all factors, was then utilized to predict individual patients’ POS at 3-, 5-, and 10-years.
Nomogram Predicting 3-, 5- and 10-year Overall Survival of Neuroblastoma Patients After Surgery.

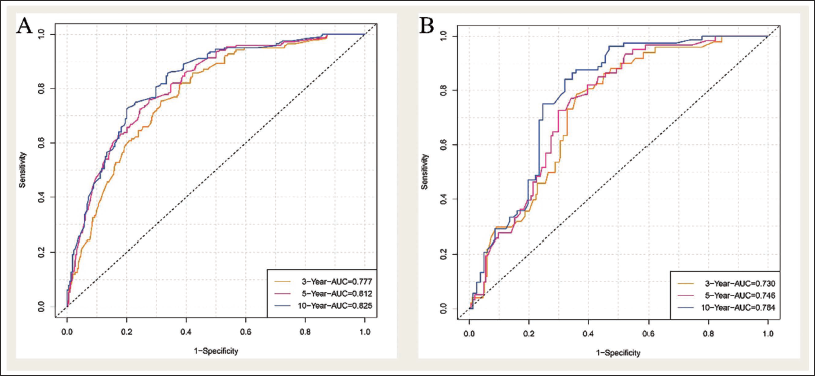
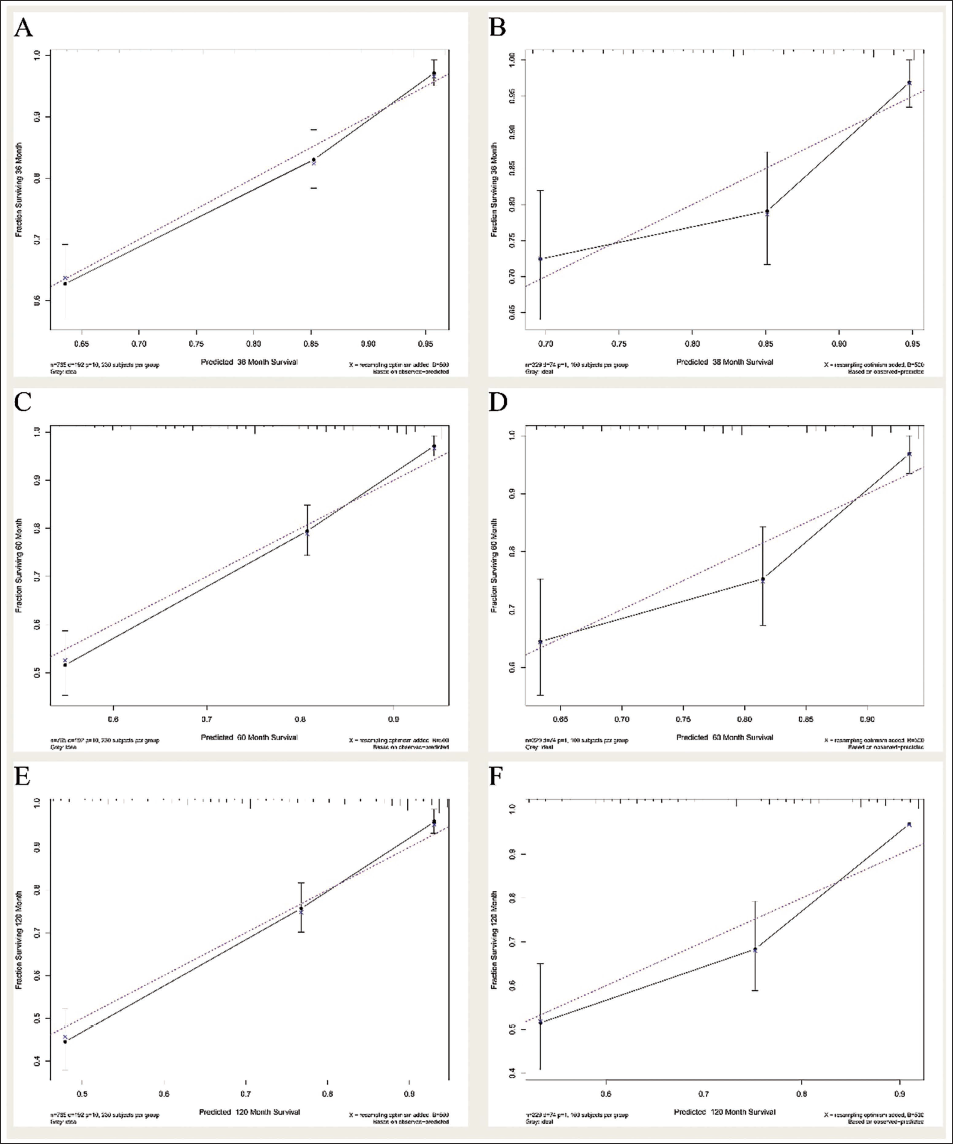
The C-index, reflecting the predictive accuracy of the nomogram for POS, was calculated as 0.748 in the training cohort and 0.705 in the validation cohort. ROC curve analyses further confirmed the model’s robust discriminative capacity, with area under the curve (AUC) values of 0.777, 0.812, and 0.825 for predicting 3-, 5-, and 10-year POS in the training cohort, respectively. Corresponding AUCs for the validation cohort were 0.730, 0.746, and 0.784 at the same time points (Figure 4). Additionally, calibration plots illustrated a high degree of agreement between the nomogram-predicted survival probabilities and the actual observed outcomes in both cohorts, indicating excellent model calibration (Figure 5).
ROC Curves. The Discriminative Performance of the Model Is to Be Evaluated by the Areas Under the ROC Curves (AUC). Train Cohort (A) and Testing Cohort (B) of OS After Surgery.
Decision-curve Analysis
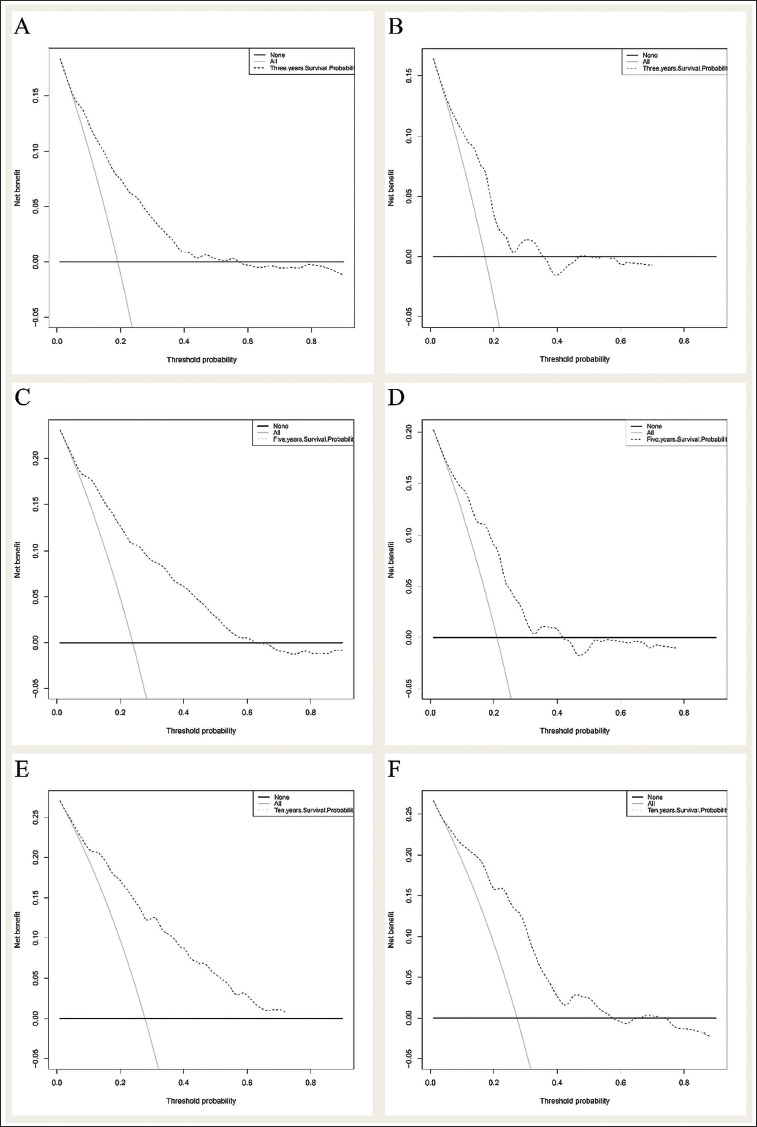
The 3- and 5-year DCA curves showed that the nomogram had clinical usability and produced net benefits in the training and validation groups (Figure 6).
Decision Curve Analysis for the Nomogram in the Prediction of the Prognosis of Neuroblastoma Patients After Surgery. DCA for (A) 3-year OS in the Training Cohort, (C) 5-year OS in the Training Cohort, (E) 10-year OS in the Training Cohort. DCA for (B) 3-year OS in the Testing Cohort, (D) 5-year OS in the Testing Cohort, (F) 10-year OS in the Testing Cohort. DCA Showed the Nomogram’s Clinical Usefulness and Net Benefits, Which Were Depicted by a Backslash with a Negative Slope.
Discussion
Advantages of the Novel Nomogram Compared with Traditional Prediction Models
Neuroblastoma is an embryonal malignancy and represents the most prevalent extracranial solid tumor in infants and young children. Data from the SEER database demonstrate a notable improvement in the 5-year survival rate for pediatric patients, rising from 54% during 1975-1979 to 79% in 2003-2009, a trend largely attributed to advancements in therapeutic approaches and enhanced management, particularly for children with less aggressive disease profiles. 1 Despite considerable advancements in therapeutic strategies and the application of more intensive multimodal regimens, the overall survival benefit observed in patients with high-risk neuroblastoma has remained relatively limited, highlighting the persistent challenges in improving outcomes within this subgroup. 17 The International Neuroblastoma Staging System (INSS) 18 is employed for postoperative clinical staging of neuroblastoma and serves as a critical framework for risk stratification as well as for informing subsequent therapeutic decision-making. However, INSS staging results depend on the surgery method and the surgeon’s professional ability. The INRG Staging System 5 was applied to determine risk stratification in patients with neuroblastoma, assessed at initial diagnosis prior to therapy or at the initiation of definitive treatment. Both traditional staging systems might lack objectivity or the ability to predict POS for postoperative patients. We construct a more objective prediction model for neuroblastoma patients after surgery based on several independent prognostic variables in the present study.
Analysis of OS-related Risk Factors in Patients with NB
The SEER program started in 1973 with eight registration centers, and over time, the number of participating locations continued to grow. Nowadays, there are 18 geographically diverse regions in the database, covering approximately 34.6% of the US population, and work to reflect racial, economic, and social diversity across the country.19, 20 In this study, 1,094 patients with neuroblastoma after surgery were selected in the SEER database from 1973 to 2015. Multivariate COX regression in Table 2 showed that age, race, tumor size, tumor growth site, radiation, and chemotherapy impacted the survival time of neuroblastoma patients after surgery. Previous research 1 has indicated that younger patients tend to present with neuroblastomas exhibiting biological characteristics consistent with a more favorable clinical course, whereas older patients, who demonstrated higher scores on our nomograms, were correlated with an unfavorable prognosis in the present study. As with several studies, we found that white men often have a better prognosis than black men or other races for POS after surgery.21, 22 The multivariate analyses showed that tumor size >10 cm was a risk factor for POS of neuroblastoma patients after surgery. Moreover, patients with tumors in the adrenal glands tend to have clinical conditions of a highly penetrant transmissible mutation, 1 such tumors consistently exhibited higher nomogram scores, which were associated with an adverse clinical outcome. Moreover, findings from our study suggest that exposure to radiotherapy and chemotherapy is associated with inferior survival outcomes in neuroblastoma patients relative to those who were not subjected to these therapeutic modalities for POS. We speculated the reasons for this result as those patients who have undergone radiotherapy and chemotherapy often had a higher-stage tumor, which infiltrates local organs and tissue structures, surrounds the critical nerves and blood vessels, metastasizes to lymph nodes, bone marrow, and liver at the time of diagnosis, and is difficult to remove by surgery alone. Besides, similar to other tumors, chemotherapy is salvaged for patients with relapse after resection.22-24
C-index
To the best of our knowledge, this study is the first to construct and internally validate nomograms for estimating 3-, 5-, and 10-year POS in neuroblastoma patients. The predictive performance of these nomograms was assessed using the C-index and ROC analysis in both the training and validation cohorts. 14 The nomogram demonstrated relatively high predictive accuracy for POS in neuroblastoma patients, with a C-index of 0.748 in the training cohort and 0.705 in the validation cohort. ROC analysis (Figure 4) demonstrated that the nomogram had satisfactory discriminative ability for predicting 3-, 5-, and 10-year POS in both training and validation cohorts. Calibration plots (Figure 5) were further employed to assess the agreement between predicted probabilities and observed outcomes, showing close concordance across all time points. These results indicate that the developed prognostic model exhibits robust discrimination and calibration in both cohorts for 3-, 5-, and 10-year POS.16, 25
Decision Curve Analysis
DCA was applied to evaluate the potential clinical benefit and applicability of the developed prediction models.26-28 As illustrated in Figure 6, the threshold probability and corresponding net benefit are plotted along the horizontal and vertical axes, respectively. DCA showed that this newly established model produced excellent net benefits, meaning that this nomogram could help the clinician design proper therapeutic strategies for neuroblastoma patients after surgery.
Limitation
Some limitations should be considered in this study. The major limitation is that the analysis was based on retrospective data from the SEER Database with inherent biases. Furthermore, several important factors related to prognosis, such as amplification of the MYCN oncogene, ALK, and PHOX2B genetic mutation,29-31 and susceptibility genes including FLJ22536 and BARD1,32, 33 were not available in the SEER Database. Furthermore, since the training and validation cohorts were derived from the same database, external validation using independent datasets is warranted. Finally, this predictive model is intended to serve as a clinical reference rather than a definitive prognostic tool.
Conclusion
Using data from the SEER database, a nomogram was developed and validated to predict 3-, 5-, and 10-year POS in neuroblastoma patients. The model demonstrated strong discriminative ability and yielded substantial clinical net benefits.
Abbreviations
POS: Postoperative survival; SEER: Surveillance, Epidemiology, and End Results; C-index: Concordance index; ROC: Receiver operating characteristic; AUC: Area under the receiver operating characteristic curve; DCA: Decision curve analysis; NAACCR: North American Association of Central Cancer Registries; INRG: International Neuroblastoma Risk Group; ICD-O-3: Third revision of the International Classification of Disease for Oncology; HR: Hazard ratio; CI: Confidence interval.
Authors’ Contributions
(I) Conception and design: X Gao, S Cao; (II) Administrative support: H Huang; (III) Provision of study materials or patients: X Gao; (IV) Collection and assembly of data: X Gao, H Ren; (V) Data analysis and interpretation: X Gao, S Cao, H Huang; (VI) Manuscript writing: All authors; (VII) Final approval of manuscript: All authors.
Availability of Data and Materials
The authors declare that the databases, applications/tools, etc., described in the manuscript are available for testing.
Consent for Publication
A written format of informed consent, including information on the use, disclosure, and publication of patient information on the condition of anonymity, was signed and obtained from all participants in the study.
Footnotes
Declaration of Conflicting Interests
The authors declared no potential conflicts of interest with respect to the research, authorship, and/or publication of this article.
Ethics Approval and Consent to Participate
The study was approved by the Ethics Committee of Beijing Shijitan Hospital of Capital Medical University and followed the Declaration of Helsinki.
Funding
The authors disclosed receipt of the following financial support for the research, authorship, and/or publication of this article: This work was supported by the Beijing Municipal Science and Technology Project (Z211100002921033), the National Natural Science Foundation of China (82273184), and the National Key Research and Development Program of China (2022YFA0912403).