
Abstract
The qualitative bio-geographies of human geographers and the quantitative mappings of biogeographers share a goal: how to understand living with non-human life. Yet they rarely bridge the conceptual and methodological gap between them. This article theorizes how the concept of infrastructure can bridge this ethnographic-cartographic divide. Infrastructure is not just inert shell. It is also a system of relation, a dynamic patterning of socionatural form emerging out of experiences and affective moments of its constituents. As proof of concept, we quantified and compared urban bird species richness and frequency for Tallahassee, Florida over a 17-year period (2000–2017) for two co-occurring observational infrastructures, eBird and a wildlife rehabilitation center that serves the city. Species common to both infrastructures comprised 94% of all eBird observations and 99% of all rehab records. Their differences reflected contrasts in how the motivations for experiencing birds intersected with bird habitat preferences, behavior, and contingencies of urban history and development. eBird observations had a higher species richness (295 spp) and reflected the growing popularity among birds and a small number of active birders for visiting stormwater retention lakes recently modified to improve bird habitat. Rehabilitation records had a lower richness (194 spp) and exhibited a much more even distribution of bird encounters among individual residents as well as community institutions like schools, universities, law enforcement, and other government organizations. Infrastructural perspectives convey how affective and individualistic encounters with the non-human can link to emergent biogeographic mappings and how urban biodiversity is relationally and heterogeneously produced rather than simply contained in cities.
Introduction
The growth of research on urban ecologies has challenged the historical view of cities as biologically impoverished spaces (Barua and Sinha, 2022; Flaminio et al., 2022; Gandy, 2022; Soanes et al., 2019). While cities can have a homogenizing effect on biodiversity, they can harbor significant biodiversity including threatened species (Lepczyk et al., 2023; Soanes and Lentini, 2019; Spotswood et al., 2021). Cities are also settings that provide insights into ecological principles (Forman, 2016; Francis et al., 2012). Niche dynamics, behavioral plasticity, evolution, and scaling relationships shape non-human organisms in cities as they do everywhere else (Pagani-Nunez et al., 2019; Schilthuizen, 2019; Sol et al., 2020; Uchida et al., 2021). While understandings of urban biodiversity were initially informed by studies from natural areas, a reversal is well underway, with the flow of examples and application moving from city outward (Gaston, 2010; McDonnell and Pickett, 1990; Pickett et al., 2001, 2011). Urban biodiversity reflects human cultural identities and well-being (Dallimer et al., 2012; Nilon, 2011). As more humans move to cities, the future of conservation everywhere else will be increasingly filtered through the human experience of urban nature (Dunn et al., 2006; Francis et al., 2012).
Birds are one of the better-studied components of urban biodiversity (Rega-Brodsky et al., 2022). Cities hold more native bird diversity than previously thought (Callaghan et al., 2019). At least 2041 species—75% of all bird families and 20% of all known bird species—live in cities (Aronson et al., 2014). In the contiguous USA, greater bird richness and diversity occurs in developed green areas compared with natural green areas due to an increase in habitat heterogeneity near and in cities (Callaghan et al., 2019). However, urban environments present challenges for studying birds (Campbell et al., 2022). Traditional sampling methods are often inappropriate in urban spaces. Environmental heterogeneity disrupts the assumption of randomness that census methods depend upon, urban noise makes auditory detection difficult, and researchers’ inability to access private land parcels often thwarts transect surveys and mark-recapture methods (Van Heezik and Seddon, 2017).
Citizen science programs have been lauded as a way to track the presence of birds across fragmented and semi-privatized landscapes (Callaghan et al., 2021b; Dickinson et al., 2010; Yaukey, 2010). We draw on two such crowd-sourced applications in this study. The first is eBird, Cornell University’s widely used platform for the collection and systematic aggregation of bird observations (Sullivan et al., 2009). We also examine another less utilized interface for these public-sided data: the intake records of a wildlife rehabilitation center that treats sick, injured, and orphaned animals. Wildlife rehab records provide an inventory of what wildlife occur in and around cities and can generate insights into who does the rescuing as well as where and when (Andrade et al., 2022). Although rescues occur across wildlife taxa, birds are the most rescued group.
These two data sources differ in the kind of human-bird encounter among the public they are built upon: birding is an intentional activity, rescuing injured wildlife is unplanned. Yet even within each data set, considerable variability is present in how birds are encountered and compiled into a count. For example, the routes of daily life and places of work shape what kinds of injured birds humans could encounter and bring to a wildlife rehab center. Some humans are acutely aware of the hazards faced by urban wildlife, others only notice it when an injured animal is immediately in front of them. There are urban bird watchers whose intent is to add to their life list, purposely seeking greenspaces in cities where an observation with a rarer bird has a better chance of happening. By contrast, an observer recording bird species visiting their backyard feeder is tethered to different rhythms and to potentially different species encounters. They may be motivated to alter what birds they see by buying new types of bird seed or planting forage to attract new species. These crowd-sourced data, by virtue of their reaching into the diverse spaces of everyday life, are what make them useful sources for tallying bird species for urban areas.
However, crowd-sourced volunteered data tend to skew toward species that are highly detectable, preferred, or who live in well-traveled spaces (Callaghan et al., 2021a; Stoudt et al., 2022). Among biogeographers, removing these biases through statistical techniques is viewed as necessary to derive objective measures of taxa presence and abundance (Scher and Clark, 2023). The tradeoff is that the output from these useful statistics, as summarized and communicated through maps of species distribution and biodiversity metrics, diminish the visibility of the insights into how and why individuals seek out and observe the non-human in the first place. Human geographers working in multispecies geographies and more-than-human “lively” geographies have shown just how nuanced and complex counting can be. Lorimer (2008) described the ethnographic and ethological details embedded in corncrake censuses by drawing attention to the skills required to count these birds, the emotions that arise in doing so, and the work of standardizing such counting practices. Turnbull et al. (2023) discussed the experiential accounts and knowledge practices of birders during the COVID anthropause. Lockdowns led to a greater engagement with previously backgrounded natures through digital technologies and social networks. Still, maps of species distributions and comparisons of species composition and abundances among different places and times remain valuable for examining societal questions about human impacts on biodiversity (Hamilton et al., 2022; Rosenberg et al., 2019; Whittaker et al., 2023).
These mappings of ecological biogeography and the bio-geographies of human geographers reach toward each other in what they deem to accomplish—how to live with non-human life—but they often cannot bridge the conceptual and methodological gap that separates them. The quantitative approaches and cartographic outputs of biogeographers are not designed to retain the underlying embodied, affective dimensions of counting species. Nor is there any intent among human geographers to extrapolate their participatory observations of human encounters with plants and animals to the species distributions and biodiversity metrics of traditional biogeography. Neither multispecies human geographers nor physical-biogeographers are negligent or culpable. Instead, this discontinuity between the qualitative and the quantitative, or as we refine it here, the ethnographic and the cartographic, is a fundamental challenge of working with complex systems like cities, economies, and institutions. In these collectives, the experiences and behaviors of many interacting agents shape and are shaped by the emergent macroscale properties they give form to (Byrne and Callaghan, 2023). Ellis and Waterton (2005) express this as the linkage between the ethnographic and the cartographic based on their theorization of how professional and amateurs contribute to biodiversity knowledge: The cartographic (if unmediated by the ethnographic) claims a slice of reality without peering into the ways in which this slice can be multiply constructed and laid bare to multiple interpretation. But, if such fragments of meaning, procured through ethnographic methods, are fed into (as well as being in part informed by) the cartographic, they may help to flesh out the constellation of human -natural relationships . . . (678).
In this article, we invoke infrastructure as a conceptual-methodological framework for bridging this discontinuity between the ethnographic and the cartographic (Table 1). We show how infrastructure links the ethnographies (Ingold, 2014) of individual encounters with avifauna embedded in eBird and wildlife rehabilitation to quantitative biogeographic knowledge of urban bird species richness. As a topic of theorization, infrastructure possesses attributes spanning human and physical geography, making it more feasible to link the “fragments of meaning” among individuals to the emergent patterns represented cartographically in maps and other forms of statistical visualization routinely used in biogeography. As tested in Tallahassee, Florida, a medium-sized city in the biodiverse north Florida panhandle, our infrastructural approach is guided by the hypothesis that urban bird species richness is relationally produced rather than contained in cities. As reviewed in the next section, infrastructure can be things in themselves, like the amalgam of digital data and birding hotspots of eBird or the networks of people and organizations linked together in wildlife rehabilitation networks. As a concept and method, infrastructure facilitates critical analysis about space and the fuzzy boundaries of entities and phenomena (Wilson, 2022).
Infrastructure as linkage between the qualitative-quantitative and the ethnographic-cartographic.
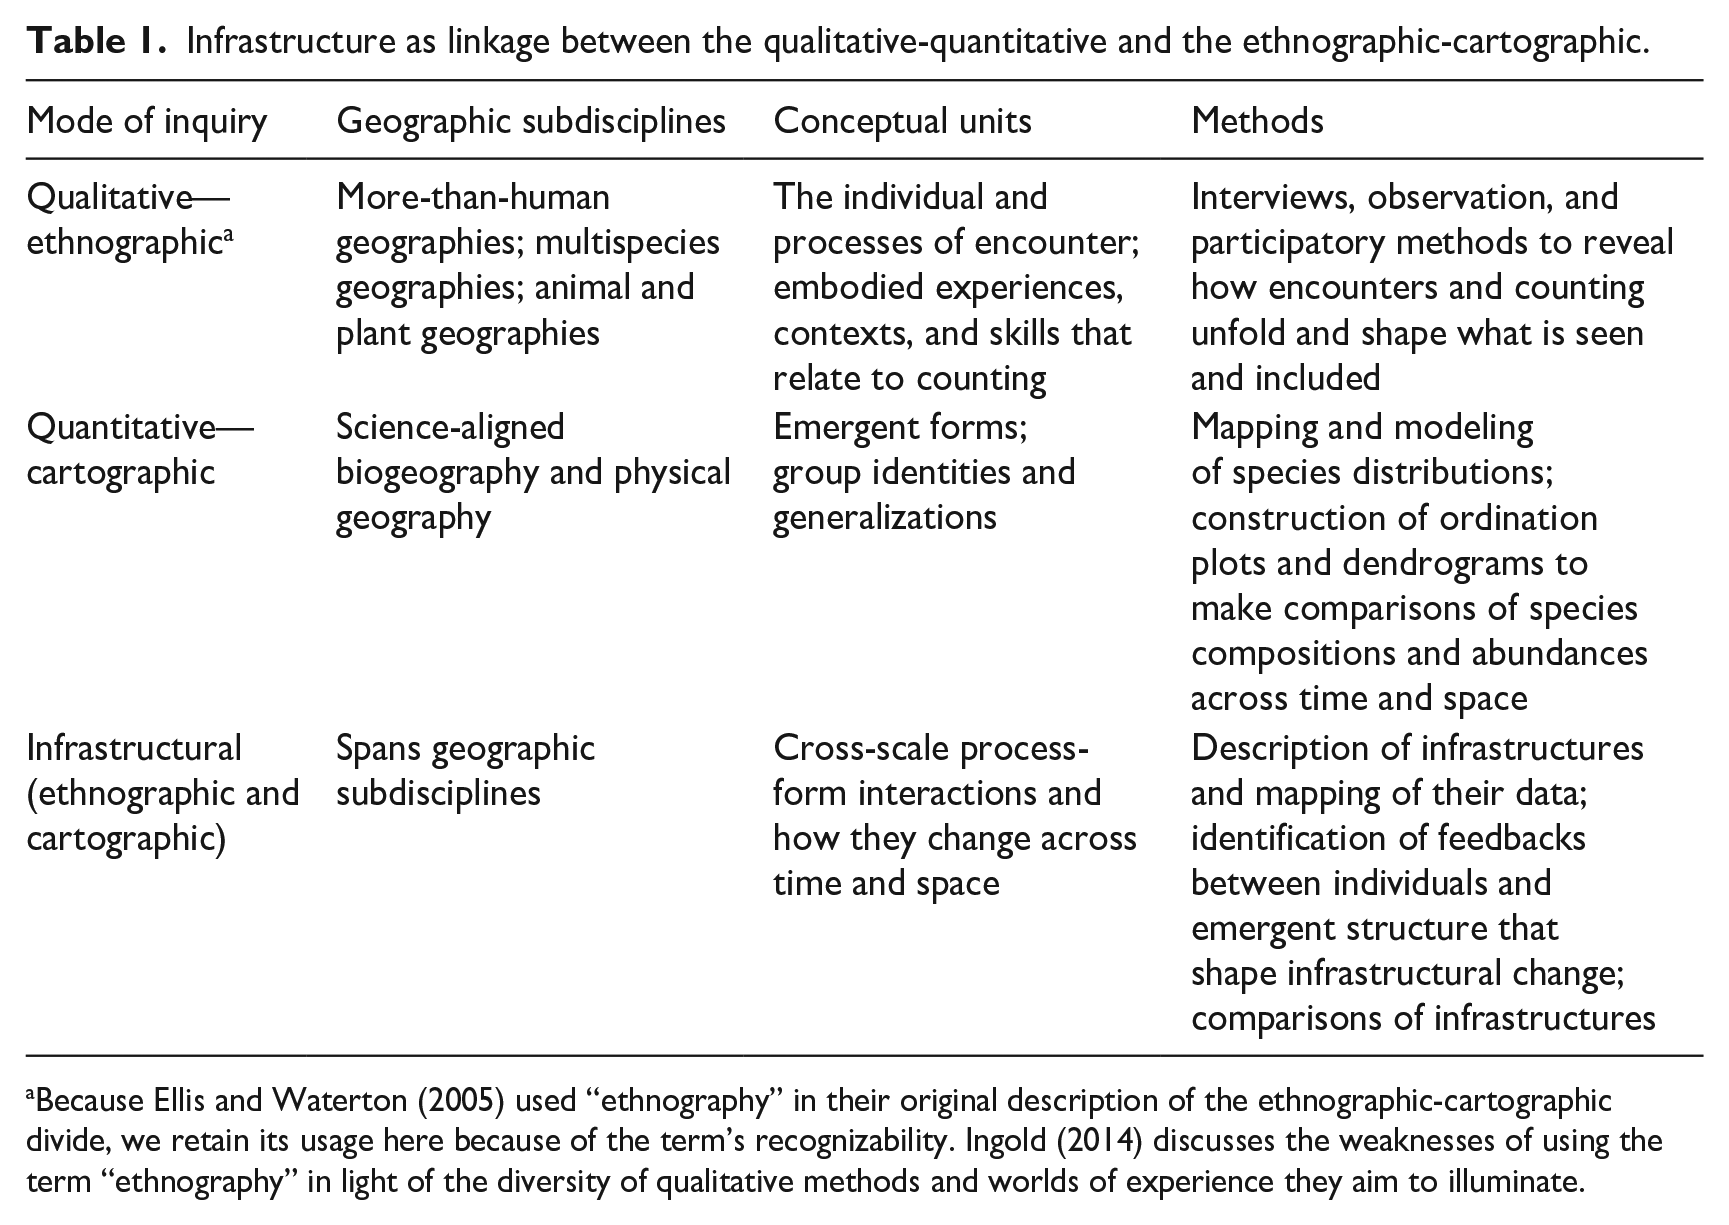
Because Ellis and Waterton (2005) used “ethnography” in their original description of the ethnographic-cartographic divide, we retain its usage here because of the term’s recognizability. Ingold (2014) discusses the weaknesses of using the term “ethnography” in light of the diversity of qualitative methods and worlds of experience they aim to illuminate.
Theoretical framework
Infrastructures of avian species richness
The variety of interactions between individual humans and birds in a city affect what species get tallied (Nilon, 2011). Yet the data that result from these interactions are not just a consequence of human motivations and decisions about where and when to pay attention to birds. Birds can be active participants in these interactions and not just abstracted objects in the landscape. As subjective participants in research practices (Barua, 2021; Gillespie, 2021; Hovorka, 2019), birds can exhibit behavioral plasticity and have individual personalities. They can modify their movements and habitat preferences (Caspi et al., 2022). In this sense, birds shape their proximity to humans and their potential to participate in counts (or not) by their adaptations (or aversions) to the presence of humans and their built environments. However, species counts and maps of animal or plant distributions cannot communicate these or other habits of non-human and human organisms even though this dynamism is what shapes species richness (Bonta, 2010; Lorimer, 2008).
We posit that an infrastructural approach to crowd-sourced data sets strikes a compromise between a visibility of the modes of encounter and the generation of broader biogeographic knowledge about avian species richness. While infrastructure has a traditional association with human-made structures—water pipes, canals, and roads—we draw on scholarship that holds a richer view. Lauren Berlant (2016) describes how infrastructure is not inert, just a shell or architecture, but is also “. . . a system of relation, a movement or patterning of social form” (p. 393). Infrastructure includes the routinized practices that make a variety of human activities possible (Star, 1999). Infrastructure also emerges in relation to the practices of non-human organisms. Infrastructure encompasses what Mark Bonta (2010) describes in reference to his experiences as a birder, the “spatialities of entanglement” that span the material and the mental when encountering the more-than-human. Infrastructure relies on and enrolls natural environments and non-human life, which are then transformed into infrastructures that can act recursively on their further development (Barua, 2021; Carse, 2014; Edelblutte et al., 2022; Kanoi et al., 2022).
In bringing about these moments of proximity, infrastructure is both visible and invisible. Its boundaries are both tangible and detectable as well as imagined, mutable, and affective. As a kind of “geographic imagination systems” infrastructure provides a way “. . . to valorize a range of ways of integrating knowledge of phenomenal interconnections, allowing us to recompose knowledge from multiple sources with diverse positionalities” (Bergmann and Lally, 2021: 30). Such variegated properties of infrastructure should not be taken to be indicative of a concept that is too diffuse to be useful (Howe et al., 2016). Rather, infrastructure demarcates a border ontology out of the often isolating modes of representing the world as either individualistic, experiential, and qualitative or quantitative and abstracted into maps and statistical visualizations like ordination and clustering. Infrastructure becomes a way of negotiating between the one and the many, of allowing these tensions to productively coexist, while still yielding to an incommensurateness that prevents the unrealistic completeness of explanation and description (Savransky, 2021). Neither the many constituting the immensity of anthropological insights (e.g. Ingold, 2014) about birders and avian participants in wildlife rehabilitation, nor the one of traditional biogeographic sampling and mappings of urban biodiversity can be final.
Qualitative details about the experiential, embodied, and affective dimensions of bird encounters and observations can be obscured in ecological accounts of urban bird abundance and distribution. Ecologists highlight the categorical kinds and intensities of development; the amount, location, and qualities of relictual or constructed greenspace; the city’s relative position to corridors of long-distance bird migration, as well as bioclimatic variables—but often at the expense of information-rich multispecies ethnographies (Kirksey and Helmreich, 2010). The resolution to this tension is not a blanket skepticism toward generalization and the statistical snapshots of ecologists and biogeographers. Nor is it that the only useful knowledge will be through myriad ethnographies, as many as there are cities, censuses, and human and bird subjects. Infrastructure provides a middle ground approach. As a heuristic, it provides a process-form linkage to convey how local encounters between humans and birds become affectively and materially embedded in the more generalizable spatially and temporally differentiated forms that constitute traditional biogeography (Hovorka, 2018; Sheppard, 2022).
An infrastructural approach can also retain the normative commitments embedded in the bird species data themselves. Several types of organizations produce observations of birds based on their priorities of what is most valued, often in the same location. If only one is used, this can lead to counts that capture only one aspect of human-bird interactions and may privilege particular spaces, bird species, and modes of encounter. A comparison of infrastructures tests distinctions made between values and data collection and in doing so provides a way to pluralize conservation. It is this overlap and intersection of infrastructures that create the basis for what shows up as nature and the ways we value it (Krieg et al., 2020; Star and Ruhleder, 1996).
Research questions
To put this infrastructural approach into practice, we compared 17 years of geocoded records (2000–2017) from eBird (2021) with those from a wildlife rehabilitation center serving the Tallahassee region. Our research questions are as follows: (1) How do bird species compositions and their frequencies of occurrence in the eBird and rehab data sets compare with each other? (2) What are the specific features of their infrastructures that shape the spatial and temporal character of their distinctive bird observations? And (3) How do differences in species compositions relate to bird and human behaviors specific to each infrastructure?
Our intent was not to derive a final new best count of species richness for the city. It was to show how the concept of infrastructure can be leveraged to conceptualize the production of quantitative patterns of urban bird species richness in terms of the individualistic processes that shape (and are shaped by) varied kinds of human-bird encounters. The eBird and wildlife rehab data represent two distinct infrastructures, each embodying a unique view of multispecies sociality. eBird data represents sought encounters, while the rehab data represent irruptive, unplanned meetings. They each express the interacting mobilities of adaptive agents—birds and people—in the built environment. But they are shaped by different affective relationships and materialize in different forms under contrasting normative commitments. eBird is affiliated with more objective population-based ecological sciences. Rehab is care-based and puts more value on the individual animal.
eBird is now the largest citizen science database in the world. Using eBird’s webpage, birders enter when, where, and how they made observations of bird species. Although free to use, eBird draws on a wide range of specialist expertises to standardize the collection, inspection, and maintenance of their online data (Sullivan et al., 2014). eBird maintains online lists of top eBirders and hotspot birding locations. When supplemented with site specific details, eBird can be a tool for land managers and conservationists to summarize and track bird abundances and distributions (Callaghan et al., 2018; Callaghan and Gawlik, 2015).
Biases in eBird are well-documented (Johnston et al., 2021; Planillo et al., 2021; Zhang, 2020). Participants preferentially visit locations that are close to where they live, are more easily accessible, contain high species diversity or are within protected area. In general, older people, white people, and those with higher income and educational attainment are more likely to regularly observe birds through eBird (Lopez et al., 2020; Perkins, 2020; Rutter et al., 2021). Advanced birders seek small, shy, dull, rare bird species (Randler et al., 2023).
Although less recognized as a citizen-based data infrastructure than eBird, wildlife rehab also records encounters with birds. Cities are often serviced by a network of wildlife rehabilitators and veterinarians that take in injured wildlife for treatment and release. Where they are standalone operations, rehab centers are often staffed with volunteers, and depend upon fund-raising to maintain rehabilitation services. These rehab centers often rely on educational programs to attract donations and to educate the public. In the absence of a centrally-located, easily accessible facility or a wide-ranging pick-up service—both of which are rare in the rehabilitation world—the practice of rehab can be constrained by the difficulties in getting injured animals to individual rehabbers. These individuals may work out of their home, and most are not equipped to take all species and ages of animals. Many specialize in particular species or in specific groups (birds, small mammals) based on their resources and expertise. Rehab is often a highly localized practice with far less data standardization than eBird.
Like eBird, wildlife rehabilitation records provide basic information on the presence of species. Until recently interest in this data has been limited, likely because of the reputation of this practice as unscientific and driven by emotional concerns. Critics of wildlife rehabilitation have suggested the focus on care of common individual animals is antithetical to conservation because it takes time away from more worthy goals of habitat protection (Loftin, 1985; Strang, 1986). Even within the rehab community, debates have arisen as to the value of rescuing abundant species like sparrows and starlings or squirrels and raccoons. These are nested within wider conversations about cost–benefit ratios regarding which individual animals can, or should, be treated, based on their injuries and likelihood of survival after release (Molina-Lopez et al., 2017; Paterson et al., 2021).
Rehabilitators have challenged the charge that their work does not support the goals of wildlife conservation (Luther, 2018), arguing that population impacts happen through their role as educators promoting greater awareness of wildlife and the threats they face. Yet it is only in the last decade that the conservation sciences appear to be more readily embracing the value of rehab data as a cross-taxa snapshot of the biodiversity of a city or region (Ciprari et al., 2022; Hanson et al., 2021; Heathcote et al., 2019; Kelly and delBarco-Trillo, 2020; Kwok et al., 2021; Long et al., 2020; Pyke and Szabo 2018a, 2018b; Schenk and Souza, 2014; Taylor-Brown et al., 2019).
Methods
Tallahassee (Leon County) is situated in one of the most biodiverse regions in North America (Figure 1; Blaustein, 2008; Myers and Ewel, 1990). Florida also has a high number of non-native species due to its mild climate and high levels of international commerce and transportation, which includes the exotic animal pet trade. The north Florida panhandle coast is a major corridor for migratory birds. St Marks National Wildlife Refuge to the south of the Tallahassee on the Gulf Coast has long been renowned for its bird diversity. Over two thirds of the accepted bird species in Florida have been recorded there. Bordering Tallahassee to the west are the riverine, wetland, and upland pine habitats of the Apalachicola National Forest. Over 2000–2017, the population of the county containing Tallahassee increased approximately 19%, going from 239,452 to 285,890. Much of the land cover in the study area is suburban with a growing exurban zone. Runoff from impervious surfaces in the small urban core is an environmental issue made more acute by the extensive karstic springs and lakes of the Florida Aquifer. Median housing values decline to the south and southwest of Tallahassee (Figure 2(a) to (c)).
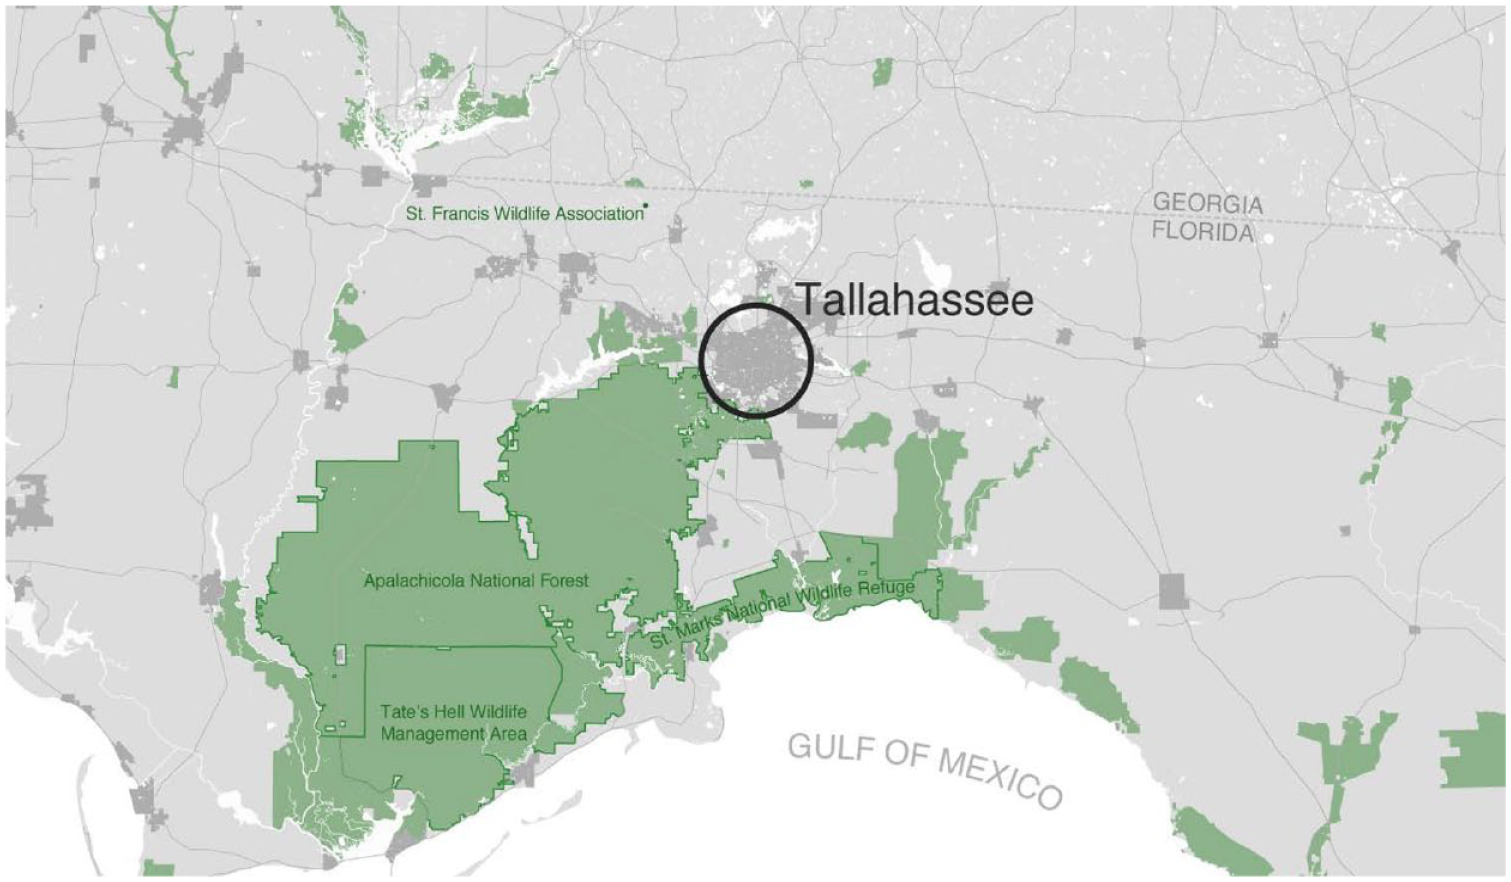
Northwest Florida. Data are from OpenStreetMap. Green shading indicates lands with formal conservation designations. Avian species richness was examined within 10 km radius centered around Tallahassee.
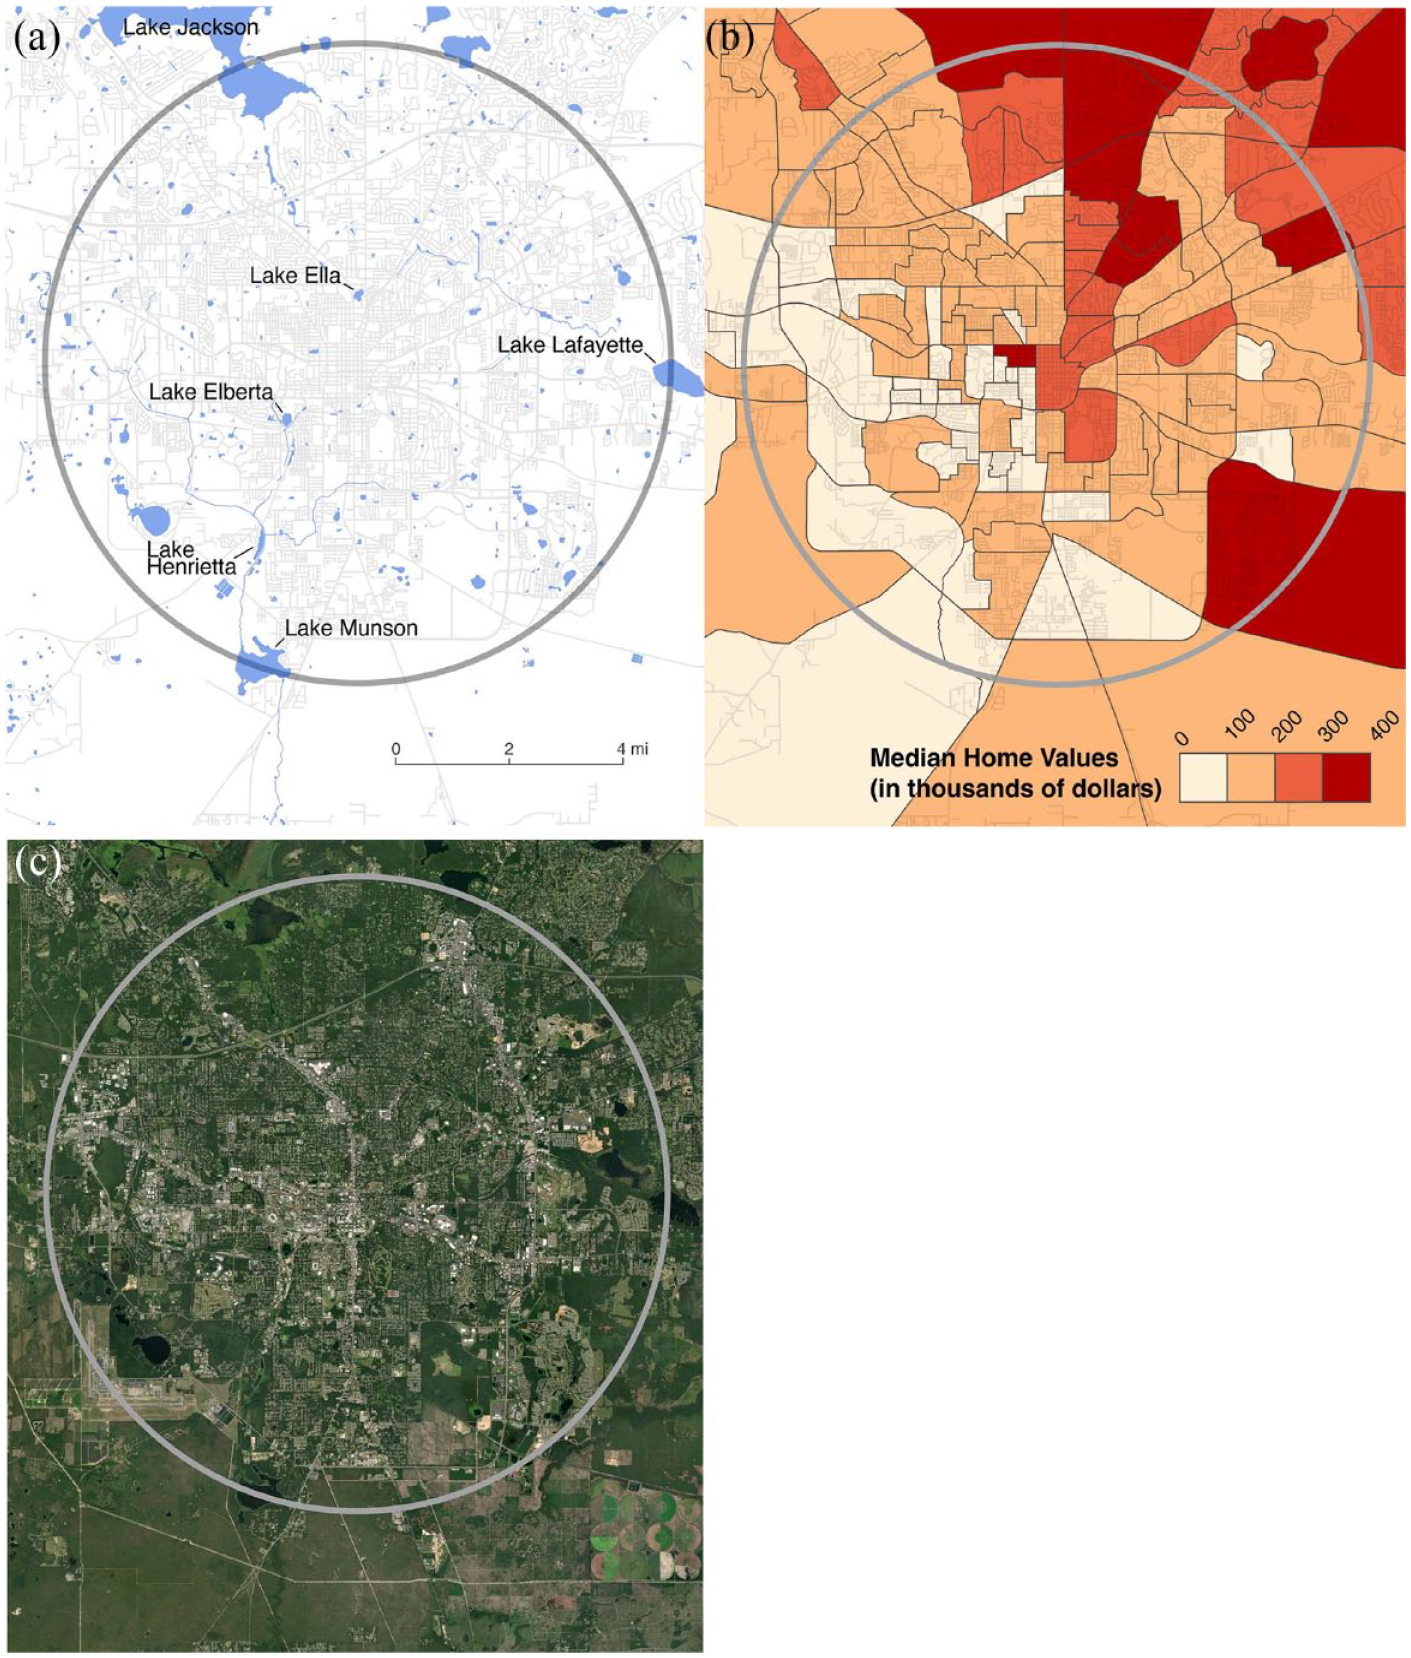
Hydrology (a). 2012 American Community Survey: 5-Year Data (2008–2012) for median housing value by block groups (b). Air photo based on ESRI Satellite ArcGIS/World Imagery (c).
Wildlife rehabilitation records were provided by the St. Francis Wildlife Rehabilitation Center (SFWRC). Injured animals make their way to the SFWRC facility through veterinarian offices that agree to serve as intake centers. Individuals who bring in wildlife to these specific vets fill out a form that includes their address. SFWRC staff add the date of intake, a brief description of the cause of injury, and identify the animal to the species level. Identifying animals is a critical task for rehabbers, as it determines treatment and release protocols. Rehabilitation records for each individual bird rescue were geocoded and those within a 10 km radius around the city center were selected for analysis. Addresses are not necessarily the exact location where an animal was rescued. However, based on participation in rehab by two of the authors, recovery of injured animals typically occurs within the orbits of where people live and work.
We used only completed checklists available for download in eBird. The use of complete checklists, where observers report all the species they detect and identify, allows non-detections to be inferred. Each observation of a bird has a date, an observer number, and a geocoded location. Geocoded locations were also restricted to the 10 km radius around the city center. eBird follows an internally standardized taxonomy that is updated regularly (Clements et al., 2021). eBird entries with two or more species epithets, such as Limnodromus griseus/scolopaceus, or with no species epithet (e.g. Trochilidae sp.) were assigned in this study to a species based on the relative proportions of the individual species observed in eBird for these genera over the period of study. Scientific names in the rehab data were standardized to agree with those in eBird.
Geocoding and subsequent analyses were done in QGIS 3.14 and ArcGIS Pro 3.0.0. Species compositions were compared using the relative percent frequencies of occurrence for bird species common to both infrastructures as well as those that were unique only to eBird or wildlife rehab. Ordination with non-metric multidimensional scaling (NMDS) was used to track and compare changes in bird species composition across each year of the study period. NMDS is routinely used to assess and visualize multivariate data sets and the similarities and differences among observational units. Indicator species analysis (ISA; Dufrêne and Legendre, 1997) identified those species that were distinctive to each data set. ISA generates an indicator value based on the concentration of a bird species abundance and the faithfulness of occurrence of a species across all years of a data set. Indicator values range from zero (no indication) to 100 (perfect indication). The relative percent frequency of bird species common to each data set were compared using Kendall’s coefficient of concordance in SPSS (International Business Machines Corporation (IBM), 2021). NMDS and ISA was conducted in PC-Ord Version 7.09 (McCune and Mefford, 2018).
Results
Human infrastructural participants
The eBird data consisted of 15,454 completed bird survey lists comprising 198,823 bird identifications (Figure 3(a) and (b)). These observations were made across 1161 locations within the 10 km radius of the city center. Wildlife rehab recorded 10,352 bird rescues at 6511 unique addresses (Figure 4(a) and (b)). This contrast speaks to the kinds of encounters the infrastructures privilege. Rehab records involve both an injured bird and a person inclined to assist them by capturing the bird and/or pursuing help through institutional channels. The unexpected nature of these encounters and their more intimate, prolonged duration account for why there were far fewer rehab encounters than eBird observations.
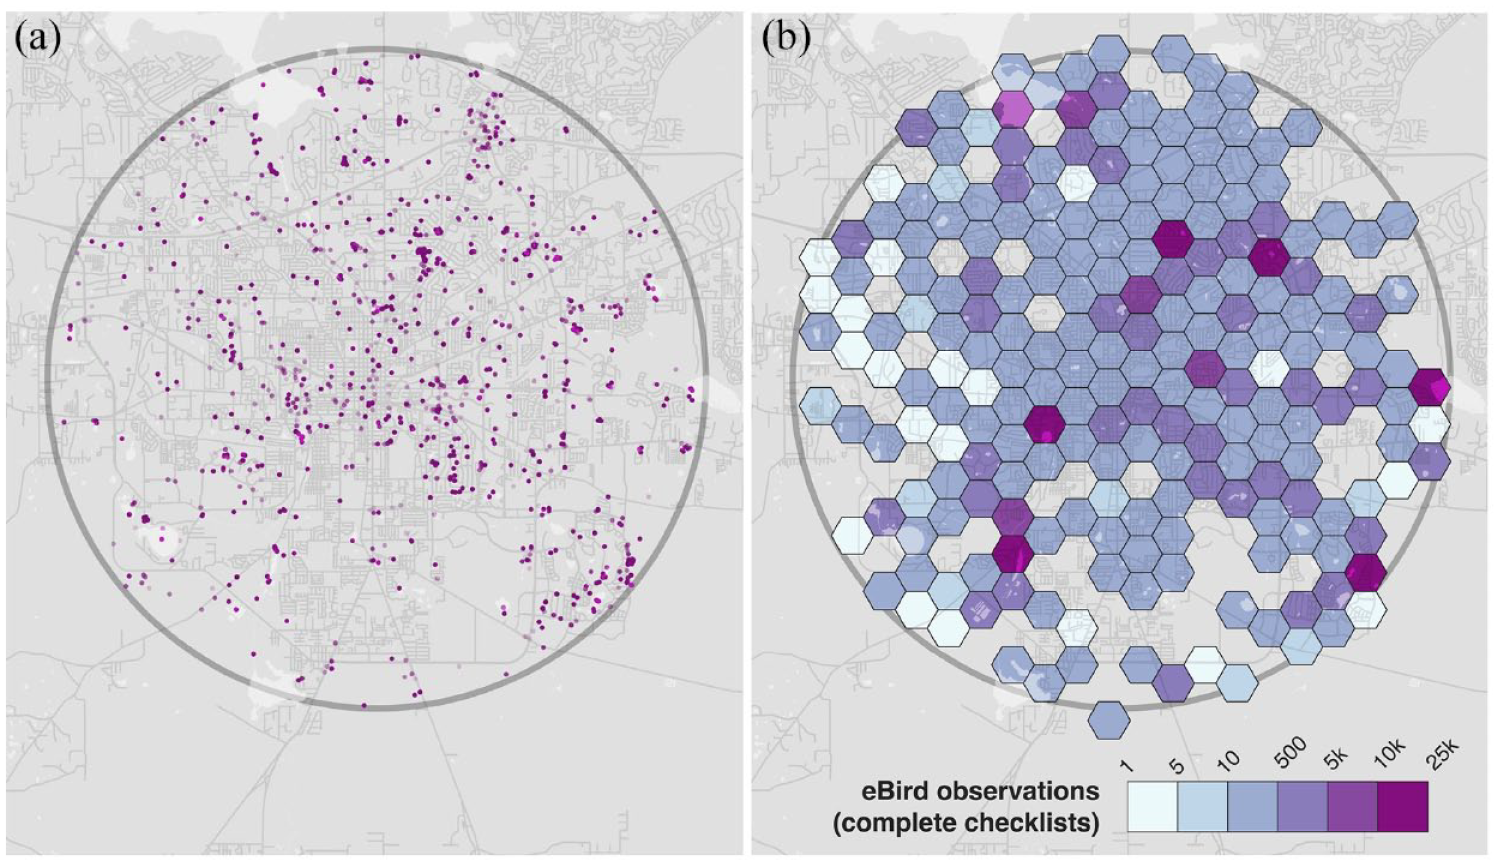
eBird (2000–2017). Each dot represents the location of a bird observation recorded in eBird (a). Density of these human-bird encounters (b).

Wildlife rehab (2000–2017). Addresses associated with recoveries (a). Each dot represents recovery of an injured bird. Density of these human-bird encounters (b).
Although larger in the number of observations, the eBird records were dominated by the contributions of a small number of observers. Of the total 614 observers in the eBird data, the top fifteen observers captured approximately 75% of all observations. The top four observers captured 52%. By comparison, the recovery of injured birds involved a more even distribution of effort, as evidenced in 6511 unique addresses that comprised the rehab data set. Most of these were residential addresses associated with only one or two rescues over the 17-year study period. This evenness was also apparent in the spatial distribution of rehab recoveries around the city (Figure 3(a) and (b)). eBird encounters were more disproportionately associated with hotspots, formally designated eBird sites that emerge out of the online observation data of eBird users over time (Figure 4(a) and (b)). A Lorenz plot of these data confirmed the strong difference in the concentration of eBird observations and rehab encounters in specific locations (Figure 5). eBird observations were strongly concentrated in a few popular birding sites. Rehab observations were much closer to equality, implying a more equitable contribution of encounters from among individual addresses across the city.
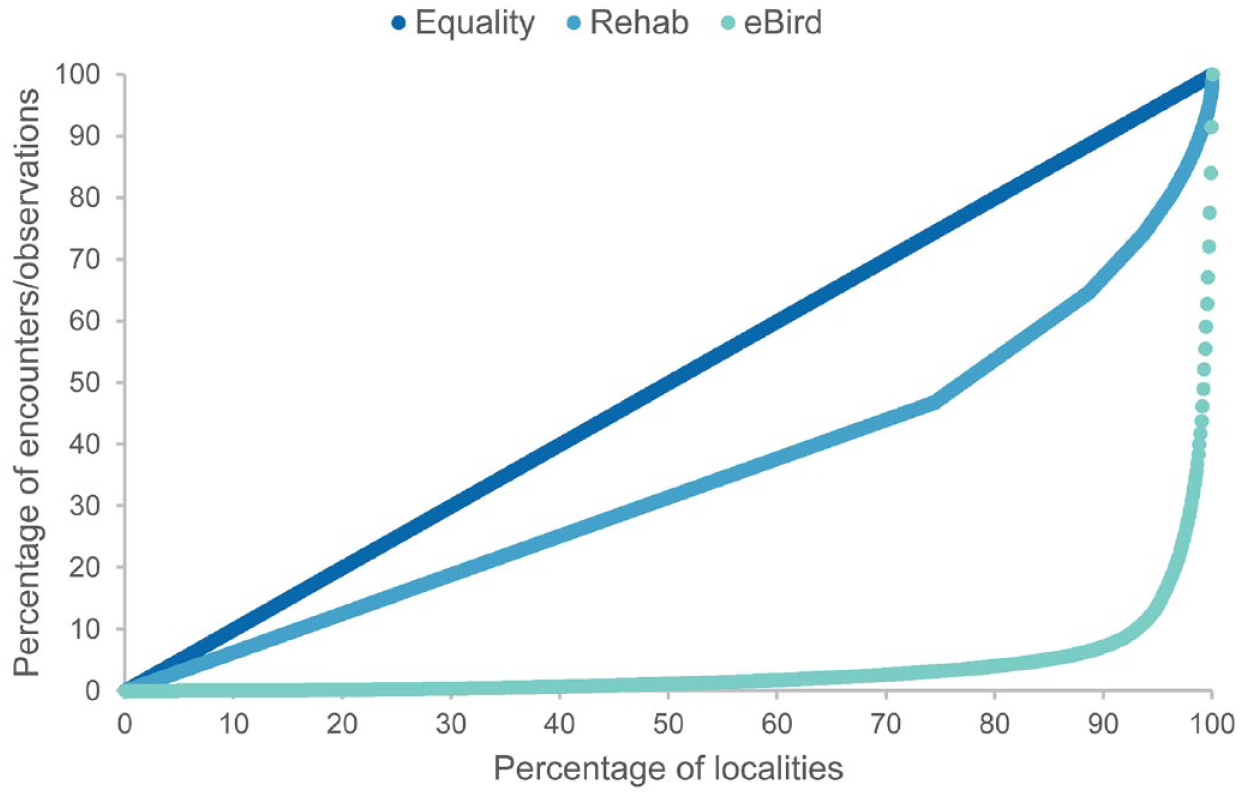
Lorenz plot for rehab addresses and eBird siting locations.
The greatest single concentration of eBird observations were for Lake Elberta (8.5%), a water body in a former industrial area that now serves as a retention pond to capture and slow stormwater flowing south out of Tallahassee into sensitive karstic areas (Figure 6). The second highest number of eBird observations was a suburban residence in northwest Tallahassee that recorded checklists on a near daily basis (7.4%). The third-highest hotspot was also a heavily modified lake associated with a city greenway and adjoining subdivisions, Lake Lafayette (6.4%). Long used by Indigenous people, Lake Lafayette connects to a river which empties into the Gulf of Mexico at the St. Marks Wildlife Refuge. The fourth ranking location, Lake Henrietta (5.6%) is part of a popular birding corridor downstream from Lake Elberta.

Lake Elberta. Data from ESRI Satellite ArcGIS/World Imagery.
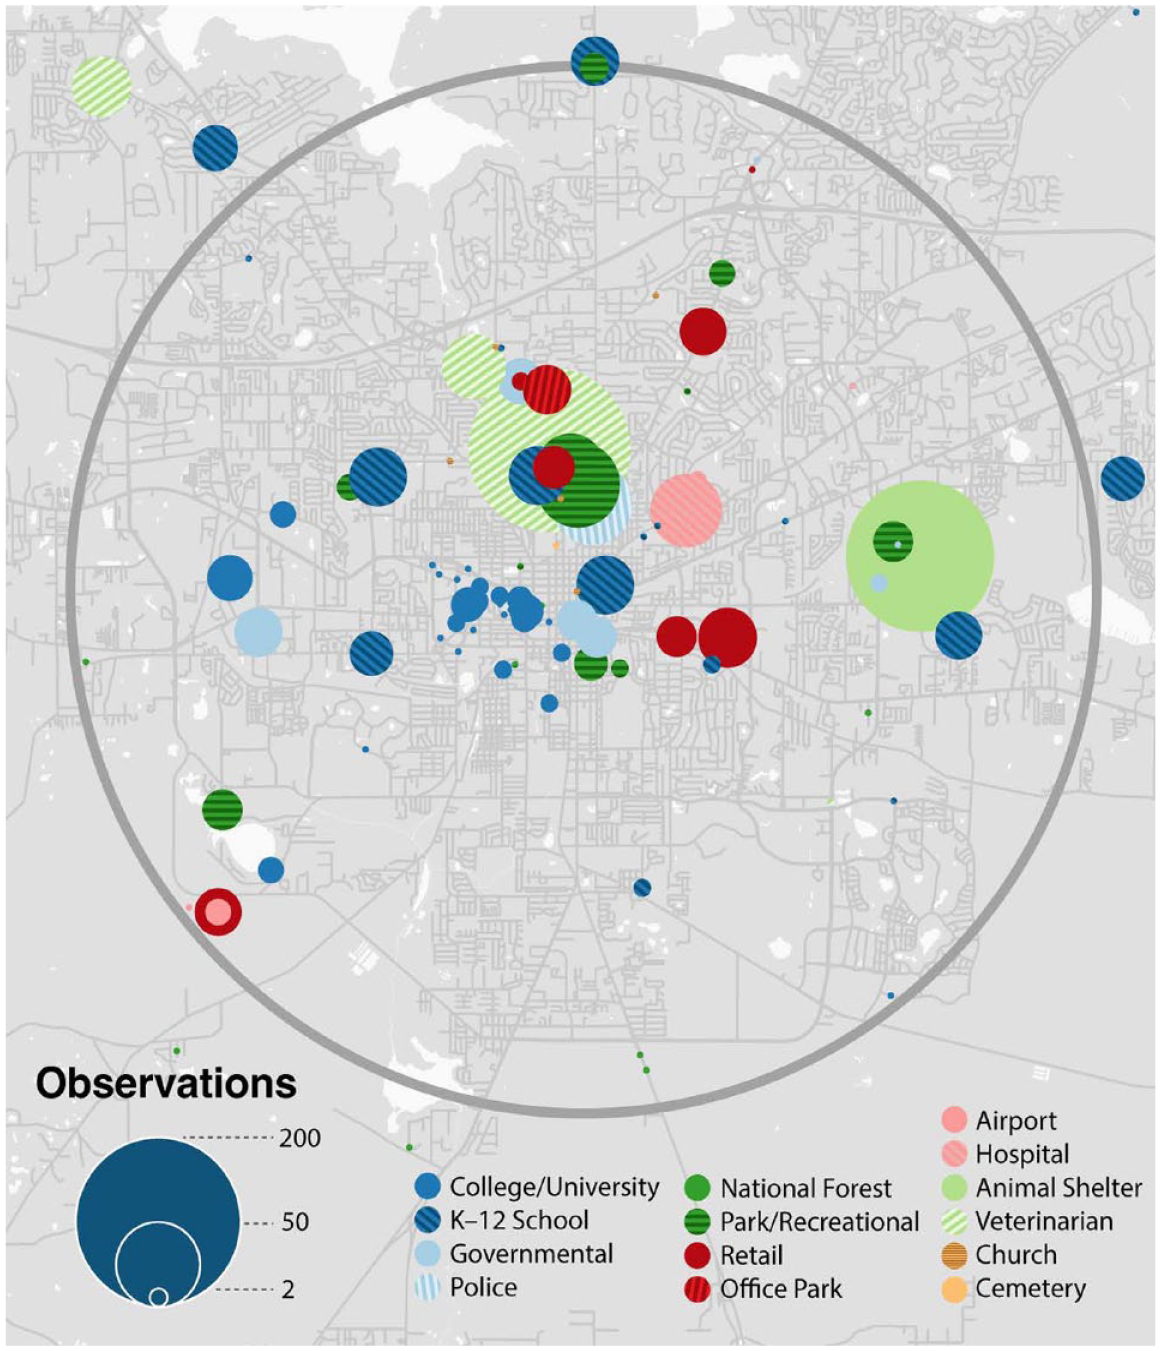
Although the 10,352 wildlife rehab events were more evenly distributed geographically across the study area than eBird, peaks in rehab totals were associated with different kinds of residential addresses. These were often apartment complexes (7.2%), but there were also “superrescuer” addresses (15.4%). These were individual household addresses where the occupants repeatedly rescued injured wildlife (>10 rescues over the 17-year period; Figure 7). In agreement with Andrade et al. (2022) older, wealthier, and whiter census block groups made greater percentage contributions to SFWRC bird recoveries. High numbers of rescues were also observed in non-residential institutional addresses (Figure 8). A veterinary practice (1.9%) that routinely accepts and transfers injured wildlife to SFWRC was at the top of this list. The second highest was the animal control agency for the county (1.6%). Although typically tasked with management of cats and dogs, county animal control is often the point of contact for nuisance animal calls involving non-domesticated animals typically handled by local wildlife removal companies. A public park, Lake Ella, was a frequently occurring institutional address (0.8%) because of its large number of domestic waterfowl residing near heavy intown automobile traffic and residential neighborhoods. The city police department (0.4%) as well as public schools, colleges, and universities (2.3% in total) also participated in this city-wide wildlife rehabilitation network.
Residential “super-rescuer” locations for rehab data.

Rehab institutional recoveries.
Avian infrastructural participants
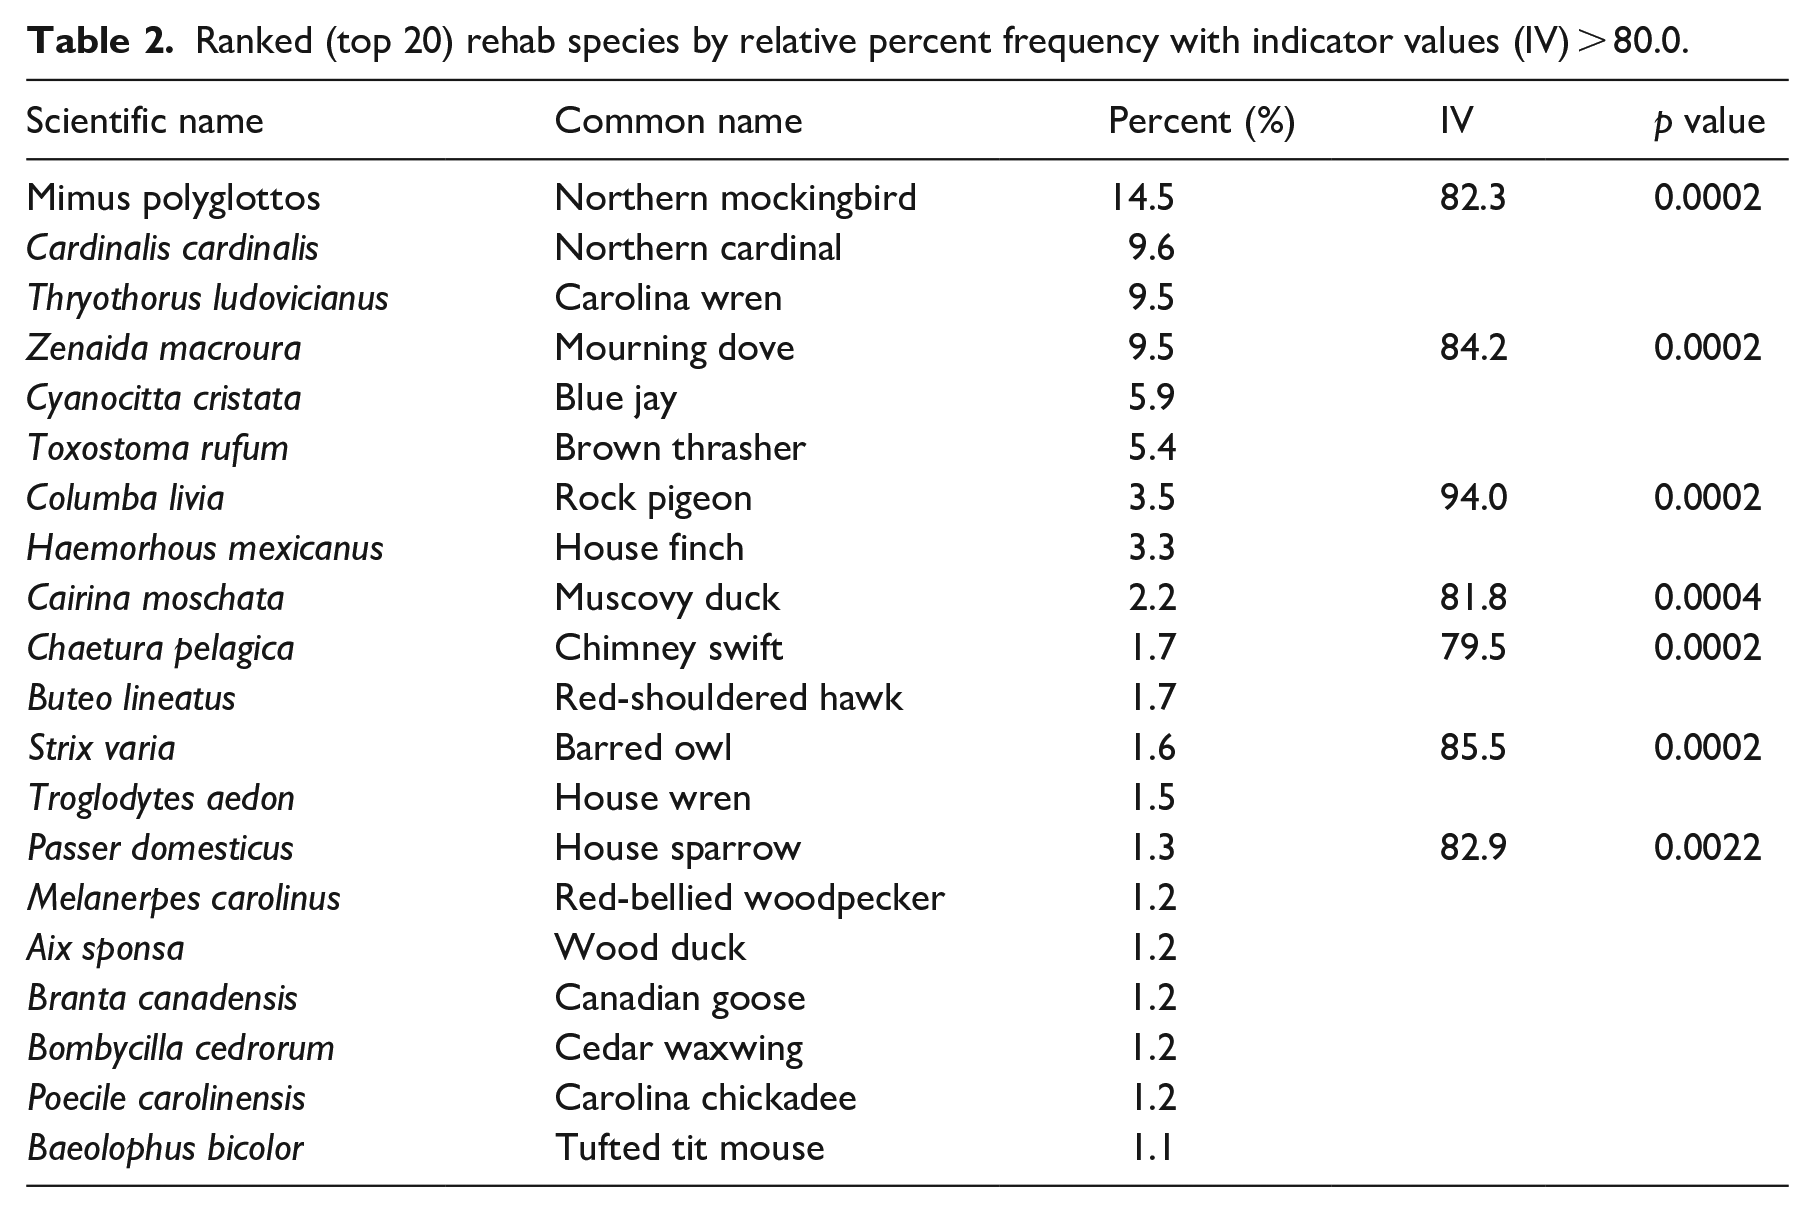
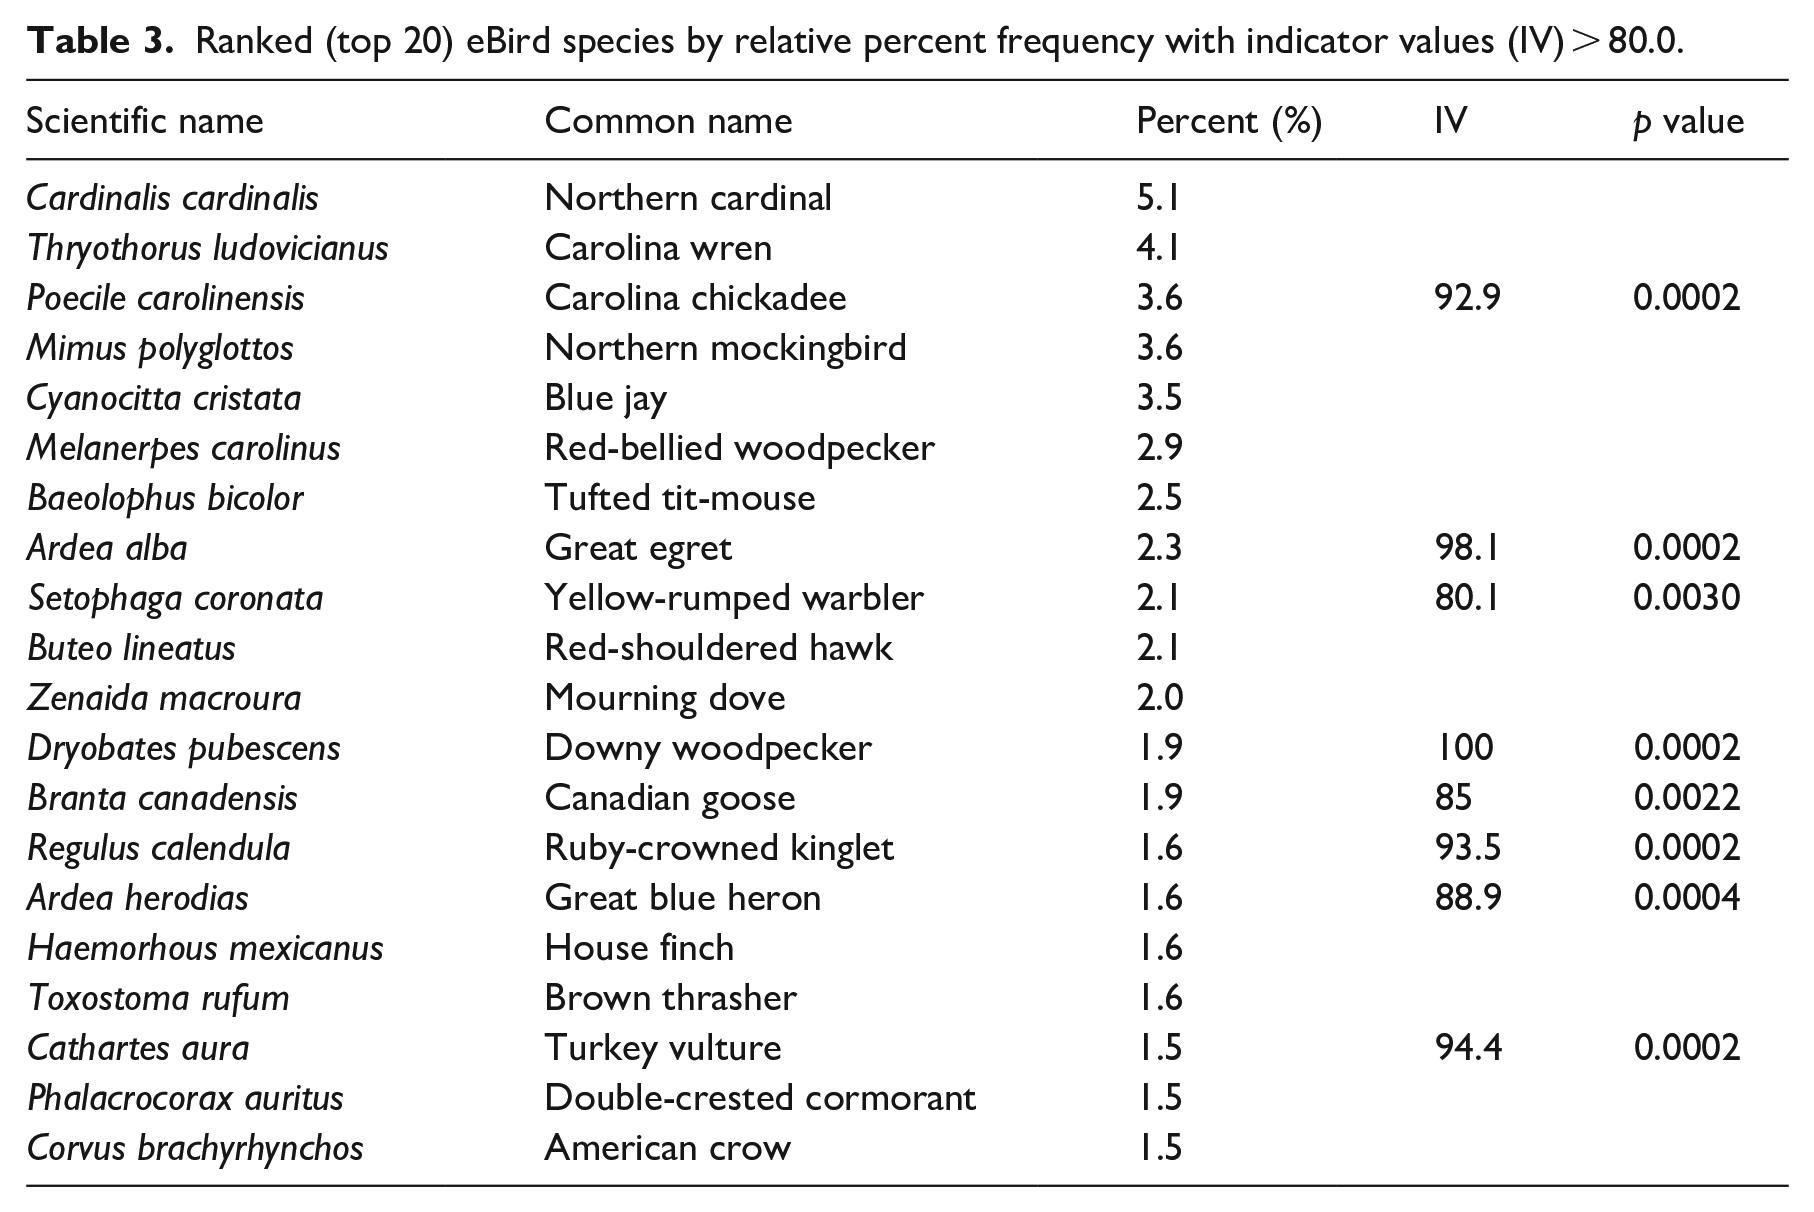
eBird recorded more species than rehab. 295 of the 344 eBird species recorded for Leon County as of Dec 2022 were observed within our 10 km radius study area. Only 194 species were recorded in the wildlife rehab data. For both data sets, the distribution of relative percent species frequencies was positively skewed, with a few species comprising most of the observations in both data sets. The top twenty frequent species (> 1% relative frequency), accounted for 48.4% of the total observations in eBird and 78.3% in the rehab data (Tables 2 and 3). The northern cardinal, the northern mockingbird, the Carolina wren, and blue jays were major constituents of both data sets. Synurbic avifauna were better represented on the rehab list, which included the mourning dove (9.5%), and two other globally distributed birds: the common pigeon (3.5%) and the house sparrow (1.3%). Three rehab species that were not widespread synurbic species nor equally abundant in the eBird data had statistically significant (p > 0.05) indicator values < 80%: house wrens, chimney swifts, and barred owls (Figure 9). Larger body size and distinctive coloration characterized many of the birds on the top twenty eBird list. Indicator species for eBird included the Carolina chickadee, great egrets, yellow-rumped warblers, downy woodpeckers, ruby-crowned kinglets, great blue herons, and turkey vultures (Figure 10).
Ranked (top 20) rehab species by relative percent frequency with indicator values (IV) > 80.0.
Ranked (top 20) eBird species by relative percent frequency with indicator values (IV) > 80.0.

Selected indicator species for rehab data. Photos used with permission from Macaulay Library (ML) at the Cornell Lab of Ornithology: (a) house wren (Troglodytes aedon; ML423040231, photo by Elizabeth Hawkins), (b) chimney swift (Chaetura pelagica; ML121477891, photo by Jeff O’Connell), and (c) barred owl (Strix varia; ML88441081, photo by Lise Roussel).
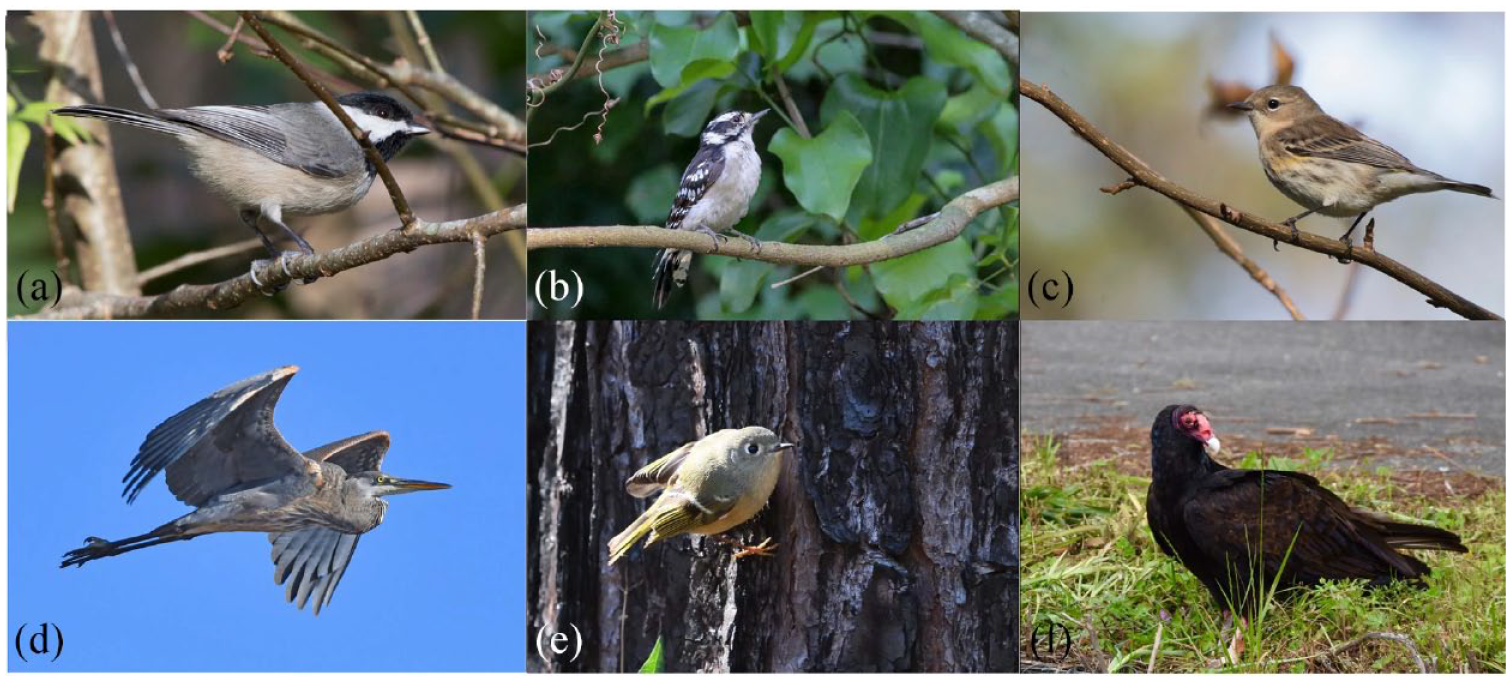
Selected indicator species for eBird. Photos used with permission from Macaulay Library (ML) at the Cornell Lab of Ornithology: (a) Carolina chickadee (Poecile carolinensis; ML131008091, photo by Steve Kelling), (b) downy woodpecker (Dryobates pubescens; ML108720921, photo by Jeff O’Connell), (c) yellow-rumped warbler (Setophaga coronate; ML131008911, photo by Steve Kelling), (d) great blue heron (Ardea herodias; ML406903031, photo by Elizabeth Hawkins), (e) ruby-crowned kinglet (Regulus calendula; ML407299161, photo by Shane Carroll), and (f) turkey vulture (Cathartes aura; ML146121551, photo by Edlyn Burch).
Nesting preferences also distinguished the top twenty bird lists. Although both lists contain species that will make their nests in association with the built environment, they were more prominent in the rehab data. Fledgling behaviors may have also contributed to the differences in bird compositions of the two data sets (Chace and Walsh, 2006). The higher relative frequency of mockingbirds in the rehab data is likely influenced by the fact that mockingbird fledglings typically leave the nest before they can fly, and the parents feed them while they scurry in the undergrowth. This is when people find the young and mistakenly think they are abandoned (bird “kidnapping” in the parlance of wildlife rehabilitators). Similarly, barred owls leave the nest well before they are fully feathered, at about 4–5 weeks of age, and do not begin flying until 10–12 weeks, increasing the likelihood of injury and encounter with humans in neighborhoods with large older canopy trees used for nesting cavities and seclusion. Finally, the hardiness and intelligence of the American crow and Carolina chickadee may be a reason they were relatively less frequent in the rehab data. The complex social groups of these species may foster communication and behaviors that lessen exposure to human threats.
Infrastructural contributions to bird species richness
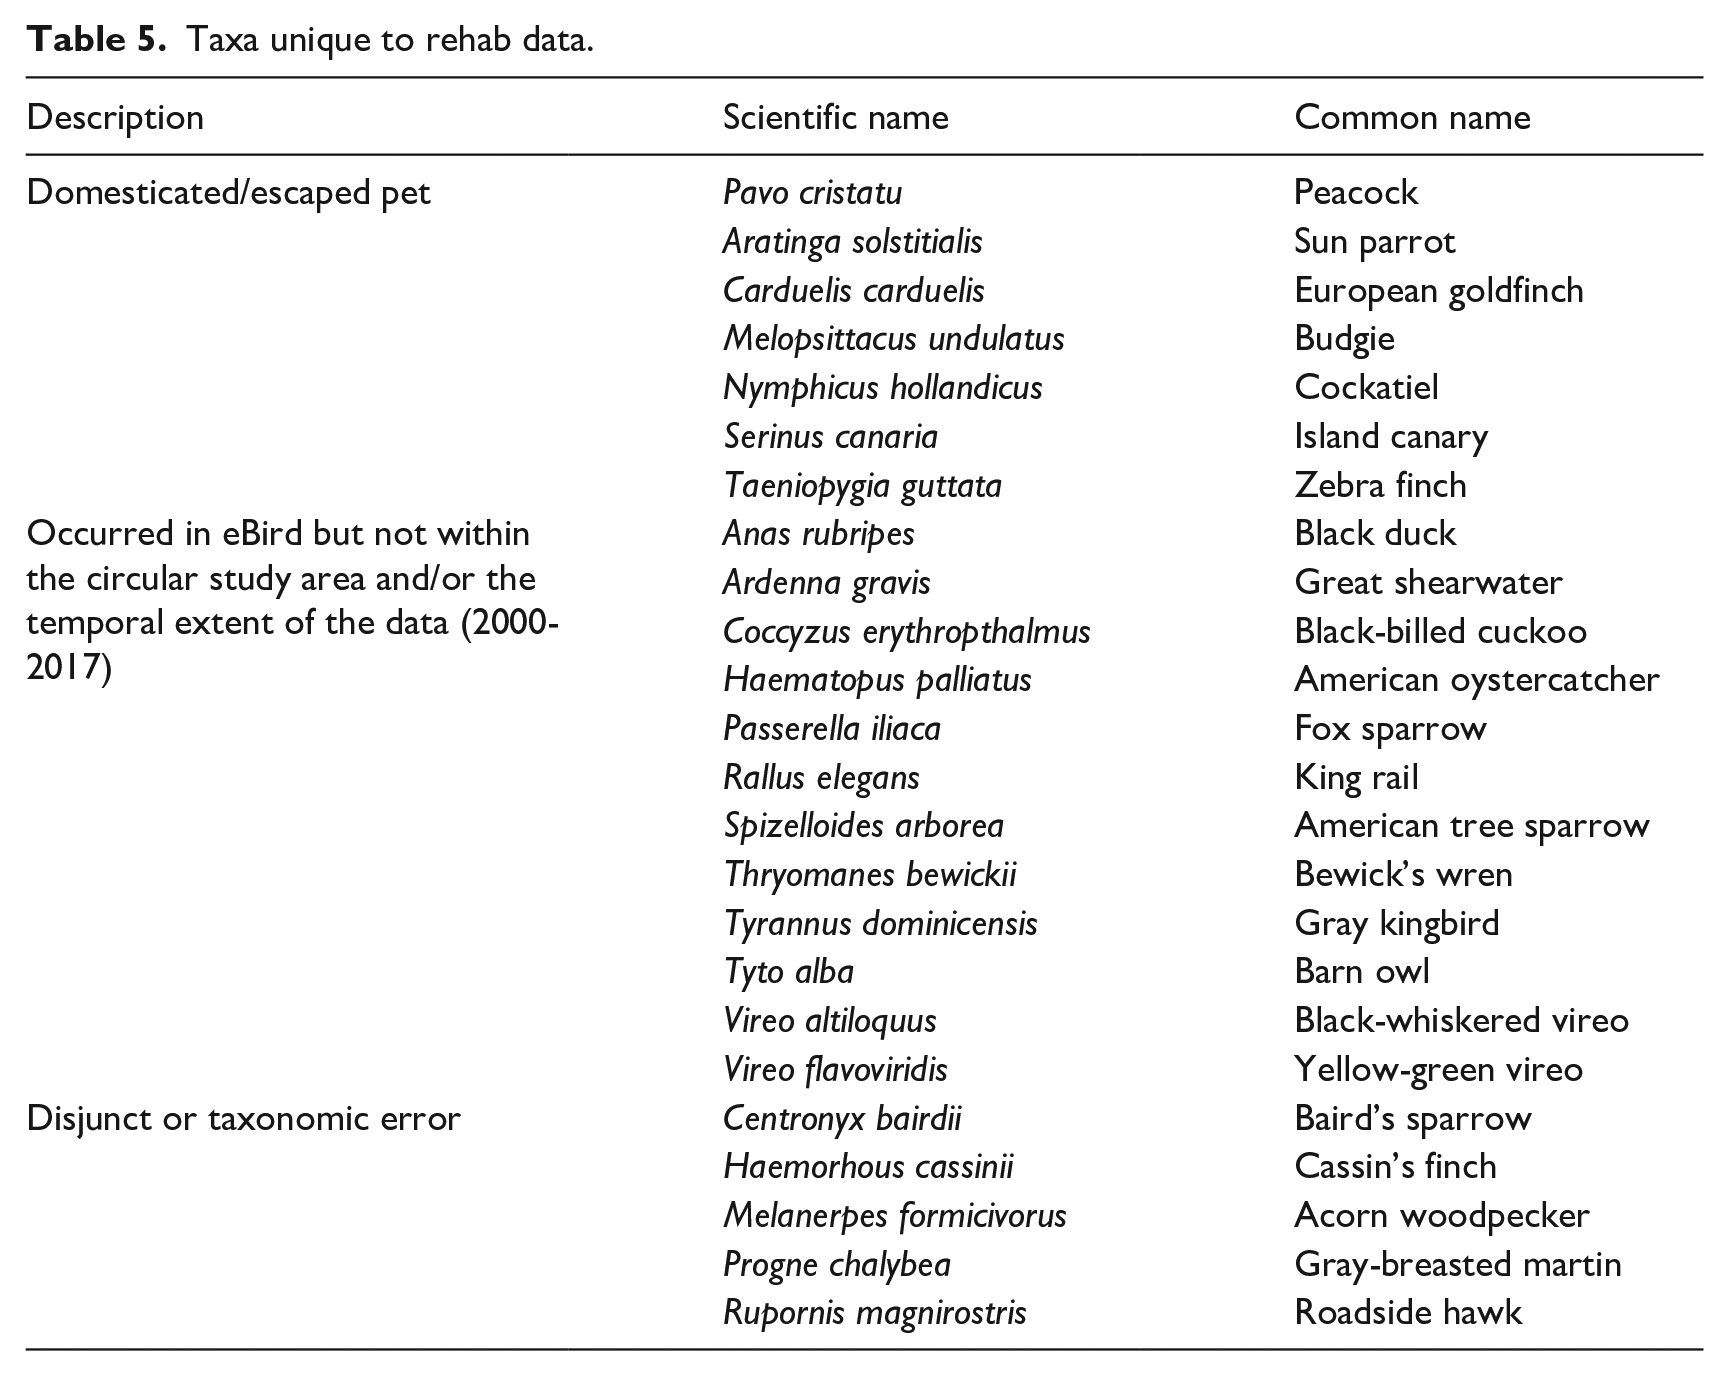
Species that were unique to eBird comprised 127 species, only 7% of all eBird observations. These unique species were dominantly shorebirds and waterfowl (Table 4). The family Aramidae is represented by the limpkin, a local endemic which favors shallow freshwater habitats. Anatidae (ducks), Scolopacidae (shorebirds), and Laridae (gulls) also contributed to eBird’s unique species. The small number of unique species (27) totaling < 1% of occurrences in rehab data included escaped pets and domesticated species (Table 4). Shore and water birds were not well represented in the rehab data, which is more likely to miss birds that utilize inland waterbodies and are not always accessible to humans when they are injured. Some of the unique rehab species may represent sightings of species new to the area, but they may also be taxonomic errors (Table 5).
Taxa unique to eBird observations grouped by family.

Taxa unique to rehab data.
Although each data set made distinctive contributions to species richness, they made near equivalent contributions to overall species richness in terms of shared species. Both infrastructures shared 168 species, comprising 93.5% of all eBird records and 99.3% of all rehab records. Kendall’s coefficient of concordance (W) indicated moderate agreement in the ranked species abundances of these shared species (W = 0.77, p < 0.05). However, the temporal signatures of the observations markedly differed. Peaks in observations for eBird were due to the presence of overwintering migratory birds in January (Figure 11(a)). Migratory flyover peaks were also evident in the spring and fall. Rehab frequencies were at a maximum in spring nesting season (Figure 11(b)), when young birds were more likely to be brought in to rehab.
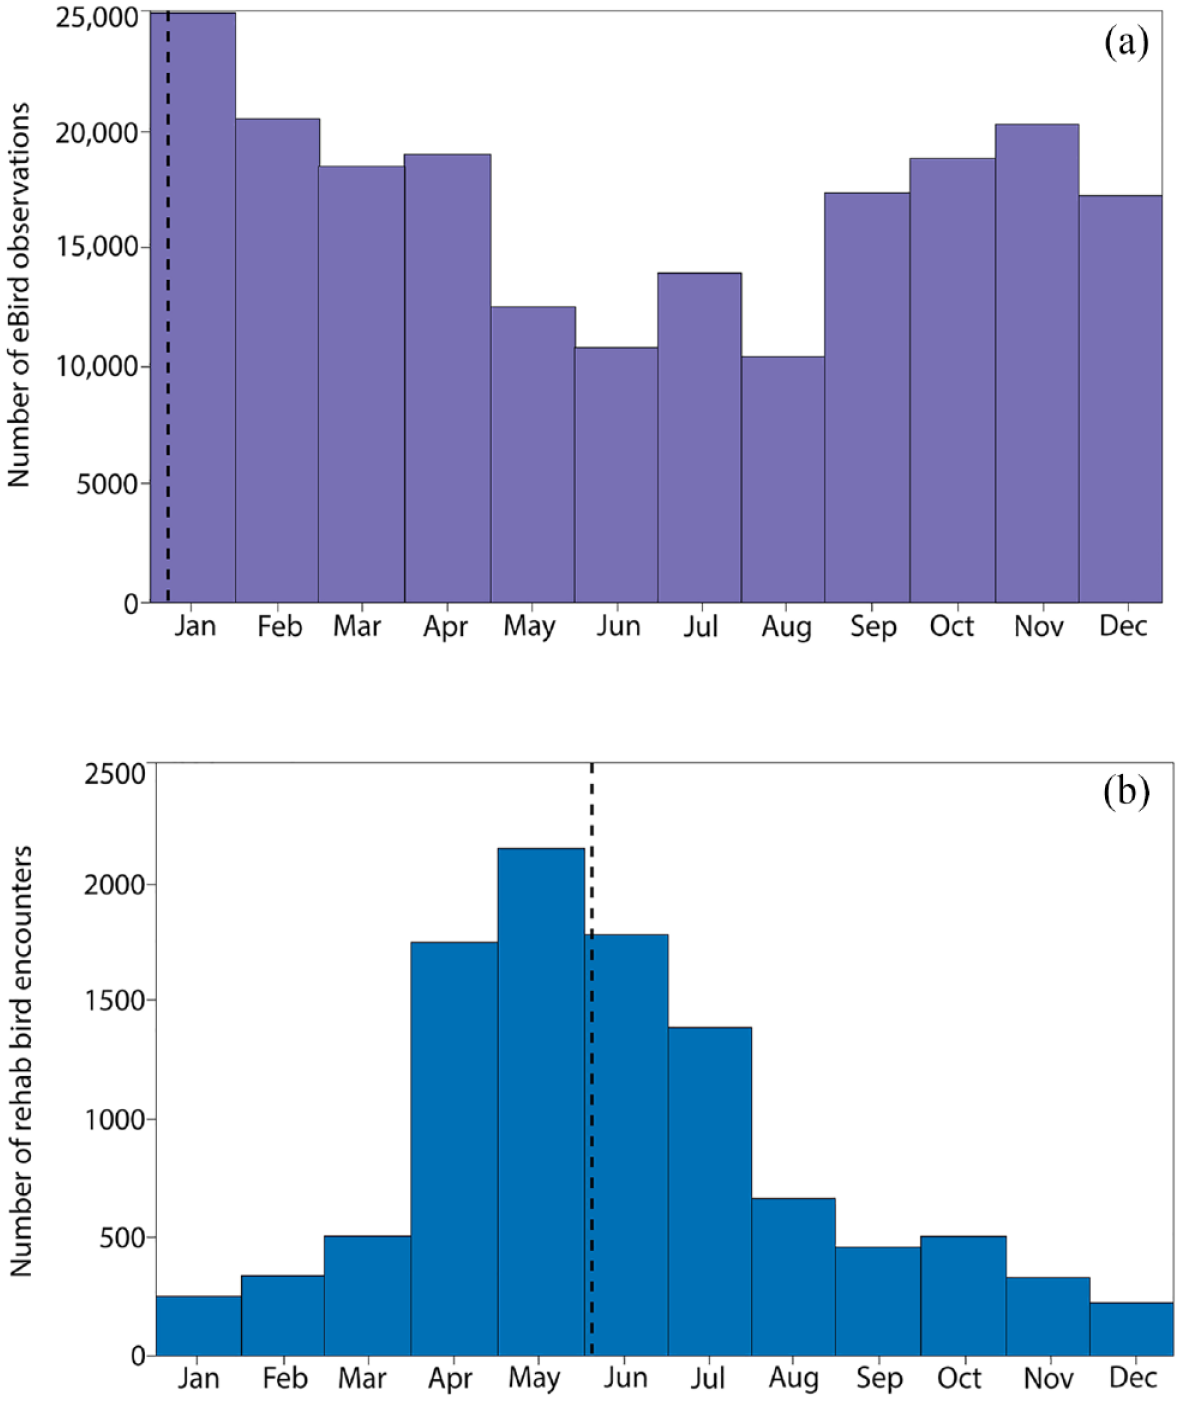
Annual distribution of observations for eBird (a) and wildlife rehab (b). Dashed line indicates circular mean of observations. Temporal statistics calculated using Oriana Version 4 (Kovach, 2011).
A two-dimensional NMDS solution (Figure 12) conveyed that these two data sets were becoming more compositionally similar during the first decade of observations but then later diverged. As the first (x) axis in Figure 12 represents the dominant axis of variability, one can use the relative positions of annual observations in bird compositions along it to indicate whether they are becoming more taxonomically similar (closer to each other) or more different (farther apart). Rehab and eBird annual observations were moving toward each other along the first axis between 2000 and 2010, an indication of an increasing similarity in composition. However, around 2010, the eBird composition begins to exhibit increasing divergence from the rehab data, as indicated by the movement of eBird data downward and parallel to the second (y) axis. This second axis can be interpreted as the compositional variability in eBird that arose in later years likely due to lake and wetland remediation, the growing visibility of these birding hotspots among birds and birders, and the resulting increase in observations of shore and waterbirds in eBird.

NMDS scatterplot of annual eBird and rehab compositions based on relative percent frequencies. Sorenson’s distance metric was used to define similarity among annual relative percent frequencies of species in each data set.
Discussion
Species richness through infrastructure
Our conceptual-methodological framework based on infrastructure provided insights into how individual humans and birds produce variability in where, when, and how species are tallied and converted to measures of species richness. Bird species common to the rehab and eBird data sets comprised more than 90% of their respective observations. Yet this substantial overlap masked differences in how their unique infrastructural attributes contributed to overall bird species richness. Far larger numbers of bird observations were made in eBird. This may make eBird data more useful for population-based estimates of abundance. However, eBird data were dominated by a few birding hotspots and the observations of a few highly skilled birders. Rehab data conveyed how birds are encountered in a wider variety of locations and by a larger number of individuals. They encompassed human-bird interactions in locations where eBirders do not typically go, but where wildlife often does, that is, along roadways, in yards and the everyday places of human occupation, like public parks, schools and universities, as well as where county and city services like animal control and law enforcement operate.
The eBird observations illuminated how the history of Tallahassee and its evolving hydrosocial infrastructure were enrolled in the production of its species richness. A larger proportion of the observations in eBird took place along small heavily modified lakes that were part of a pre-existing drainage network that became degraded as Tallahassee developed. These waterbodies are located predominantly in areas that have long been racially segregated and where earlier industries like the Elberta Crate and Box Company operated. Today, aquatic and wetland habitats in these districts of the city have become popular public birding areas. eBirders seeking to add specific species to their life list may be motivated to seek out these readily accessible waterbodies in response to eBird hotspot rankings and posted sightings. In tandem with this infrastructural gamification, local government and wildlife groups have invested in habitat improvements at these hotspots to attract more birds and birders (Tallahassee Democrat 2020). This recursiveness of how observations in eBird impact subsequent observations likely accounts for the diverging eBird and rehab compositions visualized with NMDS. Later years, from 2010 onward in the eBird data, have become more compositionally distinctive as awareness of bird sightings and habitat improvements have led to more birds, more humans, and more observations of rare and infrequent waterfowl and shorebirds.
While rehab data may not seem to be as driven by the same self-replicating processes as eBird data—rehab users typically never see and react to rehab data itself—it nonetheless has its own kind of recursiveness. “Superrescuers” repeatedly rescue wildlife: they more actively look for it and develop their own personal networks to bring the animals in. Recursiveness is also embedded in how the wildlife rehab center model operates. Considerable planning and effort are required to make urban wildlife organizations self-sustaining (Luther, 2020). SFWRC has been in operation since 1978. It is familiar to some residents through their prominent educational programs at elementary schools and through local advertising. Participation in wildlife rehab can have an element of contagion. As individuals learn of the availability of rehab and decide to bring in injured animals, they model behavior and attitudes toward wildlife that others may adopt. In this sense, wildlife rehab infrastructure grows into place like eBird. The success of rehab through its educational components and marketing can promote more participation in bringing animals in, and in discriminating when animals are better off left alone to recover. Gender may play an influential role in this recursiveness. Women strongly dominate fields involving animal care work (US Bureau of Labor Statistics, 2021) a pattern similarly reflected in wildlife rehabilitation (Dubois and Fraser, 2003; Englefield et al., 2019).
These findings illustrate how urban habitats, and the birds and humans that inhabit them, are not static but dynamic and unfinished (Yaukey, 2011). Evolving relationships among humans and non-human in time and space are part of biodiversity in ways that exceed its tallying. Statistical modeling of bird species richness in which observations are relativized to be objective and equivalent can provide information about urban birds useful for understanding their population status. But it dilutes the “living with” that is also part of species richness. This living with is not only habitat, but also the habits—of when and where to go birdwatching, or where to make a nest, whether to rescue an injured bird, or landing to forage for food in an urban remediated lake—that shape what species get counted and incorporated into urban bird species richness.
Our results demonstrated how the qualitative description of the multispecies city—as with macaques in urbanizing India (Barua and Sinha, 2019) or the coyotes of Toronto (Van Patter, 2022)—can be extended with quantitative approaches involving several hundred bird species and thousands of human-bird encounters and observations. The eBird and wildlife rehab infrastructures differed in that the rehab data captured more of a mean field quality of human-bird encounters, while eBird was more discrete and defined to a site. The geocoded locations for the rehab data were where an animal was found within the more habitual daily paths of city residents. For eBird, the geocoded locations were more of a centroid for a smaller search radius or path taken by a birder. It signifies a smaller orbit of intended human activity. Along with their different phenological-temporal attributes, these two infrastructures span a continuum of potential individualized urban encounters with the non-human. Rarity was captured more readily in eBird because its users often have a central interest in cataloging all bird species. Rehab observations can be understood as to some degree incidental to the activity of interest—providing care for an encountered animal who has been injured. This distinction privileged the proportion of commonly encountered bird species in the rehab data, both because of their ubiquity but also because these species tend to be more tolerant of human presence and therefore present in spaces where they can be seen and caught.
These results conveyed how different normative positions on conservation coexist in time and space through their overlapping infrastructures (Bowker, 2000; Dearborn and Kark, 2010; Egerer and Buchholz, 2021; Yanco et al., 2019). Rather than oppositional, traditional conservation values can be threaded through wildlife rehabilitation in complex ways (Luther, 2018). Proponents of “compassionate” conservation call for stronger consideration of the welfare of the individual animal (Aitken, 2004; Ramp and Bekoff, 2015; Wallach et al., 2018, 2020); including a reevaluation of conservation’s traditional emphases on protecting only native species compositions in a time of rapid ecological change (Hobbs et al., 2009; Robbins, 2014). While the influence of “life-listers” on eBird data privileges recording of rare species and estimates of population abundance, rarity should not be the only quality that shapes what kinds of animals are valued in cities. Common species were more dominant in the rehab data. By virtue of their numbers and biomass, common species can have a disproportionately large effect on ecosystem properties. Their decline can have effects on ecological and cultural processes and services (Baker et al., 2019; Gaston and Fuller, 2008; Rosenberg et al., 2019). For most of us, common species come to define the relationships we have with the non-human, a fact that has compelled a call for conservation to recognize the affective value that common species have for conservation at large (Burton, 2023; Dunn et al., 2006).
The enfoldings of concepts and techniques from across geography undertaken in this article are needed at a time when affective and environmental climates are challenging conservation to stretch its conceptual borders. New infrastructures are emerging that express new value dimensions. As one example, there are now several citizen science bird counting initiatives that are driven by encounters with injured birds—the Fatal Light Awareness Program in Toronto is one such program—suggesting a complex blending of care for individual injured animals and mapping aggregate impacts of those injuries on populations at risk.
Conclusions
Our aim was to bring together while still holding apart the border between species richness as a quantitative, objective cartographic measure of its distribution in time and space—and as a qualitative, ethnographic foundation that reflects more of the dimensions of “living with” (Turnhout et al., 2013). A comparison of the infrastructural attributes of eBird and wildlife rehabilitation data allowed us to show how a range of material, affective, and behavioral properties—among birds as well as humans—contribute to urban avian species richness. Our infrastructural approach made explicit an often unstated tenet of conservation: what we value—or choose not to value—are not organisms, but the many kinds of relationships that can form with them (Luther, 2018).
Since any approach to understanding biodiversity emerges out of a sociocultural system (Manfredo et al., 2020), one can consider the subjectivities of citizen-science like eBird or wildlife rehabilitation as an asset, a source of useful socioecological and ethnographic information, rather than a weakness. The patterns of avian richness embedded in the eBird infrastructure emerged out of the co-evolution of Tallahassee’s urban development, stormwater planning, birders, and the layover of migratory birds. The patterns also reflect the affective motivations of birders as well as the behaviors of birds. The rehab data gave more detail to how a network of organizations, institutions, and individual residents similarly produce their own emergent patterns of urban avian species richness. Like eBird, the operation of infrastructure to receive and rehabilitate injured birds arises through material and affective multispecies relations that grow, acquire degrees of persistence, and evolve over time. In sum, our infrastructural approach allowed for more parity in accounting for the varied ways in which observations of birds arise from human encounters with them. Given the dynamic hybridity of urban areas, with their interpellation of anthropogenic and non-human processes and entities, what counts as species richness can be viewed as something always coming into existence through relational processes rather than a simple filling in of the urban and suburban with nature (Kinnunen et al., 2022).
In this way, infrastructure provides lines of guidance for forms of negotiation with the non-human (Alam and Houston, 2020). It offers a basis for the design of biodiverse “multinatural” cities and populated areas that anticipate, track, and respond to the varied desires and needs of its human and non-human residents (Apfelbeck et al., 2020; Barua and Sinha, 2019, 2022; Houston et al., 2018; Lorimer, 2012). Its traces in data can inform institutional changes to support our connections to the more-than-human world (Luther, 2020). Along these lines, the enhancement of stormwater retention wetland habitat for birds in Tallahassee could be viewed as being initiated solely by humans and their planning processes. Or, as we support, birds have also been enrolled in this effort in the way that other urban animals have been similarly drawn into municipal design (Barua and Sinha, 2022; Campbell, 2007). The infrastructures of eBird and rehab can be thought of as “new organizations of life that address earlier failures” (Berlant, 2016: 393). Industrial zones and lower-income neighborhoods to the south of Tallahassee have seen the revitalization of public space to manage urban runoff evolve into popular birding sites. The roads, homes, and buildings that open up and destroy habitat in Tallahassee can also be sites of compassion for the non-human, a creative practicality.
However, such an “. . . extension of relations in a certain direction cannot be conflated with the repair of what wasn’t working” (Berlant, 2016: 393). Infrastructures like eBird or wildlife rehab do not neutralize the problems that generated the need for them. Birding operates out of recognition of rarity and absences. Rehab emerges out of the direct harm of human activity. The ongoing net reduction in bird habitat globally merits more than compassion. Gamification in eBird could ultimately contribute to neighborhood change around birding hotspots that could diminish avian presences as well as reinforce human racial and class segregation. Political ecology has never lacked for radical calls to remake the city in a more equitable terms. Yet short of starting cities over, infrastructural approaches may be the more feasible relational framework to initiate experimentation and conciliatory movements toward more convivial multispecies cities (Boyce et al., 2022; Hinchliffe and Whatmore, 2008; Howe et al., 2016; Wolch, 2002). They balance the zeal for novel futures with reconsideration of the autonomy of animals within their more recent and diverse human entanglements (Collard et al., 2015).
Footnotes
Acknowledgements
J.A.S. wishes to recognize the kind and patient assistance of the St Francis Wildlife Rehabilitation Association, and especially the help provided by Ann Lewis and the late Teresa Stevenson.
Declaration of conflicting interests
The author(s) declared no potential conflicts of interest with respect to the research, authorship, and/or publication of this article.
Funding
The author(s) received no financial support for the research, authorship, and/or publication of this article.